Data Analysis Icon

Key Objectives To Initiate Supplier Relationship Management Effective Vendor Management For Enhancing Brochure PDF
The following slide showcases impact analysis of vendors performance improvement. It provides information about delivery, efficient production process, flexibility, quality of products, integration with information systems, etc. The Key Objectives To Initiate Supplier Relationship Management Effective Vendor Management For Enhancing Brochure PDF is a compilation of the most recent design trends as a series of slides. It is suitable for any subject or industry presentation, containing attractive visuals and photo spots for businesses to clearly express their messages. This template contains a variety of slides for the user to input data, such as structures to contrast two elements, bullet points, and slides for written information. Slidegeeks is prepared to create an impression.

Three Year Stats For Different Phases Of Recruitment Information PDF
This slide covers the stages of the recruitment that took place while selecting or doing the related tasks of choosing suitable candidates. It shows the comparison analysis of last three years of each stage of the process. Persuade your audience using this Three Year Stats For Different Phases Of Recruitment Information PDF. This PPT design covers one stages, thus making it a great tool to use. It also caters to a variety of topics including Three Year Stats For Different Phases Of Recruitment. Download this PPT design now to present a convincing pitch that not only emphasizes the topic but also showcases your presentation skills.

Cohort Assessment Metrics For Customer Retention Inspiration PDF
The following slide outlines metrics for cohort analysis aimed at helping businesses build customer relationships and loyalty by analysing actual behavioural data. It covers customer retention rate, churn rate, net incremental revenue, repeat purchase ratio and customer lifetime value. Presenting Cohort Assessment Metrics For Customer Retention Inspiration PDF to dispense important information. This template comprises five stages. It also presents valuable insights into the topics including Churn Rate, Customer Retention Rate, Net Incremental Revenue. This is a completely customizable PowerPoint theme that can be put to use immediately. So, download it and address the topic impactfully.

Heatmap Chart With Months And Years Labels Ppt PowerPoint Presentation Ideas Tips
Presenting this set of slides with name heatmap chart with months and years labels ppt powerpoint presentation ideas tips. The topics discussed in these slides are heat map, data analytics, business quarterly. This is a completely editable PowerPoint presentation and is available for immediate download. Download now and impress your audience.
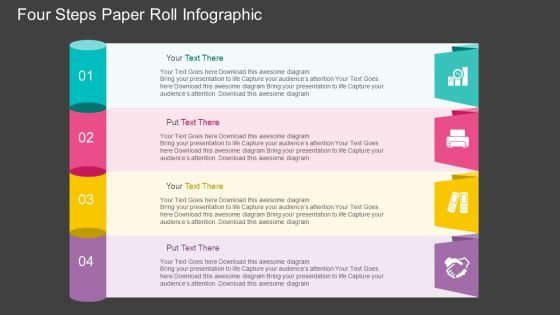
Four Steps Paper Roll Infographic PowerPoint Template
Struggling with giving information about the departments of the organization? Why not make it simple? Above is the creatively designed PowerPoint slide which will help you to overcome this problem. This PPT template has four colored banners in which you can put your text about the different departments prevalent in an organization or a company. Other than this, this slide can also be used as to tell your colleagues about the steps of a process carried out by your business firm. You can also include your data in the text boxes which are linked with each other. This multipurpose presentation template is completely customizable. You can change the color, text and icon of your choice. Include this slide in your presentation and make your audience understand your points visually.

Customer Relationship Management Dashboard Digital Marketing Integration In CRM Diagrams PDF
Deliver and pitch your topic in the best possible manner with this customer relationship management dashboard digital marketing integration in crm diagrams pdf. Use them to share invaluable insights on personalized and predictive recommendations, guided selling, customer and product data and impress your audience. This template can be altered and modified as per your expectations. So, grab it now.

Pie Charts For Portfolio Review Powerpoint Shapes
This is a pie charts for portfolio review powerpoint shapes. This is a two stage process. The stages in this process are new portfolio, current portfolio, data analysis, shy short term treasuries, tip inflation protected bonds, stocks, shv cash equivalent, vtip short term inflation protected bonds, agg u s high quality bonds, bandx international high quality bonds, vwob emerging markets government bonds, stocks no changes to existing tickers.
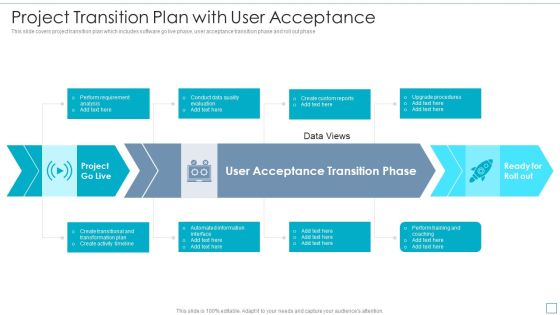
Project Transition Plan With User Acceptance Formats PDF
This slide covers project transition plan which includes software go live phase, user acceptance transition phase and roll out phase. Showcasing this set of slides titled Project Transition Plan With User Acceptance Formats PDF. The topics addressed in these templates are Perform Requirement Analysis, Conduct Data Quality Evaluation, Create Custom Reports. All the content presented in this PPT design is completely editable. Download it and make adjustments in color, background, font etc. as per your unique business setting.
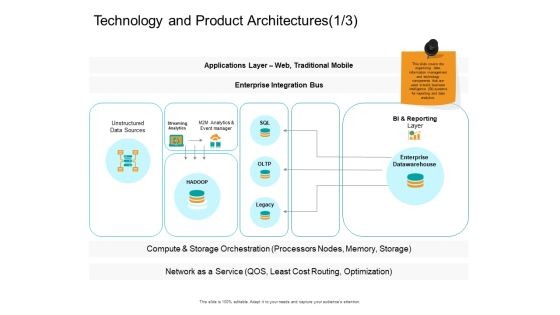
Facts Assessment Technology And Product Architectures Enterprise Themes PDF
Presenting this set of slides with name facts assessment technology and product architectures enterprise themes pdf. This is a one stage process. The stages in this process are unstructured data sources, bi and reporting, layer enterprise datawarehouse, compute and storage, optimization. This is a completely editable PowerPoint presentation and is available for immediate download. Download now and impress your audience.
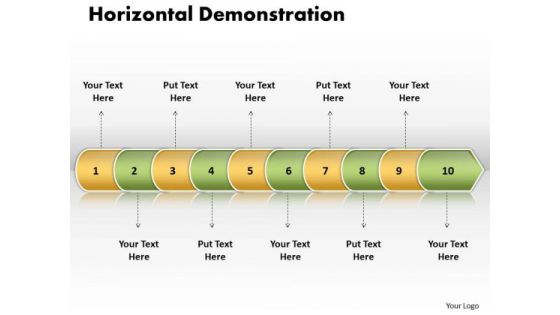
Ppt Linear Arrow 10 Phase Diagram PowerPoint Templates
PPT linear arrow 10 phase diagram PowerPoint Templates-Use this PowerPoint diagram to define basic work and data flow and quality management processes to increase efficiency of your business.-PPT linear arrow 10 phase diagram PowerPoint Templates-Arrow, Background, Collection, Completed, Concept, Confirmation, Design, Flow, Graph, Graphic, Illustration, Indication, Indicator, Information, Instruction, Interface, Internet, Layout, Measurement, Order, Phase, Pointer, Process, Progress, Reflection, Scale, Shape, Sign
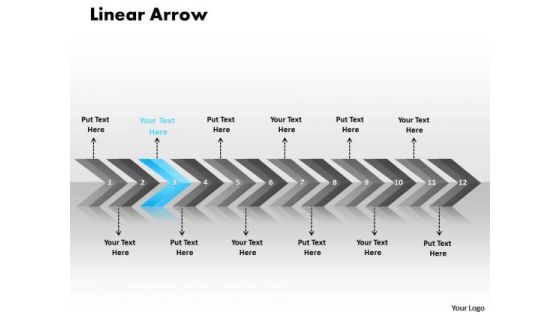
Flow Ppt Theme Linear Arrows 12 Phase Diagram Time Management PowerPoint 4 Image
flow PPT Theme linear arrows 12 phase diagram time management powerpoint 4 Image-This diagram can be used as an analysis graph designed to help you understand the cause-and-effect relationships of your key processes. It provides a specialist tool to resolve problems and define the appropriate actions for the responsible team.-flow PPT Theme linear arrows 12 phase diagram time management powerpoint 4 Image-Aim, Angle, Arrow, Arrowheads, Badge, Banner, Connection, Curve, Design, Direction, Download, Element, Fuchsia, Icon, Illustration, Indicator, Internet, Label, Link, Magenta, Mark, Marker, Next, Object, Orange, Orientation, Pointer, Shadow, Shape, Signs Symbol
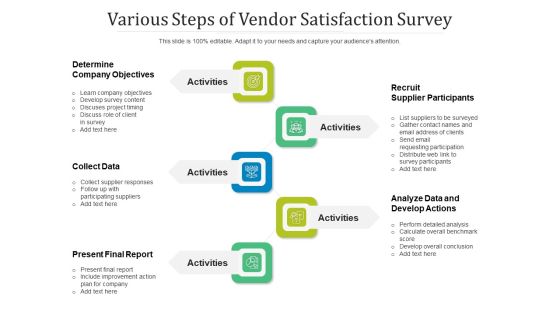
Various Steps Fof Vendor Satisfaction Survey Ppt PowerPoint Presentation Infographics Show PDF
Presenting various steps fof vendor satisfaction survey ppt powerpoint presentation infographics show pdf to dispense important information. This template comprises four stages. It also presents valuable insights into the topics including recruit supplier participants, analyze data and develop actions, determine company objectives. This is a completely customizable PowerPoint theme that can be put to use immediately. So, download it and address the topic impactfully.
Implementing Fixed Asset Management Fixed Asset Management Dashboard For Tracking Summary PDF
This slide represents fixed asset management dashboard for tracking equipment performance. It includes work management, downtime, work orders etc. Deliver and pitch your topic in the best possible manner with this Implementing Fixed Asset Management Fixed Asset Management Dashboard For Tracking Summary PDF. Use them to share invaluable insights on Data Sets, Asset Details, Labour Analysis, Purchasing Spend and impress your audience. This template can be altered and modified as per your expectations. So, grab it now.

Company Growth Strategy Ppt PowerPoint Presentation Professional Slides
This is a consumer lifecycle icon slide business ppt powerpoint presentation model. This is a three stage process. The stages in this process are finance, marketing, analysis, investment, million.

Customer Acquisition Cost Across Various Channels Ppt PowerPoint Presentation Ideas Infographics
This is a customer acquisition tools marketing ppt powerpoint presentation icon microsoft. This is a thee stage process. The stages in this process are finance, marketing, analysis, investment, million.

Market Research Databases Example Diagram Ppt Samples
This is a market research databases example diagram ppt samples. This is a four stage process. The stages in this process are survey data plus rich engagement, excellent use of emails from a database, focus groups that transcend geography, market research databases, enables repeat conversations and inquiries.

Incident Response Planning And Reporting Process Ppt PowerPoint Presentation File Format PDF
Presenting incident response planning and reporting process ppt powerpoint presentation file format pdf to dispense important information. This template comprises seven stages. It also presents valuable insights into the topics including access, service, data loss. This is a completely customizable PowerPoint theme that can be put to use immediately. So, download it and address the topic impactfully.
Google Keyword Assessment KPI Dashboard For Tracking Improvement In Website Traffic Infographics PDF
Following slide demonstrates keyword analysis dashboard which can be used by business to track website traffic performance. It includes metrics such as average keyword position, keyword ranking distribution, keyword ranking, keyword in top 3, top 10, top 20 and top 100. Showcasing this set of slides titled Google Keyword Assessment KPI Dashboard For Tracking Improvement In Website Traffic Infographics PDF. The topics addressed in these templates are Keyword Ranking, Keyword Ranking Distribution, Average Keyword Position. All the content presented in this PPT design is completely editable. Download it and make adjustments in color, background, font etc. as per your unique business setting.
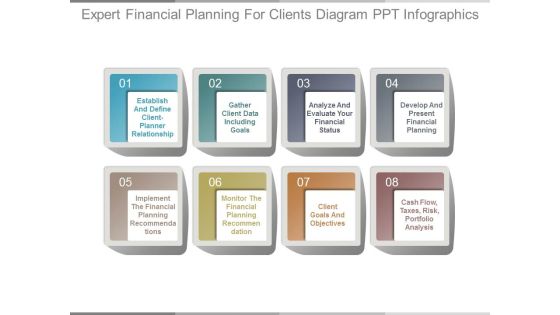
Expert Financial Planning For Clients Diagram Ppt Infographics
This is a expert financial planning for clients diagram ppt infographics. This is a ten stage process. The stages in this process are establish and define client planner relationship, gather client data including goals, analyze and evaluate your financial status, develop and present financial planning, implement the financial planning recommendations, monitor the financial planning recommendation, client goals and objectives, cash flow, taxes, risk, portfolio analysis.
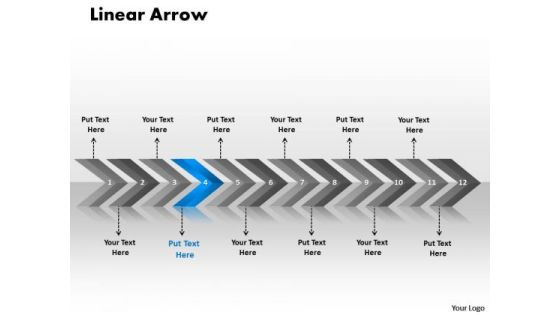
Business Ppt Linear Arrows 12 Power Point Stages Management PowerPoint 5 Image
Business PPT linear arrows 12 power point stages management powerpoint 5 Image-Use this diagram to arrange steps in such a manner that the preceding phase must be cleared before moving to next phase. Expound on better diagnostic processes for a more accurate analysis and control of the ailment to increase chances of a permanent cure.-Business PPT linear arrows 12 power point stages management powerpoint 5 Image-Aim, Angle, Arrow, Arrowheads, Badge, Banner, Connection, Curve, Design, Direction, Download, Element, Fuchsia, Icon, Illustration, Indicator, Internet, Label, Link, Magenta, Mark, Marker, Next, Object, Orange, Orientation, Pointer, Shadow, Shape, Signs Symbol

Marketing Ppt Linear Arrows 10 Stages Business Communication PowerPoint 9 Image
marketing PPT linear arrows 10 stages business communication powerpoint 9 Image-The above diagram can facilitates the process of risk identification and analysis to guarantee the achievement of organizational objectives. Give an overview of your capability and insight into the minute details of the overall picture highlighting the interdependence at every operational level.-marketing PPT linear arrows 10 stages business communication powerpoint 9 Image-Aim, Angle, Arrow, Arrowheads, Badge, Banner, Connection, Curve, Design, Direction, Download, Element, Fuchsia, Icon, Illustration, Indicator, Internet, Label, Link, Magenta, Mark, Marker, Next, Object, Orange, Orientation, Pointer, Shadow, Shape, Signs Symbol
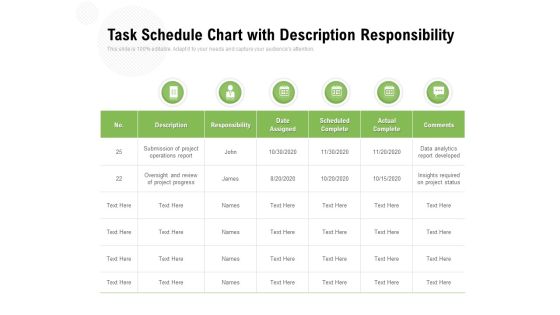
Task Schedule Chart With Description Responsibility Ppt PowerPoint Presentation Summary Professional
Presenting this set of slides with name task schedule chart with description responsibility ppt powerpoint presentation summary professional. The topics discussed in these slides are project operations report, data analytics report developed, project status, insights required, project progress. This is a completely editable PowerPoint presentation and is available for immediate download. Download now and impress your audience.
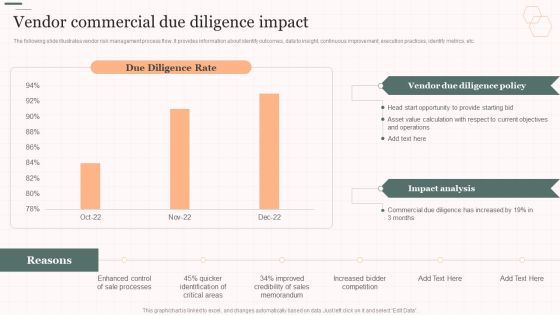
Vendor Commercial Due Diligence Impact Vendor Management Strategies Background PDF
The following slide illustrates vendor risk management process flow. It provides information about identify outcomes, data to insight, continuous improvement, execution practices, identify metrics, etc. Deliver and pitch your topic in the best possible manner with this Vendor Commercial Due Diligence Impact Vendor Management Strategies Background PDF. Use them to share invaluable insights on Diligence Policy, Impact Analysis, Commercial Diligence and impress your audience. This template can be altered and modified as per your expectations. So, grab it now.

1 Various Mobile Cellular And Tablet Ipad Figure Gestures And Finger Motions Ppt Slide
This image slide displays icons with tablet and smartphone. This image slide has been designed with graphic of hands on smartphone and tablet icons. You may change color, size and orientation of any icon to your liking. Use this image slide, in your presentations to express views on communication, wireless networking, mobile devices usage and technology. This image slide will enhance the quality of your presentations.

Evolving Strategy For Financial Partnership Company Rules PDF
This slide depicts evolving strategy for financial institute illustrating reporter, controller, analyzer, influencer and strategic partner to create real value and financial planning.Presenting Evolving Strategy For Financial Partnership Company Rules PDF to dispense important information. This template comprises five stages. It also presents valuable insights into the topics including Historical Analysis, Reporting For Data Interpretation, Forecasting For Budget Preparation This is a completely customizable PowerPoint theme that can be put to use immediately. So, download it and address the topic impactfully.
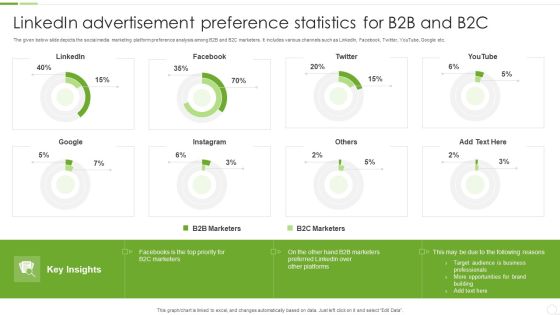
Linkedin Advertisement Preference Statistics For B2B And B2C Ppt Visual Aids Professional PDF
The given below slide depicts the social media marketing platform preference analysis among B2B and B2C marketers. It includes various channels such as LinkedIn, Facebook, Twitter, YouTube, Google etc. Pitch your topic with ease and precision using this Linkedin Advertisement Preference Statistics For B2B And B2C Ppt Visual Aids Professional PDF. This layout presents information on B2B Marketers, B2C Marketers, Target Audience. It is also available for immediate download and adjustment. So, changes can be made in the color, design, graphics or any other component to create a unique layout.
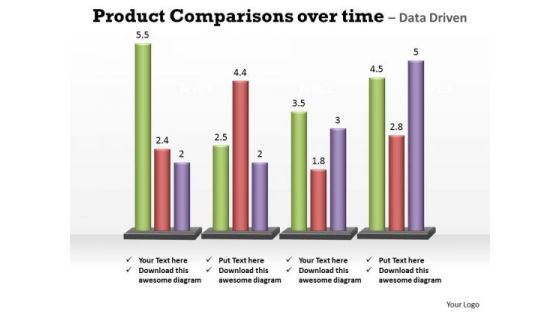
Business Marketing PowerPoint Templates Business Product Comparisons Over Time Ppt Slides
Business Marketing PowerPoint Templates Business product comparisons over time PPT Slides--This chart is useful for showing data changes over a period of time or for illustrating comparisons among items. -Business Marketing PowerPoint Templates Business product comparison over time PPT Slides-This ppt can be used for concepts relating to-chart,, graph, growth, investment, , market, percentage, , presentation report, results, statistics, stock, success and business.
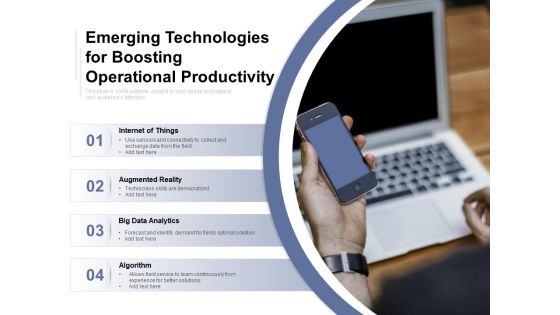
Emerging Technologies For Boosting Operational Productivity Ppt PowerPoint Presentation Diagram Lists PDF
Presenting this set of slides with name emerging technologies for boosting operational productivity ppt powerpoint presentation diagram lists pdf. This is a four stage process. The stages in this process are internet of things, augmented reality, big data analytics, algorithm. This is a completely editable PowerPoint presentation and is available for immediate download. Download now and impress your audience.

Business Diagram Application Database Network Email File Print Services Virtualized Ppt Slide
This technology diagram has been designed with graphic of servers and computers. This slide depicts concept of data base networking and email connectivity. This diagram slide can be used for representing virtualization techniques of database connectivity and email file print service.
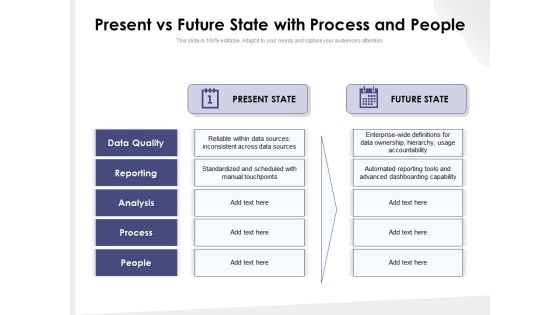
Present Vs Future State With Process And People Ppt PowerPoint Presentation Model Show PDF
Presenting present vs future state with process and people ppt powerpoint presentation model show pdf to dispense important information. This template comprises two stages. It also presents valuable insights into the topics including present state, future state, data quality, reporting, analysis, process, people. This is a completely customizable PowerPoint theme that can be put to use immediately. So, download it and address the topic impactfully.

PowerPoint Themes Comb Process Success Ppt Slides
PowerPoint Themes Comb Process Success PPT Slides-Circular diagram applications include context diagrams, diagrams for mind mapping, audit flow diagram, circular process flow diagrams, data flow diagrams and more. This PowerPoint Diagram will let you explain the combo Process which will lead to Success. -PowerPoint Themes Comb Process Success PPT Slides

Smart Metering Management Diagram Good Ppt Example
This is a smart metering management diagram good ppt example. This is a eight stage process. The stages in this process are reporting, customer information system, billing system, asset management, network information system, security manager, dc persistency, monitoring and control, meter data management.

Cyber Security Implementation Framework Present Concerns Impeding Cybersecurity Clipart PDF
Presenting this set of slides with name cyber security implementation framework present concerns impeding cybersecurity clipart pdf. The topics discussed in these slides are data breaches and records exposed, reported financial losses due to increase cybercrimes, financial losses, cybercrimes incidents. This is a completely editable PowerPoint presentation and is available for immediate download. Download now and impress your audience.

IT Servers Quality Control Dashboard With Recovery Testing Status Introduction PDF
Showcasing this set of slides titled IT Servers Quality Control Dashboard With Recovery Testing Status Introduction PDF. The topics addressed in these templates are Data Sources, Recovery Testing, System State. All the content presented in this PPT design is completely editable. Download it and make adjustments in color, background, font etc. as per your unique business setting.

Customer Acquisition Campaign Diagram Powerpoint Slide Information
This is a customer acquisition campaign diagram powerpoint slide information. This is a seven stage process. The stages in this process are brand awareness email campaigns, demand generation, sales data and analytics, sales process, sales and marketing target strategy, products and services, business goals and initiatives, customer acquisition.

Magnifier With Four Options Tags Powerpoint Slides
The Magnifying glass used in this PowerPoint template can be used for various purposes. This slide can be the perfect answer to business or organizations dealing with investigation or rendering their services as a private detective or other investigation services. The slide can be effectively used to send across a message about verification or double checking of any kind of information. It can be used to imply in depth analysis of a report or minute details about meetings. The colorful tags can further be used to present the results or comparisons between available options or variants of products or services. The slide is customizable and icons and colors can be changed as per needs and convenience.

1 Desktop Tower Server And Database By The Side Showing Compute And Storage Ppt Slides
This Powerpoint image slide has been designed to explain the concept of database connectivity and data storage. To display these concepts we have used graphic of server with database. Explain cloud computing with this innovative PPT slide. Build a strong presentation for cloud computing technology using this image slide.
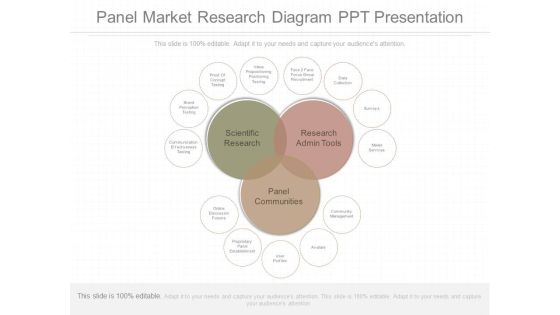
Panel Market Research Diagram Ppt Presentation
This is a panel market research diagram ppt presentation. This is a three stage process. The stages in this process are scientific research, research admin tools, panel communities, online discussion forums, proprietary panel establishment, user profiles, avatars, community management, communication effectiveness testing, brand perception testing, proof of concept testing, value propositioning positioning testing, face two face focus group recruitment, data collection, surveys, mailer services.

Effective Go To Market Channel Pan Ppt PowerPoint Presentation Portfolio Outline PDF
Presenting effective go to market channel pan ppt powerpoint presentation portfolio outline pdf. to dispense important information. This template comprises five stages. It also presents valuable insights into the topics including channel identification, market and data analysis, trade interviews, strategy development, professional, analyse. This is a completely customizable PowerPoint theme that can be put to use immediately. So, download it and address the topic impactfully.
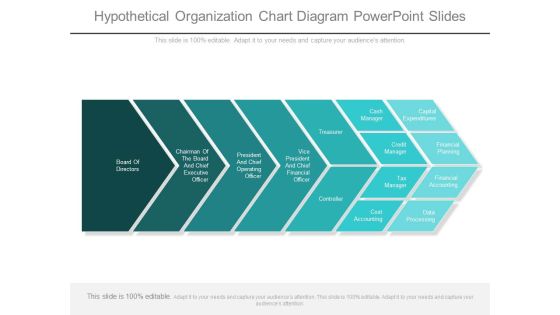
Hypothetical Organization Chart Diagram Powerpoint Slides
This is a hypothetical organization chart diagram powerpoint slides. This is a seven stage process. The stages in this process are board of directors, chairman of the board and chief executive officer, president and chief operating officer, vice president and chief financial officer, treasurer, controller, cash manager, capital expenditures, credit manager, financial planning, tax manager, financial accounting, cost accounting, data processing.

Evolving BI Infrastructure Addressing Cyber Risk Management Dashboard Background PDF
This slide portrays information regarding the dashboard that firm will use to manage cyber risks. The dashboard will provide clear picture of risk prevailing and how they are treated to technical engineers and board level executives. Deliver an awe inspiring pitch with this creative evolving bi infrastructure addressing cyber risk management dashboard background pdf bundle. Topics like risk rating breakdown, risk heat map, action plan breakdown, risk analysis progress can be discussed with this completely editable template. It is available for immediate download depending on the needs and requirements of the user.

Intelligent Infrastructure Addressing Cyber Risk Management Dashboard Formats PDF
This slide portrays information regarding the dashboard that firm will use to manage cyber risks. The dashboard will provide clear picture of risk prevailing and how they are treated to technical engineers and board level executives. Deliver and pitch your topic in the best possible manner with this Intelligent Infrastructure Addressing Cyber Risk Management Dashboard Formats PDF. Use them to share invaluable insights on Risk Analysis Progress, Risk Rating Breakdown, Risk Heat Map, Action Plan Breakdown and impress your audience. This template can be altered and modified as per your expectations. So, grab it now.

Process Of B2b Integration Framework Diagram Ppt Examples
This is a process of b2b integration framework diagram ppt examples. This is a ten stage process. The stages in this process are content development, customer development, technologies and tools, network community development, reusable industry content, implementation methodology, data transformation accelerators, enterprise email framework, enterprise logger, custom program.

Favor Transfer Process Model Powerpoint Diagram Download
This is a favor transfer process model powerpoint diagram download. This is a eight stage process. The stages in this process are good fit, data reporting, setting and patients, efficient care coordination, research and monitoring, coordinating capacity, coordination needs, case review and community.
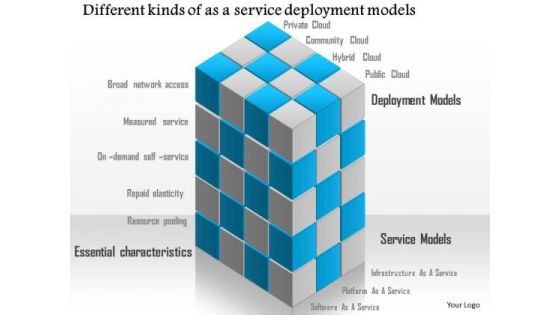
Business Diagram Different Kinds Of As A Service Deployment Models Ppt Slide
Blue colored text of big data has been used to design this technology diagram. This slide depicts the concept of different kinds of service deployment. To show the deployment we have used model made with cubical structure. Use this diagram for technical presentation and to build quality presentation for your viewers.

Information Management Framework For Achieving Business Goals Brochure PDF
Presenting Information Management Framework For Achieving Business Goals Brochure PDF to dispense important information. This template comprises six stages. It also presents valuable insights into the topics including Data Management Skills, Business Capabilities, Business Value. This is a completely customizable PowerPoint theme that can be put to use immediately. So, download it and address the topic impactfully.

Design And Consulting Process Diagram Powerpoint Slide Deck
This is a design and consulting process diagram powerpoint slide deck. This is a three stage process. The stages in this process are workflow, wireframes, technical design, visual design, discovery, planning, development, project brief, user profiles, asset inventory, technical specifications, implement, integration, data entry, quality assurance.
Devops Continuous Workflow Tracking Dashboard Slides PDF
This slide provides the glimpse of facts and figures related to continuous monitoring of project with DevOps. It includes planned vs. completed work items, work item priority wise, active bugs severity wise, etc. Showcasing this set of slides titled Devops Continuous Workflow Tracking Dashboard Slides PDF. The topics addressed in these templates are Continuous Workflow, Tracking Dashboard, Sprint Analysis By Assignee. All the content presented in this PPT design is completely editable. Download it and make adjustments in color, background, font etc. as per your unique business setting.
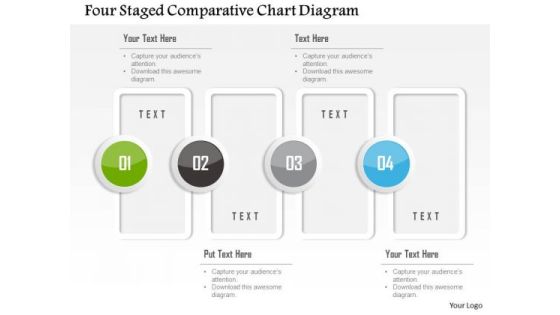
Business Diagram Four Staged Comparative Chart Diagram Presentation Template
This business diagram has been designed with four staged comparative chart. This slide suitable for data representation. You can also use this slide to present four steps of any business process. Use this diagram to present your views in a wonderful manner.

Business Diagram Six Staged Comparative Chart Diagram Presentation Template
This business diagram has been designed with six staged comparative chart. This slide suitable for data representation. You can also use this slide to present four steps of any business process. Use this diagram to present your views in a wonderful manner.

Customer Retention Strategy With Customer Experience Management Cem Presentation Diagrams
This is a customer retention strategy with customer experience management cem presentation diagrams. This is a eight stage process. The stages in this process are billing, customer touch points, network, crm, tariffs and pricing, segment mgt, social media, big data analytics.

Information Technology Capability Assessment Techniques Slides PDF
The following slide showcases the IT capability analysis methodology framework to understand current status and assess gap. It constitutes of four major stages such as development stage, resource management, advantages to customer, operational advantage etc. Presenting Information Technology Capability Assessment Techniques Slides PDF to dispense important information. This template comprises three stages. It also presents valuable insights into the topics including Resource Management, Advantage To Customers, Operational Advantage. This is a completely customizable PowerPoint theme that can be put to use immediately. So, download it and address the topic impactfully.
Tracking And Assessment Framework For Business Operations Themes PDF
Presenting Tracking And Assessment Framework For Business Operations Themes PDF to dispense important information. This template comprises Four stages. It also presents valuable insights into the topics including Indicator Domains, Data Source, Business Operations. This is a completely customizable PowerPoint theme that can be put to use immediately. So, download it and address the topic impactfully.

Actions In Flow Diagram 5 Stages Business Circular Layout Network PowerPoint Templates
We present our actions in flow diagram 5 stages business Circular Layout Network PowerPoint templates.Use our Ring Charts PowerPoint Templates because they are Designed to attract the attention of your audience. Download our Business PowerPoint Templates because the fruits of your labour are beginning to show.Enlighten them on the great plans you have for their enjoyment. Present our Future PowerPoint Templates because let this slide illustrates others piggyback on you to see well over the horizon. Present our Process and Flows PowerPoint Templates because with the help of our Slides you can Illustrate your plans to your listeners with the same accuracy. Use our Marketing PowerPoint Templates because The marketplace is the merger of your dreams and your ability. Use these PowerPoint slides for presentations relating to Abstract, action, analysis, blank,business, chart, clipart, commerce,concept, conceptual, design, diagram,direction, flow, generic, goals, guide,guidelines, heirarchy, icon, idea,illustration, lingakes, links, manage,management, mba, model, organization,performance, plan, process, project,representation, resource,steps, strategy, success. The prominent colors used in the PowerPoint template are Black, Yellow, Gray. You can be sure our actions in flow diagram 5 stages business Circular Layout Network PowerPoint templates are effectively colour coded to prioritise your plans They automatically highlight the sequence of events you desire. Professionals tell us our analysis PowerPoint templates and PPT Slides are Versatile. PowerPoint presentation experts tell us our actions in flow diagram 5 stages business Circular Layout Network PowerPoint templates help you meet deadlines which are an element of today's workplace. Just browse and pick the slides that appeal to your intuitive senses. You can be sure our clipart PowerPoint templates and PPT Slides are Magnificent. You can be sure our actions in flow diagram 5 stages business Circular Layout Network PowerPoint templates are Nostalgic. The feedback we get is that our analysis PowerPoint templates and PPT Slides are Magical.
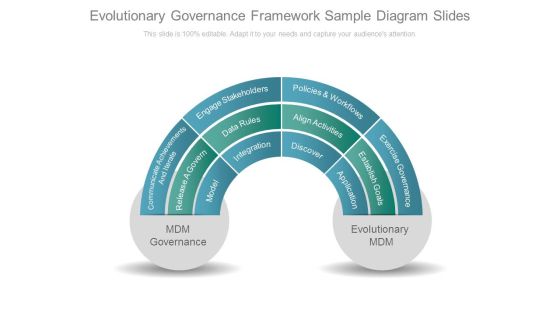
Evolutionary Governance Framework Sample Diagram Slides
This is a evolutionary governance framework sample diagram slides. This is a four stage process. The stages in this process are mdm governance, communicate achievements and iterate, model, release a govern, engage stakeholders, data rules, integration, policies and workflows, align activities, discover, exercise governance, establish goals, application, evolutionary mdm.
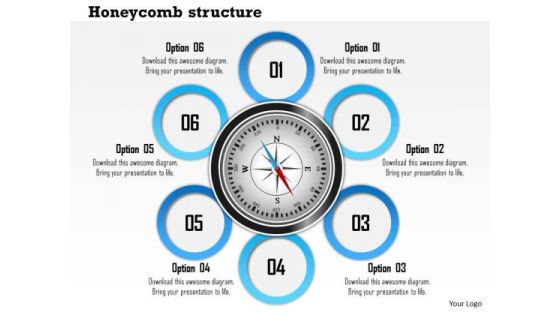
Business Diagram Six Staged Honey Comb Structure Diagram Presentation Template
This Power Point template slide has been designed with graphic of 3d compass and six text circles around it. Display any six levels of data with this exclusive diagram and get good remarks. Give professional appearance to your presentations using this business slide.
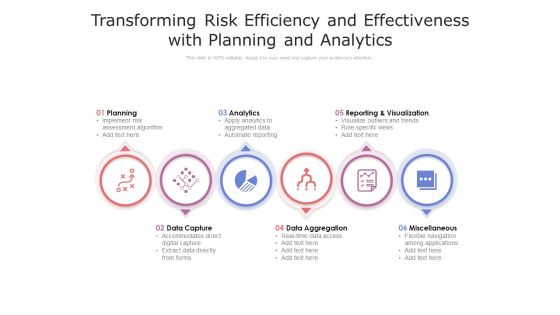
Transforming Risk Efficiency And Effectiveness With Planning And Analytics Ppt PowerPoint Presentation Gallery Themes PDF
Presenting this set of slides with name transforming risk efficiency and effectiveness with planning and analytics ppt powerpoint presentation gallery themes pdf. This is a six stage process. The stages in this process are planning, data aggregation, miscellaneous. This is a completely editable PowerPoint presentation and is available for immediate download. Download now and impress your audience.
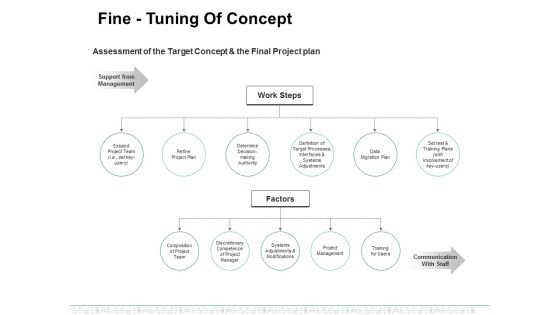
Fine Tuning Of Concept Ppt PowerPoint Presentation File Graphics Template
This is a fine tuning of concept ppt powerpoint presentation file graphics template. This is a two stage process. The stages in this process are refine project plan, data migration plan, training for users, project management, composition of project team, systems adjustments and modifications.

Three Phase Workflow Of Situation Monitoring Ppt PowerPoint Presentation Outline Design Inspiration PDF
Presenting this set of slides with name three phase workflow of situation monitoring ppt powerpoint presentation outline design inspiration pdf. This is a three stage process. The stages in this process are data capture, awareness perception, comprehension awareness, heuristics definition, analyzing application, determining problems. This is a completely editable PowerPoint presentation and is available for immediate download. Download now and impress your audience.

Computer Security Incident Handling Present Concerns Impeding Cybersecurity Formats PDF
Presenting this set of slides with name computer security incident handling present concerns impeding cybersecurity formats pdf. The topics discussed in these slides are reported financial losses due to increase in cybercrimes, data branches and records exposed. This is a completely editable PowerPoint presentation and is available for immediate download. Download now and impress your audience.


 Continue with Email

 Home
Home


