Data Analysis Icon
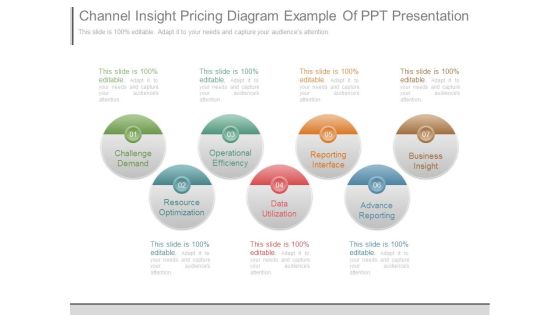
Channel Insight Pricing Diagram Example Of Ppt Presentation
This is a channel insight pricing diagram example of ppt presentation. This is a seven stage process. The stages in this process are challenge demand, operational efficiency, reporting interface, business insight, resource optimization, data utilization, advance reporting.
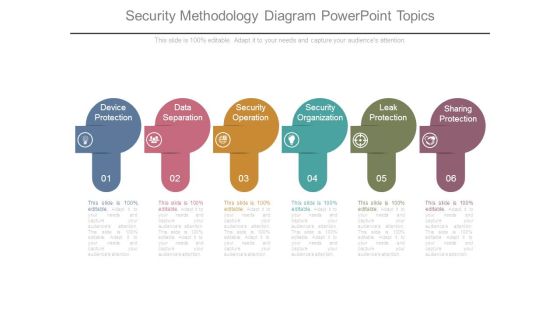
Security Methodology Diagram Powerpoint Topics
This is a security methodology diagram powerpoint topics. This is a six stage process. The stages in this process are device protection, data separation, security operation, security organization, leak protection, sharing protection.

Marketing Information System Example Ppt Slide Themes
This is a marketing information system example ppt slide themes. This is a six stage process. The stages in this process are government resources, customers, sales force, marketing research, data analytics, interactive marketing.

Financial Enterprise Technology Solutions Framework Diagrams PDF
This slide represents financial enterprise technology framework such as enterprise calculation engine, modeling, reporting, smart data integration etc that helps business in decision making. Showcasing this set of slides titled Financial Enterprise Technology Solutions Framework Diagrams PDF. The topics addressed in these templates are Business Apps, Platform Tools, Data Sources. All the content presented in this PPT design is completely editable. Download it and make adjustments in color, background, font etc. as per your unique business setting.

Datafy Phases Of Datafication As A Use Perspective Ideas PDF
This slide represents the phases of datafication from a use perspective and the stages include domain, data generation, analyzing data and generating output, and data-driven interventions. Each phase includes four steps, such as step counter, webshop, Schiphol-asito, and predictive policing. The Datafy Phases Of Datafication As A Use Perspective Ideas PDF is a compilation of the most recent design trends as a series of slides. It is suitable for any subject or industry presentation, containing attractive visuals and photo spots for businesses to clearly express their messages. This template contains a variety of slides for the user to input data, such as structures to contrast two elements, bullet points, and slides for written information. Slidegeeks is prepared to create an impression.

Investment Research Example Diagram Ppt Example File
This is a investment research example diagram ppt example file. This is a four stage process. The stages in this process are research reports, data and pricing, education, investment tools.

1 Public Or Private Cloud Surrounded By Devices Iphone Laptop Tablet Storage Servers Ppt Slides
This diagram displays graphics of public or private cloud surrounded by devices I-phone laptop tablet storage servers. Use this diagram to depict concepts of data storage, technology and communication. Grab the attention of your team with this eye catching diagram.

Business Diagram Pie Chart With Key Performance Indicator Presentation Template
This power point template slide has been crafted with graphic of pie chart and magnifier. This PPT contains the concept of performance indication. Use this PPT for data technology and business related presentations.

Analytics Solutions Diagram Sample Of Ppt Presentation
This is a analytics solutions diagram sample of ppt presentation. This is a four stage process. The stages in this process are analytic applications, analytics, data sources, business intelligence.
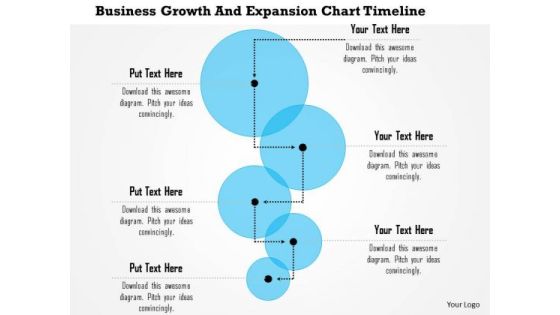
Business Framework Business Growth And Expansion Chart Timeline PowerPoint Presentation
Six staged process flow linear diagram is used to design this Power Point template. This PPT slide contains the concept of data and process flow. This exclusive PPT can be used for linear process flow representation in any presentation.
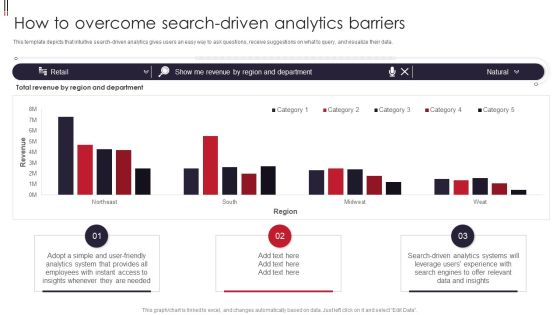
Information Visualizations Playbook How To Overcome Search Driven Analytics Barriers Guidelines PDF
This template depicts that intuitive search-driven analytics gives users an easy way to ask questions, receive suggestions on what to query, and visualize their data. Deliver an awe inspiring pitch with this creative Information Visualizations Playbook How To Overcome Search Driven Analytics Barriers Guidelines PDF bundle. Topics like Analytics System, Data And Insights, Search Driven Analytics can be discussed with this completely editable template. It is available for immediate download depending on the needs and requirements of the user.
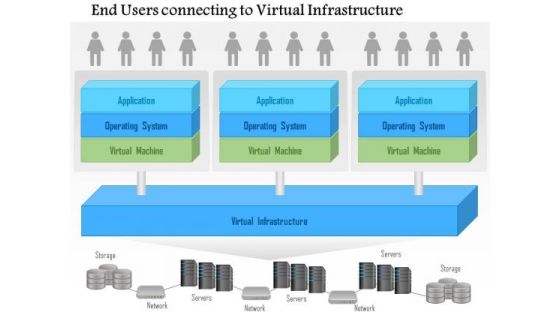
Business Diagram End Users Connecting To A Virtual Infrastructure Ppt Slide
This PowerPoint template has been designed with graphic of computer network. This slide depicts concept of end user connectivity and virtual infrastructure. This diagram is suitable to represent data and cloud structure related topics.
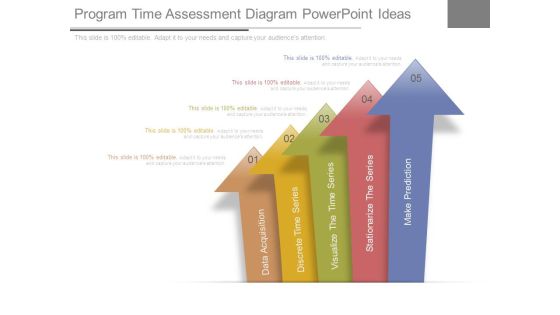
Program Time Assessment Diagram Powerpoint Ideas
This is a program time assessment diagram powerpoint ideas. This is a five stage process. The stages in this process are data acquisition, discrete time series, visualize the time series, stationarize the series, make prediction.

Database Layout Tool Diagram Presentation Visuals
This is a database layout tool diagram presentation visuals. This is a three stage process. The stages in this process are database concepts, data modeling, database layout tool, database design.\n\n\n\n

Email Marketing Guide Chart Presentation Diagrams
This is a email marketing guide chart presentation diagrams. This is a eight stage process. The stages in this process are automated actions, return on investment, maximum response, consolation, data collection, delivery optimization, list building, contact development, email marketing.
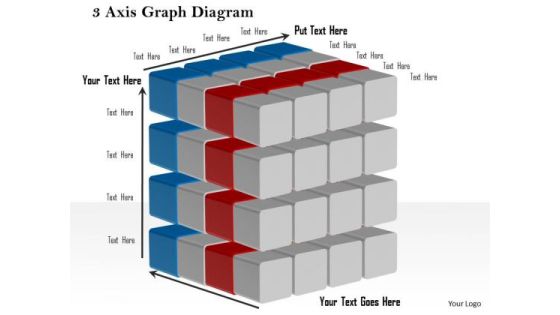
Business Framework 3 Axis Graph Diagram PowerPoint Presentation
This business diagram displays 3 axis graphs with cubes. This editable slide contains the concept of business and success. Use this diagram in your business presentations to display data in graphical manner.
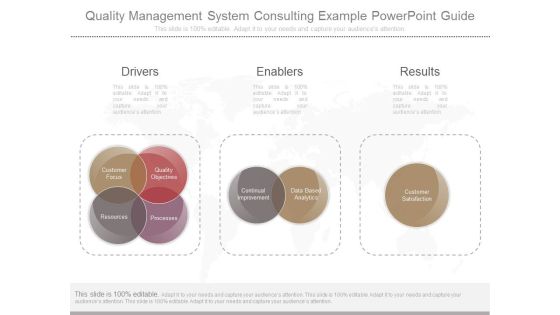
Quality Management System Consulting Example Powerpoint Guide
This is a quality management system consulting example powerpoint guide. This is a three stage process. The stages in this process are drivers, enablers, results, customer focus, quality objectives, processes, resources, continual improvement, data based analytics, customer satisfaction.
Evaluation Management Diagram Ppt Sample Download
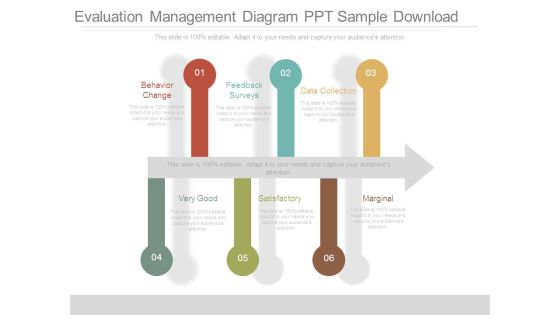
This is a evaluation management diagram ppt sample download. This is a six stage process. The stages in this process are behavior change, feedback surveys, data collection, very good, satisfactory, marginal.

Sample Of Teleselling Diagram Powerpoint Guide
This is a sample of teleselling diagram powerpoint guide. This is a six stage process. The stages in this process are lead generation, sales, appointment setting, data classing, customer surveys, event marketing.
Enterprise Architecture Framework Sample Diagram Powerpoint Layout
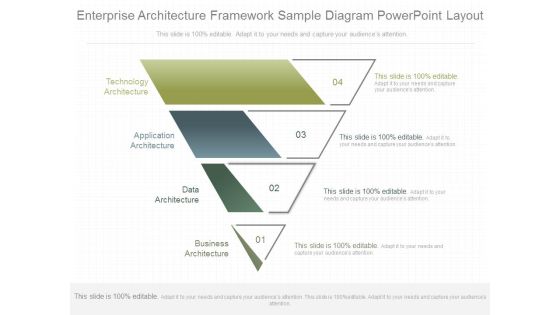
This is a enterprise architecture framework sample diagram powerpoint layout. This is a four stage process. The stages in this process are technology architecture, application architecture, data architecture, business architecture.

Infographic Diagram With Percentage Values Powerpoint Template
Visually support your presentation with our above template containing infographic diagram with percentage values. This diagram is excellent visual tools for explaining huge amounts of information where complex data needs to be explained immediately and clearly.

Business Diagram Laptop Made With Puzzle For Text Display Presentation Template
This Power Point template slide has been crafted with graphic of laptop which is made with puzzles. This PPT slide contains the concept of text representation. Use this PPT slide for business data representation.
Business Framework Implementation Map PowerPoint Presentation
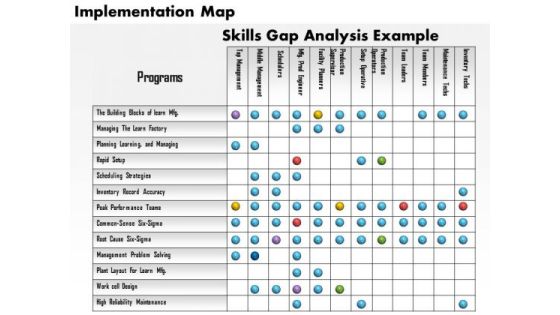
Graphic of implementation map has been used to decorate this power point diagram slide. This PPT slide contains the concept of data representation. This PPT diagram slide can be used for business and finance related presentations.

Business Diagram Four Design For Concept Coding Presentation Template
Four colorful text boxes has been used to craft this power point template. This PPT diagram contains the concept of coding and data representation. Use this PPT for business and technology related presentations.

Feedback Management Diagram Powerpoint Slide Themes
This is a feedback management diagram powerpoint slide themes. This is a seven stage process. The stages in this process are phone, ivr, web, social media, face to face, email, data base operational and customer, enterprises feedback management.

B2b Integration Examples Diagram Powerpoint Slide Themes
This is a b2b integration examples diagram powerpoint slide themes. This is a four stage process. The stages in this process are data integration, process modeling and design, governance and security, managed file transfer.
Business Diagram Circles Diagram To Explain Four Concepts Presentation Template
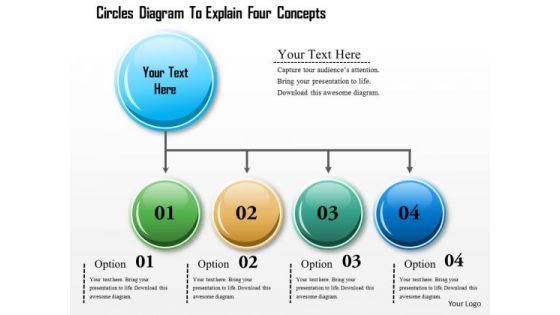
Explain the concept of data flow in any presentation with this unique PPT. This PPT contains the graphic of four staged text boxes. This PPT is suitable for business and sales presentations.
Voice Of The Customer Six Sigma Diagram Ppt Images
This is a voice of the customer six sigma diagram ppt images. This is a five stage process. The stages in this process are groups, warranty, metrics, data returns, survey, voice of customer.
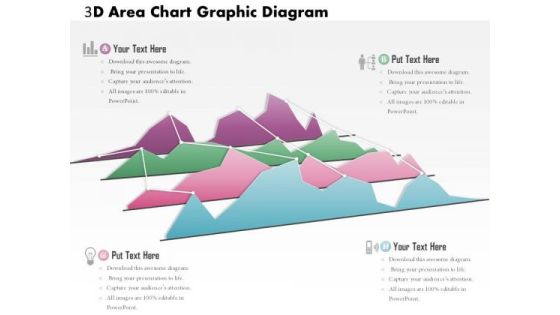
Business Diagram 3d Area Chart Graphic Diagram PowerPoint Ppt Presentation
This slide contains 3d area chart with connecting points. Different colors have been used in the areas below the lines. Use this business diagram to present your data in graphical way.

Business Diagram Five Staged Circular Process Diagram For Text Representation Presentation Template
Our above slide displays Five staged circular process diagram. Download our above diagram to express information in a visual way. Use this diagram and get good comments for data related presentations.
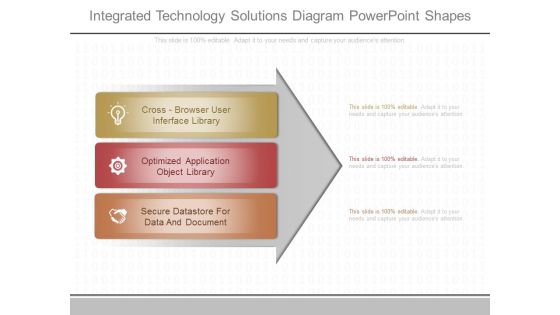
Integrated Technology Solutions Diagram Powerpoint Shapes
This is a integrated technology solutions diagram powerpoint shapes. This is a three stage process. The stages in this process are cross browser user interface library, optimized application object library, secure datastore for data and document.

It Maintenance Checklist Report With Routing Ppt PowerPoint Presentation Professional Themes PDF
Showcasing this set of slides titled it maintenance checklist report with routing ppt powerpoint presentation professional themes pdf. The topics addressed in these templates are routing and switching optimized, data center design finalized, data center troubleshooting performed, new motherboard installed. All the content presented in this PPT design is completely editable. Download it and make adjustments in color, background, font etc. as per your unique business setting.

Business Framework Battery Charge Loading Bar PowerPoint Presentation
This business diagram displays bar graph of five battery cells. This business slide contains the concept of business growth shown in multiple levels. Use this diagram to present and compare data in an impressive manner.
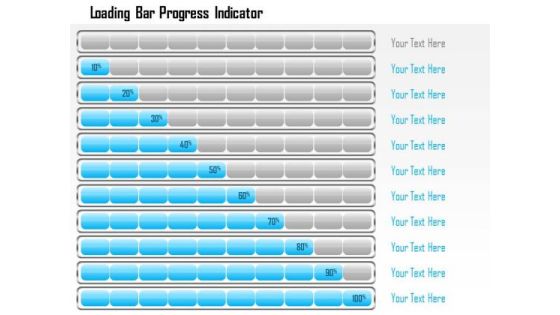
Business Framework Loading Bar Progress Indicator PowerPoint Presentation
This business diagram displays bar progress indicators. This business slide contains the concept of business growth shown in multiple levels. Use this diagram to present and compare data in an impressive manner.

Illustration Of Save Money Concept Powerpoint Templates
This business slide has been designed with infographic square. These text boxes can be used for data representation. Use this diagram for your business presentations. Build a quality presentation for your viewers with this unique diagram.
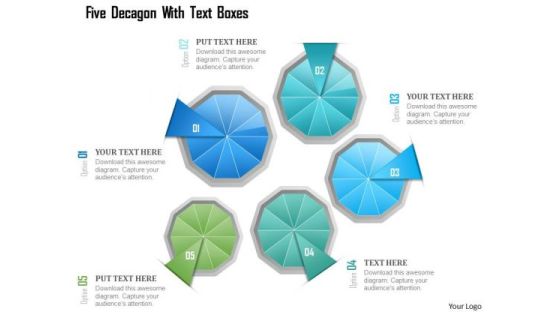
Busines Diagram Five Decagon With Text Boxes Presentation Template
This business diagram has been designed with graphic of five decagon and text boxes. This slide contains the concept of business data flow. Deliver amazing presentations to mesmerize your audience.

1 Weekly Schedule Of Tape Backup Showing Timeline Of Retention Dates And Times Ppt Slides
This Powerpoint image slide has been designed with graphic of magnetic tapes. These tapes are used to take data backups and to create records. This PPT slide may be used to display weekly schedule of tape backup with timeline representation.

Business Diagram Seven Staged Concentric Diagram For Global Agenda Presentation Template
This Power Point template slide has been designed with graphic of seven staged concentric diagram. This PPT slide contains the concept of global agenda. Use this PPT slide for business and global data related presentation.

Introduction Of Information System Diagram Powerpoint Guide
This is a introduction of information system diagram powerpoint guide. This is a six stage process. The stages in this process are executive information systems, purpose, transaction processing systems, information processes, participants, data information.

Business Diagram Geographically Distributed Public Cloud Connected To Cities Around World Map Ppt Sl
This technology diagram has been designed with graphic of world map and cloud. In this diagram, cloud is connected to the multiple cities around the world. Use this diagram slide for your data distribution related topics in any presentation.
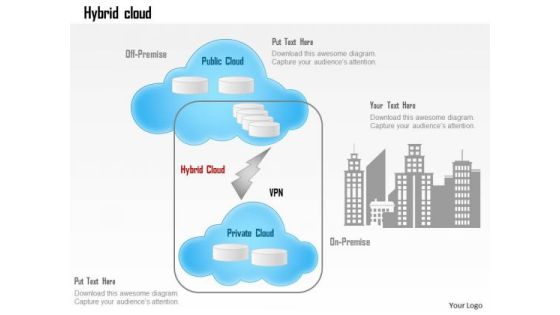
Business Diagram Hybrid Cloud Off Premise Public Cloud Office Connectivity Ppt Slide
This technology diagram slide has been designed with graphic of hybrids cloud. This diagram displays the connectivity of cloud in private and public premise. Use this graphics for your data transfer related presentations.
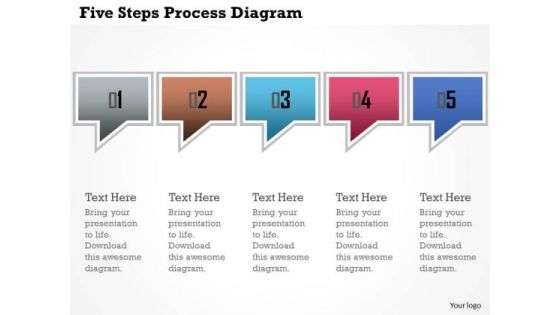
Business Diagram Five Steps Process Diagram Presentation Template
This power point template has been crafted with graphic of five dialogue boxes. This PPT contains the concept of text and data representation. Use this PPT for your business and marketing related presentations.

Arrows Infographic For Strategic Management Concept Powerpoint Template
Our above PPT slide contains four curved arrows infographic design. This business diagram helps to depict business information for strategic management. Use this diagram to impart more clarity to data and to create more sound impact on viewers.
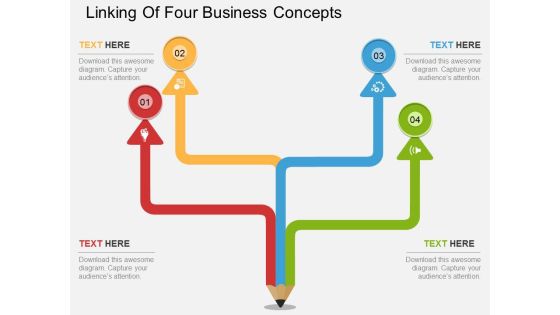
Linking Of Four Business Concepts Powerpoint Template
This PowerPoint template has been designed with four steps pencil diagram. This diagram is excellent visual tools to present link of steps. Download this PPT slide to explain complex data immediately and clearly.

Why Is Agile Cost Effective IT Determining The Software Development Cost Agile Demonstration PDF
This graph or chart is linked to excel, and changes automatically based on data. Just left click on it and select Edit Data. Deliver and pitch your topic in the best possible manner with this Why Is Agile Cost Effective IT Determining The Software Development Cost Agile Demonstration PDF. Use them to share invaluable insights on Analysis And Design, Development, Project Management, Quality Assurance and impress your audience. This template can be altered and modified as per your expectations. So, grab it now.

Resource Administration Accounting Scorecard With Defects And Fill Rate Mockup PDF
This graph or chart is linked to excel, and changes automatically based on data. Just left click on it and select Edit Data. Deliver and pitch your topic in the best possible manner with this Resource Administration Accounting Scorecard With Defects And Fill Rate Mockup PDF. Use them to share invaluable insights on Total Order Amount, Raw Material, Quantity Analysis and impress your audience. This template can be altered and modified as per your expectations. So, grab it now.

PowerPoint Designs Process Chart Strategy Ppt Slide
PowerPoint Designs process Chart Strategy PPT Slide-This Process Chart can be used as data flow diagram to show the flow of the data as it moves from beginning process to end result.-3d, arrow, art, business, chart, circle, concept, connection, cycle, development, diagram, direction, element, environment, finance, financial, flow, graphic, group, investment, isolated, market,, movement, organization, passive income, perspective, presentation, process chart, recycle, report, sign, step, success, symbol, teamwork-PowerPoint Designs process Chart Strategy PPT Slide

Automation Marketing Service Diagram Presentation Visual Aids
This is a automation marketing service diagram presentation visual aids. This is a four stage process. The stages in this process are data archiving, academic software, customer, new business.
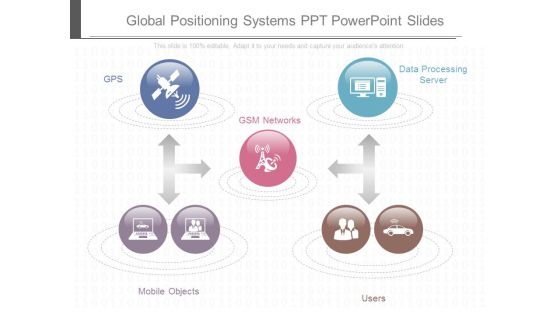
Global Positioning Systems Ppt Powerpoint Slides
This is a global positioning systems ppt powerpoint slides. This is a five stage process. The stages in this process are gps, data processing server, gsm networks, mobile objects, users.

Six Sigma Strands Chart Ppt Examples Slides
This is a six sigma strands chart ppt examples slides. This is a six stage process. The stages in this process are bottom line, trained individuals, data driven approach, customer focused, project by project, engagement, benefits of six sigma.
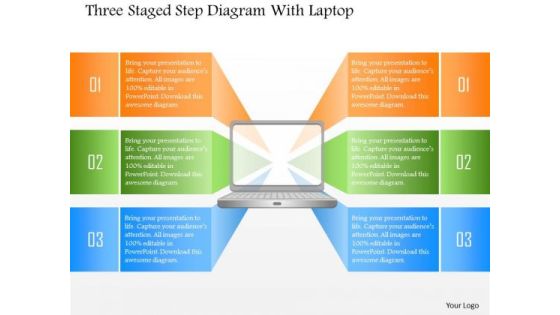
Business Diagram Three Staged Step Diagram With Laptop PowerPoint Template
Three staged step diagram with laptop has been used to craft this power point template slide. This PPT contains the concept of data representation for computer technology related topics. Use this PPt for your technology related presentations.

Business Diagram Global Business And Marketing Agenda Diagram Presentation Template
Display the concept of global agenda and marketing agenda in your business presentation. This PPT slide contains the graphic of text boxes. Use this PPT slide for your business and marketing data related presentations.
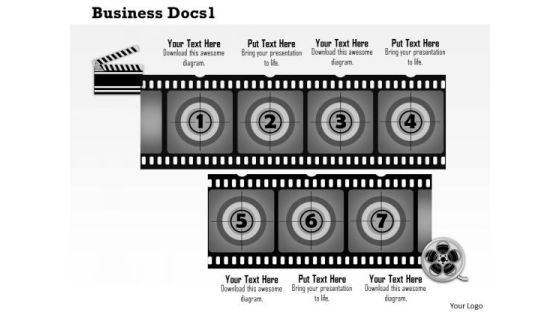
Business Framework Business Docs1 PowerPoint Presentation
Four text boxes with traffic lights are used to decorate this Power Point template slide. This PPT slide contains the concept of data representation. This PPT can be used for business and marketing presentations.

PowerPoint Slide Designs Process Chart Company Ppt Slides
PowerPoint Slide Designs process chart Company PPT Slides-This Process Chart can be used as data flow diagram to show the flow of the data as it moves from beginning process to end result.-3d, art, business, chart, circle, concept, connection, cycle, development, diagram, direction, element, environment, finance, financial, flow, graphic, group, investment, isolated, market,, movement, organization, passive income, perspective, presentation, process chart, recycle, report, sign, step, success, symbol, teamwork-PowerPoint Slide Designs process chart Company PPT Slides
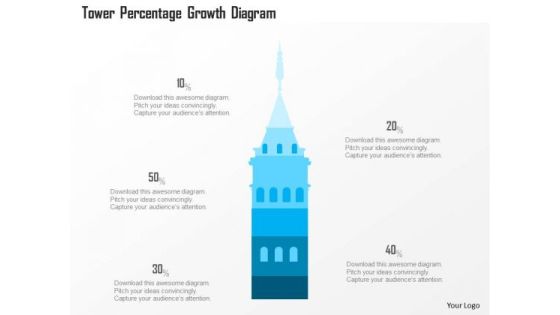
Business Diagram Tower Percentage Growth Diagram Presentation Template
This power point diagram slide has been crafted with graphic of 3d blue tower and text boxes. This PPT slide contains the concept of data and text representations. Use this PPT slide for your business and management related presentations.

Security Information And Event Management Dashboard Events Ideas PDF
This slide covers the SIEM dashboard which focuses on security events, event categories, data sources, logger event, multiple events, etc. Deliver an awe inspiring pitch with this creative security information and event management dashboard events ideas pdf bundle. Topics like security events, data source, event categories can be discussed with this completely editable template. It is available for immediate download depending on the needs and requirements of the user.
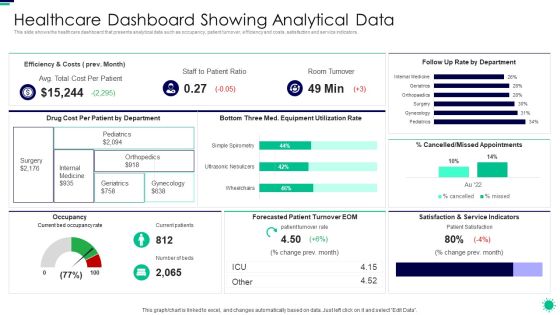
Purpose Digital Twin Internet Things Reducing Costs After COVID Era Healthcare Dashboard Showing Inspiration PDF
This slide shows the healthcare dashboard that presents analytical data such as occupancy, patient turnover, efficiency and costs, satisfaction and service indicators. Deliver an awe inspiring pitch with this creative purpose digital twin internet things reducing costs after covid era healthcare dashboard showing inspiration pdf bundle. Topics like healthcare dashboard showing analytical data can be discussed with this completely editable template. It is available for immediate download depending on the needs and requirements of the user.
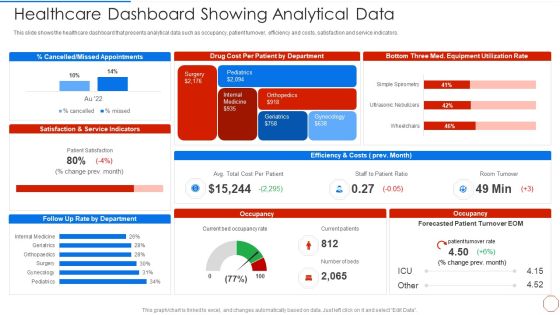
Minimizing Operational Cost Through Iot Virtual Twins Implementation Healthcare Dashboard Showing Sample PDF
This slide shows the healthcare dashboard that presents analytical data such as occupancy, patient turnover, efficiency and costs, satisfaction and service indicators. Deliver an awe inspiring pitch with this creative minimizing operational cost through iot virtual twins implementation healthcare dashboard showing sample pdf bundle. Topics like healthcare dashboard showing analytical data can be discussed with this completely editable template. It is available for immediate download depending on the needs and requirements of the user.

Business Diagram Four Staged Arrows With Different Graphics Of Communication Concept Presentation Te
Four staged arrow with different graphics has been used to craft this power point template. This PPT diagram contains the concept of data communication. Use this PPT for business and technology related presentations.
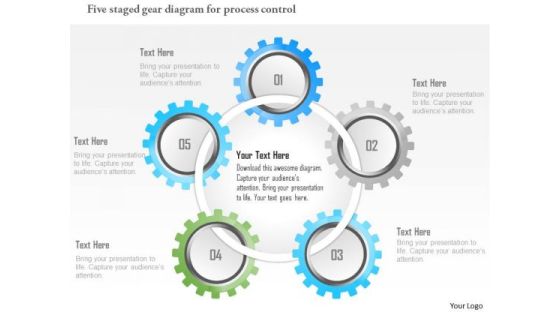
Business Diagram Five Staged Gear Diagram For Process Control Presentation Template
Our above slide displays five staged gear diagram for process control. Download our above diagram to express information in a visual way. Use this diagram and get good comments for data related presentations.


 Continue with Email

 Home
Home


