Dashboard
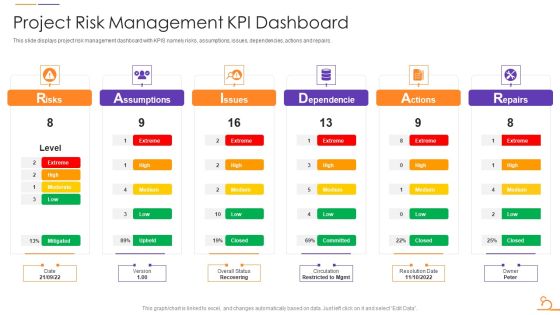
Agile Techniques For Data Migration Project Risk Management KPI Dashboard Guidelines PDF
This slide displays project risk management dashboard with KPIS namely risks, assumptions, issues, dependencies, actions and repairs. Deliver an awe inspiring pitch with this creative Agile Techniques For Data Migration Project Risk Management KPI Dashboard Guidelines PDF bundle. Topics like Risks, Assumptions, Issues, Dependencie, Actions, Repairs can be discussed with this completely editable template. It is available for immediate download depending on the needs and requirements of the user.

Automating Key Activities Of HR Manager Dashboard Showing Employee Measurement Metrics Clipart PDF
This slide shows the dashboard that depicts the metrics for measuring employee performance which includes talent satisfaction, talent turnover rate, rating, etc.Deliver and pitch your topic in the best possible manner with this Automating Key Activities Of HR Manager Dashboard Showing Employee Measurement Metrics Clipart PDF Use them to share invaluable insights on Talent Management, Talent Satisfaction, Talent Turnover and impress your audience. This template can be altered and modified as per your expectations. So, grab it now.

Business Diagram Dashboard With Pointer And Text Boxes For Process Control Presentation Template
This business diagram displays graphic of dashboard with pointer and text boxes. This slide helps to depict concept of business process and management. Present your views using this innovative slide and be assured of leaving a lasting impression.
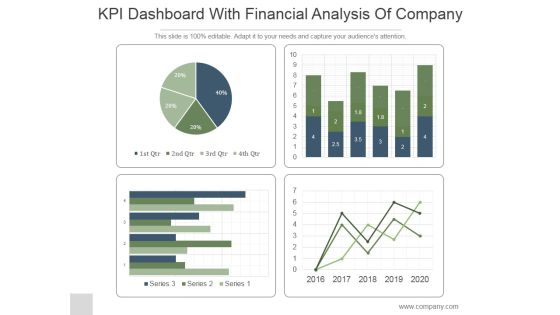
KPI Dashboard With Financial Analysis Of Company Ppt PowerPoint Presentation Backgrounds
This is a kpi dashboard with financial analysis of company ppt powerpoint presentation backgrounds. This is a four stage process. The stages in this process are business, strategy, marketing, line graph, finance.

Crm Dashboard Deals By Expected Close Date Ppt PowerPoint Presentation Background Images
This is a crm dashboard deals by expected close date ppt powerpoint presentation background images. This is a five stage process. The stages in this process are bar graph, aug, sep, oct, growth.

Crm Dashboard Lead Acquisition And Deal Acquisition Ppt PowerPoint Presentation Inspiration
This is a crm dashboard lead acquisition and deal acquisition ppt powerpoint presentation inspiration. This is a five stage process. The stages in this process are touched leads, lead acquisition, deal acquisition, time duration.

Crm Dashboard This Year Sales Vs Last Year Sales Ppt PowerPoint Presentation Information
This is a crm dashboard this year sales vs last year sales ppt powerpoint presentation information. This is a five stage process. The stages in this process are this year sales and last year sales by given in fiscal month.

Customer Relationship Management Process And Dashboard PPT PowerPoint Presentation Complete Deck With Slides
This is a customer relationship management process and dashboard ppt powerpoint presentation complete deck with slides. This is a one stage process. The stages in this process are sales, service, strategy, revenue, customer service.

Crm Dashboard Deals By Expected Close Date Ppt PowerPoint Presentation Icon
This is a crm dashboard deals by expected close date ppt powerpoint presentation icon. This is a three stage process. The stages in this process are deals by expected close date, years, planning, business, growth.

Crm Dashboard Lead Acquisition And Deal Acquisition Ppt PowerPoint Presentation Backgrounds
This is a crm dashboard lead acquisition and deal acquisition ppt powerpoint presentation backgrounds. This is a two stage process. The stages in this process are lead acquisition, deal acquisition, touched leads, new deals.

Crm Dashboard This Year Sales Vs Last Year Sales Ppt PowerPoint Presentation Styles
This is a crm dashboard this year sales vs last year sales ppt powerpoint presentation styles. This is a two stage process. The stages in this process are sales given in fiscal month, business, marketing, presentation, growth.

Crm Dashboard Deals By Expected Close Date Ppt PowerPoint Presentation Styles
This is a crm dashboard deals by expected close date ppt powerpoint presentation styles. This is a three stage process. The stages in this process are deals by expected close date, business, marketing, strategy, success.

Crm Dashboard Lead Acquisition And Deal Acquisition Ppt PowerPoint Presentation Tips
This is a crm dashboard lead acquisition and deal acquisition ppt powerpoint presentation tips. This is a two stage process. The stages in this process are lead acquisition, deal acquisition, touched leads, new deals.

Crm Dashboard This Year Sales Vs Last Year Sales Ppt PowerPoint Presentation Deck
This is a crm dashboard this year sales vs last year sales ppt powerpoint presentation deck. This is a two stage process. The stages in this process are business, marketing, success, growth, finance.

Crm Dashboard Actual Vs Target Revenue Ppt PowerPoint Presentation Outline Example File
This is a crm dashboard actual vs target revenue ppt powerpoint presentation outline example file. This is a three stage process. The stages in this process are actual, target.

Crm Dashboard Current Lead Status Ppt PowerPoint Presentation Infographic Template Visual Aids
This is a crm dashboard current lead status ppt powerpoint presentation infographic template visual aids. This is a six stage process. The stages in this process are bar graph, finance, marketing, strategy, business, analysis.

Crm Dashboard Deals By Expected Close Date Ppt PowerPoint Presentation Portfolio Icons
This is a crm dashboard deals by expected close date ppt powerpoint presentation portfolio icons. This is a three stage process. The stages in this process are bar graph, finance, marketing, strategy, business, analysis, growth.

Crm Dashboard Lead Acquisition And Deal Acquisition Ppt PowerPoint Presentation Professional File Formats
This is a crm dashboard lead acquisition and deal acquisition ppt powerpoint presentation professional file formats. This is a two stage process. The stages in this process are lead acquisition, deal acquisition.

Crm Dashboard Pipeline By Sales Stage Ppt PowerPoint Presentation Infographic Template Slides
This is a crm dashboard pipeline by sales stage ppt powerpoint presentation infographic template slides. This is a five stage process. The stages in this process are total, quality, develop, propose, close.

Crm Dashboard This Year Sales Vs Last Year Sales Ppt PowerPoint Presentation Professional Display
This is a crm dashboard this year sales vs last year sales ppt powerpoint presentation professional display. This is a two stage process. The stages in this process are area chart, growth, management, marketing, business, strategy.

Supply Chain Kpi Dashboard Ppt PowerPoint Presentation Complete Deck With Slides
This is a supply chain kpi dashboard ppt powerpoint presentation complete deck with slides. This is a one stage process. The stages in this process are business, strategy, marketing, analysis, business model.

Crm Dashboard Deals By Expected Close Date Ppt PowerPoint Presentation Show Information
This is a crm dashboard deals by expected close date ppt powerpoint presentation show information. This is a three stage process. The stages in this process are deals by expected close date, percentage, business, finance, success.

Crm Dashboard Lead Acquisition And Deal Acquisition Ppt PowerPoint Presentation Model Designs
This is a crm dashboard lead acquisition and deal acquisition ppt powerpoint presentation model designs. This is a two stage process. The stages in this process are lead acquisition, deal acquisition.

Crm Dashboard Leads By Source Ppt PowerPoint Presentation File Graphics Template
This is a crm dashboard leads by source ppt powerpoint presentation file graphics template. This is a four stage process. The stages in this process are online site, exhibition, advertisement, email campaign.

Crm Dashboard Pipeline By Sales Stage Ppt PowerPoint Presentation Outline Outfit
This is a crm dashboard pipeline by sales stage ppt powerpoint presentation outline outfit. This is a five stage process. The stages in this process are blank, quality, develop, propose, close.

Crm Dashboard This Year Sales Vs Last Year Sales Ppt PowerPoint Presentation Layouts Outline
This is a crm dashboard this year sales vs last year sales ppt powerpoint presentation layouts outline. This is a two stage process. The stages in this process are sales given in fiscal month, this year sales, last year sales.

Brand Performance Dashboard Template 2 Ppt PowerPoint Presentation Show Designs Download
This is a brand performance dashboard template 2 ppt powerpoint presentation show designs download. This is a two stage process. The stages in this process are business, location, geography, information, strategy.
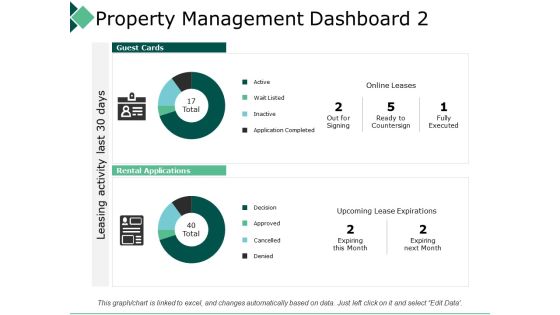
Property Management Dashboard 2 Leasing Activity Ppt PowerPoint Presentation Infographic Template Templates
This is a property management dashboard 2 leasing activity ppt powerpoint presentation infographic template templates. This is a two stage process. The stages in this process are business, management, strategy, analysis, marketing.

Employee Weekly Efficiency Dashboard Ppt PowerPoint Presentation Infographic Template Graphic Images
This is a employee weekly efficiency dashboard ppt powerpoint presentation infographic template graphic images. This is a six stage process. The stages in this process are percentage, product, business, management, marketing.

Dashboard Low Medium Ppt Powerpoint Presentation Infographics Icons Ppt Powerpoint Presentation Layouts Format
This is a dashboard low medium ppt powerpoint presentation infographics icons ppt powerpoint presentation layouts format. This is a three stage process. The stages in this process are finance, marketing, management, investment, analysis.

Retail KPI Dashboard Showing Revenue Vs Units Sold Ppt PowerPoint Presentation Professional Smartart
This is a retail kpi dashboard showing revenue vs units sold ppt powerpoint presentation professional smartart. This is a four stage process. The stages in this process are finance, analysis, business, investment, marketing.

Retail KPI Dashboard Showing Sales Revenue Customers Ppt PowerPoint Presentation Show Background Designs
This is a retail kpi dashboard showing sales revenue customers ppt powerpoint presentation show background designs. This is a six stage process. The stages in this process are finance, analysis, business, investment, marketing.
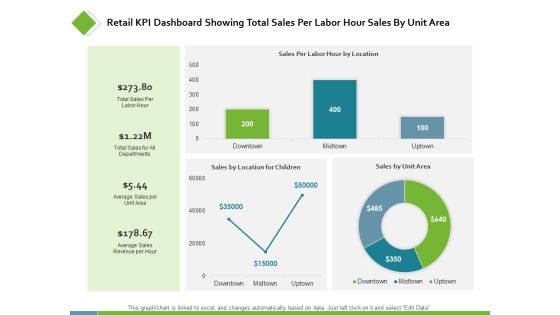
Retail KPI Dashboard Showing Total Sales Per Labor Ppt PowerPoint Presentation Styles Examples
This is a retail kpi dashboard showing total sales per labor ppt powerpoint presentation styles examples. This is a three stage process. The stages in this process are finance, analysis, business, investment, marketing.

Portfolio Management Securities Allocation Dashboard Ppt PowerPoint Presentation Professional Design Ideas
This is a portfolio management securities allocation dashboard ppt powerpoint presentation professional design ideas. This is a four stage process. The stages in this process are percentage product, business, management, marketing.

Decrease Cost And Income Growth Dashboard Ppt PowerPoint Presentation Inspiration Guide
This is a decrease cost and income growth dashboard ppt powerpoint presentation inspiration guide. This is a three stage process. The stages in this process are growth, increase sales, increase revenue.

Retail Kpi Dashboard Showing Revenue Vs Units Sold Ppt PowerPoint Presentation File Formats
This is a retail kpi dashboard showing revenue vs units sold ppt powerpoint presentation file formats. This is a three stage process. The stages in this process are finance, marketing, management, investment, analysis.
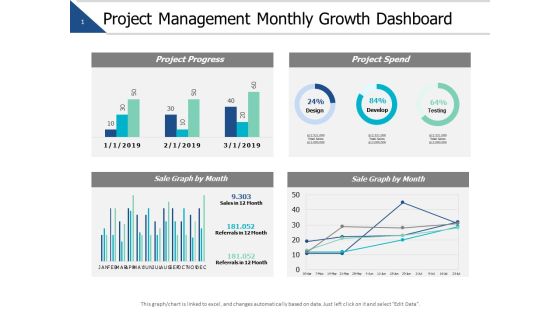
Project Management Monthly Growth Dashboard Marketing Ppt PowerPoint Presentation Model Slide Download
This is a project management monthly growth dashboard marketing ppt powerpoint presentation model slide download. This is a four stage process. The stages in this process are finance, marketing, management, investment, analysis.

Project Management Monthly Growth Dashboard Ppt PowerPoint Presentation Slides Master Slide
This is a project management monthly growth dashboard ppt powerpoint presentation slides master slide. This is a three stage process. The stages in this process are finance, marketing, management, investment, analysis.

Supply Chain Management Kpi Dashboard Marketing Ppt PowerPoint Presentation File Tips
This is a supply chain management kpi dashboard marketing ppt powerpoint presentation file tips. This is a three stage process. The stages in this process are finance, marketing, management, investment, analysis.
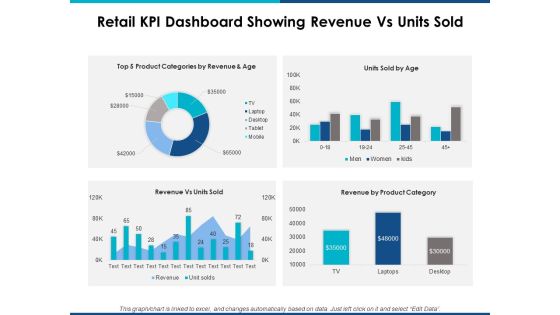
Retail Kpi Dashboard Showing Revenue Vs Units Sold Ppt Powerpoint Presentation Layouts Show
This is a retail kpi dashboard showing revenue vs units sold ppt powerpoint presentation layouts show. This is a four stage process. The stages in this process are finance, marketing, management, investment, analysis.

Dashboard Depicting Project Associated Risks And Issues Strategies To Enhance Project Lifecycle Background PDF
This slide focuses on project management dashboard which covers the project name, status date overall status, monthly schedule such as analysis, development, quality assurance, user acceptance, pre-production and support with actual and planned budget, pending decisions and actions, etc.Presenting this PowerPoint presentation, titled Dashboard Depicting Project Associated Risks And Issues Strategies To Enhance Project Lifecycle Background PDF, with topics curated by our researchers after extensive research. This editable presentation is available for immediate download and provides attractive features when used. Download now and captivate your audience. Presenting this Dashboard Depicting Project Associated Risks And Issues Strategies To Enhance Project Lifecycle Background PDF. Our researchers have carefully researched and created these slides with all aspects taken into consideration. This is a completely customizable Dashboard Depicting Project Associated Risks And Issues Strategies To Enhance Project Lifecycle Background PDF that is available for immediate downloading. Download now and make an impact on your audience. Highlight the attractive features available with our PPTs.

Dashboard To Evaluate Talent Management Metrics Employee Performance Management Tactics Themes PDF
This slide represents talent management dashboards. It includes average time to hire, cost per hire, training cost, talent turnover rate, talent satisfaction etc.Presenting this PowerPoint presentation, titled Dashboard To Evaluate Talent Management Metrics Employee Performance Management Tactics Themes PDF, with topics curated by our researchers after extensive research. This editable presentation is available for immediate download and provides attractive features when used. Download now and captivate your audience. Presenting this Dashboard To Evaluate Talent Management Metrics Employee Performance Management Tactics Themes PDF. Our researchers have carefully researched and created these slides with all aspects taken into consideration. This is a completely customizable Dashboard To Evaluate Talent Management Metrics Employee Performance Management Tactics Themes PDF that is available for immediate downloading. Download now and make an impact on your audience. Highlight the attractive features available with our PPTs.

Ppc Campaign Performance Measuring Dashboard Guide To Personal Branding Pictures PDF
Mentioned slide displays KPI dashboard that can be used to track the performance of PPC campaign. Metrics covered are AD cost, clicks, impressions, CTR and cost per conversion.Presenting this PowerPoint presentation, titled Ppc Campaign Performance Measuring Dashboard Guide To Personal Branding Pictures PDF, with topics curated by our researchers after extensive research. This editable presentation is available for immediate download and provides attractive features when used. Download now and captivate your audience. Presenting this Ppc Campaign Performance Measuring Dashboard Guide To Personal Branding Pictures PDF. Our researchers have carefully researched and created these slides with all aspects taken into consideration. This is a completely customizable Ppc Campaign Performance Measuring Dashboard Guide To Personal Branding Pictures PDF that is available for immediate downloading. Download now and make an impact on your audience. Highlight the attractive features available with our PPTs.
Dashboard For Tracking Downloads In End User Computing Environment Mockup PDF
This slide represents the dashboard for tracking downloads of apps in end user computing environment by covering details of average patch time, quality updates and so on. Presenting this PowerPoint presentation, titled Dashboard For Tracking Downloads In End User Computing Environment Mockup PDF, with topics curated by our researchers after extensive research. This editable presentation is available for immediate download and provides attractive features when used. Download now and captivate your audience. Presenting this Dashboard For Tracking Downloads In End User Computing Environment Mockup PDF. Our researchers have carefully researched and created these slides with all aspects taken into consideration. This is a completely customizable Dashboard For Tracking Downloads In End User Computing Environment Mockup PDF that is available for immediate downloading. Download now and make an impact on your audience. Highlight the attractive features available with our PPTs.

Business To Business Social Dashboard To Track Social Media Ads Campaign Results Demonstration PDF
This slide showcases dashboard that can help organization to track performance of social media advertising campaigns. Its key components are cost per conversion, CTR, link clicks, impressions, conversion rate, click through rate and cost per click. Presenting this PowerPoint presentation, titled Business To Business Social Dashboard To Track Social Media Ads Campaign Results Demonstration PDF, with topics curated by our researchers after extensive research. This editable presentation is available for immediate download and provides attractive features when used. Download now and captivate your audience. Presenting this Business To Business Social Dashboard To Track Social Media Ads Campaign Results Demonstration PDF. Our researchers have carefully researched and created these slides with all aspects taken into consideration. This is a completely customizable Business To Business Social Dashboard To Track Social Media Ads Campaign Results Demonstration PDF that is available for immediate downloading. Download now and make an impact on your audience. Highlight the attractive features available with our PPTs.

AMR Robot Dashboard To Track Autonomous Mobile Robot Performance Ppt PowerPoint Presentation Diagram Images PDF
This slide represents the dashboard to track the AMRs performance in the warehouse. It covers various AMRs status reports, energy consumption, battery level, total working hours, and time to return. Presenting this PowerPoint presentation, titled AMR Robot Dashboard To Track Autonomous Mobile Robot Performance Ppt PowerPoint Presentation Diagram Images PDF, with topics curated by our researchers after extensive research. This editable presentation is available for immediate download and provides attractive features when used. Download now and captivate your audience. Presenting this AMR Robot Dashboard To Track Autonomous Mobile Robot Performance Ppt PowerPoint Presentation Diagram Images PDF. Our researchers have carefully researched and created these slides with all aspects taken into consideration. This is a completely customizable AMR Robot Dashboard To Track Autonomous Mobile Robot Performance Ppt PowerPoint Presentation Diagram Images PDF that is available for immediate downloading. Download now and make an impact on your audience. Highlight the attractive features available with our PPTs.
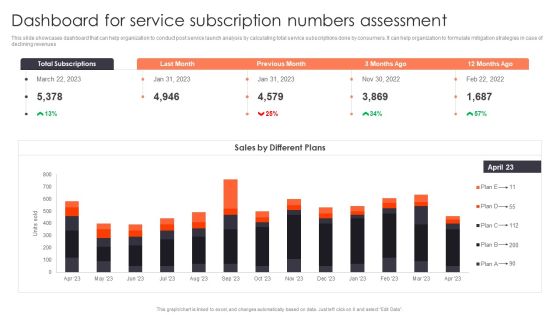
Promotion Strategies For New Service Launch Dashboard For Service Subscription Numbers Assessment Slides PDF
This slide showcases dashboard that can help organization to conduct post service launch analysis by calculating total service subscriptions done by consumers. It can help organization to formulate mitigation strategies in case of declining revenues. Presenting this PowerPoint presentation, titled Promotion Strategies For New Service Launch Dashboard For Service Subscription Numbers Assessment Slides PDF, with topics curated by our researchers after extensive research. This editable presentation is available for immediate download and provides attractive features when used. Download now and captivate your audience. Presenting this Promotion Strategies For New Service Launch Dashboard For Service Subscription Numbers Assessment Slides PDF. Our researchers have carefully researched and created these slides with all aspects taken into consideration. This is a completely customizable Promotion Strategies For New Service Launch Dashboard For Service Subscription Numbers Assessment Slides PDF that is available for immediate downloading. Download now and make an impact on your audience. Highlight the attractive features available with our PPTs.

Product Portfolios And Strategic Dashboard To Measure Business Performance Portrait PDF
This slide illustrates a dashboard that can be used by a product manager to measure the business performance. Metrics covered in the dashboard are revenue, launches, cash flow, EPS, average revenue by product and average cost by phase. Do you have an important presentation coming up Are you looking for something that will make your presentation stand out from the rest Look no further than Product Portfolios And Strategic Dashboard To Measure Business Performance Portrait PDF. With our professional designs, you can trust that your presentation will pop and make delivering it a smooth process. And with Slidegeeks, you can trust that your presentation will be unique and memorable. So why wait Grab Product Portfolios And Strategic Dashboard To Measure Business Performance Portrait PDF today and make your presentation stand out from the rest.

Biochips Use Cases Dashboard To Monitor Biochip Pacemaker Working Mockup PDF
This slide depicts the dashboard to monitor the heartbeat and working of the biochip pacemaker by showing the lower and upper rate limit, activity threshold, and so on. Presenting this PowerPoint presentation, titled Biochips Use Cases Dashboard To Monitor Biochip Pacemaker Working Mockup PDF, with topics curated by our researchers after extensive research. This editable presentation is available for immediate download and provides attractive features when used. Download now and captivate your audience. Presenting this Biochips Use Cases Dashboard To Monitor Biochip Pacemaker Working Mockup PDF. Our researchers have carefully researched and created these slides with all aspects taken into consideration. This is a completely customizable Biochips Use Cases Dashboard To Monitor Biochip Pacemaker Working Mockup PDF that is available for immediate downloading. Download now and make an impact on your audience. Highlight the attractive features available with our PPTs.

Brand Management To Enhance Rebranding Performance Tracking Dashboard To Track Renewed Brand Mockup PDF
This slide provides information regarding rebranding performance tracking dashboard in order to track renewed brand. It includes details about total spent, total link clicks, total conversations, etc. Presenting this PowerPoint presentation, titled Brand Management To Enhance Rebranding Performance Tracking Dashboard To Track Renewed Brand Mockup PDF, with topics curated by our researchers after extensive research. This editable presentation is available for immediate download and provides attractive features when used. Download now and captivate your audience. Presenting this Brand Management To Enhance Rebranding Performance Tracking Dashboard To Track Renewed Brand Mockup PDF. Our researchers have carefully researched and created these slides with all aspects taken into consideration. This is a completely customizable Brand Management To Enhance Rebranding Performance Tracking Dashboard To Track Renewed Brand Mockup PDF that is available for immediate downloading. Download now and make an impact on your audience. Highlight the attractive features available with our PPTs.
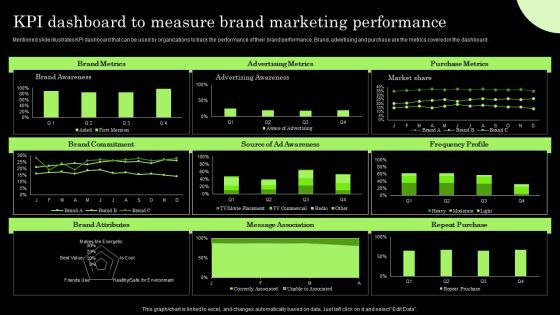
Tactical Brand Extension Launching Kpi Dashboard To Measure Brand Marketing Professional PDF
Mentioned slide illustrates KPI dashboard that can be used by organizations to track the performance of their brand performance. Brand, advertising and purchase are the metrics covered in the dashboard. Get a simple yet stunning designed Tactical Brand Extension Launching Kpi Dashboard To Measure Brand Marketing Professional PDF. It is the best one to establish the tone in your meetings. It is an excellent way to make your presentations highly effective. So, download this PPT today from Slidegeeks and see the positive impacts. Our easy-to-edit Tactical Brand Extension Launching Kpi Dashboard To Measure Brand Marketing Professional PDF can be your go-to option for all upcoming conferences and meetings. So, what are you waiting for Grab this template today.

Executing Diversity KPI Dashboard To Monitor Workforce Executing Diversity Structure PDF
This slide illustrates the KPI dashboard for workforce diversity providing details regarding headcount by seniority, gender and gender. It also provides information regarding monthly median age by gender and women at senior level forecast. Presenting this PowerPoint presentation, titled Executing Diversity KPI Dashboard To Monitor Workforce Executing Diversity Structure PDF, with topics curated by our researchers after extensive research. This editable presentation is available for immediate download and provides attractive features when used. Download now and captivate your audience. Presenting this Executing Diversity KPI Dashboard To Monitor Workforce Executing Diversity Structure PDF. Our researchers have carefully researched and created these slides with all aspects taken into consideration. This is a completely customizable Executing Diversity KPI Dashboard To Monitor Workforce Executing Diversity Structure PDF that is available for immediate downloading. Download now and make an impact on your audience. Highlight the attractive features available with our PPTs.

Porters Strategies For Targeted Client Segment Dashboard To Track Product Sales Performance Clipart PDF
This slide showcases dashboard that can help organization to analyse the sales of product after entering into niche market. Its key elements are sales, sales target, sales growth, sales by channel, inventory days outstanding etc. Presenting this PowerPoint presentation, titled Porters Strategies For Targeted Client Segment Dashboard To Track Product Sales Performance Clipart PDF, with topics curated by our researchers after extensive research. This editable presentation is available for immediate download and provides attractive features when used. Download now and captivate your audience. Presenting this Porters Strategies For Targeted Client Segment Dashboard To Track Product Sales Performance Clipart PDF. Our researchers have carefully researched and created these slides with all aspects taken into consideration. This is a completely customizable Porters Strategies For Targeted Client Segment Dashboard To Track Product Sales Performance Clipart PDF that is available for immediate downloading. Download now and make an impact on your audience. Highlight the attractive features available with our PPTs.

Implementing Brand Leadership Kpi Dashboard To Track Brand Performance Themes PDF
Mentioned slide showcases KPI dashboard that can be used to check the financial performance of a brand. Metrics covered in the dashboard are return on assets, working capital ratio, return on equity etc. This Implementing Brand Leadership Kpi Dashboard To Track Brand Performance Themes PDF is perfect for any presentation, be it in front of clients or colleagues. It is a versatile and stylish solution for organizing your meetings. The Implementing Brand Leadership Kpi Dashboard To Track Brand Performance Themes PDF features a modern design for your presentation meetings. The adjustable and customizable slides provide unlimited possibilities for acing up your presentation. Slidegeeks has done all the homework before launching the product for you. So, dont wait, grab the presentation templates today.

Digital Marketing Approach For Brand Awareness Metric Dashboard Showcasing Brand Performance Post Marketing Mockup PDF
Presenting this PowerPoint presentation, titled Digital Marketing Approach For Brand Awareness Metric Dashboard Showcasing Brand Performance Post Marketing Mockup This slide represents brand promotion dashboard highlighting performance post digital marketing. It includes sales quantity, return quantity, cost of goods, return amount etc. PDF, with topics curated by our researchers after extensive research. This editable presentation is available for immediate download and provides attractive features when used. Download now and captivate your audience. Presenting this Digital Marketing Approach For Brand Awareness Metric Dashboard Showcasing Brand Performance Post Marketing Mockup PDF. Our researchers have carefully researched and created these slides with all aspects taken into consideration. This is a completely customizable Digital Marketing Approach For Brand Awareness Metric Dashboard Showcasing Brand Performance Post Marketing Mockup PDF that is available for immediate downloading. Download now and make an impact on your audience. Highlight the attractive features available with our PPTs.
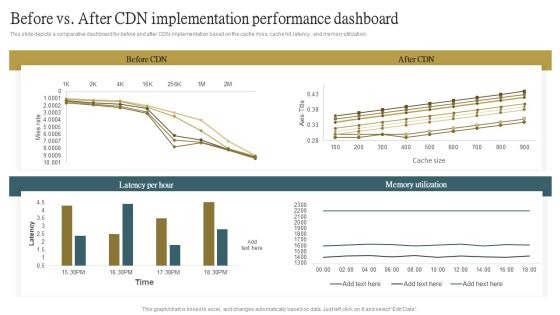
Cloud Content Delivery Network Before Vs After CDN Implementation Performance Dashboard Clipart PDF
This slide depicts a comparative dashboard for before and after CDN implementation based on the cache miss, cache hit, latency, and memory utilization. Presenting this PowerPoint presentation, titled Cloud Content Delivery Network Before Vs After CDN Implementation Performance Dashboard Clipart PDF, with topics curated by our researchers after extensive research. This editable presentation is available for immediate download and provides attractive features when used. Download now and captivate your audience. Presenting this Cloud Content Delivery Network Before Vs After CDN Implementation Performance Dashboard Clipart PDF. Our researchers have carefully researched and created these slides with all aspects taken into consideration. This is a completely customizable Cloud Content Delivery Network Before Vs After CDN Implementation Performance Dashboard Clipart PDF that is available for immediate downloading. Download now and make an impact on your audience. Highlight the attractive features available with our PPTs.

Strategic Global Expansion Business Plan Dashboard To Analyse Sales Post Global Expansion Diagrams PDF
This slide showcase dashboard that can help organization track sales after global expansion. Its key components are sales target, target achievement, sales by channel, inventory days outstanding, sales growth, gross profit, gross profit margin etc. Presenting this PowerPoint presentation, titled Strategic Global Expansion Business Plan Dashboard To Analyse Sales Post Global Expansion Diagrams PDF, with topics curated by our researchers after extensive research. This editable presentation is available for immediate download and provides attractive features when used. Download now and captivate your audience. Presenting this Strategic Global Expansion Business Plan Dashboard To Analyse Sales Post Global Expansion Diagrams PDF. Our researchers have carefully researched and created these slides with all aspects taken into consideration. This is a completely customizable Strategic Global Expansion Business Plan Dashboard To Analyse Sales Post Global Expansion Diagrams PDF that is available for immediate downloading. Download now and make an impact on your audience. Highlight the attractive features available with our PPTs.

Brand Management Strategy To Increase Awareness KPI Dashboard To Track Brand Performance Slides PDF
Mentioned slide showcases KPI dashboard that can be used to check the financial performance of a brand. Metrics covered in the dashboard are return on assets, working capital ratio, return on equity etc. This Brand Management Strategy To Increase Awareness KPI Dashboard To Track Brand Performance Slides PDF is perfect for any presentation, be it in front of clients or colleagues. It is a versatile and stylish solution for organizing your meetings. The Brand Management Strategy To Increase Awareness KPI Dashboard To Track Brand Performance Slides PDF features a modern design for your presentation meetings. The adjustable and customizable slides provide unlimited possibilities for acing up your presentation. Slidegeeks has done all the homework before launching the product for you. So, dont wait, grab the presentation templates today

Building Brand Leadership Strategy To Dominate The Market KPI Dashboard To Track Brand Performance Formats PDF
Mentioned slide showcases KPI dashboard that can be used to check the financial performance of a brand. Metrics covered in the dashboard are return on assets, working capital ratio, return on equity etc.This Building Brand Leadership Strategy To Dominate The Market KPI Dashboard To Track Brand Performance Formats PDF is perfect for any presentation, be it in front of clients or colleagues. It is a versatile and stylish solution for organizing your meetings. The Building Brand Leadership Strategy To Dominate The Market KPI Dashboard To Track Brand Performance Formats PDF features a modern design for your presentation meetings. The adjustable and customizable slides provide unlimited possibilities for acing up your presentation. Slidegeeks has done all the homework before launching the product for you. So, dont wait, grab the presentation templates today
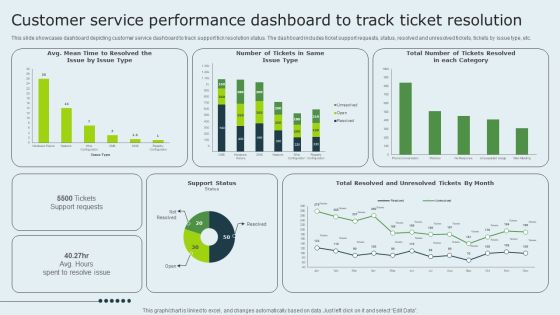
Enhancing Client Experience Customer Service Performance Dashboard To Track Ticket Template PDF
This slide showcases dashboard depicting customer service dashboard to track support tick resolution status. The dashboard includes ticket support requests, status, resolved and unresolved tickets, tickets by issue type, etc. This modern and well-arranged Enhancing Client Experience Customer Service Performance Dashboard To Track Ticket Template PDF provides lots of creative possibilities. It is very simple to customize and edit with the Powerpoint Software. Just drag and drop your pictures into the shapes. All facets of this template can be edited with Powerpoint, no extra software is necessary. Add your own material, put your images in the places assigned for them, adjust the colors, and then you can show your slides to the world, with an animated slide included.
 Home
Home