Dashboard

Strategic Risk Management Plan Operational Risk Management Key Metrics Dashboard Structure PDF
This slide represents dashboard representing the key metrics of operational risk management. It includes KPIs such as operational risk by rating, by month, operational risk list etc.Create an editable Strategic Risk Management Plan Operational Risk Management Key Metrics Dashboard Structure PDF that communicates your idea and engages your audience. Whether you are presenting a business or an educational presentation, pre-designed presentation templates help save time. Strategic Risk Management Plan Operational Risk Management Key Metrics Dashboard Structure PDF is highly customizable and very easy to edit, covering many different styles from creative to business presentations. Slidegeeks has creative team members who have crafted amazing templates. So, go and get them without any delay.
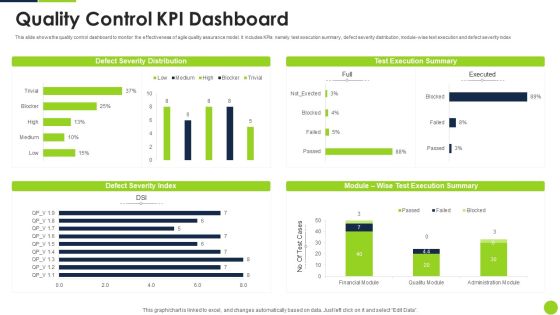
Agile Methodology Quality Control Quality Control KPI Dashboard Ppt Infographic Template Layout Ideas PDF
This slide shows the quality control dashboard to monitor the effectiveness of agile quality assurance model. It includes KPIs namely test execution summary, defect severity distribution, module-wise text execution and defect severity index Deliver an awe inspiring pitch with this creative agile methodology quality control quality control kpi dashboard ppt infographic template layout ideas pdf bundle. Topics like quality control kpi dashboard can be discussed with this completely editable template. It is available for immediate download depending on the needs and requirements of the user.
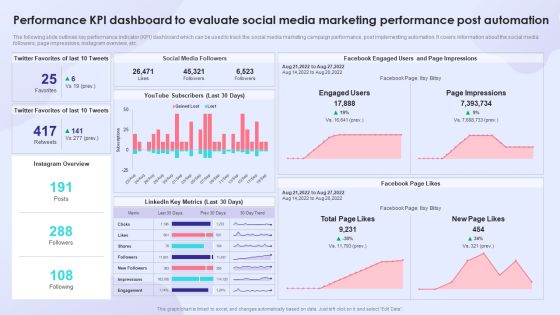
Performance KPI Dashboard To Evaluate Social Media Marketing Performance Post Automation Themes PDF
The following slide outlines key performance indicator KPI dashboard which can be used to track the social media marketing campaign performance, post implementing automation. It covers information about the social media followers, page impressions, instagram overview, etc. Deliver and pitch your topic in the best possible manner with this Performance KPI Dashboard To Evaluate Social Media Marketing Performance Post Automation Themes PDF. Use them to share invaluable insights on Social Media Followers, Linkedin Key Metrics, Performance KPI Dashboard and impress your audience. This template can be altered and modified as per your expectations. So, grab it now.

Business Intelligence And Web Analytics Dashboard To Track Marketing Kpis Inspiration PDF
In this business intelligence dashboard is displayed to help company in real time monitoring and reporting of relevant details. It includes KPIs such as visits, average session duration, bounce rate, page views, traffic sources, etc. Showcasing this set of slides titled Business Intelligence And Web Analytics Dashboard To Track Marketing Kpis Inspiration PDF. The topics addressed in these templates are Goal Conversion, Track Marketing Kpis, Web Analytics Dashboard. All the content presented in this PPT design is completely editable. Download it and make adjustments in color, background, font etc. as per your unique business setting.

Linked Data Visualization Data Quality Dashboard For Linked Data Pictures PDF
This slide describes the data quality dashboard for linked data by covering details of account information quality, contact details quality, financial data quality, and missing account information. Create an editable Linked Data Visualization Data Quality Dashboard For Linked Data Pictures PDF that communicates your idea and engages your audience. Whether youre presenting a business or an educational presentation, pre-designed presentation templates help save time. Linked Data Visualization Data Quality Dashboard For Linked Data Pictures PDF is highly customizable and very easy to edit, covering many different styles from creative to business presentations. Slidegeeks has creative team members who have crafted amazing templates. So, go and get them without any delay.

Dashboard For Tracking Mobile Commercial Banking Marketing Campaign Performance Slides PDF
This slide depicts a dashboard for tracking performance of marketing campaigns of mobile banking across paid media channels. The key performing indicators are client acquisition metrics, client conversion metrics, expense metrics among many others. Showcasing this set of slides titled Dashboard For Tracking Mobile Commercial Banking Marketing Campaign Performance Slides PDF. The topics addressed in these templates are Dashboard For Tracking Mobile, Commercial Banking, Marketing Campaign Performance. All the content presented in this PPT design is completely editable. Download it and make adjustments in color, background, font etc. as per your unique business setting.
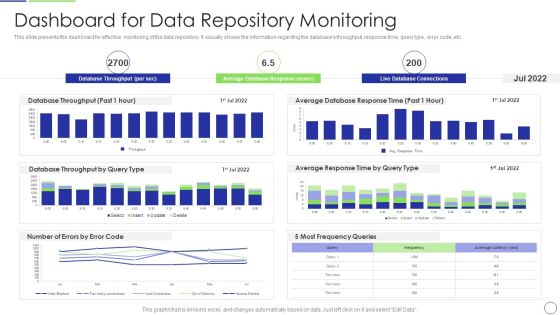
Developing Organization Primary Data Storage Action Plan Dashboard For Data Repository Monitoring Information PDF
This slide presents the dashboard for effective monitoring of the data repository. It visually shows the information regarding the databases throughput, response time, query type, error code, etc. Deliver and pitch your topic in the best possible manner with this developing organization primary data storage action plan dashboard for data repository monitoring information pdf. Use them to share invaluable insights on dashboard for data repository monitoring and impress your audience. This template can be altered and modified as per your expectations. So, grab it now.

KPI Dashboard To Track Effectiveness Of Real Estate Business Performance Slides PDF
The following slide exhibits key performance indicator KPI dashboard which can be used to measure the financial performance of the real estate company. It covers various kpis such as sales vs target per agent, top 10 projects, top 5 agencies etc. Deliver an awe inspiring pitch with this creative KPI Dashboard To Track Effectiveness Of Real Estate Business Performance Slides PDF bundle. Topics like KPI Dashboard, Track Effectiveness, Real Estate Business Performance can be discussed with this completely editable template. It is available for immediate download depending on the needs and requirements of the user.

Stream Processing Dashboard With Incidents Status Ppt PowerPoint Presentation Gallery Portrait PDF
The following slide outlines a KPI dashboard of data ingestion. The dashboard covers key metrics such as incidents by category and severity, contributing cause, root cause, incident trends and status, etc. Showcasing this set of slides titled Stream Processing Dashboard With Incidents Status Ppt PowerPoint Presentation Gallery Portrait PDF. The topics addressed in these templates are Incidens, Category And Severity, Incidents By Facility, Contributing Cause. All the content presented in this PPT design is completely editable. Download it and make adjustments in color, background, font etc. as per your unique business setting.
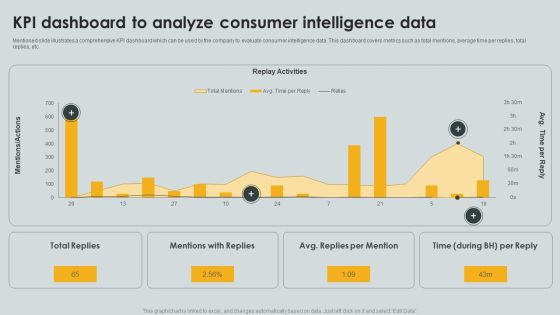
KPI Dashboard To Analyze Consumer Intelligence Data Ppt PowerPoint Presentation File Portfolio PDF
Mentioned slide illustrates a comprehensive KPI dashboard which can be used by the company to evaluate consumer intelligence data. This dashboard covers metrics such as total mentions, average time per replies, total replies, etc. Pitch your topic with ease and precision using this KPI Dashboard To Analyze Consumer Intelligence Data Ppt PowerPoint Presentation File Portfolio PDF. This layout presents information on Replay Activities, Total Replies, Mentions Replies. It is also available for immediate download and adjustment. So, changes can be made in the color, design, graphics or any other component to create a unique layout.
Youtube Marketing Dashboard Highlighting Traffic Source And Average Views Icons PDF
This slide showcases the youtube marketing dashboard which includes subscriber gained vs loss list which includes traffic sources and lasted uploaded videos data.Create an editable Youtube Marketing Dashboard Highlighting Traffic Source And Average Views Icons PDF that communicates your idea and engages your audience. Whether you are presenting a business or an educational presentation, pre-designed presentation templates help save time. Youtube Marketing Dashboard Highlighting Traffic Source And Average Views Icons PDF is highly customizable and very easy to edit, covering many different styles from creative to business presentations. Slidegeeks has creative team members who have crafted amazing templates. So, go and get them without any delay.

Data Safety Initiatives KPI Dashboard To Track Security Risk Events Portrait PDF
This slide displays KPI dashboard that company will use to track multiple risk events. Metrics covered in the dashboard are residual risks by period and risk category by total risk rating. Deliver and pitch your topic in the best possible manner with this data safety initiatives kpi dashboard to track security risk events portrait pdf. Use them to share invaluable insights on risk category, total risk rating, residual risk by period, technology risk and impress your audience. This template can be altered and modified as per your expectations. So, grab it now.
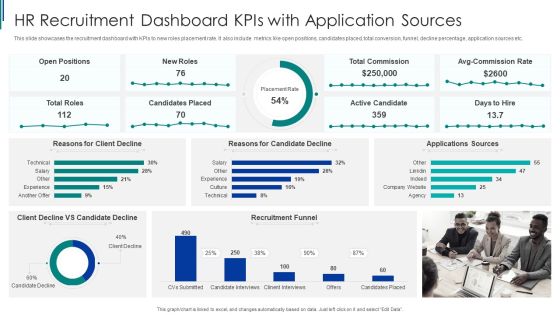
HR Recruitment Dashboard Kpis With Application Sources Ppt Pictures Styles PDF
This slide showcases the recruitment dashboard with KPIs to new roles placement rate. It also include metrics like open positions, candidates placed, total conversion, funnel, decline percentage, application sources etc. Pitch your topic with ease and precision using this HR Recruitment Dashboard Kpis With Application Sources Ppt Pictures Styles PDF. This layout presents information on Recruitment Funnel, HR Recruitment, Dashboard Kpis. It is also available for immediate download and adjustment. So, changes can be made in the color, design, graphics or any other component to create a unique layout.

HR Recruitment Dashboard Kpis With Decline Reasons Ppt Pictures Example Introduction PDF
Following slide showcases the recruitment dashboard metrics for hiring of technical position. It include KPIs like status, applications, days in hiring, closed applications, phone screen, decline reason. Showcasing this set of slides titled HR Recruitment Dashboard Kpis With Decline Reasons Ppt Pictures Example Introduction PDF. The topics addressed in these templates are Recruitment Funnel, HR Recruitment, Dashboard Kpis. All the content presented in this PPT design is completely editable. Download it and make adjustments in color, background, font etc. as per your unique business setting.

HR Recruitment Dashboard Kpis With Hires Per Month Ppt Slides Portfolio PDF
This slide showcases the recruitment dashboard of KPIs to know hiring from different sources. It include metrics like hires by department, per month, candidate feedback, offer acceptance rate, interview activity. Pitch your topic with ease and precision using this HR Recruitment Dashboard Kpis With Hires Per Month Ppt Slides Portfolio PDF. This layout presents information on HR Recruitment, Dashboard Kpis, Business Development. It is also available for immediate download and adjustment. So, changes can be made in the color, design, graphics or any other component to create a unique layout.
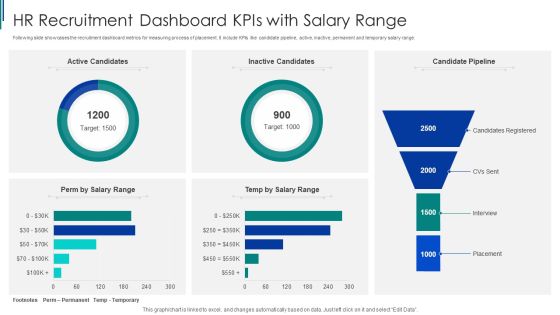
HR Recruitment Dashboard Kpis With Salary Range Ppt Inspiration Rules PDF
Following slide showcases the recruitment dashboard metrics for measuring process of placement. It include KPIs like candidate pipeline, active, inactive, permanent and temporary salary range. Pitch your topic with ease and precision using this HR Recruitment Dashboard Kpis With Salary Range Ppt Inspiration Rules PDF. This layout presents information on HR Recruitment, Dashboard Kpis, Salary Range. It is also available for immediate download and adjustment. So, changes can be made in the color, design, graphics or any other component to create a unique layout.

CRM Team Dashboard Highlighting Major Web Based Platform Kpis Template PDF
This slide showcases customer relationship management CRM team dashboard indicating web portal KPIs. It provides information about cost per acquisition CPA, signups, channel, spend, etc. Pitch your topic with ease and precision using this CRM Team Dashboard Highlighting Major Web Based Platform Kpis Template PDF. This layout presents information on CRM Team Dashboard Highlighting, Web Based Platform Kpis. It is also available for immediate download and adjustment. So, changes can be made in the color, design, graphics or any other component to create a unique layout.

Customer Success And Satisfaction KPIS Dashboard Ppt PowerPoint Presentation Outline Visuals PDF
This slide covers dashboard for estimation of customer satisfaction with success metrics. It includes KPIs such as average CSAT, average response time , service level agreement compliance, top companys accounts, etc. Pitch your topic with ease and precision using this Customer Success And Satisfaction KPIS Dashboard Ppt PowerPoint Presentation Outline Visuals PDF. This layout presents information on Customer Success, Satisfaction KPIs Dashboard. It is also available for immediate download and adjustment. So, changes can be made in the color, design, graphics or any other component to create a unique layout.
HR Recruitment Dashboard Kpis With Recruitment Cost Ppt Inspiration Icons PDF
This slide showcases the recruitment dashboard of company of Hr department. It include time to hire days, cost, source, department, funnel no. of applications, male female ratio. Showcasing this set of slides titled HR Recruitment Dashboard Kpis With Recruitment Cost Ppt Inspiration Icons PDF. The topics addressed in these templates are Recruitment Funnel, Operational Dashboard, Application Date. All the content presented in this PPT design is completely editable. Download it and make adjustments in color, background, font etc. as per your unique business setting.

KPI Analytics Dashboard With Sourcing Raw Material Cycle Time Inspiration PDF
Following slide shows the key performance indicator KPI dashboard which will assist corporates to effectively monitor procurement process. The metrics are number of suppliers, contract compliance, average procurement cycle time, etc. Showcasing this set of slides titled KPI Analytics Dashboard With Sourcing Raw Material Cycle Time Inspiration PDF. The topics addressed in these templates are Kpi Analytics Dashboard, Sourcing Raw Material, Cycle Time. All the content presented in this PPT design is completely editable. Download it and make adjustments in color, background, font etc. as per your unique business setting.

Staff Succession Planning And Development Strategy Kpi Dashboard For Human Clipart PDF
Mentioned slide shows key performance indicator dashboard for human resource. Metrics covered in the dashboard are headcount by seniority and gender, open positions, headcount, termination, hires and turnover.If your project calls for a presentation, then Slidegeeks is your go-to partner because we have professionally designed, easy-to-edit templates that are perfect for any presentation. After downloading, you can easily edit Staff Succession Planning And Development Strategy Kpi Dashboard For Human Clipart PDF and make the changes accordingly. You can rearrange slides or fill them with different images. Check out all the handy templates.

Plant Safety Measures Dashboard With Incidents Work Accidents And Near Misses Template PDF
This slide showcases dashboard to monitor plant safety measures performance indicators. Key metrics covered are incident and injury type, root cause, location, contributing factor, employees at risk and investigation. Pitch your topic with ease and precision using this Plant Safety Measures Dashboard With Incidents Work Accidents And Near Misses Template PDF. This layout presents information on Plant Safety Measures Dashboard, Incidents Work Accidents. It is also available for immediate download and adjustment. So, changes can be made in the color, design, graphics or any other component to create a unique layout.
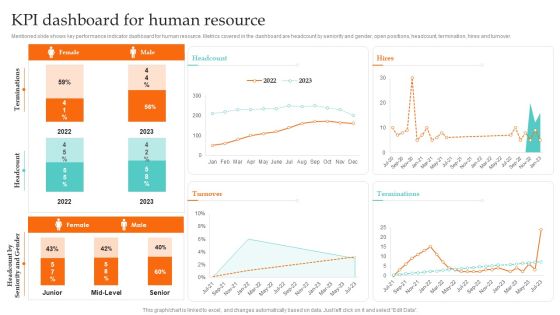
Kpi Dashboard For Human Resource Ultimate Guide To Employee Succession Planning Topics PDF
Mentioned slide shows key performance indicator dashboard for human resource. Metrics covered in the dashboard are headcount by seniority and gender, open positions, headcount, termination, hires and turnover.Present like a pro with Kpi Dashboard For Human Resource Ultimate Guide To Employee Succession Planning Topics PDF Create beautiful presentations together with your team, using our easy-to-use presentation slides. Share your ideas in real-time and make changes on the fly by downloading our templates. So whether you are in the office, on the go, or in a remote location, you can stay in sync with your team and present your ideas with confidence. With Slidegeeks presentation got a whole lot easier. Grab these presentations today.

Talent Administration And Succession KPI Dashboard For Human Resource Rules PDF
Mentioned slide shows key performance indicator dashboard for human resource. Metrics covered in the dashboard are headcount by seniority and gender, open positions, headcount, termination, hires and turnover. If your project calls for a presentation, then Slidegeeks is your go-to partner because we have professionally designed, easy-to-edit templates that are perfect for any presentation. After downloading, you can easily edit Talent Administration And Succession KPI Dashboard For Human Resource Rules PDF and make the changes accordingly. You can rearrange slides or fill them with different images. Check out all the handy templates

Branches For Visualization Research And Development Sales Performance Dashboard After Infographics PDF
This slide depicts the dashboard for sales performance after the implementation of visualization research based on revenue, quantity, regional sales. Crafting an eye-catching presentation has never been more straightforward. Let your presentation shine with this tasteful yet straightforward Branches For Visualization Research And Development Sales Performance Dashboard After Infographics PDF template. It offers a minimalistic and classy look that is great for making a statement. The colors have been employed intelligently to add a bit of playfulness while still remaining professional. Construct the ideal Branches For Visualization Research And Development Sales Performance Dashboard After Infographics PDF that effortlessly grabs the attention of your audience Begin now and be certain to wow your customers.
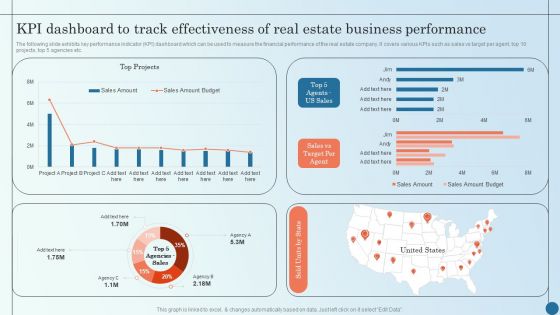
KPI Dashboard To Track Effectiveness Of Real Estate Business Managing Commercial Property Risks Demonstration PDF
The following slide exhibits key performance indicator KPI dashboard which can be used to measure the financial performance of the real estate company. It covers various KPIs such as sales vs target per agent, top 10 projects, top 5 agencies etc.Deliver an awe inspiring pitch with this creative KPI Dashboard To Track Effectiveness Of Real Estate Business Managing Commercial Property Risks Demonstration PDF bundle. Topics like Kpi Dashboard, Track Effectiveness, Estate Business can be discussed with this completely editable template. It is available for immediate download depending on the needs and requirements of the user.

Devops Principles For Hybrid Cloud IT Devops Team Performance Monitoring Dashboard Infographics PDF
This slide portrays performance monitoring dashboard that can be used by organization to track its DevOps team efficiency. It also covers details about billable and non-billable hours with task completion status.Deliver and pitch your topic in the best possible manner with this devops principles for hybrid cloud it devops team performance monitoring dashboard infographics pdf Use them to share invaluable insights on devops team performance monitoring dashboard and impress your audience. This template can be altered and modified as per your expectations. So, grab it now.

Business Intelligence Dashboard To Monitor Performance Of Retail Business Infographics PDF
The following slide displays BI dashboard for real time tracking of key business financials. It further includes details about scorecard, sales distribution, supply and demand, etc. Pitch your topic with ease and precision using this Business Intelligence Dashboard To Monitor Performance Of Retail Business Infographics PDF. This layout presents information on Business Intelligence Dashboard, Monitor Performance, Retail Business. It is also available for immediate download and adjustment. So, changes can be made in the color, design, graphics or any other component to create a unique layout.
Staff Training Effectiveness Tracking Dashboard Techniques For Crafting Killer Summary PDF
This slide provides information regarding workforce training effectiveness monitoring dashboard. The dashboard includes details such as training cost, cost per participant, number of participants, hours of training, etc. The Staff Training Effectiveness Tracking Dashboard Techniques For Crafting Killer Summary PDF is a compilation of the most recent design trends as a series of slides. It is suitable for any subject or industry presentation, containing attractive visuals and photo spots for businesses to clearly express their messages. This template contains a variety of slides for the user to input data, such as structures to contrast two elements, bullet points, and slides for written information. Slidegeeks is prepared to create an impression.

IT Performance Dashboard To Track Customer Satisfaction Ppt PowerPoint Presentation File Styles PDF
This slide provides information regarding the dashboard to monitor overall IT performance. The dashboard tracks occupancy rate, net promoter score, avg. first contact resolution rate, etc. The IT Performance Dashboard To Track Customer Satisfaction Ppt PowerPoint Presentation File Styles PDF is a compilation of the most recent design trends as a series of slides. It is suitable for any subject or industry presentation, containing attractive visuals and photo spots for businesses to clearly express their messages. This template contains a variety of slides for the user to input data, such as structures to contrast two elements, bullet points, and slides for written information. Slidegeeks is prepared to create an impression.

Data Lake Architecture Future Of Data Analysis Centralized Repository Data Lake Reporting Dashboard Elements PDF
This slide represents the data lake reporting dashboard by covering the total number of users, total lake size, trusted zone size, conversion rate, and retention.Deliver an awe inspiring pitch with this creative Data Lake Architecture Future Of Data Analysis Centralized Repository Data Lake Reporting Dashboard Elements PDF bundle. Topics like Data Governance, Conversion Rate, Retention can be discussed with this completely editable template. It is available for immediate download depending on the needs and requirements of the user.

Innovation Procedure For Online Business IT Transformation Dashboard With Iterate And Delivery Infographics PDF
The following slide displays the key metrics for the IT transformation dashboard as it displays the key challenges faced along with the budget spent and the time period of challenges Deliver an awe inspiring pitch with this creative Innovation Procedure For Online Business IT Transformation Dashboard With Iterate And Delivery Infographics PDF bundle. Topics like IT Transformation Dashboard With Iterate And Delivery can be discussed with this completely editable template. It is available for immediate download depending on the needs and requirements of the user.

Advertising KPI Dashboard To Measure Cost Per Conversion Rate Themes PDF
This slide signifies the key performance indicator dashboard to track and evaluate cost per conversion. It includes KPI such as advertisement budget, clicks, ads impressions line chart and rate Showcasing this set of slides titled Advertising KPI Dashboard To Measure Cost Per Conversion Rate Themes PDF The topics addressed in these templates are Advertising Kpi Dashboard To Measure Cost Per Conversion Rate All the content presented in this PPT design is completely editable. Download it and make adjustments in color, background, font etc. as per your unique business setting.
KPI Dashboard For Tracking Commercial Banking And Financial Activities Download PDF
This slide depicts a dashboard for tracking the banking and financial activities of a business enterprise to measure the income and expenses. The key performing indicators are business accounts, paid, pending and cancelled transactions etc. Pitch your topic with ease and precision using this KPI Dashboard For Tracking Commercial Banking And Financial Activities Download PDF. This layout presents information on KPI Dashboard, Tracking Commercial Banking, Financial Activities. It is also available for immediate download and adjustment. So, changes can be made in the color, design, graphics or any other component to create a unique layout.

Dashboard To Depict Robot Utilization In Robotic Desktop Automation Download PDF
This slide consists of a Dashboard which can be used by managers to depict robot utilization in attended automation. Key performance indicators relate to total utilization, robot types, hours saved etc. Pitch your topic with ease and precision using this Dashboard To Depict Robot Utilization In Robotic Desktop Automation Download PDF. This layout presents information on Dashboard, Depict Robot Utilization, Robotic Desktop Automation. It is also available for immediate download and adjustment. So, changes can be made in the color, design, graphics or any other component to create a unique layout.
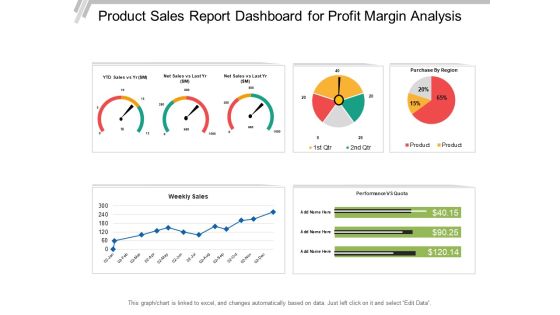
Product Sales Report Dashboard For Profit Margin Analysis Ppt PowerPoint Presentation Ideas Slide Portrait
This is a product sales report dashboard for profit margin analysis ppt powerpoint presentation ideas slide portrait. This is a four stage process. The stages in this process are business analytics, ba, organizations data.

Corporate Digital Transformation Roadmap IT Transformation Dashboard With Iterate And Delivery Microsoft PDF
The following slide displays the key metrics for the IT transformation dashboard as it displays the key challenges faced along with the budget spent and the time period of challenges Deliver and pitch your topic in the best possible manner with this Corporate Digital Transformation Roadmap IT Transformation Dashboard With Iterate And Delivery Microsoft PDF Use them to share invaluable insights on IT Transformation Dashboard With Iterate And Delivery and impress your audience. This template can be altered and modified as per your expectations. So, grab it now.
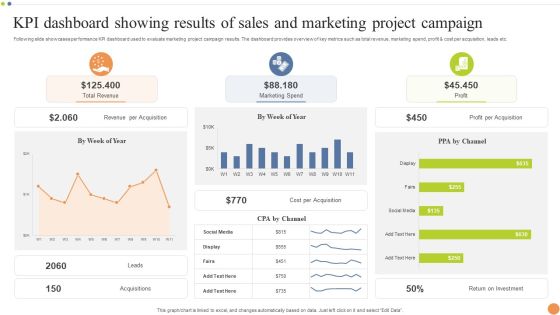
KPI Dashboard Showing Results Of Sales And Marketing Project Campaign Formats PDF
Following slide showcases performance KPI dashboard used to evaluate marketing project campaign results. The dashboard provides overview of key metrics such as total revenue, marketing spend, profit and cost per acquisition, leads etc. Showcasing this set of slides titled KPI Dashboard Showing Results Of Sales And Marketing Project Campaign Formats PDF. The topics addressed in these templates are Marketing Spend, Revenue, Profit Per Acquisition. All the content presented in this PPT design is completely editable. Download it and make adjustments in color, background, font etc. as per your unique business setting.

Buzz Marketing Strategies For Brand Promotion Dashboard For Tracking Marketing Activities At Designs PDF
This slide covers information regarding the dashboard for tracking essential marketing activities at social media platform in terms of social traffic and conversion, referral traffic by site, key social media metrics. Deliver an awe inspiring pitch with this creative buzz marketing strategies for brand promotion dashboard for tracking marketing activities at designs pdf bundle. Topics like dashboard for tracking marketing activities at social media platform can be discussed with this completely editable template. It is available for immediate download depending on the needs and requirements of the user.
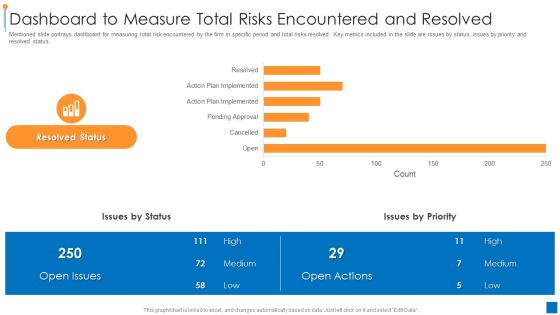
International Organization Standardization 270001 Dashboard To Measure Total Risks Encountered And Resolved Demonstration PDF
Mentioned slide portrays dashboard for measuring total risk encountered by the firm in specific period and total risks resolved. Key metrics included in the slide are issues by status, issues by priority and resolved status. Deliver and pitch your topic in the best possible manner with this international organization standardization 270001 dashboard to measure total risks encountered and resolved demonstration pdf. Use them to share invaluable insights on dashboard to measure total risks encountered and resolved and impress your audience. This template can be altered and modified as per your expectations. So, grab it now.

Go To Market Approach For New Product Dashboard To Measure Sales Rep Performance Formats PDF
This slide illustrates sales representative performance measurement dashboard with key metrics such as average first contact resolution rate, occupancy rate, NPS and top agents by solved tickets.Deliver and pitch your topic in the best possible manner with this Go To Market Approach For New Product Dashboard To Measure Sales Rep Performance Formats PDF Use them to share invaluable insights on Dashboard To Measure Sales Rep Performance and impress your audience. This template can be altered and modified as per your expectations. So, grab it now.

Dashboard To Track Impact Of Extensive Diversity Training On Workplace Management Portrait PDF
This slide showcases dashboard to track impact of diversity training on workplace management. Key metrics included here are gender distribution level, hire by gender, ethinicity distribution, promotion rate, termination rate etc. Pitch your topic with ease and precision using this Dashboard To Track Impact Of Extensive Diversity Training On Workplace Management Portrait PDF. This layout presents information on Dashboard To Track Impact, Extensive Diversity Training, Workplace Management. It is also available for immediate download and adjustment. So, changes can be made in the color, design, graphics or any other component to create a unique layout.

Skill Shortage In A Production Firm Case Study Solution NSS Electronic Manufacturing Company Dashboard Summary PDF
This slide shows a NSS Electronic Manufacturing Company Dashboard with KPIs such as Company Revenue , Production Volumes, Cost Breakdown, Average Cost by Production Component , total cost per unit etc. Deliver and pitch your topic in the best possible manner with this skill shortage in a production firm case study solution NSS electronic manufacturing company dashboard summary pdf. Use them to share invaluable insights on costs by production component, production volume, NSS electronic manufacturing company dashboard and impress your audience. This template can be altered and modified as per your expectations. So, grab it now.

Agile Quality Control Framework IT Quality Control KPI Dashboard Template PDF
This slide shows the quality control dashboard to monitor the effectiveness of agile quality assurance model. It includes KPIs namely test execution summary, defect severity distribution, module wise text execution and defect severity index. Deliver and pitch your topic in the best possible manner with this agile quality control framework it quality control kpi dashboard template pdf. Use them to share invaluable insights on quality control kpi dashboard and impress your audience. This template can be altered and modified as per your expectations. So, grab it now.
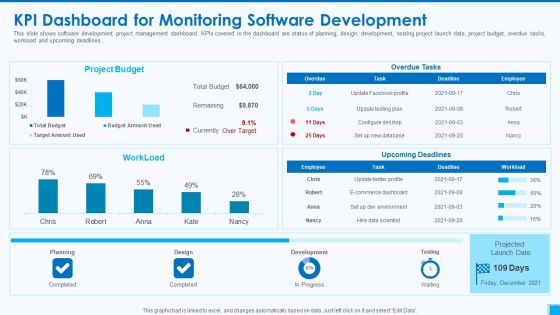
Devops Tools And Configuration IT Kpi Dashboard For Monitoring Software Development Slides PDF
This slide shows software development project management dashboard. KPIs covered in the dashboard are status of planning, design, development, testing project launch date, project budget, overdue tasks, workload and upcoming deadlines. Deliver and pitch your topic in the best possible manner with this devops tools and configuration it kpi dashboard for monitoring software development slides pdf. Use them to share invaluable insights on project budget, planning, design, development and impress your audience. This template can be altered and modified as per your expectations. So, grab it now.

Building Promotional Campaign Real Estate Sales Real Estate Dashboard To Monitor Sales Team Performance Guidelines PDF
This slide portrays property management dashboard with KPIs namely, average days on market, properties for sale, properties for rent, sales vs. target and sales by region. Deliver and pitch your topic in the best possible manner with this building promotional campaign real estate sales real estate dashboard to monitor sales team performance guidelines pdf. Use them to share invaluable insights on property management kpi dashboard and impress your audience. This template can be altered and modified as per your expectations. So, grab it now.
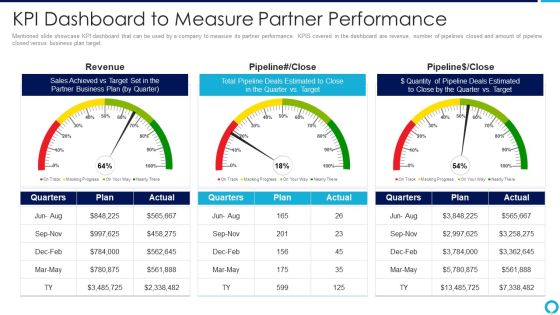
Partnership Management Strategies Kpi Dashboard To Measure Partner Performance Elements PDF
Mentioned slide showcase KPI dashboard that can be used by a company to measure its partner performance. KPIS covered in the dashboard are revenue, number of pipelines closed and amount of pipeline closed versus business plan target.Deliver an awe inspiring pitch with this creative partnership management strategies kpi dashboard to measure partner performance elements pdf bundle. Topics like sales achieved, partner business plan, total pipeline deals estimated can be discussed with this completely editable template. It is available for immediate download depending on the needs and requirements of the user.
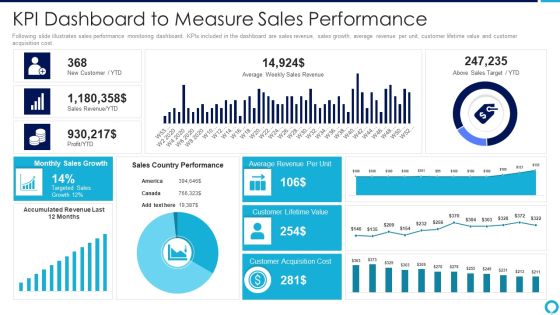
Partnership Management Strategies Kpi Dashboard To Measure Sales Performance Introduction PDF
Following slide illustrates sales performance monitoring dashboard. KPIs included in the dashboard are sales revenue, sales growth, average revenue per unit, customer lifetime value and customer acquisition cost.Deliver and pitch your topic in the best possible manner with this partnership management strategies kpi dashboard to measure sales performance introduction pdf Use them to share invaluable insights on average revenue, monthly sales growth, customer acquisition cost and impress your audience. This template can be altered and modified as per your expectations. So, grab it now.
Procurement Kpi Dashboard For Tracking Supplier Action Plan Impact Graphics PDF
This slide covers procurement spend analysis dashboard for tracking new supplier strategy results. It include KPIs such as invoice count, invoices information, due dates, spend by payment terms, supplier payment terms, spend by entity, spend by category, spend by country. Showcasing this set of slides titled procurement kpi dashboard for tracking supplier action plan impact graphics pdf. The topics addressed in these templates are procurement kpi dashboard for tracking supplier action plan impact. All the content presented in this PPT design is completely editable. Download it and make adjustments in color, background, font etc. as per your unique business setting.

Agile QA Procedure Dashboard For Tracking The Agile Quality Assurance Process Effectiveness Clipart PDF
This slide illustrates the KPI dashboard used for tracking the effectiveness of agile quality assurance model. KPIs covered in the dashboard are release and quality compliance, test functions and defects. Deliver and pitch your topic in the best possible manner with this agenda for agile qa procedure introduction pdf. Use them to share invaluable insights on dashboard for tracking the agile quality assurance process effectiveness and impress your audience. This template can be altered and modified as per your expectations. So, grab it now.

Client Achievements Playbook Customer Success KPI Dashboard To Measure Support Brochure PDF
Mentioned slide showcases customer success dashboard that company is currently using to measure its support team performance. KPIs covered in the dashboard are health score, retention cost, churn rate etc. Deliver an awe inspiring pitch with this creative client achievements playbook customer success kpi dashboard to measure support brochure pdf bundle. Topics like customer retention cost, current health score, customer churn rate, customer accounts, customer health can be discussed with this completely editable template. It is available for immediate download depending on the needs and requirements of the user.
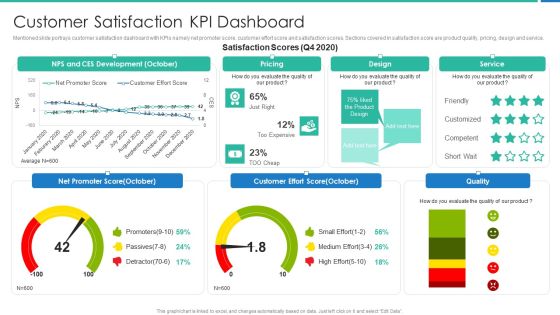
Strong Business Partnership To Ensure Company Success Customer Satisfaction KPI Dashboard Ideas PDF
Mentioned slide portrays customer satisfaction dashboard with KPIs namely net promoter score, customer effort score and satisfaction scores. Sections covered in satisfaction score are product quality, pricing, design and service.Deliver and pitch your topic in the best possible manner with this strong business partnership to ensure company success customer satisfaction kpi dashboard ideas pdf Use them to share invaluable insights on customer satisfaction kpi dashboard and impress your audience. This template can be altered and modified as per your expectations. So, grab it now.

Cryptocurrency Investment Playbook Dashboard To Effectively Track Bitcoin Performance Rules PDF
The following dashboard highlights key parameters that can be used by the organization to track the performance of their Bitcoin investment, it enlists major KPIs such as price of Bitcoin, transaction chart and its historical performance.Deliver and pitch your topic in the best possible manner with this cryptocurrency investment playbook dashboard to effectively track bitcoin performance rules pdf Use them to share invaluable insights on dashboard to effectively track bitcoin performance and impress your audience. This template can be altered and modified as per your expectations. So, grab it now.

Playbook For Application Developers Measuring Sprint Progress Using Agile Dashboard Mockup PDF
Mentioned slide showcases agile dashboard that can be used by project manager to track sprint progress. KPIs covered in the slide are overall sprint progress, statistics by priority and statistics by status.Deliver and pitch your topic in the best possible manner with this Playbook for application developers measuring sprint progress using agile dashboard mockup pdf. Use them to share invaluable insights on measuring sprint progress using agile dashboard and impress your audience. This template can be altered and modified as per your expectations. So, grab it now.
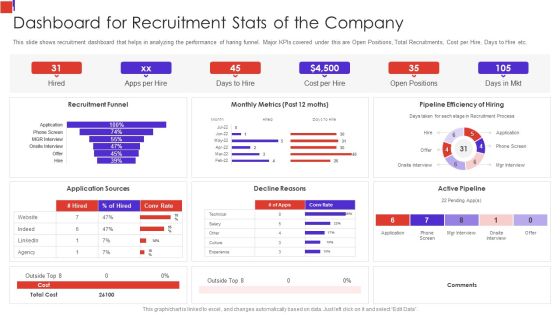
Outline Of Employee Recruitment Dashboard For Recruitment Stats Of The Company Formats PDF
This slide shows recruitment dashboard that helps in analyzing the performance of haring funnel. Major KPIs covered under this are Open Positions, Total Recruitments, Cost per Hire, Days to Hire etc.Deliver and pitch your topic in the best possible manner with this Outline Of Employee Recruitment Dashboard For Recruitment Stats Of The Company Formats PDF Use them to share invaluable insights on Dashboard For Recruitment, Stats Of The Company, Decline Reasons and impress your audience. This template can be altered and modified as per your expectations. So, grab it now.
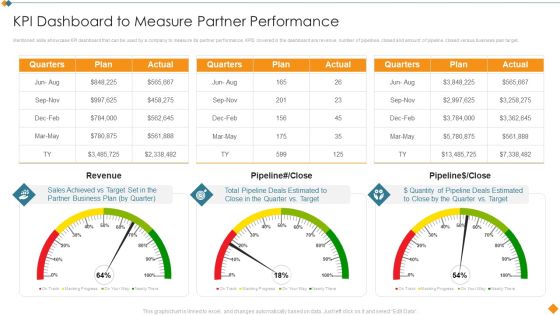
Maintaining Partner Relationships KPI Dashboard To Measure Partner Performance Structure PDF
Mentioned slide showcase KPI dashboard that can be used by a company to measure its partner performance. KPIS covered in the dashboard are revenue, number of pipelines closed and amount of pipeline closed versus business plan target. Deliver an awe inspiring pitch with this creative Maintaining Partner Relationships KPI Dashboard To Measure Partner Performance Structure PDF bundle. Topics like Quarters, Plan, Actual, Revenue, Pipeline can be discussed with this completely editable template. It is available for immediate download depending on the needs and requirements of the user.

Maintaining Partner Relationships KPI Dashboard To Measure Sales Performance Rules PDF
Following slide illustrates sales performance monitoring dashboard. KPIs included in the dashboard are sales revenue, sales growth, average revenue per unit, customer lifetime value and customer acquisition cost. Deliver and pitch your topic in the best possible manner with this Maintaining Partner Relationships KPI Dashboard To Measure Sales Performance Rules PDF. Use them to share invaluable insights on Sales Country Performance, Above Sales Target, YTD, Customer Lifetime Value, Customer Acquisition Cost and impress your audience. This template can be altered and modified as per your expectations. So, grab it now.
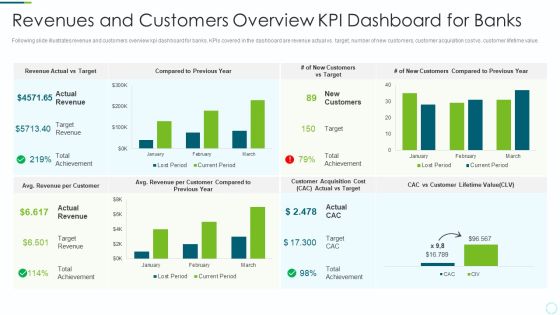
Implementing BPM Techniques Revenues And Customers Overview KPI Dashboard For Banks Microsoft PDF
Following slide illustrates revenue and customers overview kpi dashboard for banks. KPIs covered in the dashboard are revenue actual vs. target, number of new customers, customer acquisition cost vs. customer lifetime value. Deliver an awe inspiring pitch with this creative Implementing BPM Techniques Revenues And Customers Overview KPI Dashboard For Banks Microsoft PDF bundle. Topics like Target Revenue, Customers Compared, Customer Lifetime can be discussed with this completely editable template. It is available for immediate download depending on the needs and requirements of the user.

Implementing Agile Software Development Methodology For Cost Cutting IT Agile Dashboard Clipart PDF
Mentioned slide displays agile dashboard that can be used by organization to track sprint progress. KPIs covered here are overall sprint progress, statistics by priority and statistics by status.Deliver and pitch your topic in the best possible manner with this Implementing Agile Software Development Methodology For Cost Cutting IT Agile Dashboard Clipart PDF Use them to share invaluable insights on Agile Dashboard, Tracking Sprint, Progress and impress your audience. This template can be altered and modified as per your expectations. So, grab it now.

Guide To Client Success Customer Success KPI Dashboard To Measure Support Team Performance Topics PDF
Mentioned slide showcases customer success dashboard that company is currently using to measure its support team performance. Kpis covered in the dashboard are health score, retention cost, churn rate etc. Deliver an awe inspiring pitch with this creative Guide To Client Success Customer Success KPI Dashboard To Measure Support Team Performance Topics PDF bundle. Topics like Customer Churn Rate, Customer Retention Cost, Revenue can be discussed with this completely editable template. It is available for immediate download depending on the needs and requirements of the user.
 Home
Home