AI PPT Maker
Templates
PPT Bundles
Design Services
Business PPTs
Business Plan
Management
Strategy
Introduction PPT
Roadmap
Self Introduction
Timelines
Process
Marketing
Agenda
Technology
Medical
Startup Business Plan
Cyber Security
Dashboards
SWOT
Proposals
Education
Pitch Deck
Digital Marketing
KPIs
Project Management
Product Management
Artificial Intelligence
Target Market
Communication
Supply Chain
Google Slides
Research Services
 One Pagers
All Categories
-
Home
- Customer Favorites
- Dashboard
Dashboard

Data Representation Vector Icon Ppt PowerPoint Presentation Infographic Template Samples
Presenting this set of slides with name data representation vector icon ppt powerpoint presentation infographic template samples. This is a one stage process. The stages in this process are data visualization icon, research analysis, business focus. This is a completely editable PowerPoint presentation and is available for immediate download. Download now and impress your audience.
Visual Representation Of Data Ppt PowerPoint Presentation Icon Sample
Presenting this set of slides with name visual representation of data ppt powerpoint presentation icon sample. This is a one stage process. The stages in this process are data visualization icon, research analysis, business focus. This is a completely editable PowerPoint presentation and is available for immediate download. Download now and impress your audience.

How To Implement Data Lake In Aws Architecture Data Lake Creation With Hadoop Cluster Template PDF
This slide depicts the data lakes on AWS architecture through the data lake console and data lake command-line interface CLI and how S3 helps to provide storage services.Are you in need of a template that can accommodate all of your creative concepts This one is crafted professionally and can be altered to fit any style. Use it with Google Slides or PowerPoint. Include striking photographs, symbols, depictions, and other visuals. Fill, move around, or remove text boxes as desired. Test out color palettes and font mixtures. Edit and save your work, or work with colleagues. Download How To Implement Data Lake In Aws Architecture Data Lake Creation With Hadoop Cluster Template PDF and observe how to make your presentation outstanding. Give an impeccable presentation to your group and make your presentation unforgettable.
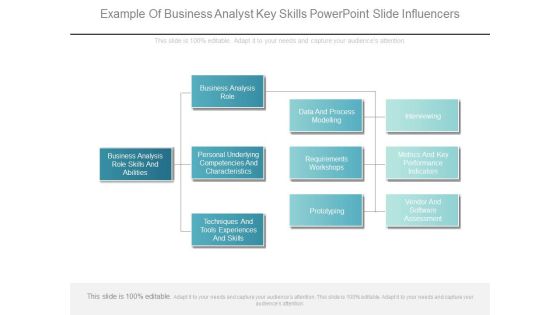
Example Of Business Analyst Key Skills Powerpoint Slide Influencers
This is a example of business analyst key skills powerpoint slide influencers. This is a three stage process. The stages in this process are business analysis role skills and abilities, business analysis role, personal underlying competencies and characteristics, techniques and tools experiences and skills, data and process modelling, requirements workshops, prototyping, interviewing, metrics and key performance indicators, vendor and software assessment.
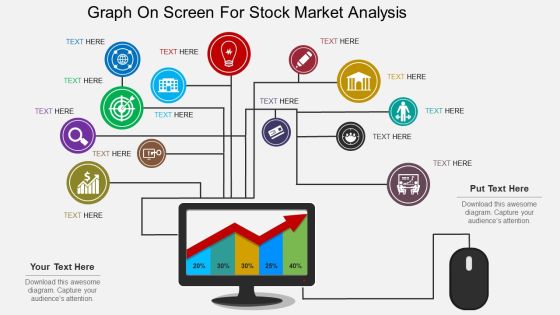
Graph On Screen For Stock Market Analysis Powerpoint Template
This PowerPoint slide contains computer screen with business graph. This professional slide may be used for visual explanation of data. Adjust the above diagram in your business presentations to give professional impact.
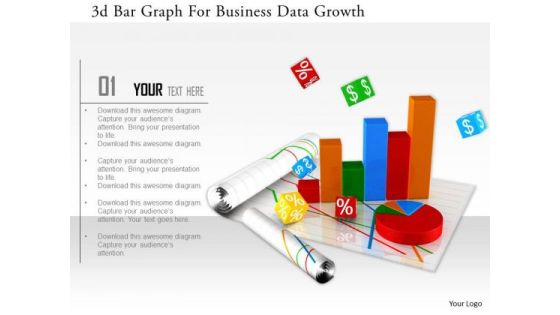
Stock Photo 3d Bar Graph For Business Data Growth Image Graphics For PowerPoint Slide
This image slide has graphics of financial charts and reports. This contains bar graph and pie chart to present business reports. Build an innovative presentations using this professional image slide.
Digital Marketing Campaign Performance Tracking Kpis Ppt Infographic Template Information PDF
This slide shows the key performance indicators to measure the success or failure of the marketing campaign held by the organization. It includes metrics such as click through rate, conversion rate, return on marketing investment, revenue generated, total customer acquisition etc. Boost your pitch with our creative Digital Marketing Campaign Performance Tracking Kpis Ppt Infographic Template Information PDF. Deliver an awe-inspiring pitch that will mesmerize everyone. Using these presentation templates you will surely catch everyones attention. You can browse the ppts collection on our website. We have researchers who are experts at creating the right content for the templates. So you do not have to invest time in any additional work. Just grab the template now and use them.

Competitive Analysis By Key Performance Indicators 2020 Inspiration PDF
The slide shows the comparison of major KPIs key performance indicators of the company with its competitors. Major KPIs include Revenue, net profit, number of flights, number of passengers, number of pilots etc. Deliver and pitch your topic in the best possible manner with this competitive analysis by key performance indicators 2020 inspiration pdf. Use them to share invaluable insights on comparison, revenue, net profit, number of flights, number of passengers and impress your audience. This template can be altered and modified as per your expectations. So, grab it now.

Current Performance Of Key Accounting Indicators Rules PDF
The slide provides the 2029 and 2020 data of various Key performance indicators KPIs of accounting. Major KPIs include free cash flow, accounts payable, invoice errors, net discount, days sale outstanding, days payable outstanding, operating cycle days etc. Deliver an awe inspiring pitch with this creative Current Performance Of Key Accounting Indicators Rules PDF bundle. Topics like Accounts Payable, Sales, Require, Material can be discussed with this completely editable template. It is available for immediate download depending on the needs and requirements of the user.
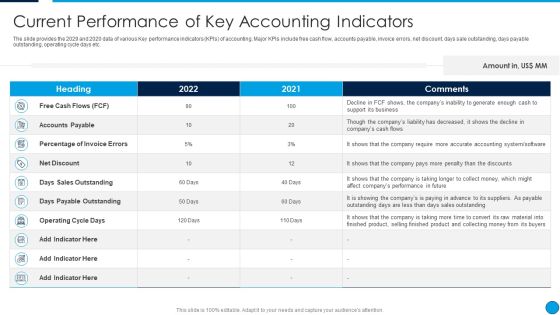
Summary Financial Current Performance Of Key Accounting Indicators Template PDF
The slide provides the 2029 and 2020 data of various Key performance indicators KPIs of accounting. Major KPIs include free cash flow, accounts payable, invoice errors, net discount, days sale outstanding, days payable outstanding, operating cycle days etc. Deliver an awe inspiring pitch with this creative Summary Financial Current Performance Of Key Accounting Indicators Template PDF bundle. Topics like Free Cash Flows, Accounts Payable, Percentage Of Invoice Errors, Net Discount can be discussed with this completely editable template. It is available for immediate download depending on the needs and requirements of the user.
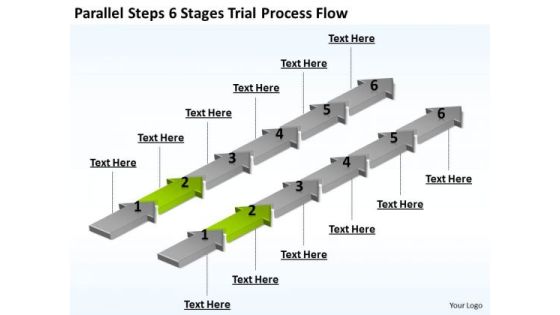
Parallel Data Processing Steps 6 Stages Trial Flow PowerPoint Templates
We present our parallel data processing steps 6 stages trial flow PowerPoint templates.Use our Arrows PowerPoint Templates because Our PowerPoint Templates and Slides are designed to help you succeed. They have all the ingredients you need. Download and present our Steps PowerPoint Templates because You can Bask in the warmth of our PowerPoint Templates and Slides. Enjoy the heartfelt glowing response of your listeners. Download and present our Success PowerPoint Templates because You will get more than you ever bargained for. Download our Process and Flows PowerPoint Templates because It can Bubble and burst with your ideas. Download our Flow Charts PowerPoint Templates because You canTake a leap off the starting blocks with our PowerPoint Templates and Slides. They will put you ahead of the competition in quick time.Use these PowerPoint slides for presentations relating to Arrows,business, chart, concept, connection,cycle, development, diagram, direction, element, environment, exchange, finance,financial, flow, graph, graphic, graphicpresentation, group, icon, illustration,investment, isolated, isometric, market, motion, movement, organization, process, processchart, recycle, report, sign, step, stock,success, symbol, vector. The prominent colors used in the PowerPoint template are Green lime, Gray, White. Presenters tell us our parallel data processing steps 6 stages trial flow PowerPoint templates are designed by a team of presentation professionals. Presenters tell us our connection PowerPoint templates and PPT Slides will get their audience's attention. Customers tell us our parallel data processing steps 6 stages trial flow PowerPoint templates will make the presenter successul in his career/life. Use our development PowerPoint templates and PPT Slides are designed by professionals Customers tell us our parallel data processing steps 6 stages trial flow PowerPoint templates look good visually. Presenters tell us our concept PowerPoint templates and PPT Slides are visually appealing.

Corporate Resource Planning What Is Cloud ERP System Inspiration PDF
This slide defines the cloud ERP system, how data is stored at cloud servers and accessed through web browsers. It also shows how it is beneficial to save costs.Presenting Corporate Resource Planning What Is Cloud ERP System Inspiration PDF to provide visual cues and insights. Share and navigate important information on three stages that need your due attention. This template can be used to pitch topics like Data Warehouse, Portable Devices, Internet Of Things In addtion, this PPT design contains high resolution images, graphics, etc, that are easily editable and available for immediate download.

It Operation Management Key Performance Indicators Template PDF
This slide covers various KPIs to monitor IT operations that help people inside the organization to make better decisions. The KPIs are service availability, mean time to resolve issue, online application availability, cost per production incident. Showcasing this set of slides titled It Operation Management Key Performance Indicators Template PDF. The topics addressed in these templates are Service Availability, Cost Per Production, Performance Indicators. All the content presented in this PPT design is completely editable. Download it and make adjustments in color, background, font etc. as per your unique business setting.

Warehouse Key Efficiency Indicators For Operations Management Slides PDF
This slide shows the table representing key metrics for measuring the performance of warehouse by the operations management team. It includes performance measurement of four activities of receiving, pick and pack, shipping and overall management of orders. Pitch your topic with ease and precision using this Warehouse Key Efficiency Indicators For Operations Management Slides PDF. This layout presents information on Operations Mgmt Shipping, Operations Mgmt. Receiving. It is also available for immediate download and adjustment. So, changes can be made in the color, design, graphics or any other component to create a unique layout.

Data Funnel Diagram Interest Analysis Ppt PowerPoint Presentation Complete Deck
Presenting this set of slides with name data funnel diagram interest analysis ppt powerpoint presentation complete deck. The topics discussed in these slides are interest, analysis, arrow, marketing, funnel. This is a completely editable PowerPoint presentation and is available for immediate download. Download now and impress your audience.

Key Performance Indicators To Track Effectiveness Of Healthcare Social Media Marketing Elements PDF
The following slide outlines various metrics that can assist medical care companies in analyzing success of social media marketing campaign on Facebook, Instagram, LinkedIn, YouTube, and Twitter. The KPIs are engagement rate, brand impressions, follower growth, post views, conversion rate, watch time, etc. Slidegeeks is here to make your presentations a breeze with Key Performance Indicators To Track Effectiveness Of Healthcare Social Media Marketing Elements PDF With our easy-to-use and customizable templates, you can focus on delivering your ideas rather than worrying about formatting. With a variety of designs to choose from, you are sure to find one that suits your needs. And with animations and unique photos, illustrations, and fonts, you can make your presentation pop. So whether you are giving a sales pitch or presenting to the board, make sure to check out Slidegeeks first
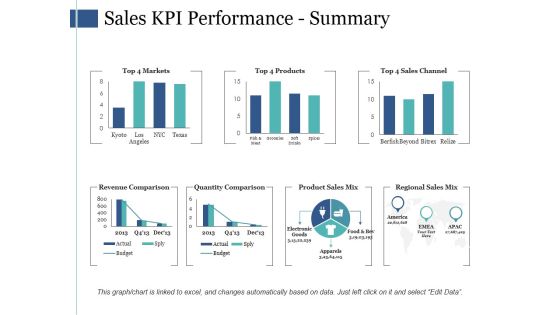
Sales Kpi Performance Summary Ppt PowerPoint Presentation Infographic Template Infographics
This is a sales kpi performance summary ppt powerpoint presentation infographic template infographics. This is a seven stage process. The stages in this process are revenue comparison, quantity comparison, product sales mix, regional sales mix.

Personal Data Visualization On Computer Screen Ppt PowerPoint Presentation Show Layout Ideas
Presenting this set of slides with name personal data visualization on computer screen ppt powerpoint presentation show layout ideas. This is a one stage process. The stages in this process are data visualization icon, research analysis, business focus. This is a completely editable PowerPoint presentation and is available for immediate download. Download now and impress your audience.
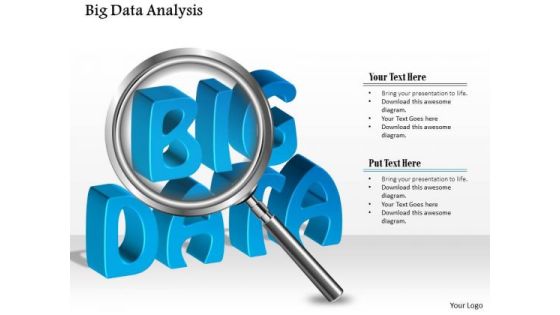
Business Diagram Big Data Analysis Using Magnifying Glass Analysis Ppt Slide
This unique diagram has been designed with graphic of magnifier on blue color text of bag data. This slide depicts concept of big data analysis. This professional diagram can be used for data communication and analysis related topics.
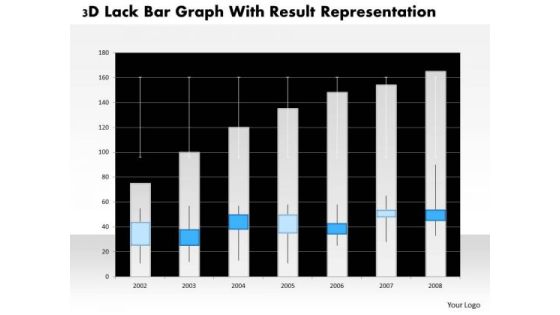
Business Diagram 3d Lack Bar Graph With Result Representation PowerPoint Slide
This business diagram has graphic of 3d lack bar graph. This diagram is a data visualization tool that gives you a simple way to present statistical information. This slide helps your audience examine and interpret the data you present.

Business Diagram Battery Connected With Bulb For Idea Generation PowerPoint Slide
This business slide displays battery icon connected with bulb. This diagram is a data visualization tool that gives you a simple way to present statistical information. This slide helps your audience examine and interpret the data you present.
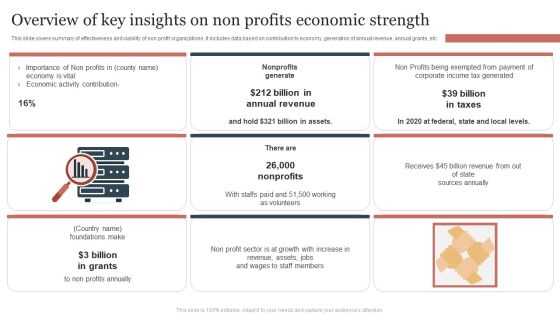
Overview Of Key Insights On Non Profits Economic Strength Summary PDF
This slide covers summary of effectiveness and viability of non profit organizations. It includes data based on contribution to economy, generation of annual revenue, annual grants, etc. Presenting Overview Of Key Insights On Non Profits Economic Strength Summary PDF to dispense important information. This template comprises threestages. It also presents valuable insights into the topics including Annual Revenue, Billion In Taxes, Non Profits. This is a completely customizable PowerPoint theme that can be put to use immediately. So, download it and address the topic impactfully.

8 Months Dissertation Preparation Roadmap Report Introduction PDF
This slide shows 10 weeks dissertation report timeline. It includes various tasks such as training, database setup, data collection, data analysis, etc. Showcasing this set of slides titled 8 Months Dissertation Preparation Roadmap Report Introduction PDF. The topics addressed in these templates are Database Setup, Preparation Of Manuscript, Data Analysis. All the content presented in this PPT design is completely editable. Download it and make adjustments in color, background, font etc. as per your unique business setting.

Data Analysis Helps In Making Business Decisions Graphics PDF
Presenting data analysis helps in making business decisions graphics pdf. to dispense important information. This template comprises four stages. It also presents valuable insights into the topics including informed decision making, effective marketing, reduced costs, efficient operations. This is a completely customizable PowerPoint theme that can be put to use immediately. So, download it and address the topic impactfully.

Data Warehousing IT What Is Data Mart Ppt Slides Guidelines PDF
This slide depicts the data mart type of data warehouse, its architecture, and how a single department manages it in an organization through limited sources of information. Deliver an awe inspiring pitch with this creative data warehousing it what is data mart ppt slides guidelines pdf bundle. Topics like business, human resources, finance, marketing, sales can be discussed with this completely editable template. It is available for immediate download depending on the needs and requirements of the user.

Business Diagram Human Mind Diagram With Pie Graph For Representation PowerPoint Slide
This diagram displays human face graphic divided into sections. This section can be used for data display. Use this diagram to build professional presentations for your viewers.

Business Diagram Six Staged Pie Charts For Text Representation PowerPoint Slide
This slide displays graphic six staged pie charts. Download this diagram to present and compare business data. Use this diagram to display business process workflows in any presentation.
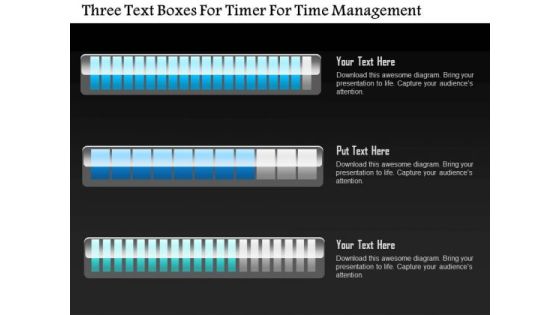
Business Diagram Three Text Boxes For Timer For Time Management PowerPoint Slide
This business diagram displays three text boxes. This diagram contains text boxes for data representation. Use this diagram to display business process workflows in any presentations.
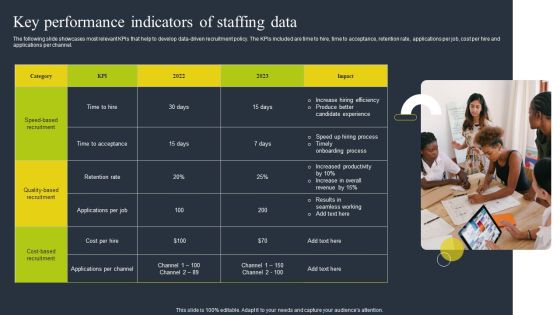
Key Performance Indicators Of Staffing Data Download PDF
The following slide showcases most relevant KPIs that help to develop data driven recruitment policy. The KPIs included are time to hire, time to acceptance, retention rate, applications per job, cost per hire and applications per channel. Persuade your audience using this Key Performance Indicators Of Staffing Data Download PDF. This PPT design covers one stages, thus making it a great tool to use. It also caters to a variety of topics including Quality Based Recruitment, Cost, Applications Per Channel. Download this PPT design now to present a convincing pitch that not only emphasizes the topic but also showcases your presentation skills.

Key Performance Indicators For Advertising And Promotion Plan Background PDF
This slide shows KPIs for measuring effectiveness of advertising and promotion plan for increasing overall revenue. It include KPIs such as conversion rate, cost per lead and social media management, etc. Persuade your audience using this Key Performance Indicators For Advertising And Promotion Plan Background PDF. This PPT design covers five stages, thus making it a great tool to use. It also caters to a variety of topics including Conversion Rate, Cost Per Lead, Social Media Management. Download this PPT design now to present a convincing pitch that not only emphasizes the topic but also showcases your presentation skills.
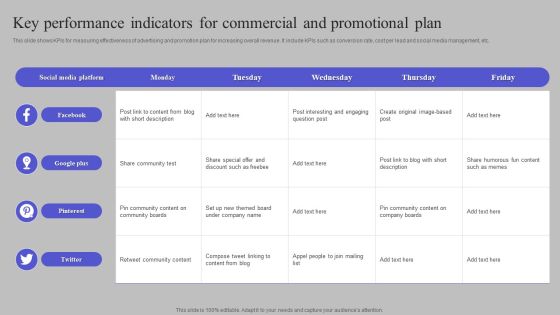
Key Performance Indicators For Commercial And Promotional Plan Information PDF
This slide shows KPIs for measuring effectiveness of advertising and promotion plan for increasing overall revenue. It include KPIs such as conversion rate, cost per lead and social media management, etc. Showcasing this set of slides titled Key Performance Indicators For Commercial And Promotional Plan Information PDF. The topics addressed in these templates are Facebook, Google Plus, Pinterest. All the content presented in this PPT design is completely editable. Download it and make adjustments in color, background, font etc. as per your unique business setting.

Business Diagram Business Intelligence Process Data Preparation Processing Reporting Ppt Slide
This technology diagram has been designed with graphic of computer server and databases with connectivity. This slide depicts the concept of business intelligence for data preparation. Download this diagram to build professional presentations.

Data Driven Customer Insights In Digital Marketing Diagram Example Of Ppt
This is data driven customer insights in digital marketing diagram example of ppt. This is a eight stage process. The stages in this process are digital marketing, situation analysis, market trend, review, objective setting, customer analysis, competitor, mission.
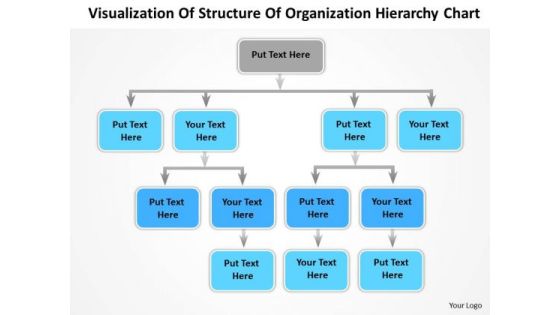
Timeline Visualization Of Structure Of Organization Hierarchy Chart
Timeline crunches are a fact of life. Meet all deadlines using our Timeline Visualization Of Structure Of Organization Hierarchy Chart. Connect the dots using our Timeline Visualization Of Structure Of Organization Hierarchy Chart. Fan expectations as the whole picture emerges.
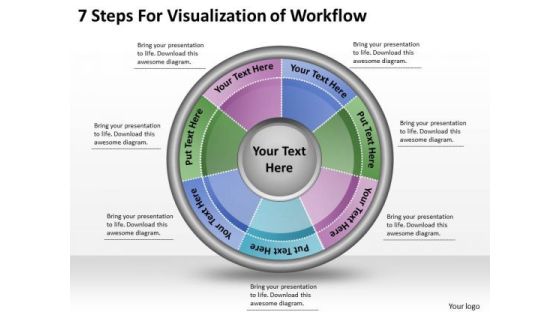
Timeline Ppt Template 7 Steps For Visualization Of Workflow
Get The Domestics Right With Our Timeline Ppt Template 7 Steps For Visualization Of Workflow Powerpoint Templates. Create The Base For Thoughts To Grow.

Business Sales Key Performance Indicators Report Ppt PowerPoint Presentation Icon Slideshow PDF
Showcasing this set of slides titled business sales key performance indicators report ppt powerpoint presentation icon slideshow pdf. The topics addressed in these templates are business sales key performance indicators report. All the content presented in this PPT design is completely editable. Download it and make adjustments in color, background, font etc. as per your unique business setting.

Call Center Key Performance Indicators Report Ppt PowerPoint Presentation Icon Images PDF
Pitch your topic with ease and precision using this call center key performance indicators report ppt powerpoint presentation icon images pdf. This layout presents information on call center key performance indicators report. It is also available for immediate download and adjustment. So, changes can be made in the color, design, graphics or any other component to create a unique layout.

Cumulative Sales Key Performance Indicators Report Ppt PowerPoint Presentation Model Images PDF
Showcasing this set of slides titled cumulative sales key performance indicators report ppt powerpoint presentation model images pdf. The topics addressed in these templates are cumulative sales key performance indicators report. All the content presented in this PPT design is completely editable. Download it and make adjustments in color, background, font etc. as per your unique business setting.

Investment Portfolio Key Performance Indicators Report Ppt PowerPoint Presentation Outline Smartart PDF
Showcasing this set of slides titled investment portfolio key performance indicators report ppt powerpoint presentation outline smartart pdf. The topics addressed in these templates are investment portfolio key performance indicators report. All the content presented in this PPT design is completely editable. Download it and make adjustments in color, background, font etc. as per your unique business setting.
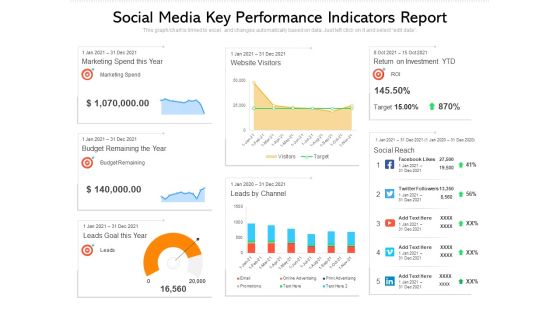
Social Media Key Performance Indicators Report Ppt PowerPoint Presentation Pictures Example File PDF
Pitch your topic with ease and precision using this social media key performance indicators report ppt powerpoint presentation pictures example file pdf. This layout presents information on social media key performance indicators report. It is also available for immediate download and adjustment. So, changes can be made in the color, design, graphics or any other component to create a unique layout.

Bar Graph To Compare Business Data PowerPoint Slides
This is the slide which can solve many purposes of yours. Be it growth in your company, need to show your company?s status in the market as compared to others, or how your business has improved so far. An ideal PowerPoint template to display all of these. You can easily use this graph to show the growth of your company using the percentage icons. You can use this visual to show the status of your company in the market in comparison with others. You can edit the icons and replace them with the logo of your company and the others. You can also show it to your colleagues how your company has built its image in the market or how it has improved over the time. A perfect bar graph image which needs to be included in your business PPT presentations.
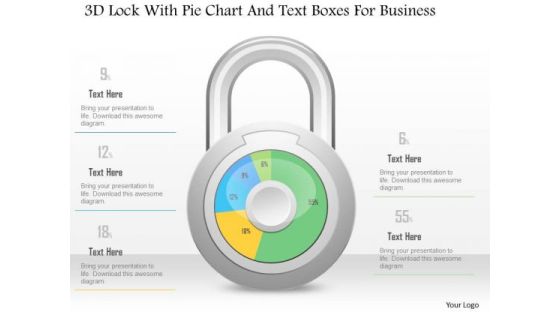
Business Diagram 3d Lock With Pie Chart And Text Boxes For Business PowerPoint Slide
This Power Point diagram has been crafted with pie chart in shape of lock. It contains diagram of lock pie chart to compare and present data in an effective manner. Use this diagram to build professional presentations for your viewers.

Business Diagram 3d Lock With Pie Graph For Result Representation PowerPoint Slide
This Power Point diagram has been crafted with pie chart in shape of lock. It contains diagram of lock pie chart to compare and present data in an effective manner. Use this diagram to build professional presentations for your viewers.

Business Diagram 3d Pencil With Text Boxes For Representation PowerPoint Slide
This Power Point diagram displays graphic of pencil with icons and text spaces. It contains diagram of colorful pencil for data display. Use this diagram to build professional presentations for your viewers.
Business Diagram Human Icons With Bubbles And Different Icons Inside PowerPoint Slide
This diagram displays graph with percentage value growth. This business slide is suitable to present and compare business data. Use this diagram to build professional presentations for your viewers.

Business Diagram Three Staged Pencil Diagram For Graph Formation PowerPoint Slide
This business diagram displays set of pencils. This Power Point template has been designed to compare and present business data. Download this diagram to represent stages of business growth.

Datasets For Statistics Projects Ppt PowerPoint Presentation Tips
This is a datasets for statistics projects ppt powerpoint presentation tips. This is a two stage process. The stages in this process are small data, big data, low volumes, into petabyte volumes, batch velocities, real time velocities.

Process Workflow Of Data Enablement Framework Across Organization Summary PDF
This slide illustrates work flowchart process for data enablement in organization. It includes data sources, data ingestion, streaming, data delivery, analytic applications, etc. Showcasing this set of slides titled Process Workflow Of Data Enablement Framework Across Organization Summary PDF. The topics addressed in these templates are Data Access, Virtualization, Data Delivery. All the content presented in this PPT design is completely editable. Download it and make adjustments in color, background, font etc. as per your unique business setting.

Business Data Science To Study Trends And Insights Ppt PowerPoint Presentation File Professional PDF
Various scientific methods of marketing science help the companies to analyse the piles of data identify for it will be easy for the executives to identify key. Presenting business data science to study trends and insights ppt powerpoint presentation file professional pdf. to dispense important information. This template comprises seven stages. It also presents valuable insights into the topics including important points, provide, important information, driver analysis, marketing. This is a completely customizable PowerPoint theme that can be put to use immediately. So, download it and address the topic impactfully.
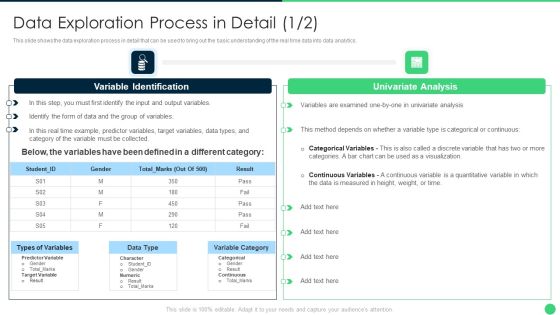
Processing Data Exploration Process In Detail Brochure PDF
This slide shows the data exploration process in detail that can be used to bring out the basic understanding of the real time data into data analytics.Deliver an awe inspiring pitch with this creative Processing Data Exploration Process In Detail Brochure PDF bundle. Topics like Variable Identification, Univariate Analysis, Categorical Or Continuous can be discussed with this completely editable template. It is available for immediate download depending on the needs and requirements of the user.
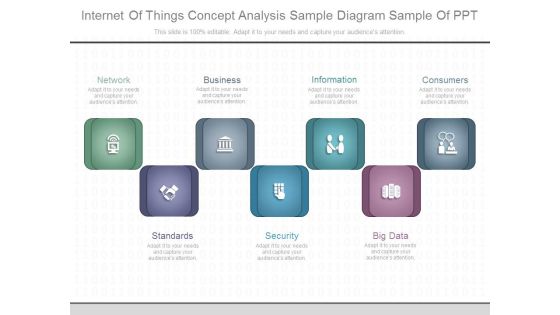
Internet Of Things Concept Analysis Sample Diagram Sample Of Ppt
This is a internet of things concept analysis sample diagram sample of ppt. This is a seven stage process. The stages in this process are network, business, information, consumers, standards, security, big data.

Team Dissertation Project Submission Roadmap Report Microsoft PDF
This slide shows 4 weeks dissertation team project submission timeline. It includes activities such as form team, select research methods, data analysis plan, submit proposal, etc. Pitch your topic with ease and precision using this Team Dissertation Project Submission Roadmap Report Microsoft PDF. This layout presents information on Team, Gather Data, Formulate Data Analysis Plan. It is also available for immediate download and adjustment. So, changes can be made in the color, design, graphics or any other component to create a unique layout.

Data And Customer Analysis Company Outline Development Initiatives Pictures PDF
This slide highlights the development initiatives to drive growth which includes new segments and markets, product innovation and platform automation. Make sure to capture your audiences attention in your business displays with our gratis customizable Data And Customer Analysis Company Outline Development Initiatives Pictures PDF. These are great for business strategies, office conferences, capital raising or task suggestions. If you desire to acquire more customers for your tech business and ensure they stay satisfied, create your own sales presentation with these plain slides.
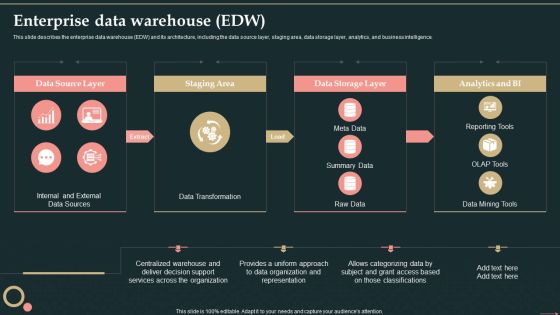
Management Information System Enterprise Data Warehouse EDW Formats PDF
This slide describes the enterprise data warehouse EDW and its architecture, including the data source layer, staging area, data storage layer, analytics, and business intelligence.Deliver an awe inspiring pitch with this creative Management Information System Enterprise Data Warehouse EDW Formats PDF bundle. Topics like Data Source, Staging Area, Data Storage can be discussed with this completely editable template. It is available for immediate download depending on the needs and requirements of the user.
Risk Management Strategy Icon With Plus Symbol Ppt PowerPoint Presentation Gallery Master Slide PDF
Persuade your audience using this risk management strategy icon with plus symbol ppt powerpoint presentation gallery master slide pdf. This PPT design covers three stages, thus making it a great tool to use. It also caters to a variety of topics including risk management strategy icon with plus symbol Download this PPT design now to present a convincing pitch that not only emphasizes the topic but also showcases your presentation skills.
Icon For Personnel Sourcing And Acquisition Strategy Clipart PDF
Persuade your audience using this Icon For Personnel Sourcing And Acquisition Strategy Clipart PDF This PPT design covers three stages, thus making it a great tool to use. It also caters to a variety of topics including Icon For Personnel Sourcing And Acquisition Strategy Download this PPT design now to present a convincing pitch that not only emphasizes the topic but also showcases your presentation skills.
Personnel Sourcing And Recruitment Process Icon Clipart PDF
Presenting Personnel Sourcing And Recruitment Process Icon Clipart PDF to dispense important information. This template comprises three stages. It also presents valuable insights into the topics including Personnel Sourcing And Recruitment Process Icon This is a completely customizable PowerPoint theme that can be put to use immediately. So, download it and address the topic impactfully.

Facilitating IT Intelligence Architecture Determine Overview Of Established Security Centre Introduction PDF
This slide provides information regarding the overview of security center associated with firms business units, management, steering committee, external and internal system. This is a Facilitating IT Intelligence Architecture Determine Overview Of Established Security Centre Introduction PDF template with various stages. Focus and dispense information on three stages using this creative set, that comes with editable features. It contains large content boxes to add your information on topics like Network Security Monitoring, Internal Systems, Steering Committee You can also showcase facts, figures, and other relevant content using this PPT layout. Grab it now.
Human Resource Management Responsibilities Recruitment Icon With Magnifying Glass Portrait PDF
Presenting Human Resource Management Responsibilities Recruitment Icon With Magnifying Glass Portrait PDF to dispense important information. This template comprises four stages. It also presents valuable insights into the topics including Human Resource Management Responsibilities Recruitment Icon With Magnifying Glass This is a completely customizable PowerPoint theme that can be put to use immediately. So, download it and address the topic impactfully.
Issue Escalation Plan Icon With Question Mark Pictures PDF
Presenting Issue Escalation Plan Icon With Question Mark Pictures PDF to dispense important information. This template comprises three stages. It also presents valuable insights into the topics including Issue Escalation, Plan Icon, Question Mark This is a completely customizable PowerPoint theme that can be put to use immediately. So, download it and address the topic impactfully.
