Dashboard

Transformation Toolkit Competitive Intelligence Information Analysis Priority Checklist For Data Analytics Program Inspiration PDF
The slide displays the to do list that allows to set the high priority task at first and least priority at last to ensure consistency and completeness while performing the process. Slidegeeks has constructed Transformation Toolkit Competitive Intelligence Information Analysis Priority Checklist For Data Analytics Program Inspiration PDF after conducting extensive research and examination. These presentation templates are constantly being generated and modified based on user preferences and critiques from editors. Here, you will find the most attractive templates for a range of purposes while taking into account ratings and remarks from users regarding the content. This is an excellent jumping off point to explore our content and will give new users an insight into our top notch PowerPoint Templates.
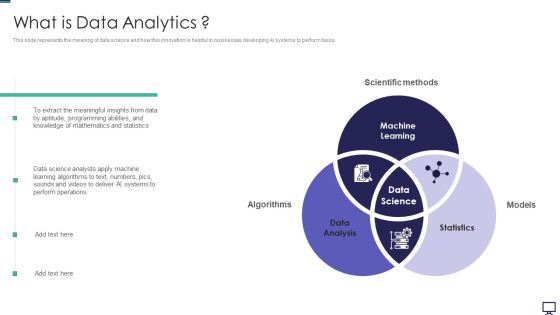
What Is Data Analytics Ppt Professional Slide PDF
This slide represents the meaning of data science and how this innovation is helpful in businesses developing AI systems to perform tasks. Presenting what is data analytics ppt professional slide pdf to provide visual cues and insights. Share and navigate important information on three stages that need your due attention. This template can be used to pitch topics like data analysis, statistics, machine learning. In addtion, this PPT design contains high resolution images, graphics, etc, that are easily editable and available for immediate download.
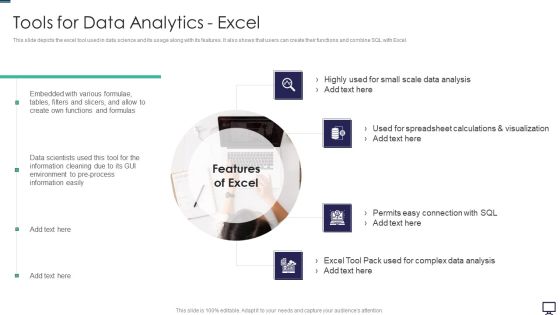
Tools For Data Analytics Excel Ppt Portfolio Brochure PDF
This slide depicts the excel tool used in data science and its usage along with its features. It also shows that users can create their functions and combine SQL with Excel. This is a tools for data analytics excel ppt portfolio brochure pdf template with various stages. Focus and dispense information on four stages using this creative set, that comes with editable features. It contains large content boxes to add your information on topics like environment, information, analysis, data. You can also showcase facts, figures, and other relevant content using this PPT layout. Grab it now.

Data Requirements For Analytics Impact On Business Performance Icons PDF
This slide illustrates data requirement analysis impact before and after data collection on business performance. It also includes benefits such as business process improvement, understanding of customer likings and prompt decision making. Showcasing this set of slides titled data requirements for analytics impact on business performance icons pdf. The topics addressed in these templates are goals, business, process. All the content presented in this PPT design is completely editable. Download it and make adjustments in color, background, font etc. as per your unique business setting.

Customer Centric Business Model Ppt Presentation
This is a customer centric business model ppt presentation. This is a four stage process. The stages in this process are success, arrows, business.

Actual Time Transaction Monitoring Software And Strategies TMS And Data Analytics Process Flow Icons PDF
This slide represents transaction monitoring system process flow. It provides information about data analytics, risk framework, alerting, ad hoc analysis, case management, external source entrance, stop list, politically exposed persons PEP, watch list, etc. There are so many reasons you need a Actual Time Transaction Monitoring Software And Strategies TMS And Data Analytics Process Flow Icons PDF. The first reason is you can not spend time making everything from scratch, Thus, Slidegeeks has made presentation templates for you too. You can easily download these templates from our website easily.
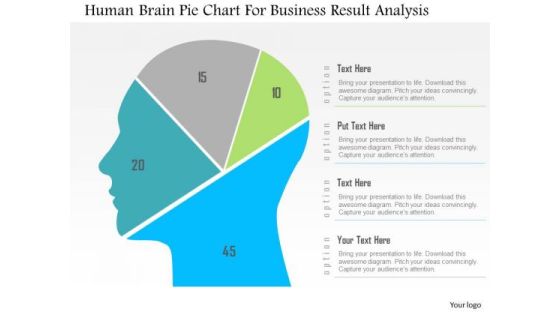
Business Diagram Human Brain Pie Chart For Business Result Analysis PowerPoint Slide
This diagram displays human face graphic divided into sections. This section can be used for data display. Use this diagram to build professional presentations for your viewers.

Google Cloud Service Models Big Data Product Suite On Google Cloud Platform Rules PDF
This slide talks about the suite of big data products on the google cloud platform. The purpose of this slide is to showcase the various big data products available on GCP. The main components include storage, ingestion, analytics, machine learning, and serving. Are you in need of a template that can accommodate all of your creative concepts This one is crafted professionally and can be altered to fit any style. Use it with Google Slides or PowerPoint. Include striking photographs, symbols, depictions, and other visuals. Fill, move around, or remove text boxes as desired. Test out color palettes and font mixtures. Edit and save your work, or work with colleagues. Download Google Cloud Service Models Big Data Product Suite On Google Cloud Platform Rules PDF and observe how to make your presentation outstanding. Give an impeccable presentation to your group and make your presentation unforgettable.
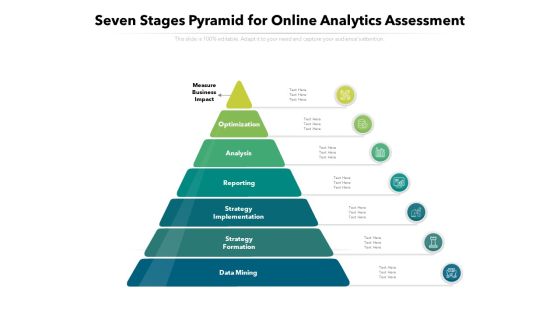
Seven Stages Pyramid For Online Analytics Assessment Ppt PowerPoint Presentation Summary Inspiration PDF
Presenting this set of slides with name seven stages pyramid for online analytics assessment ppt powerpoint presentation summary inspiration pdf. This is a seven stage process. The stages in this process are optimization, analysis, reporting, strategy implementation, strategy formation, data mining. This is a completely editable PowerPoint presentation and is available for immediate download. Download now and impress your audience.
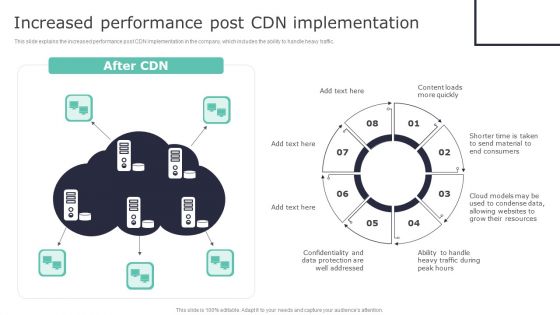
Deploying Content Distribution Network System Increased Performance Post CDN Infographics PDF
This slide explains the increased performance post CDN implementation in the company, which includes the ability to handle heavy traffic. This modern and well-arranged Deploying Content Distribution Network System Increased Performance Post CDN Infographics PDF provides lots of creative possibilities. It is very simple to customize and edit with the Powerpoint Software. Just drag and drop your pictures into the shapes. All facets of this template can be edited with Powerpoint, no extra software is necessary. Add your own material, put your images in the places assigned for them, adjust the colors, and then you can show your slides to the world, with an animated slide included.
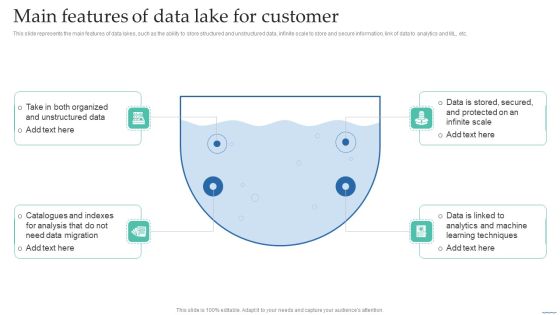
Main Features Of Data Lake For Customer Data Lake Creation With Hadoop Cluster Structure PDF
This slide represents the main features of data lakes, such as the ability to store structured and unstructured data, infinite scale to store and secure information, link of data to analytics and ML, etc.This modern and well-arranged Main Features Of Data Lake For Customer Data Lake Creation With Hadoop Cluster Structure PDF provides lots of creative possibilities. It is very simple to customize and edit with the Powerpoint Software. Just drag and drop your pictures into the shapes. All facets of this template can be edited with Powerpoint no extra software is necessary. Add your own material, put your images in the places assigned for them, adjust the colors, and then you can show your slides to the world, with an animated slide included.

Data Analytics Work Streams With Its Roles And Responsibilities Rules PDF
This slide highlights the key responsibilities, data work streams and. and data head roles for constructing data analytics project. Here you can discover an assortment of the finest PowerPoint and Google Slides templates. With these templates, you can create presentations for a variety of purposes while simultaneously providing your audience with an eye catching visual experience. Download Data Analytics Work Streams With Its Roles And Responsibilities Rules PDF to deliver an impeccable presentation. These templates will make your job of preparing presentations much quicker, yet still, maintain a high level of quality. Slidegeeks has experienced researchers who prepare these templates and write high quality content for you. Later on, you can personalize the content by editing the Data Analytics Work Streams With Its Roles And Responsibilities Rules PDF.

Business Diagram 3d Colorful Pie Graph With Magnifier Data Search PowerPoint Slide
This business slide displays 3d colorful pie graph with magnifier. This diagram is a data visualization tool that gives you a simple way to present statistical information. This slide helps your audience examine and interpret the data you present.

Business Diagram Data Driven Pie Chart Inside The Magnifier PowerPoint Slide
This business slide displays 3d colorful pie graph with magnifier. This diagram is a data visualization tool that gives you a simple way to present statistical information. This slide helps your audience examine and interpret the data you present.

Industry Analysis Report Powerpoint Slide Deck Template
This is a industry analysis report powerpoint slide deck template. This is a four stage process. The stages in this process are industry snapshot, brand safety, ad fraud, viewability, tra score.

Executing Advance Data Analytics At Workspace Determine Network Management Architecture Graphics PDF
This slide covers details regarding the network management architecture and standard network management platform including management data browser, network discovery, performance data collector. Deliver an awe inspiring pitch with this creative executing advance data analytics at workspace determine network management architecture graphics pdf bundle. Topics like determine network management architecture can be discussed with this completely editable template. It is available for immediate download depending on the needs and requirements of the user.
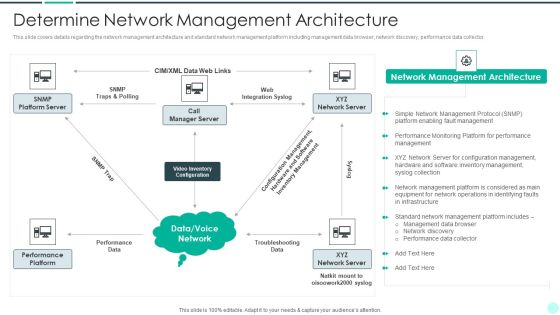
Executing Advance Data Analytics At Workspace Determine Network Management Architecture Brochure PDF
This slide covers details regarding the network management architecture and standard network management platform including management data browser, network discovery, performance data collector. Deliver an awe inspiring pitch with this creative executing advance data analytics at workspace determine network management architecture brochure pdf bundle. Topics like determine network management architecture can be discussed with this completely editable template. It is available for immediate download depending on the needs and requirements of the user.

Toolkit For Data Science And Analytics Transition RACI Matrix For Data Analyzing Project With Key Responsibilities Background PDF
The slide shows the roles and responsibilities of data analytics project by using responsible, accountable, consulted, and informed RACI Matrix. Whether you have daily or monthly meetings, a brilliant presentation is necessary. Toolkit For Data Science And Analytics Transition RACI Matrix For Data Analyzing Project With Key Responsibilities Background PDF can be your best option for delivering a presentation. Represent everything in detail using Toolkit For Data Science And Analytics Transition RACI Matrix For Data Analyzing Project With Key Responsibilities Background PDF and make yourself stand out in meetings. The template is versatile and follows a structure that will cater to your requirements. All the templates prepared by Slidegeeks are easy to download and edit. Our research experts have taken care of the corporate themes as well. So, give it a try and see the results.

Financial Ppt PowerPoint Presentation Outline Grid
This is a financial ppt powerpoint presentation outline grid. This is a three stage process. The stages in this process are business, strategy, marketing, analysis, finance, purchase, monthly.
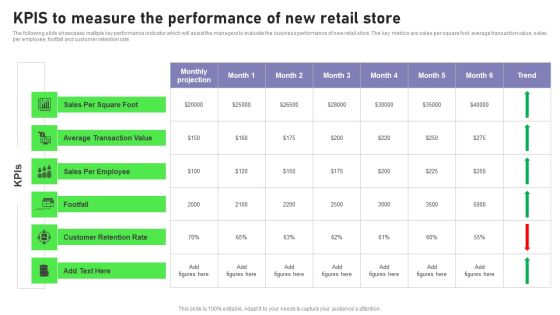
Retail Outlet Opening To Enhance Product Sale Kpis To Measure The Performance Infographics PDF
The following slide showcases multiple key performance indicator which will assist the managers to evaluate the business performance of new retail store. The key metrics are sales per square foot, average transaction value, sales per employee, footfall and customer retention rate. Slidegeeks is here to make your presentations a breeze with Retail Outlet Opening To Enhance Product Sale Kpis To Measure The Performance Infographics PDF With our easy to use and customizable templates, you can focus on delivering your ideas rather than worrying about formatting. With a variety of designs to choose from, you are sure to find one that suits your needs. And with animations and unique photos, illustrations, and fonts, you can make your presentation pop. So whether you are giving a sales pitch or presenting to the board, make sure to check out Slidegeeks first.
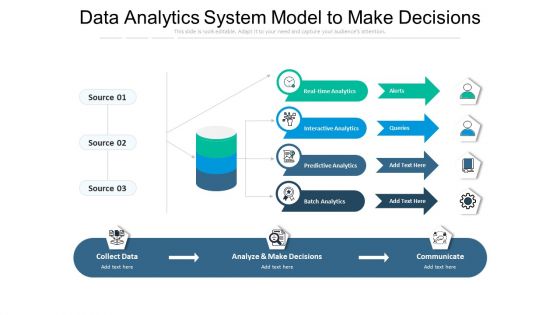
Data Analytics System Model To Make Decisions Ppt PowerPoint Presentation Summary Graphics PDF
Showcasing this set of slides titled data analytics system model to make decisions ppt powerpoint presentation summary graphics pdf. The topics addressed in these templates are collect data, analyze make decisions, communicate. All the content presented in this PPT design is completely editable. Download it and make adjustments in color, background, font etc. as per your unique business setting.

Various Components Of Batch Processing Architecture System Microsoft PDF
Mentioned slide highlights the different components of batch processing system. Data sources, data storage, batch processing, analytical data store, analytics and reporting are some of the major components used to manager large volume of data. Showcasing this set of slides titled Various Components Of Batch Processing Architecture System Microsoft PDF. The topics addressed in these templates are Data Storage, Batch Processing, Analytical Data Store. All the content presented in this PPT design is completely editable. Download it and make adjustments in color, background, font etc. as per your unique business setting.
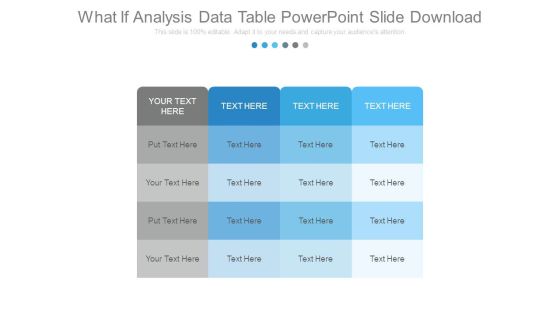
What If Analysis Data Table Powerpoint Slide Download
This is a what if analysis data table powerpoint slide download. This is a four stage process. The stages in this process are business, marketing, management, table.

Data Analysis Ppt PowerPoint Presentation Visual Aids Diagrams
This is a data analysis ppt powerpoint presentation visual aids diagrams. This is a six stage process. The stages in this process are build model, generate results and optimize, validate results, process and clean data, explore and visualize data, data mine.

Information Transformation Process Toolkit Key Reasons For Failure Of Data Analytics Project Portrait PDF
This slide describes a list of key reasons responsible for the failure of delivering accurate data analytics results to the business. Deliver an awe inspiring pitch with this creative Information Transformation Process Toolkit Key Reasons For Failure Of Data Analytics Project Portrait PDF bundle. Topics like Incorrect Business Objective, Insufficient Information, Inadequate Project Structure can be discussed with this completely editable template. It is available for immediate download depending on the needs and requirements of the user.
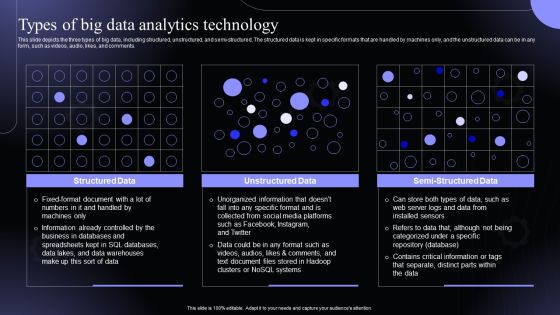
Types Of Big Data Analytics Technology Hyperautomation Software Solutions IT Background PDF
This slide depicts the three types of big data, including structured, unstructured, and semi-structured. The structured data is kept in specific formats that are handled by machines only, and the unstructured data can be in any form, such as videos, audio, likes, and comments.Find highly impressive Types Of Big Data Analytics Technology Hyperautomation Software Solutions IT Background PDF on Slidegeeks to deliver a meaningful presentation. You can save an ample amount of time using these presentation templates. No need to worry to prepare everything from scratch because Slidegeeks experts have already done a huge research and work for you. You need to download Types Of Big Data Analytics Technology Hyperautomation Software Solutions IT Background PDF for your upcoming presentation. All the presentation templates are 100precent editable and you can change the color and personalize the content accordingly. Download now,

Data Requirements For Analytics For Employees Recruitment Professional PDF
This slide provides information about the data requirement analysis for employees recruitment which include steps such as sourcing talent, onboarding and employees long term goals. Persuade your audience using this data requirements for analytics for employees recruitment professional pdf. This PPT design covers three stages, thus making it a great tool to use. It also caters to a variety of topics including recruitment, goals, employees. Download this PPT design now to present a convincing pitch that not only emphasizes the topic but also showcases your presentation skills.

Data Requirements For Analytics For Project Management Introduction PDF
This slide outlines multiple data requirement analysis techniques for project management such as mind mapping, delphi technique and facilitated workshops along with key activities to be conducted. Persuade your audience using this data requirements for analytics for project management introduction pdf. This PPT design covers four stages, thus making it a great tool to use. It also caters to a variety of topics including delphi technique, facilitated workshops, mind mapping. Download this PPT design now to present a convincing pitch that not only emphasizes the topic but also showcases your presentation skills.

Data Requirements For Analytics For Digital Transformation Summary PDF
This slide provides a relevant information about data requirement analysis pillars for implementing digital transformation. It includes pillars such as network evolution, customer experience and product innovation. Persuade your audience using this data requirements for analytics for digital transformation summary pdf. This PPT design covers one stages, thus making it a great tool to use. It also caters to a variety of topics including network evolution, customer experience, product innovation. Download this PPT design now to present a convincing pitch that not only emphasizes the topic but also showcases your presentation skills.

Impact Of Data Requirements For Analytics Training Background PDF
This slide outlines the impact of data requirement analysis training on business organization which includes benefits such as cost reduction, risk minimization and prompt decision making. Pitch your topic with ease and precision using this impact of data requirements for analytics training background pdf. This layout presents information on risk minimization, prompt decision making, cost reduction. It is also available for immediate download and adjustment. So, changes can be made in the color, design, graphics or any other component to create a unique layout.

Comparative Assessment Of Big Data Analytics Tools Template PDF
Following slide demonstrates comparative analysis of various data management software solutions which can be used by business for improving customer service. It includes key components such as tools, price, features, rating, platforms and comments. Showcasing this set of slides titled Comparative Assessment Of Big Data Analytics Tools Template PDF. The topics addressed in these templates are Price, Automatically Optimize, Parallel Processing. All the content presented in this PPT design is completely editable. Download it and make adjustments in color, background, font etc. as per your unique business setting.

Applications Of Big Data In Social Media Analytics Graphics PDF
This slide showcases use of big data in various fields and industries. This template focuses on connecting people and bringing them closer to one another through medium of social media. It includes information related to target audience, privacy concerns, etc. Showcasing this set of slides titled Applications Of Big Data In Social Media Analytics Graphics PDF Brochure. The topics addressed in these templates are Target Audience, Predictive Analysis, Performance Evaluation. All the content presented in this PPT design is completely editable. Download it and make adjustments in color, background, font etc. as per your unique business setting.

Procedure To Cure Disease Using Big Data Analytics Designs PDF
This slide showcase process to cure disease using big data analysis and use it for future preference to treat patients. It includes elements such as diagnose and collect, analyze and store, map and match, access and compute etc. Presenting Procedure To Cure Disease Using Big Data Analytics Designs PDF to dispense important information. This template comprises five stages. It also presents valuable insights into the topics including Patient, Compute, Collect. This is a completely customizable PowerPoint theme that can be put to use immediately. So, download it and address the topic impactfully.

Competitive Analysis By Key Performance Indicators 2020 Designs PDF
The slide shows the comparison of major KPIs key performance indicators of the company with its competitors. Major KPIs include Revenue, net profit, number of flights, number of passengers, number of pilots etc.Deliver an awe-inspiring pitch with this creative competitive analysis by key performance indicators 2020 designs pdf. bundle. Topics like net profits, revenue, number of passengers can be discussed with this completely editable template. It is available for immediate download depending on the needs and requirements of the user.

Competitive Analysis By Key Performance Indicators 2020 Professional PDF
The slide shows the comparison of major KPIs key performance indicators of the company with its competitors. Major KPIs include Revenue, net profit, number of flights, number of passengers, number of pilots etc. Deliver an awe inspiring pitch with this creative competitive analysis by key performance indicators 2020 professional pdf bundle. Topics like revenue, net profits can be discussed with this completely editable template. It is available for immediate download depending on the needs and requirements of the user.
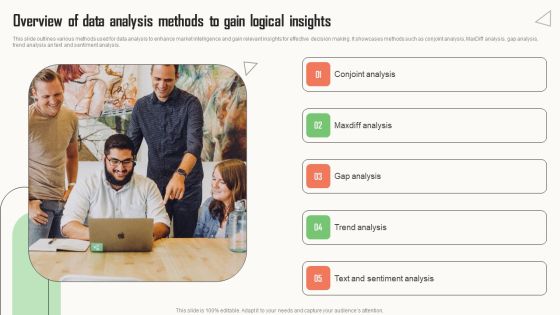
Strategic Market Insight Implementation Guide Overview Of Data Analysis Methods To Gain Logical Insights Themes PDF
This slide outlines various methods used for data analysis to enhance market intelligence and gain relevant insights for effective decision making. It showcases methods such as conjoint analysis, MaxDiff analysis, gap analysis, trend analysis an text and sentiment analysis. Take your projects to the next level with our ultimate collection of Strategic Market Insight Implementation Guide Overview Of Data Analysis Methods To Gain Logical Insights Themes PDF. Slidegeeks has designed a range of layouts that are perfect for representing task or activity duration, keeping track of all your deadlines at a glance. Tailor these designs to your exact needs and give them a truly corporate look with your own brand colors they will make your projects stand out from the rest.

Business Or Functional Data Steward Demonstration PDF
This slide talks about the business or functional data steward, including critical characteristics and considerations. It also contains examples of these data stewards, such as sales data stewards, marketing data stewards, and business and data analysts. Present like a pro with Business Or Functional Data Steward Demonstration PDF Create beautiful presentations together with your team, using our easy to use presentation slides. Share your ideas in real time and make changes on the fly by downloading our templates. So whether you are in the office, on the go, or in a remote location, you can stay in sync with your team and present your ideas with confidence. With Slidegeeks presentation got a whole lot easier. Grab these presentations today.

Ppt Slide 6 Approaches To Data Analysis Sales Plan
Get The Doers Into Action. Activate Them With Our PPT Slide 6 Approaches To Data Analysis Sales Plan Powerpoint Templates.
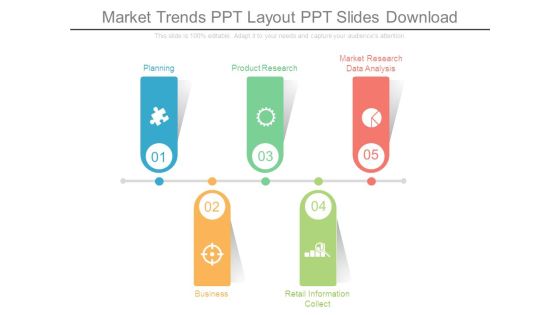
Market Trends Ppt Layout Ppt Slides Download
This is a market trends ppt layout ppt slides download. This is a five stage process. The stages in this process are planning, business, product research, retail information collect, market research data analysis.

Comprehensive Analysis Of Different Data Lineage Classification Data Lineage For Companys Management Download PDF
This slide depicts the data lineage for the companys management, including needs, initiatives, benefits, and types of data lineage that can be used. The benefits describe avoiding fines and lowering operational risks, streamlining data chains, and time-saving. Are you in need of a template that can accommodate all of your creative concepts This one is crafted professionally and can be altered to fit any style. Use it with Google Slides or PowerPoint. Include striking photographs, symbols, depictions, and other visuals. Fill, move around, or remove text boxes as desired. Test out color palettes and font mixtures. Edit and save your work, or work with colleagues. Download Comprehensive Analysis Of Different Data Lineage Classification Data Lineage For Companys Management Download PDF and observe how to make your presentation outstanding. Give an impeccable presentation to your group and make your presentation unforgettable.

Comprehensive Analysis Of Different Data Lineage Classification Tips For Evaluating Data Lineage Tools Pictures PDF
This slide represents the criteria tips for evaluating data lineage tools, including data sources, data lineage requirements, visualization features, and ease of implementation. The hosted services are the best tools since they do not require on premises implementation. Are you in need of a template that can accommodate all of your creative concepts This one is crafted professionally and can be altered to fit any style. Use it with Google Slides or PowerPoint. Include striking photographs, symbols, depictions, and other visuals. Fill, move around, or remove text boxes as desired. Test out color palettes and font mixtures. Edit and save your work, or work with colleagues. Download Comprehensive Analysis Of Different Data Lineage Classification Tips For Evaluating Data Lineage Tools Pictures PDF and observe how to make your presentation outstanding. Give an impeccable presentation to your group and make your presentation unforgettable.

Big Data Management Applications 3 Vs Ppt PowerPoint Presentation Deck
This is a big data management applications 3 vs ppt powerpoint presentation deck. This is a three stage process. The stages in this process are volume, velocity, variety, terabytes, structured, batch.

Magnifying Glass Gears Big Data Ppt PowerPoint Presentation Layouts Templates
Presenting this set of slides with name magnifying glass gears big data ppt powerpoint presentation layouts templates. This is a three stage process. The stages in this process are technology, marketing, planning, business, management. This is a completely editable PowerPoint presentation and is available for immediate download. Download now and impress your audience.
Magnifying Glass Big Data Ppt PowerPoint Presentation Icon Background
Presenting this set of slides with name magnifying glass big data ppt powerpoint presentation icon background. This is a one stage process. The stages in this process are magnifying glass, research, marketing, strategy, business. This is a completely editable PowerPoint presentation and is available for immediate download. Download now and impress your audience.
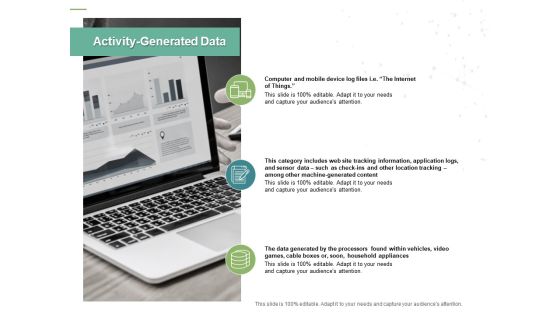
Activity Generated Data Server Ppt PowerPoint Presentation Model Mockup
Presenting this set of slides with name activity generated data server ppt powerpoint presentation model mockup. This is a three stage process. The stages in this process are technology, marketing, planning, business, management. This is a completely editable PowerPoint presentation and is available for immediate download. Download now and impress your audience.
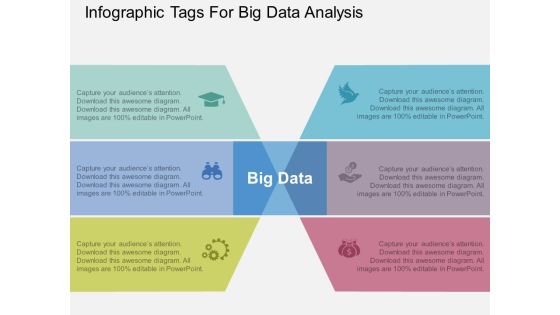
Infographic Tags For Big Data Analysis Powerpoint Template
Infographic tags have been displayed in this business slide. This PowerPoint template helps to exhibit big data analysis. Use this diagram to build an exclusive presentation.

Social Media Data Analysis Ppt PowerPoint Presentation Information
This is a social media data analysis ppt powerpoint presentation information. This is a eight stage process. The stages in this process are clock, measurement, process, management, business.
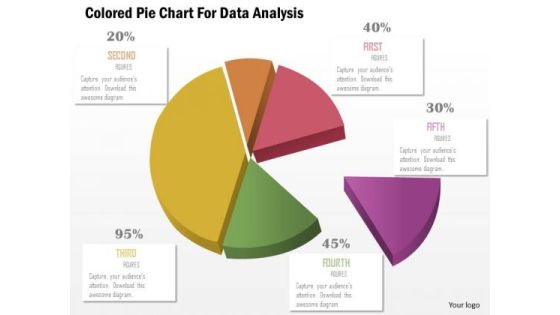
Business Diagram Colored Pie Chart For Data Analysis Presentation Template
This business slide displays pie chart. This diagram is a data visualization tool that gives you a simple way to present statistical information. This slide helps your audience examine and interpret the data you present.

data collection and analysis flow chart ppt powerpoint presentation microsoft
This is a data collection and analysis flow chart ppt powerpoint presentation microsoft. This is a nine stage process. The stages in this process are business, planning, marketing, strategy, management.

Oracle Cloud Data Analytics Administration IT Oracle Smart View For Microsoft Excel Information PDF
This slide depicts the oracle smart view for Microsoft Excel and allows users to examine, import, modify, distribute and share data across Microsoft Office interfaces. Deliver an awe inspiring pitch with this creative oracle cloud data analytics administration it oracle smart view for microsoft excel information pdf bundle. Topics like enterprise, performance, management, business, intelligence can be discussed with this completely editable template. It is available for immediate download depending on the needs and requirements of the user.
Key Performance Indicators For Tracking Social Media Strategy Elements PDF
This slide presents multiple KPIs used to track progress of social media strategy helpful in checking content progress. Total reach, total subscribers, social shares, bounce rate and conversion rate are important in tracking the growth of brand and branded content. Pitch your topic with ease and precision using this Key Performance Indicators For Tracking Social Media Strategy Elements PDF. This layout presents information on Community Growth Kpis, Engagement Rate Kpis, Product Advertisement. It is also available for immediate download and adjustment. So, changes can be made in the color, design, graphics or any other component to create a unique layout.
Business Diagram 3d Capsule With Multiple Icons For Business Data Flow PowerPoint Slide
This diagram has been designed with 3d graphic of capsule with multiple icons. This data driven PowerPoint slide can be used to give your presentations more effective look. It helps in clearly conveying your message to clients and audience.
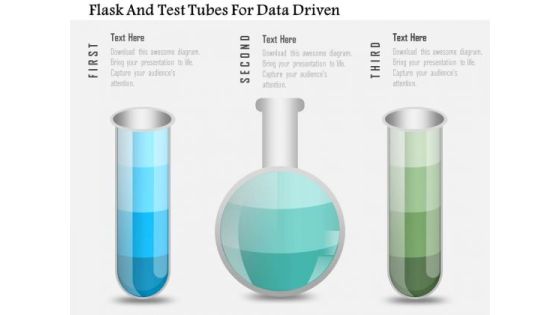
Business Diagram Flask And Test Tubes For Data Driven PowerPoint Slide
This data driven diagram has been designed with flask and test tubes. Download this diagram to give your presentations more effective look. It helps in clearly conveying your message to clients and audience.
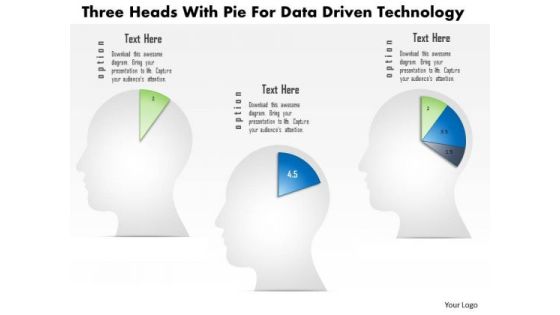
Business Diagram Three Heads With Pie For Data Driven Technology PowerPoint Slide
This business diagram displays three human faces with pie charts. This Power Point template has been designed to compare and present business data. You may use this diagram to impart professional appearance to your presentations.
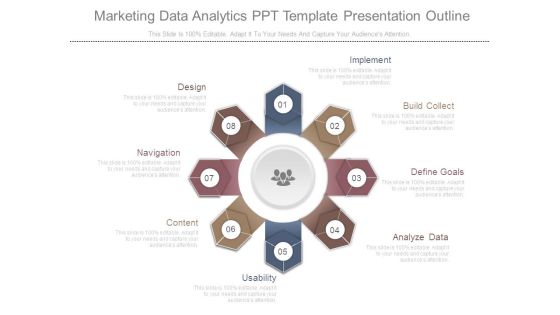
Marketing Data Analytics Ppt Template Presentation Outline
This is a marketing data analytics ppt template presentation outline. This is a eight stage process. The stages in this process are design, navigation, content, usability, analyze data, define goals, build collect, implement.

Quality Cost Report Comparison Template 2 Ppt PowerPoint Presentation Outline Maker
This is a quality cost report comparison template 2 ppt powerpoint presentation outline maker. This is a nine stage process. The stages in this process are defect type event occurrence, data collection date, location, name of data recorder, dates.
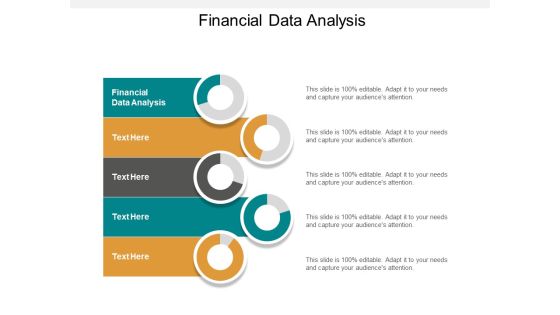
financial data analysis ppt powerpoint presentation infographics tips cpb
Presenting this set of slides with name financial data analysis ppt powerpoint presentation infographics tips cpb. This is a five stage process. The stages in this process are financial data analysis. This is a completely editable PowerPoint presentation and is available for immediate download. Download now and impress your audience.

Data Analysis Recruitment Ppt PowerPoint Presentation Professional Graphics Design Cpb
Presenting this set of slides with name data analysis recruitment ppt powerpoint presentation professional graphics design cpb. This is a six stage process. The stages in this process are data analysis recruitment. This is a completely editable PowerPoint presentation and is available for immediate download. Download now and impress your audience.

Data Warehousing IT SWOT Ppt Infographics Design Templates PDF
Presenting data warehousing it swot ppt infographics design templates pdf to provide visual cues and insights. Share and navigate important information on four stages that need your due attention. This template can be used to pitch topics like strength, weakness, opportunity, threat. In addtion, this PPT design contains high resolution images, graphics, etc, that are easily editable and available for immediate download.

Data Warehousing IT MPP Massively Parallel Processing Analytical Databases Ppt Slides Download PDF
This slide represents the massively parallel processing analytical database and how parallel processing is done across multiple servers. Deliver an awe inspiring pitch with this creative data warehousing it mpp massively parallel processing analytical databases ppt slides download pdf bundle. Topics like manufacturers, processing, servers, source can be discussed with this completely editable template. It is available for immediate download depending on the needs and requirements of the user.
 Home
Home