Dashboard

Four Stages Of Return Investment Model Engagement Ppt PowerPoint Presentation Inspiration Layout Ideas
Presenting this set of slides with name four stages of return investment model engagement ppt powerpoint presentation inspiration layout ideas. This is a four stage process. The stages in this process are dashboard, marketing, management, investment, analysis. This is a completely editable PowerPoint presentation and is available for immediate download. Download now and impress your audience.

Business Process Performance Indicators Ppt Slide Design
This is a business process performance indicators ppt slide design. This is a four stage process. The stages in this process are focus, objective, measures, targets, invites, vision and strategy, area of focus, metrics, targets, objectives.

Key Performance Indicators Template 2 Ppt PowerPoint Presentation Ideas Background Images
This is a key performance indicators template 2 ppt powerpoint presentation ideas background images. This is a four stage process. The stages in this process are objective, measures, targets, invites.
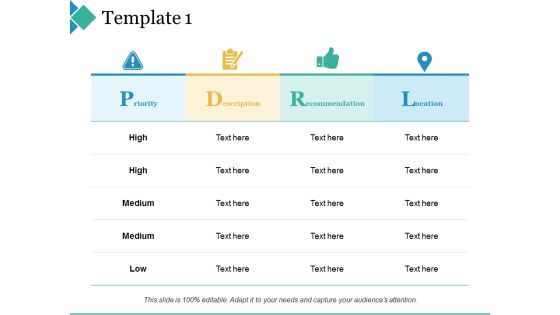
Template 1 Ppt PowerPoint Presentation Infographic Template Format Ideas
This is a template 1 ppt powerpoint presentation infographic template format ideas. This is a four stage process. The stages in this process are priority, description, recommendation, location.
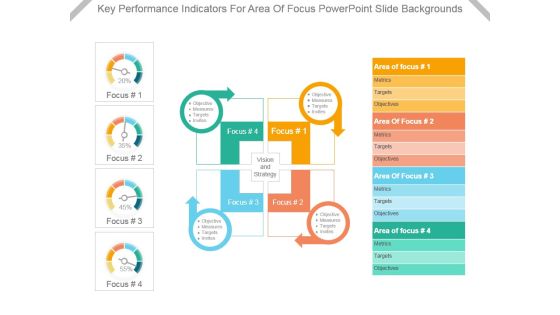
Key Performance Indicators For Area Of Focus Powerpoint Slide Backgrounds
This is a key performance indicators for area of focus powerpoint slide backgrounds. This is a four stage process. The stages in this process are area of focus, metrics, targets, objectives, focus, measures, invites, vision and strategy.

Customer Service Key Performance Indicators Ppt Example
This is a customer service key performance indicators ppt example. This is a three stage process. The stages in this process are overall satisfaction with service, satisfaction with value for money, overall satisfaction with relationship.

Our Key Performance Indicators Powerpoint Slide Designs
This is a our key performance indicators powerpoint slide designs. This is a five stage process. The stages in this process are cash flow, turnover, productivity, customer satisfaction, net income.

Data Visualization For Market Ppt Example
This is a data visualization for market ppt example. This is a six stage process. The stages in this process are tree map chart, exploded pie chart, semi circle chart, bubble chart, line chart, stacked chart, series.
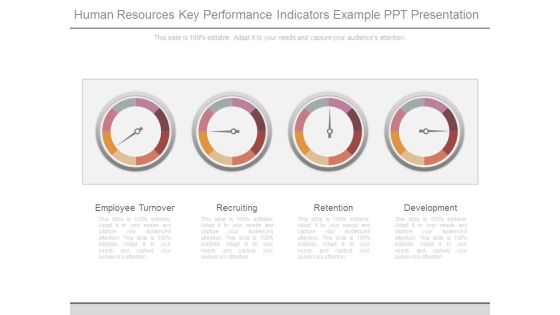
Human Resources Key Performance Indicators Example Ppt Presentation
This is a human resources key performance indicators example ppt presentation. This is a four stage process. The stages in this process are employee turnover, recruiting, retention, development.
Market Trends Chart With Icons Powerpoint Slides
This PowerPoint template has been designed with business info graphic chart. You may use this business slide design to display market trends. This PPT slide is powerful tool to describe your ideas.
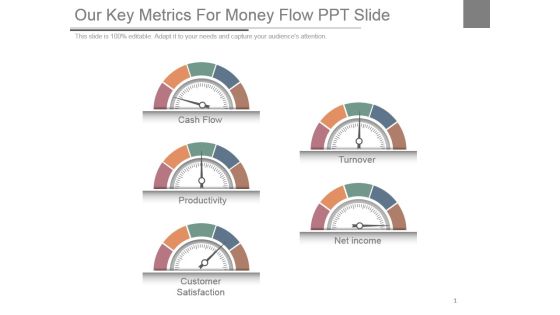
Our Key Metrics For Money Flow Ppt Slide
This is a our key metrics for money flow ppt slide. This is a five stage process. The stages in this process are cash flow, productivity, customer satisfaction, turnover, net income.
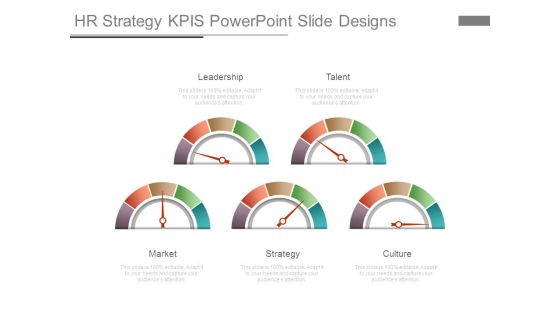
Hr Strategy Kpis Powerpoint Slide Designs
This is a hr strategy kpis powerpoint slide designs. This is a five stage process. The stages in this process are leadership, talent, market, strategy, culture.
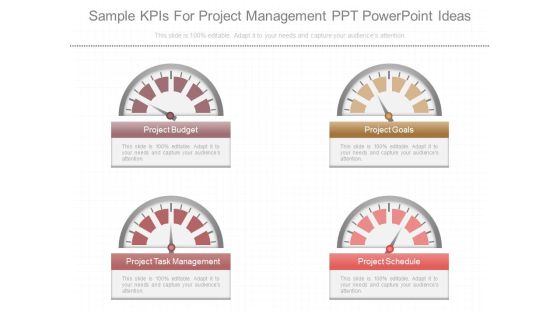
Sample Kpis For Project Management Ppt Powerpoint Ideas
This is a sample kpis for project management ppt powerpoint ideas. This is a four stage process. The stages in this process are project budget, project goals, project task management, project schedule.
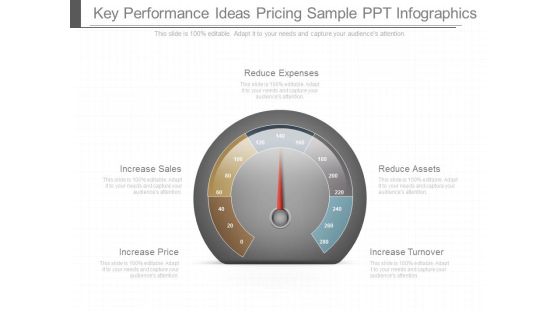
Key Performance Ideas Pricing Sample Ppt Infographics
This is a key performance ideas pricing sample ppt infographics. This is a five stage process. The stages in this process are increase price, increase sales, reduce expenses, reduce assets, increase turnover.

Three Stopwatches To Display Profit Trends Powerpoint Slides
This PowerPoint template has been designed with graphics of three stopwatches. Use this PPT slide to depict profit trends. Download this template to make impressive presentations.

Revenue Performance Reporting Speedometer Ppt PowerPoint Presentation Visuals
This is a revenue performance reporting speedometer ppt powerpoint presentation visuals. This is a four stage process. The stages in this process are speedometer, measurement, business, marketing, finance.
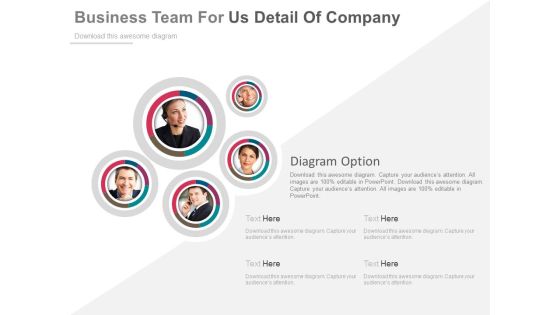
Illustration Of Customer Support Team Powerpoint Slides
On this template you can see team of five persons. This PowerPoint slide is an excellent tool for announcing the members of customer care team. Give a detailed introduction of your team with complete profile information.
Linear Steps Timeline Chart And Icons Powerpoint Slides
This PowerPoint template graphics of linear timeline steps. Download this PPT chart for yearly business performance analysis. This PowerPoint slide is of great help in the business sector to make realistic presentations and provides effective way of presenting your newer thoughts.
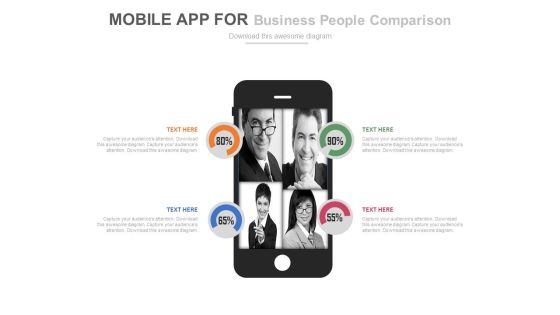
Mobile For Team Performance Analysis Powerpoint Slides
This PowerPoint template graphics of mobile with team members photos. Download this PPT slide for team performance analysis. This PowerPoint slide is of great help in the business sector to make realistic presentations and provides effective way of presenting your newer thoughts.
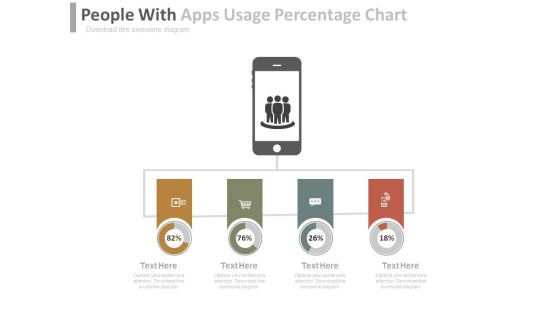
Team Efforts For Company Growth Powerpoint Slides
This PowerPoint template has been designed with mobile and four tags. Use this PPT slide to depict team efforts for companys growth. Download this template to make impressive presentations.
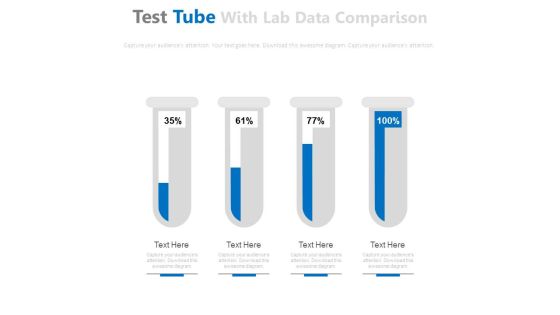
Test Tubes For Financial Ratio Analysis Powerpoint Slides
This PowerPoint template has been designed with graphics of test tubes. Use this PPT slide to depict financial ratio analysis. Download this PPT template to make impressive presentations.

Clock For Strategic Time Management And Business Vision Powerpoint Slides
Our above PPT slide contains flower clock design. This professional slide may be used to display strategic time management. Enlighten your audience with your breathtaking ideas.
Four Steps For Business Plans Outline Powerpoint Slides
Visually support your presentation with our above template containing four circles with icons. This diagram slide helps to display business plan outline. Etch your views in the brains of your audience with this diagram slide.
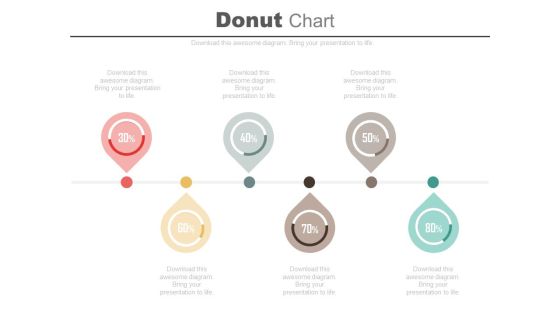
Six Pointers Percentage Timeline Diagram Powerpoint Slides
Profitability indicator ratios have been displayed this business slide. This PowerPoint template contains linear pointers timeline diagram. Use this professional diagram slide to build an exclusive presentation.
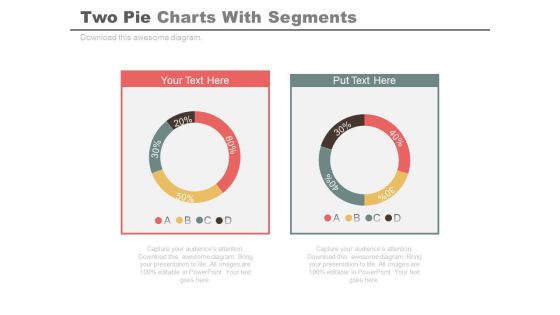
Two Pie Charts For Comparison And Analysis Powerpoint Slides
Develop competitive advantage with our above template of two pie charts. This PowerPoint diagram provides an effective way of displaying business information. You can edit text, color, shade and style as per you need.
World Map With Location Pointers And Icons Powerpoint Slides
Develop competitive advantage with our above template which contains world map with location pointers. This diagram provides an effective way of displaying geographical information. You can edit text, color, shade and style as per you need.
Four Circles With Percentage Values And Icons Powerpoint Slides
This PowerPoint template displays info graphic diagram of linear circles. This diagram may be used to exhibit financial growth and analysis. Grab center stage with this slide and capture the attention of your audience.
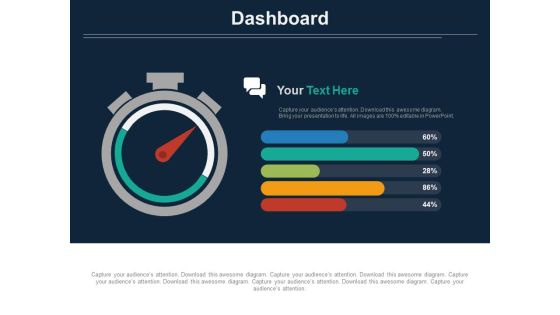
Stopwatch With Percentage Value Analysis Powerpoint Slides
The above template displays a diagram of stopwatch with percentage value. This diagram has been professionally designed to emphasize on time management. Grab center stage with this slide and capture the attention of your audience.

Circle Diagram With Team Icon Powerpoint Slides
This PowerPoint template has been designed with circle diagram and team icons. You may download this PPT slide to display team planning and strategy. This PowerPoint template helps to display your information in a useful, simple and orderly way.

Concentric Chart With Five Financial Steps Powerpoint Slides
This PowerPoint slide contains diagram of concentric chart with five financial steps This professional slide helps to exhibit financial planning for business. Use this PowerPoint template to make impressive presentations.

Financial Growth Analysis Circular Chart Powerpoint Slides
Visually support your presentation with our above template containing graphics of circular chart. This diagram slide helps to display financial growth analysis. Etch your views in the brains of your audience with this diagram slide.

Pie Charts For Market Segmentation Powerpoint Slides
This PowerPoint contains graphics of pie charts. Download this diagram slide to display market segmentations. This template is editable, You can edit text, color, shade and style of this diagram as per you need.

Pie Charts For Percentage Value Analysis Powerpoint Slides
Our above PPT slide displays graphics of Pie charts. This PowerPoint template may be used to display percentage value analysis. Download this template to leave permanent impression on your audience.
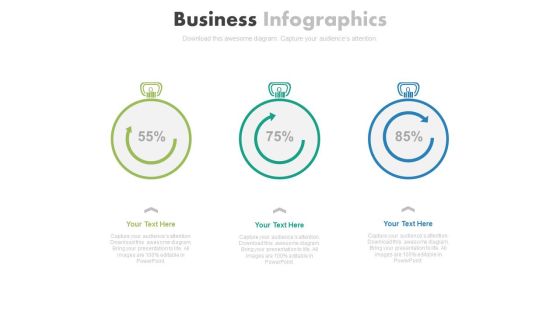
Three Stopwatches For Percentage Growth Powerpoint Slides
Three stopwatches have been displayed in this business slide. This business diagram helps to exhibit parameters of growth and development. Download this PowerPoint template to build an exclusive presentation.

Column Chart For Financial Analysis Powerpoint Slides
This PowerPoint template has been designed with graphics of column chart with percentage values. You may use this business slide design for topics like financial analysis and planning. This PPT slide is powerful tool to describe your ideas.

Assess Supply Market Powerpoint Slide Presentation Tips
This is a assess supply market powerpoint slide presentation tips. This is a six stage process. The stages in this process are define sourcing strategy, assess internal supply chain, execute sourcing strategy, assess supply market, assess opportunity, identify need.
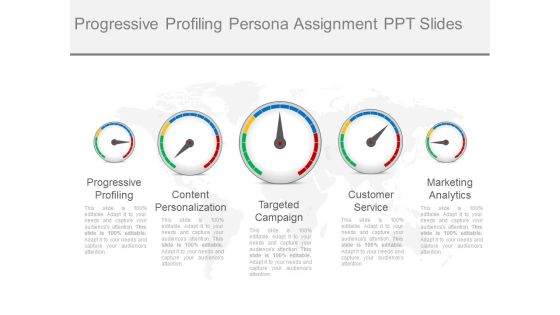
Progressive Profiling Persona Assignment Ppt Slides
This is a progressive profiling persona assignment ppt slides. This is a five stage process. The stages in this process are progressive profiling, content personalization, targeted campaign, customer service, marketing analytics.

Consensus Recommendations General Practitioners Ppt Slide
This is a consensus recommendations general practitioners ppt slide. This is a six stage process. The stages in this process are consensus recommendations, health care professionals, health agencies, professional societies, social media.

Critical Drivers Of Organizational Success Example Ppt Slide Template
This is a critical drivers of organizational success example ppt slide template. This is a seven stage process. The stages in this process are sale, productivity, expense control, cash flow, regulatory compliance, customer service, developmental projects.

Spectrum Of Customer Engagement Diagram Presentation
This is a spectrum of customer engagement diagram presentation. This is a six stage process. The stages in this process are open, click, lead, participate, join, convert.

Architecture Plan Powerpoint Slide Backgrounds
This is a architecture plan powerpoint slide backgrounds. This is a two stage process. The stages in this process are architecture plan, platforms release.

Sample Of White Label Saas Diagram Powerpoint Slide Backgrounds
This is a sample of white label saas diagram powerpoint slide backgrounds. This is a six stage process. The stages in this process are your brand, increase arup, business applications, combine ics and saas, grow customer base, shortest time to cloud.

Marketing Performance Measures Diagram Ppt Example
This is a marketing performance measures diagram ppt example. This is a four stage process. The stages in this process are low, moderate, good, maximum.
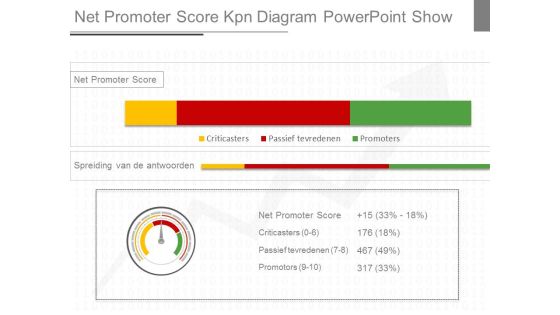
Net Promoter Score Kpn Diagram Powerpoint Show
This is a net promoter score kpn diagram powerpoint show. This is a three stage process. The stages in this process are net promoter score, criticasters, passief tevredenen, promoters, spreiding van de antwoorden.

Net Promoter Score Results Ppt Powerpoint Show
This is a net promoter score results ppt powerpoint show. This is a five stage process. The stages in this process are net promoter score, detractors, passief tevredenen, promotors, passives, response breakdown.
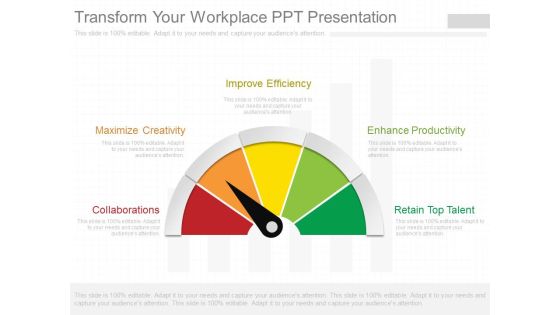
Transform Your Workplace Ppt Presentation
This is a transform your workplace ppt presentation. This is a five stage process. The stages in this process are collaborations, maximize creativity, improve efficiency, enhance productivity, retain top talent.

Customer Loyalty Marketing Survey Example Presentation Ideas
This is a customer loyalty marketing survey example presentation ideas. This is a four stage process. The stages in this process are sufficient, maximum, moderate, limited.

Customer Satisfaction Scores Layout Ppt Slides Download
This is a customer satisfaction scores layout ppt slides download. This is a six stage process. The stages in this process are loyalty index, net promoters score, overall experience, performance with employee, satisfaction with employee, satisfaction with wait time.

Design Thinking Process Example Powerpoint Slides
This is a design thinking process example powerpoint slides. This is a five stage process. The stages in this process are empathize, frame, ideate, prototype, test.

Sales Opportunity Metrics Template Presentation Design
This is a sales opportunity metrics template presentation design. This is a three stage process. The stages in this process are sales status, sales opportunities, sales product performance.

Supply Chain Metrics And Kpi Examples Presentation Visuals
This is a supply chain metrics and kpi examples presentation visuals. This is a four stage process. The stages in this process are carrying cost of inventory, inventory turnover, order tracking, rate of return.
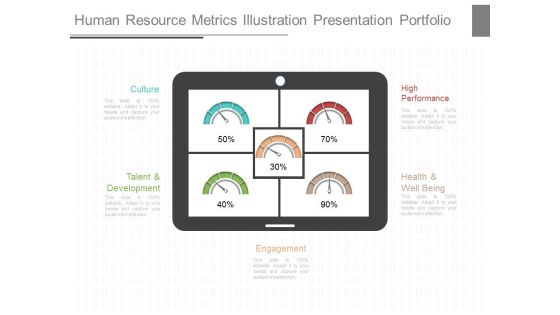
Human Resource Metrics Illustration Presentation Portfolio
This is a human resource metrics illustration presentation portfolio. This is a five stage process. The stages in this process are culture, high performance, talent and development, health and well being, engagement.
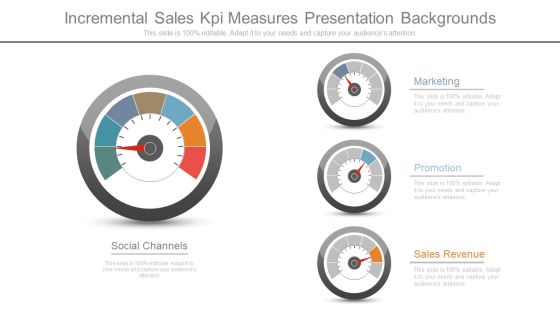
Incremental Sales Kpi Measures Presentation Backgrounds
This is a incremental sales kpi measures presentation backgrounds. This is a four stage process. The stages in this process are marketing, promotion, sales revenue, social channels.

Measuring Competency Template Ppt Samples Download
This is a measuring competency template ppt samples download. This is a four stage process. The stages in this process are knowledge, skill, performance, attitude.

Business Analysis Kpi Diagram Powerpoint Slides
This is a business analysis kpi diagram powerpoint slides. This is a one stage process. The stages in this process are performance level.

Business Departments Performance Metrics Ppt Slides
This is a business departments performance metrics ppt slides. This is a seven stage process. The stages in this process are engineering, construction, maintenance, operations, safety, finance, environment.

Business Process Metrics Ppt Sample Presentations
This is a business process metrics ppt sample presentations. This is a five stage process. The stages in this process are communication study, goal process, success, strategic system, sales review.

Customer Retention Kpi Measures Ppt Example
This is a customer retention kpi measures ppt example. This is a four stage process. The stages in this process are retained, new, converted, attrition.
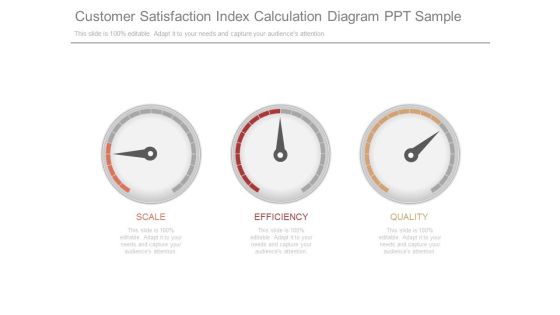
Customer Satisfaction Index Calculation Diagram Ppt Sample
This is a customer satisfaction index calculation diagram ppt sample. This is a three stage process. The stages in this process are scale, efficiency, quality.

Customer Engagement Level Display Powerpoint Layout
This is a customer engagement level display powerpoint layout. This is a one stage process. The stages in this process are low, medium, high, engagement.
 Home
Home