Dashboard

Team Performance Improvement Strategies Icon Ppt File Example Introduction PDF
Persuade your audience using this Team Performance Improvement Strategies Icon Ppt File Example Introduction PDF. This PPT design covers three stages, thus making it a great tool to use. It also caters to a variety of topics including Team Performance Improvement, Strategie,s Icon. Download this PPT design now to present a convincing pitch that not only emphasizes the topic but also showcases your presentation skills.

Customer Effort Score Indicator Icon To Measure Required Actions Ppt File Sample PDF
Persuade your audience using this Customer Effort Score Indicator Icon To Measure Required Actions Ppt File Sample PDF. This PPT design covers four stages, thus making it a great tool to use. It also caters to a variety of topics including Customer, Effort Score Indicator, Icon To Measure, Required Actions. Download this PPT design now to present a convincing pitch that not only emphasizes the topic but also showcases your presentation skills.

Undertaking Handover Strategy Icon For Project Transferred To New Manager Download PDF
Presenting Undertaking Handover Strategy Icon For Project Transferred To New Manager Download PDF to dispense important information. This template comprises three stages. It also presents valuable insights into the topics including Undertaking Handover Strategy Icon, Project Transferred New Manager. This is a completely customizable PowerPoint theme that can be put to use immediately. So, download it and address the topic impactfully.

Client Health Score Measurement Scale Icon Themes PDF
Persuade your audience using this Client Health Score Measurement Scale Icon Themes PDF. This PPT design covers four stages, thus making it a great tool to use. It also caters to a variety of topics including Client Health Score, Measurement Scale Icon. Download this PPT design now to present a convincing pitch that not only emphasizes the topic but also showcases your presentation skills.
Measuring Product Performance Using Client Health Score Icon Graphics PDF
Persuade your audience using this Measuring Product Performance Using Client Health Score Icon Graphics PDF. This PPT design covers four stages, thus making it a great tool to use. It also caters to a variety of topics including Measuring Product Performance, Using Client Health, Score Icon. Download this PPT design now to present a convincing pitch that not only emphasizes the topic but also showcases your presentation skills.

Sales Diagram Dashbaord Design To Communicate Effectively Marketing Diagram
Get Out Of The Dock With Our Sales Diagram Dashboard Design To Communicate Effectively Marketing Diagram Powerpoint Templates. Your Mind Will Be Set Free.

Strategy Diagram Dashbaord Design To Communicate Effectively Strategic Management
Document Your Views On Our Strategy Diagram Dashboard Design To Communicate Effectively Strategic Management Powerpoint Templates. They Will Create A Strong Impression.

Business Diagram Dashbaord Design To Communicate Effectively Marketing Diagram
Analyze Ailments On Our Business Diagram Dashboard Design To Communicate Effectively Marketing Diagram Powerpoint Templates. Bring Out The Thinking Doctor In You. Dock Your Thoughts With Our Business Diagram Dashboard Design To Communicate Effectively Marketing Diagram Powerpoint Templates. They Will Launch Them Into Orbit.

Parameters Of Growth And Development Powerpoint Slides
Dashboard design has been displayed in this business slide. This business diagram helps to exhibit parameters of growth and development. Download this PowerPoint template to build an exclusive presentation.
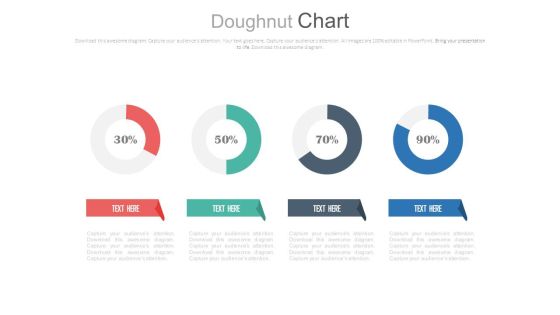
Four Circle Chart With Percentage Ratios Powerpoint Slides
This PowerPoint template has been designed with graphics of four circles and percentage ratios. You may use this dashboard slide design for topics like profit growth and financial planning. This PPT slide is powerful tool to describe your ideas.

Linear Circles Percentage Analysis Charts Powerpoint Slides
This PowerPoint template has been designed with graphics of three circles and percentage ratios. You may use this dashboard slide design for topics like profit growth and financial planning. This PPT slide is powerful tool to describe your ideas.

Four Steps For Financial Data Analysis Powerpoint Slides
This PowerPoint contains four circles with percentage values. Download this diagram slide to display financial data analysis. This template is editable, You can edit text, color, shade and style of this diagram as per you need.
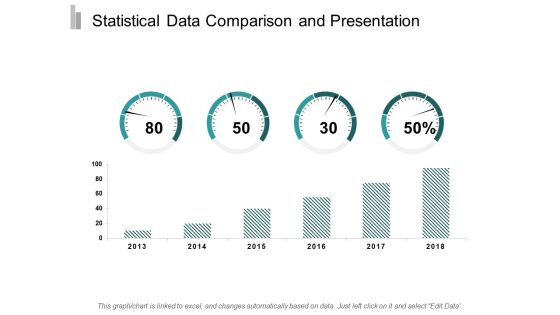
Statistical Data Comparison And Presentation Ppt Powerpoint Presentation Gallery Backgrounds
This is a statistical data comparison and presentation ppt powerpoint presentation gallery backgrounds. This is a two stage process. The stages in this process are data presentation, content presentation, information presentation.

Strategic Management Dashbaord Design To Communicate Effectively Strategy Diagram
Get Out Of The Dock With Our Strategic Management Dashbaord Design To Communicate Effectively Powerpoint Templates. Your Mind Will Be Set Free.
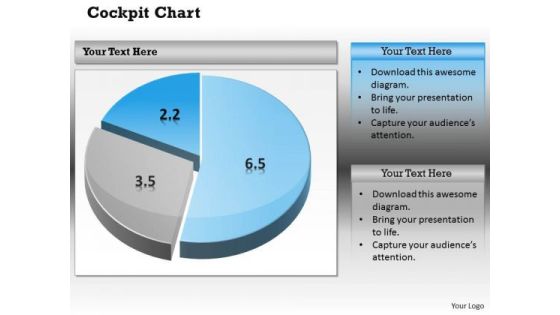
Business Cycle Diagram Pie Chart Dashborad Design Marketing Diagram
Document Your Views On Our Business Cycle Diagram Pie Chart Dashborad Design Marketing Diagram Powerpoint Templates. They Will Create A Strong Impression.
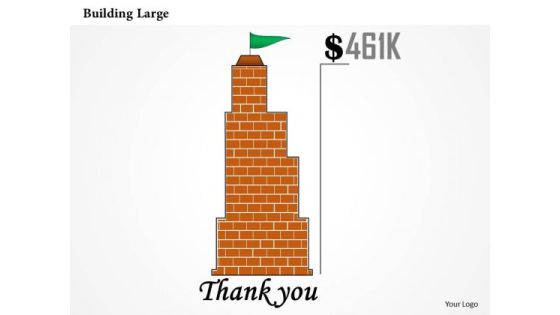
Strategy Diagram Design Of Red Large Building Business Diagram
Open Up Doors That Lead To Success. Our Strategy Diagram Design Of Red Large Building Business Diagram Powerpoint Templates Provide The Handles.

Strategy Diagram Meter Design For Business Progress Sales Diagram
Our Strategy Diagram Meter Design For Business Progress Sales Diagram Powerpoint Templates Abhor Doodling. They Never Let The Interest Flag.
Four Circles With Social Communication Icons Powerpoint Slides
Concept of social communication can be well explained with this power point template. This PPT slide contains the four circles with communication icons. Use this diagram slide to make impressive presentations.
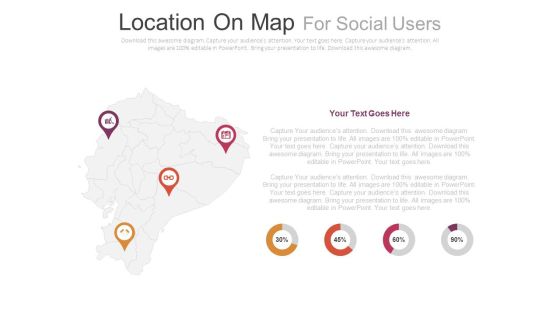
Four Locations On Map With Percentage Analysis Powerpoint Slides
This PowerPoint slide contains diagram of map with location pointers and icons. This professional slide helps to exhibit demographics of social media users. Use this PowerPoint template to make impressive presentations.
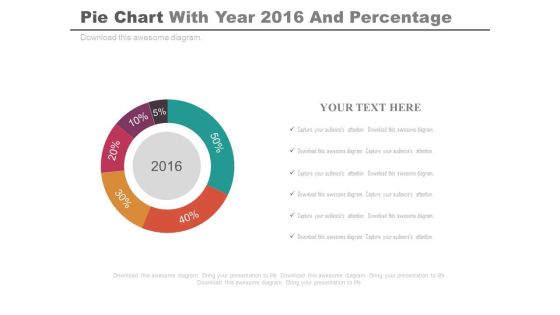
Pie Chart For Projected Profit Of 2016 Powerpoint Slides
Our above PPT slide displays graphics of Pie chart. This PowerPoint template may be used to display projected profit report of 2016. Download this template to leave permanent impression on your audience.
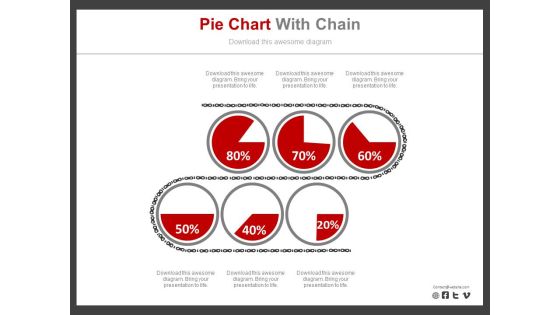
Six Pie Charts For Revenue Analysis Report Powerpoint Slides
Six pie charts have been displayed in this business slide. This business diagram helps to exhibit revenue analysis report. Download this PowerPoint template to build an exclusive presentation.
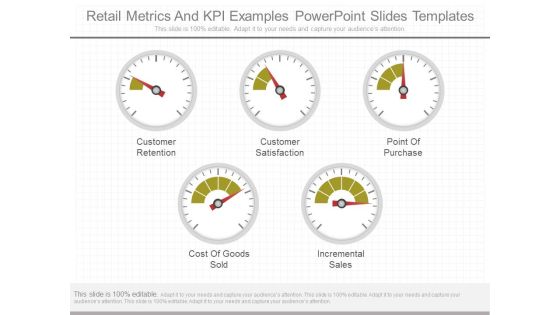
Retail Metrics And Kpi Examples Powerpoint Slides Templates
This is a retail metrics and kpi examples powerpoint slides templates. This is a five stage process. The stages in this process are customer retention, customer satisfaction, point of purchase, cost of goods sold, incremental sales.
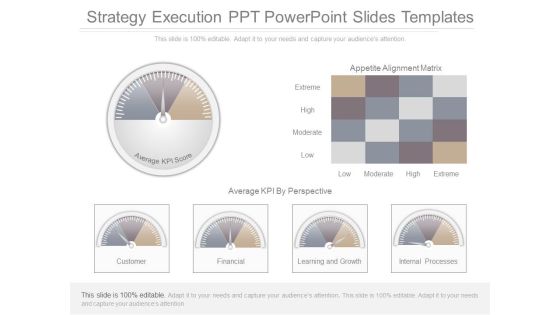
Strategy Execution Ppt Powerpoint Slides Templates
This is a strategy execution ppt powerpoint slides templates. This is a six stage process. The stages in this process are appetite alignment matrix, extreme, high, moderate, low, average kpi by prospective, customer, financial, learning and growth, internal processes, average kpi score.

Business Intelligence Concepts Diagram Example Of Ppt
This is a business intelligence concepts diagram example of ppt. This is a four stage process. The stages in this process are location, measuring, business, strategy, management.
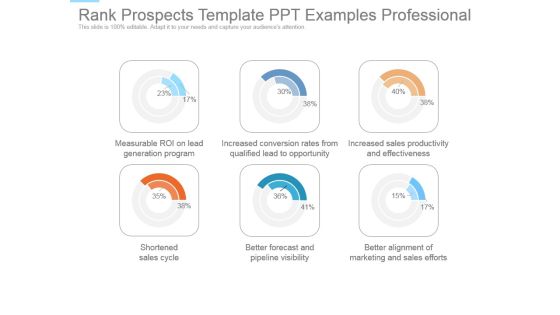
Rank Prospects Template Ppt Examples Professional
This is a rank prospects template ppt examples professional. This is a six stage process. The stages in this process are measurable roi on lead generation program, increased conversion rates from qualified lead to opportunity, increased sales productivity and effectiveness, shortened sales cycle, better forecast and pipeline visibility, better alignment of marketing and sales efforts.

Accelerator Meter Speed Icon Ppt Powerpoint Presentation Professional Good
This is a accelerator meter speed icon ppt powerpoint presentation professional good. This is a three stage process. The stages in this process are accelerator, seed accelerators, startup accelerator.

Accelerator Speed Meter Icon Ppt Powerpoint Presentation Outline Layout
This is a accelerator speed meter icon ppt powerpoint presentation outline layout. This is a four stage process. The stages in this process are accelerator, seed accelerators, startup accelerator.
Speed Level Meter Icon Ppt Powerpoint Presentation Inspiration Slides
This is a speed level meter icon ppt powerpoint presentation inspiration slides. This is a four stage process. The stages in this process are accelerator, seed accelerators, startup accelerator.
Speed Meter Vector Icon Ppt Powerpoint Presentation Model Inspiration
This is a speed meter vector icon ppt powerpoint presentation model inspiration. This is a four stage process. The stages in this process are accelerator, seed accelerators, startup accelerator.
Speedometer Vector Icon Ppt Powerpoint Presentation Gallery Objects
This is a speedometer vector icon ppt powerpoint presentation gallery objects. This is a four stage process. The stages in this process are accelerator, seed accelerators, startup accelerator.
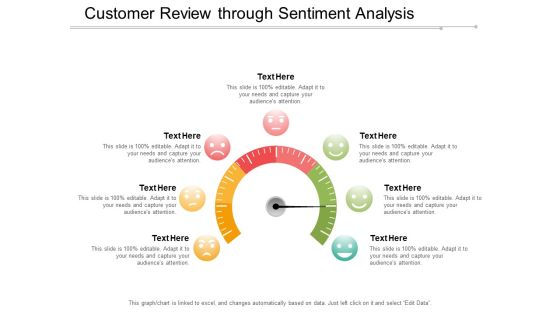
Customer Review Through Sentiment Analysis Ppt Powerpoint Presentation Show Design Templates
This is a customer review through sentiment analysis ppt powerpoint presentation show design templates. This is a six stage process. The stages in this process are feeling, emotion, sentiment.
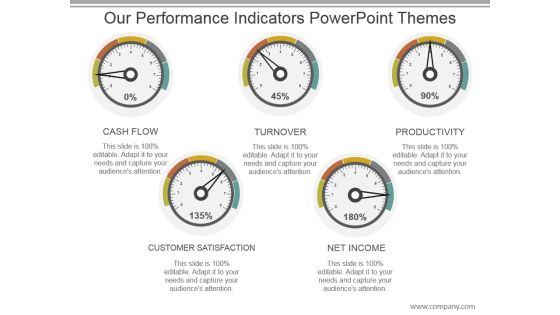
Our Performance Indicators Powerpoint Themes
This is a our performance indicators powerpoint themes. This is a five stage process. The stages in this process are cash flow, turnover, productivity, customer satisfaction, net income.
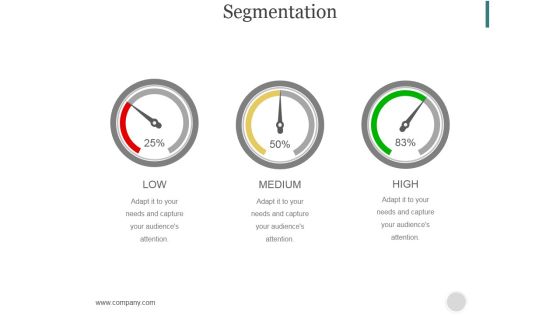
Segmentation Ppt PowerPoint Presentation Portfolio
This is a segmentation ppt powerpoint presentation portfolio. This is a three stage process. The stages in this process are low, medium, high.

Website Performance Review Template 1 Ppt PowerPoint Presentation Portfolio Master Slide
This is a website performance review template 1 ppt powerpoint presentation portfolio master slide. This is a five stage process. The stages in this process are traffic sources, site consumption trend, online transaction, average visit time, organic branded.

Website Performance Review Slide Ppt PowerPoint Presentation Example 2015
This is a website performance review slide ppt powerpoint presentation example 2015. This is a four stage process. The stages in this process are traffic source, online transaction, conversion rate, average visit time.

Customer Service Benchmarking Diagram Ppt PowerPoint Presentation Design Ideas
This is a customer service benchmarking diagram ppt powerpoint presentation design ideas. This is a four stage process. The stages in this process are benchmarking, dashbord, business, marketing, strategy.
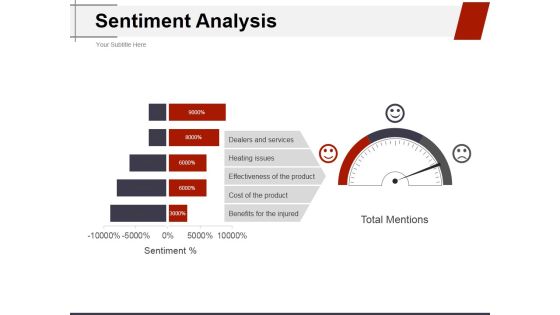
Sentiment Analysis Ppt PowerPoint Presentation Ideas Structure
This is a sentiment analysis ppt powerpoint presentation ideas structure. This is a three stage process. The stages in this process are dealers and services, heating issues, effectiveness of the product, cost of the product, benefits for the injured.
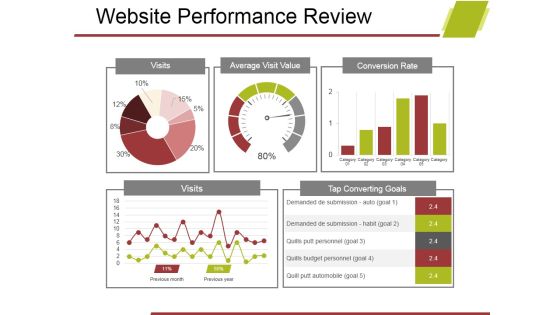
Website Performance Review Template 2 Ppt PowerPoint Presentation Model File Formats
This is a website performance review template 2 ppt powerpoint presentation model file formats. This is a five stage process. The stages in this process are visits, average visit value, conversion rate, visits, tap converting goals.

Cons Of Crowdfunding Ppt PowerPoint Presentation Gallery Layout Ideas
This is a cons of crowdfunding ppt powerpoint presentation gallery layout ideas. This is a five stage process. The stages in this process are disadvantages, time consuming, unrealistic expectations, hard work, chances you wont get funded, lots of planning required.
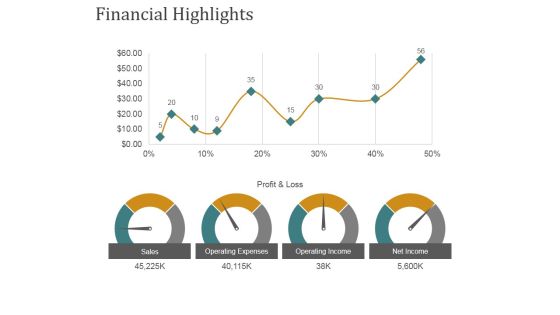
Financial Highlights Template 1 Ppt PowerPoint Presentation Gallery Templates
This is a financial highlights template 1 ppt powerpoint presentation gallery templates. This is a four stage process. The stages in this process are sales, operating expenses, operating income, net income.

Product Quality Check Ppt PowerPoint Presentation Show Background
This is a product quality check ppt powerpoint presentation show background. This is a five stage process. The stages in this process are bad, poor, average, good, excellent.

Comparison Ppt PowerPoint Presentation Professional Slide Download
This is a comparison ppt powerpoint presentation professional slide download. This is a two stage process. The stages in this process are business, marketing, planning, comparison, percentage.
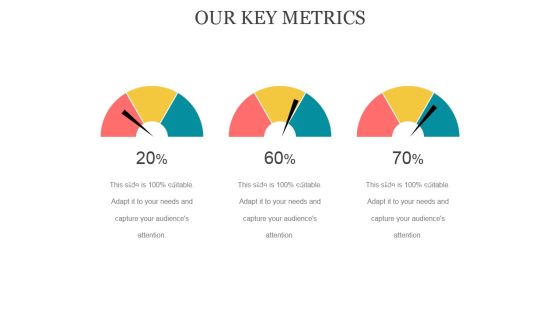
Our Key Metrics Ppt PowerPoint Presentation Styles
This is a our key metrics ppt powerpoint presentation styles. This is a three stage process. The stages in this process are business, marketing, dashboard, planning, analysis.

Key Performance Indicators Template 3 Ppt PowerPoint Presentation Graphics
This is a key performance indicators template 3 ppt powerpoint presentation graphics. This is a four stage process. The stages in this process are objective, measures, targets, invites, vision and strategy.

Circles With Team Photos Powerpoint Slides
This dashboard template contains graphics of circles with team photos. This dashboard PowerPoint template conveys employees performance in a visual manner. Download this PPT slide for quick decision-making.

Employee Performance Information Chart Powerpoint Slides
This dashboard template contains employee picture with percentage slides. This dashboard PowerPoint template conveys employees performance in a visual manner. Download this PPT slide for quick decision-making.

Employee Photo With Percentage Bars Powerpoint Slides
This dashboard template contains employee photo with percentage bars. This dashboard PowerPoint template conveys employees performance in a visual manner. Download this PPT slide for quick decision-making.
Pie Chart With Icons For Business Analysis Powerpoint Slides
This dashboard template contains graphics of pie chart with icons. This dashboard PowerPoint template helps to display business analysis in a visual manner. Download this template to make impressive presentations.

Four Steps Circular Infographic Powerpoint Slides
This innovative, stunningly beautiful dashboard has been designed for data visualization. It contains circular infographic design. This PowerPoint template helps to display your information in a useful, simple and orderly way.

Four Companies With Web Services Powerpoint Slides
This PowerPoint template display graphics of four corporate buildings. You may use this PPT slide for financial and strategic analysis for web services companies. This dashboard slide may useful for multilevel status report creation and approval process.
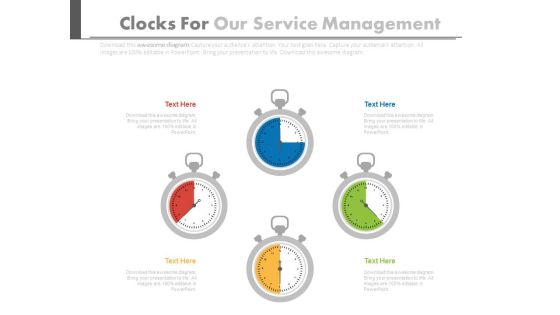
Four Stopwatches In Pie Chart Style Powerpoint Slides
This PPT slide has been designed with graphics of four stop watches in pie chart style. You may sue this PowerPoint template for time management. This dashboard slide may useful for multilevel status report creation and approval process.

Stopwatch For Speed Calculation Powerpoint Slides
This innovative, stunningly beautiful dashboard has been designed for speed calculation. It contains graphics of stopwatch. This PowerPoint template helps to display your information in a useful, simple and orderly way.
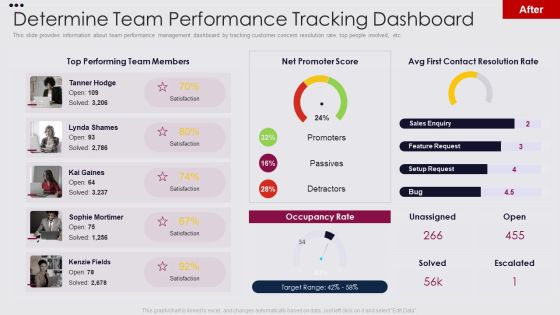
Employee Performance Improvement Framework Determine Team Performance Ideas PDF
This slide provides information about team performance management dashboard by tracking customer concern resolution rate, top people involved, etc. Deliver and pitch your topic in the best possible manner with this employee performance improvement framework determine team performance ideas pdf. Use them to share invaluable insights on determine team performance tracking dashboard and impress your audience. This template can be altered and modified as per your expectations. So, grab it now.

Key Metrics Performance Ppt PowerPoint Presentation Tips
This is a key metrics performance ppt powerpoint presentation tips. This is a four stage process. The stages in this process are business, strategy, marketing, success, dashboard, measuring.
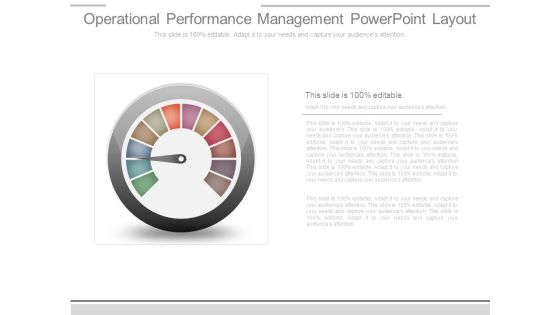
Operational Performance Management Powerpoint Layout
This is a operational performance management powerpoint layout. This is a one stage process. The stages in this process are dashboard, measure, business.

Sell Through Calculation Ppt Sample Presentations
This is a sell through calculation ppt sample presentations. This is a four stage process. The stages in this process are dashboard, business, graph.

Balanced Scorecard Leading And Lagging Indicators Powerpoint Slide
This is a balanced scorecard leading and lagging indicators powerpoint slide. This is a four stage process. The stages in this process are dashboard, business, marketing, technology, meter.
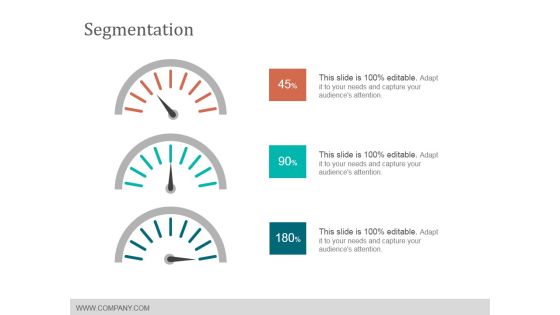
Segmentation Ppt PowerPoint Presentation Pictures Templates
This is a segmentation ppt powerpoint presentation pictures templates. This is a three stage process. The stages in this process are dashboard, business, measurement, finance.

Web Analytics For Seo Marketing Ppt PowerPoint Presentation Examples
This is a web analytics for seo marketing ppt powerpoint presentation examples. This is a five stage process. The stages in this process are digital analytics, digital dashboard, marketing.

Web Analytics Traffic Sources And Conversion Rate Ppt PowerPoint Presentation Picture
This is a web analytics traffic sources and conversion rate ppt powerpoint presentation picture. This is a four stage process. The stages in this process are digital analytics, digital dashboard, marketing.
 Home
Home