AI PPT Maker
Templates
PPT Bundles
Design Services
Business PPTs
Business Plan
Management
Strategy
Introduction PPT
Roadmap
Self Introduction
Timelines
Process
Marketing
Agenda
Technology
Medical
Startup Business Plan
Cyber Security
Dashboards
SWOT
Proposals
Education
Pitch Deck
Digital Marketing
KPIs
Project Management
Product Management
Artificial Intelligence
Target Market
Communication
Supply Chain
Google Slides
Research Services
 One Pagers
All Categories
-
Home
- Customer Favorites
- Cost Model
Cost Model
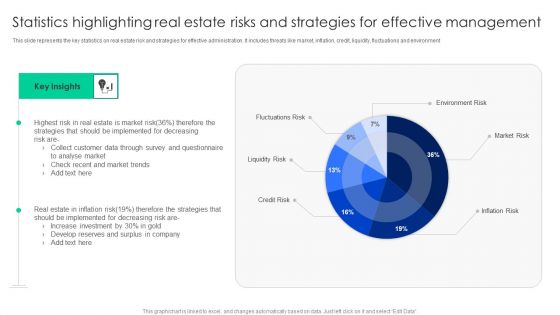
Statistics Highlighting Real Estate Risks And Strategies For Effective Management Information PDF
This slide represents the key statistics on real estate risk and strategies for effective administration. It includes threats like market, inflation, credit, liquidity, fluctuations and environment. Showcasing this set of slides titled Statistics Highlighting Real Estate Risks And Strategies For Effective Management Information PDF. The topics addressed in these templates are Analyse Market, Strategies, Risk. All the content presented in this PPT design is completely editable. Download it and make adjustments in color, background, font etc. as per your unique business setting.

Financial Summary Report Corporate Quarterly Statement Ppt Slides Ideas PDF
This slide represents quarterly statement snapshot for financial corporate. It covers revenue, net income, EPS, book value per share, net interest income, loan etc. Showcasing this set of slides titled Financial Summary Report Corporate Quarterly Statement Ppt Slides Ideas PDF. The topics addressed in these templates are Summary, Loan, Deposit, Statistics. All the content presented in this PPT design is completely editable. Download it and make adjustments in color, background, font etc. as per your unique business setting.

Financial Summary Report Institute Showcasing Workplace Highlights Ppt Infographics Inspiration PDF
This slide represents financial institute snapshot. It showcase workplace highlights such as workplace demographics, work space, flexibility, workstation size station etc. Pitch your topic with ease and precision using this Financial Summary Report Institute Showcasing Workplace Highlights Ppt Infographics Inspiration PDF. This layout presents information on Shared Seating Arrangement, Flexibility Workplace, Workplace. It is also available for immediate download and adjustment. So, changes can be made in the color, design, graphics or any other component to create a unique layout.

Financial Summary Report Showcasing Organization Performance Ppt Show Skills PDF
This slide represents financial statement snapshot depicting organization performance. It covers revenue, cash, expenditure breakdown, cash flow, MRR breakdown etc. Showcasing this set of slides titled Financial Summary Report Showcasing Organization Performance Ppt Show Skills PDF. The topics addressed in these templates are Revenue, Cash, Expenditure Breakdown. All the content presented in this PPT design is completely editable. Download it and make adjustments in color, background, font etc. as per your unique business setting.
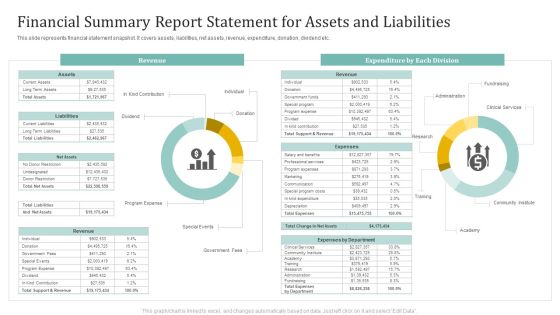
Financial Summary Report Statement For Assets And Liabilities Ppt Slides Guide PDF
This slide represents financial statement snapshot. It covers assets, liabilities, net assets, revenue, expenditure, donation, dividend etc. Pitch your topic with ease and precision using this Financial Summary Report Statement For Assets And Liabilities Ppt Slides Guide PDF. This layout presents information on Revenue, Expenditure Each Division, Fundraising. It is also available for immediate download and adjustment. So, changes can be made in the color, design, graphics or any other component to create a unique layout.
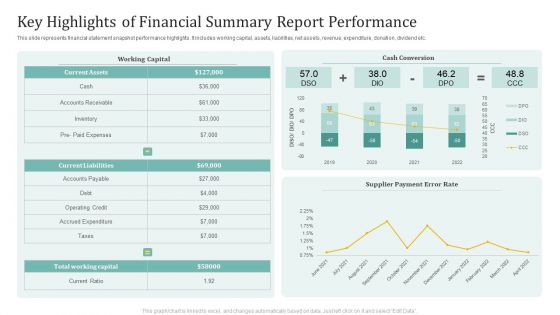
Key Highlights Of Financial Summary Report Performance Ppt Outline Slides PDF
This slide represents financial statement snapshot performance highlights. It includes working capital, assets, liabilities, net assets, revenue, expenditure, donation, dividend etc. Showcasing this set of slides titled Key Highlights Of Financial Summary Report Performance Ppt Outline Slides PDF. The topics addressed in these templates are Working Capital, Cash Conversion, Supplier Payment, Error Rate. All the content presented in this PPT design is completely editable. Download it and make adjustments in color, background, font etc. as per your unique business setting.

Quality Monitoring Kpi Dashboard For Building And Construction Sector Portrait PDF
This slide covers quality monitoring KPI dashboard for construction industry. It involves data such as non conformance report, standard operating procedures, site inspection and quality training. Showcasing this set of slides titled Quality Monitoring Kpi Dashboard For Building And Construction Sector Portrait PDF. The topics addressed in these templates are Non Conformance Report, Standard Operating, Procedures. All the content presented in this PPT design is completely editable. Download it and make adjustments in color, background, font etc. as per your unique business setting.
Five Years Sales Projection And Analysis Dashboard Icons PDF
This slide defines the dashboard for five years sales forecast and analysis . It includes information related to the estimated and actual sales. Pitch your topic with ease and precision using this Five Years Sales Projection And Analysis Dashboard Icons PDF. This layout presents information on Forecast Value, Forecast Accuracy, Won Opportunities. It is also available for immediate download and adjustment. So, changes can be made in the color, design, graphics or any other component to create a unique layout.
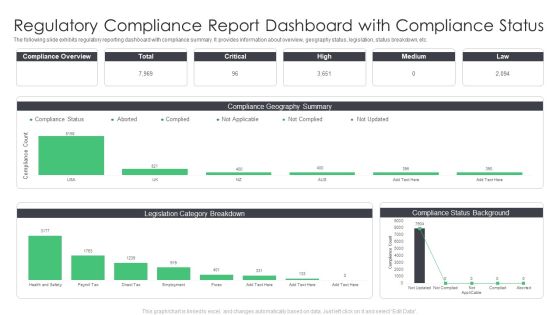
Regulatory Compliance Report Dashboard With Compliance Status Infographics PDF
The following slide exhibits regulatory reporting dashboard with compliance summary. It provides information about overview, geography status, legislation, status breakdown, etc. Pitch your topic with ease and precision using this Regulatory Compliance Report Dashboard With Compliance Status Infographics PDF. This layout presents information on Dashboard With Compliance Status, Regulatory Compliance Report. It is also available for immediate download and adjustment. So, changes can be made in the color, design, graphics or any other component to create a unique layout.
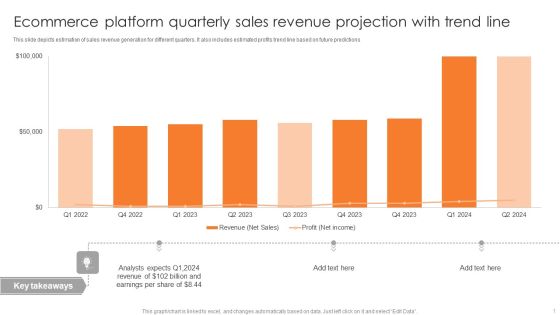
Ecommerce Platform Quarterly Sales Revenue Projection With Trend Line Inspiration PDF
This slide depicts estimation of sales revenue generation for different quarters. It also includes estimated profits trend line based on future predictions. Showcasing this set of slides titled Ecommerce Platform Quarterly Sales Revenue Projection With Trend Line Inspiration PDF. The topics addressed in these templates are Analysts Expects, Earnings Per Share, 2022 To 2024. All the content presented in this PPT design is completely editable. Download it and make adjustments in color, background, font etc. as per your unique business setting.

Media Company Quarterly Revenue Projection Dashboard Mockup PDF
This slide depicts estimation and actual revenue generated for a quarter. It also includes top ten customers, revenue by product and entity for media company. Pitch your topic with ease and precision using this Media Company Quarterly Revenue Projection Dashboard Mockup PDF. This layout presents information on Total Revenue, Quarterly Revenue Entity, Top 10 Customers. It is also available for immediate download and adjustment. So, changes can be made in the color, design, graphics or any other component to create a unique layout.

Online Retail Service Store Quarterly Revenue Projections Topics PDF
This slide depicts estimated revenue for a powerful retail player. It includes projections for revenue earned through sales per quarter with key insights. Showcasing this set of slides titled Online Retail Service Store Quarterly Revenue Projections Topics PDF. The topics addressed in these templates are Estimated Revenue, Retail Services Launch, 2022 To 2023. All the content presented in this PPT design is completely editable. Download it and make adjustments in color, background, font etc. as per your unique business setting.

Pinterest Quarterly Revenue Projections Based On Global Users Demonstration PDF
This slide depicts image sharing companys revenue estimation based on active users globally. It includes revenue projections on quarterly basis for users in international market. Showcasing this set of slides titled Pinterest Quarterly Revenue Projections Based On Global Users Demonstration PDF. The topics addressed in these templates are Decrease Approx, Revenue Estimated, 2022 To 2023. All the content presented in this PPT design is completely editable. Download it and make adjustments in color, background, font etc. as per your unique business setting.
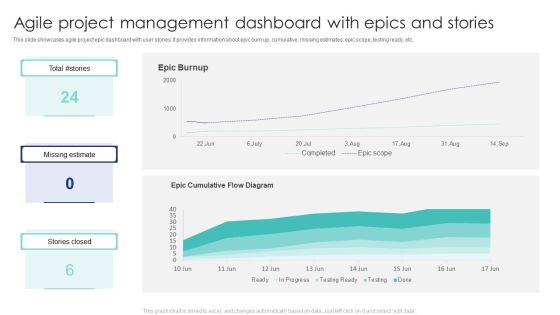
Agile Project Management Dashboard With Epics And Stories Mockup PDF
This slide showcases agile project epic dashboard with user stories. It provides information about epic burn up, cumulative, missing estimates, epic scope, testing ready, etc. Showcasing this set of slides titled Agile Project Management Dashboard With Epics And Stories Mockup PDF. The topics addressed in these templates are Total Stories, Missing Estimate, Stories Closed. All the content presented in this PPT design is completely editable. Download it and make adjustments in color, background, font etc. as per your unique business setting.
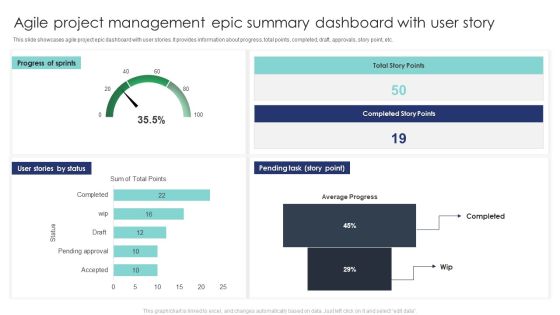
Agile Project Management Epic Summary Dashboard With User Story Formats PDF
This slide showcases agile project epic dashboard with user stories. It provides information about progress, total points, completed, draft, approvals, story point, etc. Pitch your topic with ease and precision using this Agile Project Management Epic Summary Dashboard With User Story Formats PDF. This layout presents information on Pending Tast, Progress Sprints, User Stories Status. It is also available for immediate download and adjustment. So, changes can be made in the color, design, graphics or any other component to create a unique layout.

Healthcare Management Facilities Data On Analytics Platform Dashboard Slides PDF
This slide provides glimpse about facts and figures related to patients information databases on a digital healthcare management platform. It includes patients, inpatients, outpatients, etc. Showcasing this set of slides titled Healthcare Management Facilities Data On Analytics Platform Dashboard Slides PDF. The topics addressed in these templates are Patients By Department, Patients, Inpatients. All the content presented in this PPT design is completely editable. Download it and make adjustments in color, background, font etc. as per your unique business setting.

Patient Satisfaction Data On Healthcare Management Platform Dashboard Slides PDF
This slide provides glimpse about facts and figures related to patients satisfaction levels on a digital healthcare management platform. It includes patients feedback, patients count, etc. Showcasing this set of slides titled Patient Satisfaction Data On Healthcare Management Platform Dashboard Slides PDF. The topics addressed in these templates are Patients Feedback, Patients Satisfaction, Average Waiting Time. All the content presented in this PPT design is completely editable. Download it and make adjustments in color, background, font etc. as per your unique business setting.

KPI Dashboard To Measure Strategic Monetary Performance Graphics PDF
This slide shows KPI dashboard to measure strategic monetary performance. It includes gross profit margin, opex ratio, operating profit margin, revenue, etc. Pitch your topic with ease and precision using this KPI Dashboard To Measure Strategic Monetary Performance Graphics PDF. This layout presents information on Gross Profit Margin, Opex Ratio, Operating Profit Margin. It is also available for immediate download and adjustment. So, changes can be made in the color, design, graphics or any other component to create a unique layout.

COVID Impact Analysis On Unemployment Rates Ppt Inspiration Icon PDF
This slide depicts unemployment rates on multiple industries impacted by Covid-19. It includes different industries with unemployment rates and number of unemployed individuals. Showcasing this set of slides titled COVID Impact Analysis On Unemployment Rates Ppt Inspiration Icon PDF. The topics addressed in these templates are Hotel Industry, Unemployment Rate, Construction Industry. All the content presented in this PPT design is completely editable. Download it and make adjustments in color, background, font etc. as per your unique business setting.
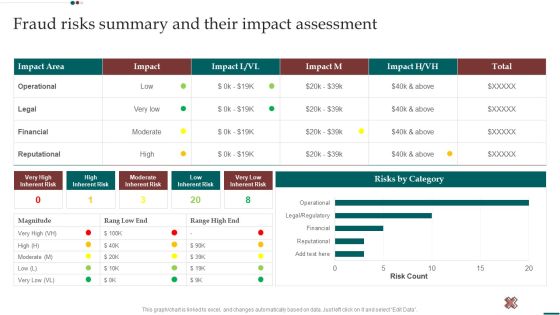
Scam Inquiry And Response Playbook Fraud Risks Summary And Their Impact Assessment Summary PDF
This Scam Inquiry And Response Playbook Fraud Risks Summary And Their Impact Assessment Summary PDF is perfect for any presentation, be it in front of clients or colleagues. It is a versatile and stylish solution for organizing your meetings. The product features a modern design for your presentation meetings. The adjustable and customizable slides provide unlimited possibilities for acing up your presentation. Slidegeeks has done all the homework before launching the product for you. So, do not wait, grab the presentation templates today.
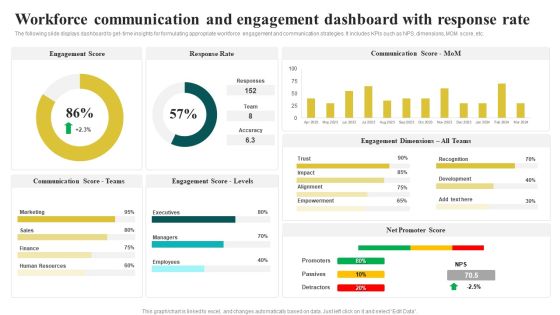
Workforce Communication And Engagement Dashboard With Response Rate Inspiration PDF
The following slide displays dashboard to get- time insights for formulating appropriate workforce engagement and communication strategies. It includes KPIs such as NPS, dimensions, MOM score, etc. Showcasing this set of slides titled Workforce Communication And Engagement Dashboard With Response Rate Inspiration PDF. The topics addressed in these templates are Engagement Score, Response Rate, Communication Score. All the content presented in this PPT design is completely editable. Download it and make adjustments in color, background, font etc. as per your unique business setting.
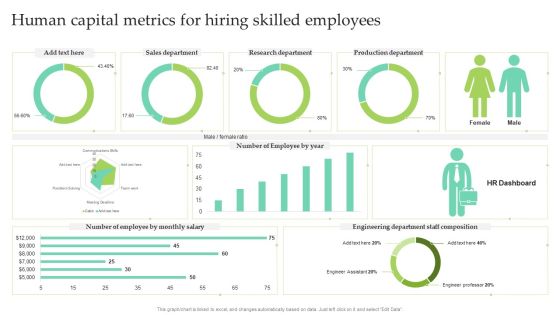
Human Capital Metrics For Hiring Skilled Employees Ppt Slides Themes PDF
This graph or chart is linked to excel, and changes automatically based on data. Just left click on it and select Edit Data. Showcasing this set of slides titled Human Capital Metrics For Hiring Skilled Employees Ppt Slides Themes PDF. The topics addressed in these templates are Sales Department, Research Department, Production Department. All the content presented in this PPT design is completely editable. Download it and make adjustments in color, background, font etc. as per your unique business setting.

Human Capital Metrics For New Hire Ppt Pictures Brochure PDF
This graph or chart is linked to excel, and changes automatically based on data. Just left click on it and select Edit Data. Pitch your topic with ease and precision using this Human Capital Metrics For New Hire Ppt Pictures Brochure PDF. This layout presents information on Active Employee Count, New Hire Count, New Hire. It is also available for immediate download and adjustment. So, changes can be made in the color, design, graphics or any other component to create a unique layout.

Human Capital Metrics For Proper Management Ppt Show Inspiration PDF
This graph or chart is linked to excel, and changes automatically based on data. Just left click on it and select Edit Data. Showcasing this set of slides titled Human Capital Metrics For Proper Management Ppt Show Inspiration PDF. The topics addressed in these templates are Candidates Per Position, Hired Per Source, Location. All the content presented in this PPT design is completely editable. Download it and make adjustments in color, background, font etc. as per your unique business setting.

Human Capital Metrics With Absenteeism Rate Ppt Infographic Template Ideas PDF
This graph or chart is linked to excel, and changes automatically based on data. Just left click on it and select Edit Data. Pitch your topic with ease and precision using this Human Capital Metrics With Absenteeism Rate Ppt Infographic Template Ideas PDF. This layout presents information on Overall Labor Effectiveness, OLE Department, Absenteeism. It is also available for immediate download and adjustment. So, changes can be made in the color, design, graphics or any other component to create a unique layout.
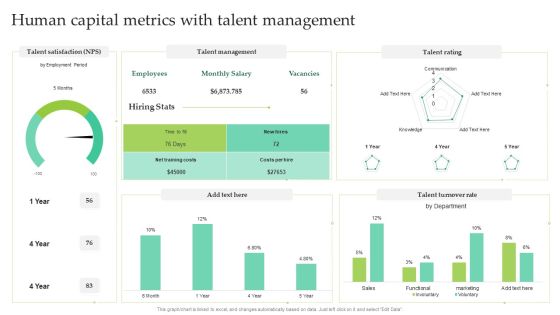
Human Capital Metrics With Talent Management Ppt Layouts Mockup PDF
This graph or chart is linked to excel, and changes automatically based on data. Just left click on it and select Edit Data. Showcasing this set of slides titled Human Capital Metrics With Talent Management Ppt Layouts Mockup PDF. The topics addressed in these templates are Talent Management, Talent Rating, Talent Turnover Rate. All the content presented in this PPT design is completely editable. Download it and make adjustments in color, background, font etc. as per your unique business setting.
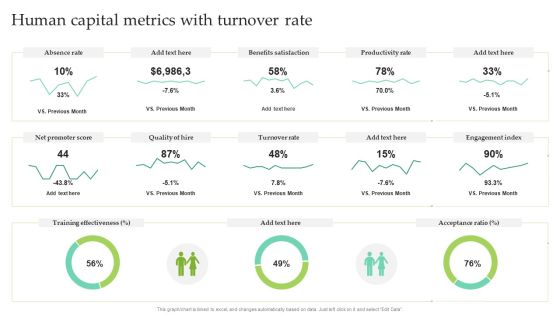
Human Capital Metrics With Turnover Rate Ppt Pictures Outline PDF
This graph or chart is linked to excel, and changes automatically based on data. Just left click on it and select Edit Data. Pitch your topic with ease and precision using this Human Capital Metrics With Turnover Rate Ppt Pictures Outline PDF. This layout presents information on Absence Rate, Benefits Satisfaction, Productivity Rate. It is also available for immediate download and adjustment. So, changes can be made in the color, design, graphics or any other component to create a unique layout.
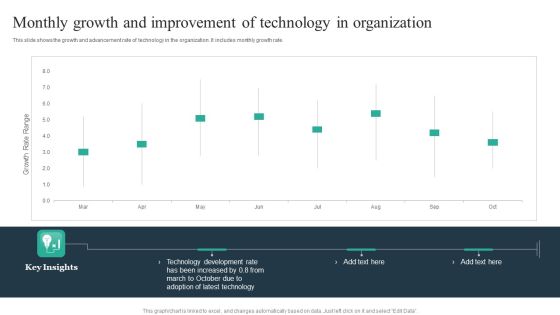
Monthly Growth And Improvement Of Technology In Organization Clipart PDF
This slide shows the growth and advancement rate of technology in the organization. It includes monthly growth rate. Showcasing this set of slides titled Monthly Growth And Improvement Of Technology In Organization Clipart PDF. The topics addressed in these templates are Technology, Development Rate, Key Insights. All the content presented in this PPT design is completely editable. Download it and make adjustments in color, background, font etc. as per your unique business setting.

Real Time Dashboard For Change Impact Analysis Ppt Pictures Layouts PDF
This slide represents business change impact assessment metric dashboard. It includes impacted organizations and groups, impact severity, impacted users, impacted jobs etc. Pitch your topic with ease and precision using this Real Time Dashboard For Change Impact Analysis Ppt Pictures Layouts PDF. This layout presents information on Impact Severity, Role Changes Impact, High, Low, Medium. It is also available for immediate download and adjustment. So, changes can be made in the color, design, graphics or any other component to create a unique layout.

Forthcoming Growth Opportunities In Big Data Market Ppt Inspiration Brochure PDF
This slide covers top 3 growth opportunities in big data market . It also contains CAGR, employing innovation, demand, 2021 and 2026 projected. Showcasing this set of slides titled Forthcoming Growth Opportunities In Big Data Market Ppt Inspiration Brochure PDF. The topics addressed in these templates are Big Data International, Market Size, Period Projections. All the content presented in this PPT design is completely editable. Download it and make adjustments in color, background, font etc. as per your unique business setting.
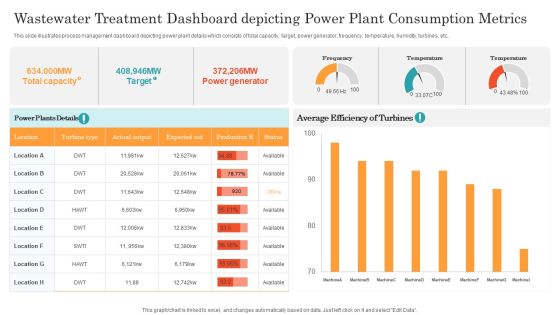
Wastewater Treatment Dashboard Depicting Power Plant Consumption Metrics Ppt Slides Tips PDF
This slide illustrates process management dashboard depicting power plant details which consists of total capacity, target, power generator, frequency, temperature, humidity, turbines, etc. Pitch your topic with ease and precision using this Wastewater Treatment Dashboard Depicting Power Plant Consumption Metrics Ppt Slides Tips PDF. This layout presents information on Power Generator, Target, Actual Output. It is also available for immediate download and adjustment. So, changes can be made in the color, design, graphics or any other component to create a unique layout.

Product Market Share Chart Of Electronic Company Ppt Gallery Graphic Tips PDF
This slide shows the percentage of market share graph of electronic company products. It includes mobile phone, laptop, tablet, computer and others devices. Pitch your topic with ease and precision using this Product Market Share Chart Of Electronic Company Ppt Gallery Graphic Tips PDF. This layout presents information on Mobile Phone, Computer, Laptop, Tablet. It is also available for immediate download and adjustment. So, changes can be made in the color, design, graphics or any other component to create a unique layout.
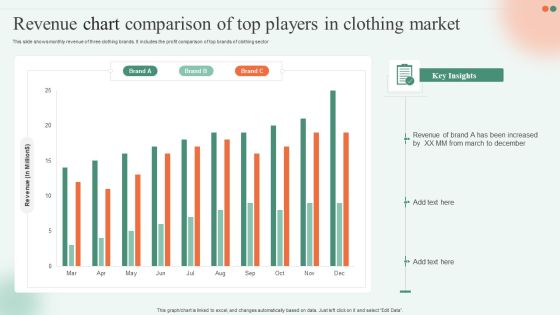
Revenue Chart Comparison Of Top Players In Clothing Market Ppt Infographics Skills PDF
This slide shows monthly revenue of three clothing brands. It includes the profit comparison of top brands of clothing sector Showcasing this set of slides titled Revenue Chart Comparison Of Top Players In Clothing Market Ppt Infographics Skills PDF. The topics addressed in these templates are Revenue, Brand, Key Insights. All the content presented in this PPT design is completely editable. Download it and make adjustments in color, background, font etc. as per your unique business setting.
Market Penetration Dashboard With Sales Metrics Ppt Icon Examples PDF
This slide shows market penetration dashboard for sales team. It provides information about regions, emerging markets, planned sales, actual sales, revenue, gender wise sales, etc. Pitch your topic with ease and precision using this Market Penetration Dashboard With Sales Metrics Ppt Icon Examples PDF. This layout presents information on Emerging Markets, Sales Gender, Actual Sales. It is also available for immediate download and adjustment. So, changes can be made in the color, design, graphics or any other component to create a unique layout.
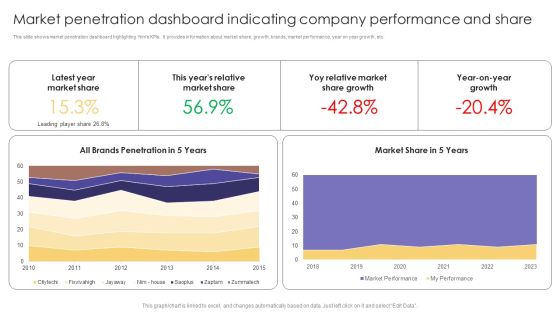
Market Penetration Dashboard Indicating Company Performance And Share Formats PDF
This slide shows market penetration dashboard highlighting firms KPIs. It provides information about market share, growth, brands, market performance, year on year growth, etc. Showcasing this set of slides titled Market Penetration Dashboard Indicating Company Performance And Share Formats PDF. The topics addressed in these templates are Latest Year, Market Share, Market Share Growth. All the content presented in this PPT design is completely editable. Download it and make adjustments in color, background, font etc. as per your unique business setting.

Customer NPS Metric With Revenue Growth Impact Ppt Show Portrait PDF
This slide illustrates net promoter score with revenue growth impact. It provides information about market average NPS, respondents, promoter, detractor, passive, etc. Pitch your topic with ease and precision using this Customer NPS Metric With Revenue Growth Impact Ppt Show Portrait PDF. This layout presents information on Promoter, Detractor, Passive. It is also available for immediate download and adjustment. So, changes can be made in the color, design, graphics or any other component to create a unique layout.

Customer NPS Metric Dashboard Indicating Customer Satisfaction And Agent Performance Template PDF
This slide shows net promoter score dashboard indicating customer satisfaction and agent performance which includes medium wise satisfaction, customer satisfaction, consumer loyalty, etc. Showcasing this set of slides titled Customer NPS Metric Dashboard Indicating Customer Satisfaction And Agent Performance Template PDF. The topics addressed in these templates are Net Promoter Score, Consumer Loyalty, Top 5 Agents. All the content presented in this PPT design is completely editable. Download it and make adjustments in color, background, font etc. as per your unique business setting.
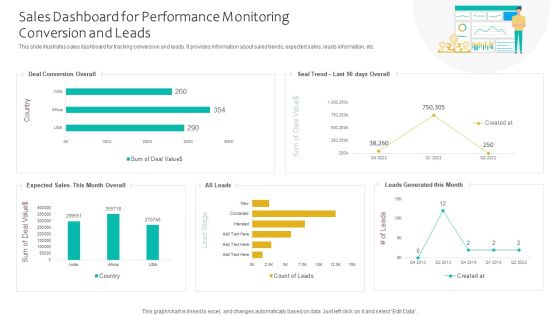
Sales Dashboard For Performance Monitoring Conversion And Leads Ppt Infographics Smartart PDF
This slide illustrates sales dashboard for tracking conversion and leads. It provides information about sales trends, expected sales, leads information, etc. Showcasing this set of slides titled Sales Dashboard For Performance Monitoring Conversion And Leads Ppt Infographics Smartart PDF. The topics addressed in these templates are Deal Conversion Overall, Expected Sales, Leads Generated. All the content presented in this PPT design is completely editable. Download it and make adjustments in color, background, font etc. as per your unique business setting.
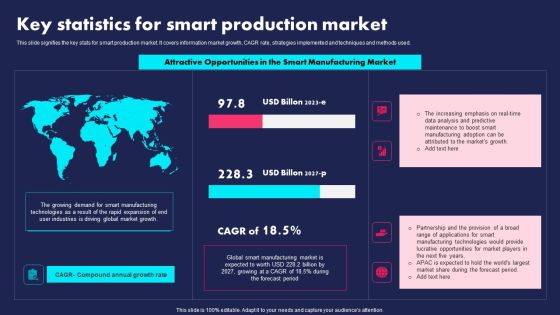
Key Statistics For Smart Production Market Ppt PowerPoint Presentation File Inspiration PDF
This slide signifies the key stats for smart production market. It covers information market growth, CAGR rate, strategies implemented and techniques and methods used. Showcasing this set of slides titled Key Statistics For Smart Production Market Ppt PowerPoint Presentation File Inspiration PDF. The topics addressed in these templates are Attractive Opportunities, Smart Manufacturing Market, Global. All the content presented in this PPT design is completely editable. Download it and make adjustments in color, background, font etc. as per your unique business setting.
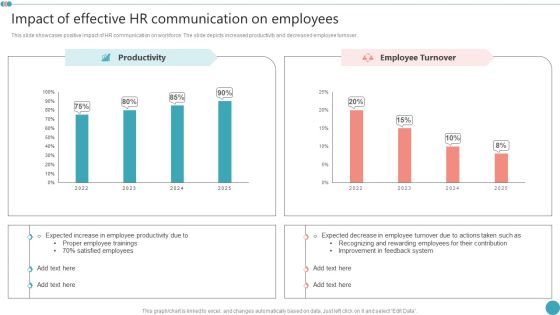
Impact Of Effective HR Communication On Employees Employee Engagement HR Strategy At Organization Professional PDF
This slide showcases positive impact of HR communication on workforce. The slide depicts increased productivity and decreased employee turnover.Find a pre-designed and impeccable Impact Of Effective HR Communication On Employees Employee Engagement HR Strategy At Organization Professional PDF. The templates can ace your presentation without additional effort. You can download these easy-to-edit presentation templates to make your presentation stand out from others. So, what are you waiting for Download the template from Slidegeeks today and give a unique touch to your presentation.

Asset Assessment Dashboard With Cash Flow And Market Value Summary PDF
This slide illustrates asset valuation dashboard with key financial metrics. It provides information about cash flow, market value, intrinsic value, assumptions, market cap, discount rate, etc.Showcasing this set of slides titled Asset Assessment Dashboard With Cash Flow And Market Value Summary PDF. The topics addressed in these templates are Discount Rate, Capital Expenditure, Market Capitalization. All the content presented in this PPT design is completely editable. Download it and make adjustments in color, background, font etc. as per your unique business setting.
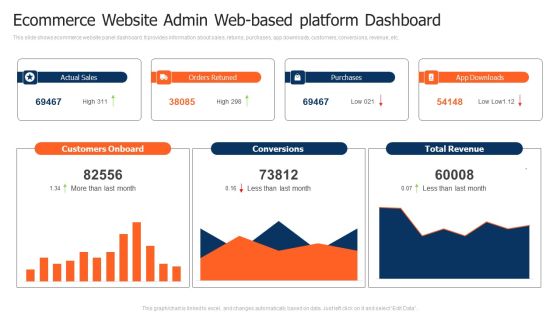
Ecommerce Website Admin Web Based Platform Dashboard Pictures PDF
This slide shows ecommerce website panel dashboard. It provides information about sales, returns, purchases, app downloads, customers, conversions, revenue, etc. Pitch your topic with ease and precision using this Ecommerce Website Admin Web Based Platform Dashboard Pictures PDF. This layout presents information on Customers Onboard, Purchases, Total Revenue. It is also available for immediate download and adjustment. So, changes can be made in the color, design, graphics or any other component to create a unique layout.
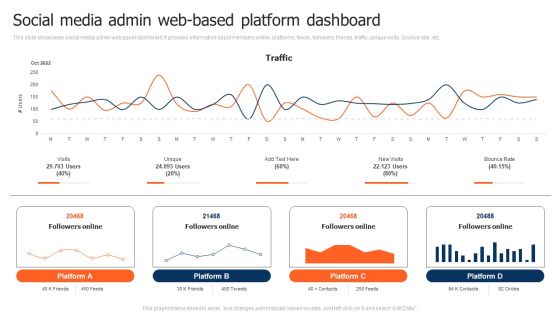
Social Media Admin Web Based Platform Dashboard Demonstration PDF
This slide showcases social media admin web panel dashboard. It provides information about members online, platforms, feeds, followers, friends, traffic, unique visits, bounce rate, etc. Showcasing this set of slides titled Social Media Admin Web Based Platform Dashboard Demonstration PDF. The topics addressed in these templates are Social Media Admin, Web Based Platform Dashboard. All the content presented in this PPT design is completely editable. Download it and make adjustments in color, background, font etc. as per your unique business setting.

Deploying XP Practices To Enhance Operational Efficiency Loss Of Clients Faced By The Company Introduction PDF
This slide demonstrates the loss of clients faced by the company and depicts how load times affect customer satisfaction.Find a pre-designed and impeccable Deploying XP Practices To Enhance Operational Efficiency Loss Of Clients Faced By The Company Introduction PDF. The templates can ace your presentation without additional effort. You can download these easy-to-edit presentation templates to make your presentation stand out from others. So, what are you waiting for Download the template from Slidegeeks today and give a unique touch to your presentation.

Dashboard For Business Financial Performance Operations Administration Mockup PDF
This slide represents dashboard for business performance management. It covers accounts receivable, accounts payable, equity ratio, debt ratio, current ratio etc. Showcasing this set of slides titled Dashboard For Business Financial Performance Operations Administration Mockup PDF. The topics addressed in these templates are Dashboard For Business Financial, Performance Operations Administration. All the content presented in this PPT design is completely editable. Download it and make adjustments in color, background, font etc. as per your unique business setting.
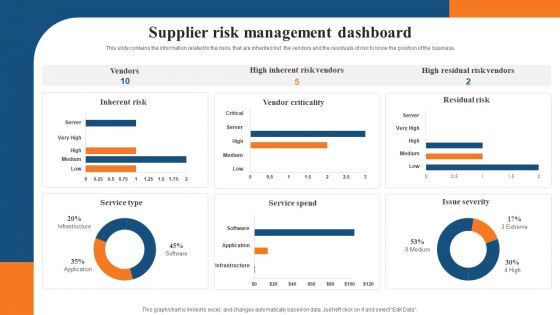
Supplier Risk Management Dashboard Introduction PDF
This slide contains the information related to the risks that are inherited but the vendors and the residuals of risk to know the position of the business. Showcasing this set of slides titled Supplier Risk Management Dashboard Introduction PDF. The topics addressed in these templates are Service Spend, Inherent Risk, Risk Vendors. All the content presented in this PPT design is completely editable. Download it and make adjustments in color, background, font etc. as per your unique business setting.

Market Size Of Robotic Technology For Healthcare Surgery Summary PDF
The following slide displays statistical data for the growth in US market size for robot assisted surgery. Key reported treatment area are orthopaedics, thoracic, urology, gynaecology and heart.Showcasing this set of slides titled Market Size Of Robotic Technology For Healthcare Surgery Summary PDF. The topics addressed in these templates are Robotic Surgery, Highest Engagement, Assisted Surgery. All the content presented in this PPT design is completely editable. Download it and make adjustments in color, background, font etc. as per your unique business setting.
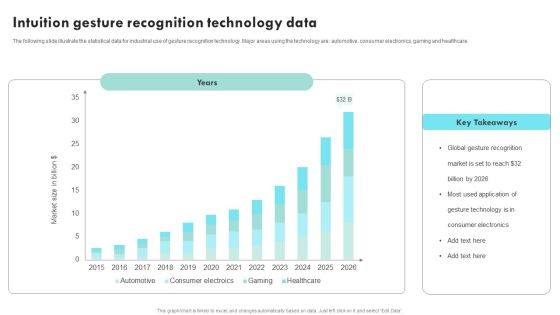
Intuition Gesture Recognition Technology Data Ppt Pictures Grid PDF
The following slide illustrate the statistical data for industrial use of gesture recognition technology. Major areas using the technology are automotive, consumer electronics, gaming and healthcare. Showcasing this set of slides titled Intuition Gesture Recognition Technology Data Ppt Pictures Grid PDF. The topics addressed in these templates are Global Gesture Recognition, Gesture Technology, Consumer Electronics. All the content presented in this PPT design is completely editable. Download it and make adjustments in color, background, font etc. as per your unique business setting.
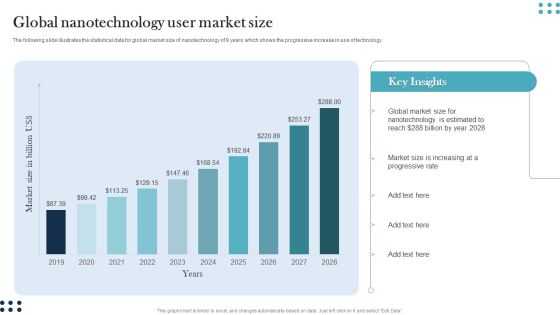
Global Nanotechnology User Market Size Guidelines PDF
The following slide illustrates the statistical data for global market size of nanotechnology of 9 years which shows the progressive increase in use of technology. Pitch your topic with ease and precision using this Global Nanotechnology User Market Size Guidelines PDF. This layout presents information on Global Market Size, Nanotechnology, Estimated To Reach. It is also available for immediate download and adjustment. So, changes can be made in the color, design, graphics or any other component to create a unique layout.
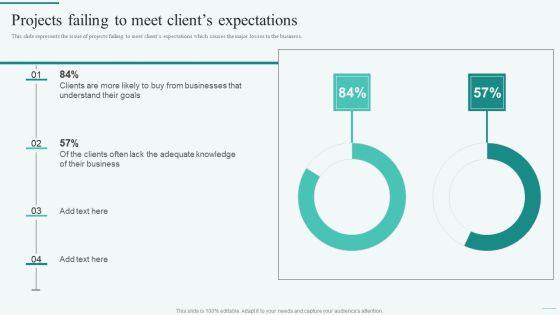
Projects Failing To Meet Clients Expectations Integration Of Dynamic System To Enhance Processes Guidelines PDF
This slide represents the issue of projects failing to meet clients expectations which causes the major losses to the business.Find a pre-designed and impeccable Projects Failing To Meet Clients Expectations Integration Of Dynamic System To Enhance Processes Guidelines PDF. The templates can ace your presentation without additional effort. You can download these easy-to-edit presentation templates to make your presentation stand out from others. So, what are you waiting for Download the template from Slidegeeks today and give a unique touch to your presentation.

Agile Product Development Tracking User Stories Across Agile Project Development Icons PDF
This slide provides information regarding dashboard for tracking user stories across agile project development including work items, etc. If your project calls for a presentation, then Slidegeeks is your go-to partner because we have professionally designed, easy-to-edit templates that are perfect for any presentation. After downloading, you can easily edit Agile Product Development Tracking User Stories Across Agile Project Development Icons PDF and make the changes accordingly. You can rearrange slides or fill them with different images. Check out all the handy templates.

Carbon Emission Rate Percentage Stacked Bar Graph Rules PDF
This slide shows emission rate percentage chart comparison of continents to determine lowest emission releasing continents. It includes continents and emission percentage Showcasing this set of slides titled Carbon Emission Rate Percentage Stacked Bar Graph Rules PDF. The topics addressed in these templates are Carbon Emission, Increase In Industrialization, New Manufacturing. All the content presented in this PPT design is completely editable. Download it and make adjustments in color, background, font etc. as per your unique business setting.

Carbon Emissions Of Countries Bar Graph Professional PDF
This slide depicts emissions chart of various countries to avoid the worst impacts of climate change. It includes countries and carbon emissions in million metric tons. Pitch your topic with ease and precision using this Carbon Emissions Of Countries Bar Graph Professional PDF. This layout presents information on Maximum Production, Consumer Goods, Carbon Emissions. It is also available for immediate download and adjustment. So, changes can be made in the color, design, graphics or any other component to create a unique layout.

Global Electric Cars Sales Bar Graph Graphics PDF
This slide shows usage chart of electric cars world over to access present sales and future of EV. It includes years and number of electric cars sales. Showcasing this set of slides titled Global Electric Cars Sales Bar Graph Graphics PDF. The topics addressed in these templates are Electric Vehicle Sales, Electric Cars Purchased, Underdeveloped Technology. All the content presented in this PPT design is completely editable. Download it and make adjustments in color, background, font etc. as per your unique business setting.

Manufacturing Productivity Analysis Bar Graph Introduction PDF
This slide illustrates the productivity chart of manufacturing of a company. It includes quantity produced in million units against the time period. Pitch your topic with ease and precision using this Manufacturing Productivity Analysis Bar Graph Introduction PDF. This layout presents information on Manufacturing Productivity, Production Decreased, Closure Of Companies. It is also available for immediate download and adjustment. So, changes can be made in the color, design, graphics or any other component to create a unique layout.
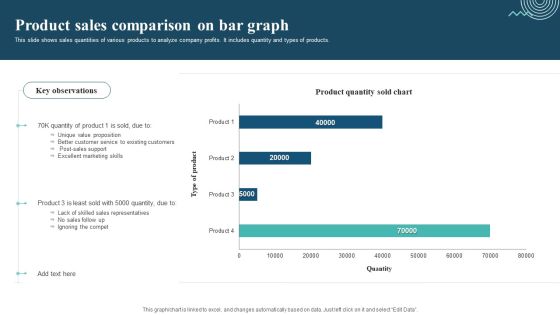
Product Sales Comparison On Bar Graph Sample PDF
This slide shows sales quantities of various products to analyze company profits. It includes quantity and types of products. Pitch your topic with ease and precision using this Product Sales Comparison On Bar Graph Sample PDF. This layout presents information on Unique Value Proposition, Excellent Marketing Skills, Ignoring The Compet. It is also available for immediate download and adjustment. So, changes can be made in the color, design, graphics or any other component to create a unique layout.
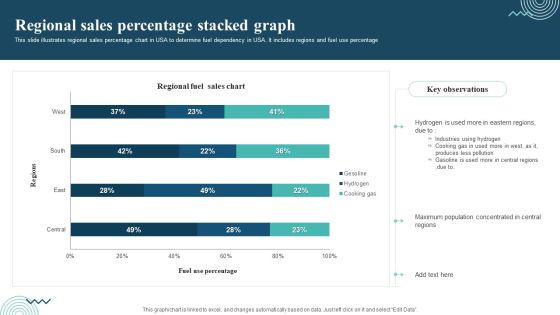
Regional Sales Percentage Stacked Graph Themes PDF
This slide illustrates regional sales percentage chart in USA to determine fuel dependency in USA. It includes regions and fuel use percentage. Pitch your topic with ease and precision using this Regional Sales Percentage Stacked Graph Themes PDF. This layout presents information on Regional Sales, Industries Using Hydrogen, Cooking Gas. It is also available for immediate download and adjustment. So, changes can be made in the color, design, graphics or any other component to create a unique layout.
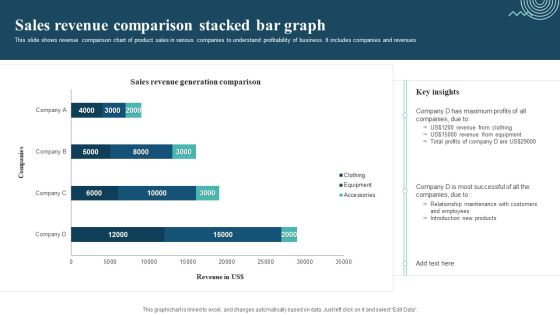
Sales Revenue Comparison Stacked Bar Graph Mockup PDF
This slide shows revenue comparison chart of product sales in various companies to understand profitability of business. It includes companies and revenues. Showcasing this set of slides titled Sales Revenue Comparison Stacked Bar Graph Mockup PDF. The topics addressed in these templates are Sales Revenue Comparison, Revenue From Clothing, Revenue From Equipment. All the content presented in this PPT design is completely editable. Download it and make adjustments in color, background, font etc. as per your unique business setting.

Adopting Flexible Work Policy Stock Chart Ppt PowerPoint Presentation File Influencers PDF
If your project calls for a presentation, then Slidegeeks is your go-to partner because we have professionally designed, easy-to-edit templates that are perfect for any presentation. After downloading, you can easily edit Adopting Flexible Work Policy Stock Chart Ppt PowerPoint Presentation File Influencers PDF and make the changes accordingly. You can rearrange slides or fill them with different images. Check out all the handy templates

Regional Sales Percentage Column Chart With Key Insights Diagrams PDF
This slide illustrates sales percentage chart in regions of USA to calculate and interpret present fuel consumption. It includes parts such as regions and sales percentage.Pitch your topic with ease and precision using this Regional Sales Percentage Column Chart With Key Insights Diagrams PDF. This layout presents information on Industries Central, Sales Central, Productions Companies. It is also available for immediate download and adjustment. So, changes can be made in the color, design, graphics or any other component to create a unique layout.
