AI PPT Maker
Templates
PPT Bundles
Design Services
Business PPTs
Business Plan
Management
Strategy
Introduction PPT
Roadmap
Self Introduction
Timelines
Process
Marketing
Agenda
Technology
Medical
Startup Business Plan
Cyber Security
Dashboards
SWOT
Proposals
Education
Pitch Deck
Digital Marketing
KPIs
Project Management
Product Management
Artificial Intelligence
Target Market
Communication
Supply Chain
Google Slides
Research Services
 One Pagers
All Categories
-
Home
- Customer Favorites
- Cost Model
Cost Model
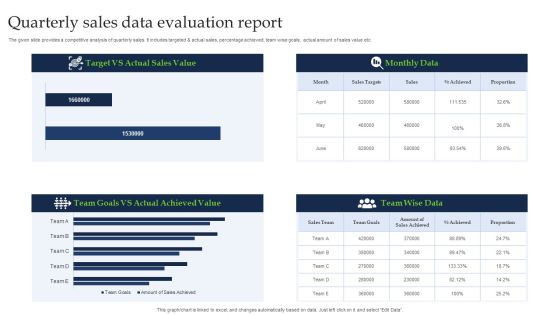
Quarterly Sales Data Evaluation Report Ideas PDF
The given slide provides a competitive analysis of quarterly sales. It includes targeted and actual sales, percentage achieved, team wise goals, actual amount of sales value etc. Showcasing this set of slides titled Quarterly Sales Data Evaluation Report Ideas PDF. The topics addressed in these templates are Actual Sales Value, Target, Actual Achieved Value. All the content presented in this PPT design is completely editable. Download it and make adjustments in color, background, font etc. as per your unique business setting.

SHRM Dashboard Of Employee Satisfaction Ppt PowerPoint Presentation Styles Example File PDF
This slide showcases the advanced statistics of employees satisfaction. It offers information about employee turnover, project employment, and working format that makes management convenient.Pitch your topic with ease and precision using this SHRM Dashboard Of Employee Satisfaction Ppt PowerPoint Presentation Styles Example File PDF. This layout presents information on Total Employees, Happiness Rate, Project Employment. It is also available for immediate download and adjustment. So, changes can be made in the color, design, graphics or any other component to create a unique layout.

IT Project Development Planning Project Management Dashboard Inspiration PDF
This slide covers project evaluation dashboard including planning, design , development and testing for evaluating the project while proceeding to closure .Deliver and pitch your topic in the best possible manner with this IT Project Development Planning Project Management Dashboard Inspiration PDF. Use them to share invaluable insights on Spring Planning, Remaining, Completed and impress your audience. This template can be altered and modified as per your expectations. So, grab it now.

Scrum Master Key Performance Indicators And Kpis Ppt Gallery Files PDF
This slide illustrates graphical representation of performance reviews of scrum team. It includes average task results, key areas and reviews etc. Showcasing this set of slides titled Scrum Master Key Performance Indicators And Kpis Ppt Gallery Files PDF. The topics addressed in these templates are Scrum Team, Average Task Results, Project Timeline Management. All the content presented in this PPT design is completely editable. Download it and make adjustments in color, background, font etc. as per your unique business setting.

Commercial Marketing KPI With Average Transaction Value Formats PDF
This slide template covers about key performing indicators like sales revenue, average customer value, average unit per customer with top five articles sold. Pitch your topic with ease and precision using this Commercial Marketing KPI With Average Transaction Value Formats PDF. This layout presents information on Total Customer, Per Transaction, Transaction Value. It is also available for immediate download and adjustment. So, changes can be made in the color, design, graphics or any other component to create a unique layout.

Commercial Marketing KPI With Country Wise Conversion Rate Summary PDF
This slide template covers about monthly visits and duration through country and territory wise conversion rate while achieving goal achievement. Showcasing this set of slides titled Commercial Marketing KPI With Country Wise Conversion Rate Summary PDF. The topics addressed in these templates are Goal Conversion, Visits Goal, Country Territory. All the content presented in this PPT design is completely editable. Download it and make adjustments in color, background, font etc. as per your unique business setting.

Commercial Marketing KPI With Monthly Unique Visitors Graphics PDF
This slide template covers about total purchase made after trial period and details of paying members with monthly unique visitors.Showcasing this set of slides titled Commercial Marketing KPI With Monthly Unique Visitors Graphics PDF. The topics addressed in these templates are Unique Visitors, Paying Members, Trial Pay. All the content presented in this PPT design is completely editable. Download it and make adjustments in color, background, font etc. as per your unique business setting.

Commercial Marketing KPI With Sales By City And Division Template PDF
This template slide covers about number of sales by division and city with top five articles sold.Showcasing this set of slides titled Commercial Marketing KPI With Sales By City And Division Template PDF. The topics addressed in these templates are Commercial Marketing KPI With Sales By City And Division Template PDF. All the content presented in this PPT design is completely editable. Download it and make adjustments in color, background, font etc. as per your unique business setting.

Enterprise Marketing Activities KPI Dashboard To Track Performance Across Various Platforms Ideas PDF
This slide covers enterprise marketing dashboard to track performance across various platforms. It involves total insights connected, engagement from Facebook, twitter and Instagram.Pitch your topic with ease and precision using this Enterprise Marketing Activities KPI Dashboard To Track Performance Across Various Platforms Ideas PDF. This layout presents information on Instagram Engagement, Comments, Returning. It is also available for immediate download and adjustment. So, changes can be made in the color, design, graphics or any other component to create a unique layout.
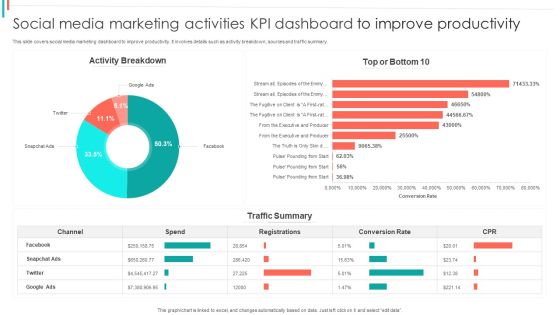
Social Media Marketing Activities KPI Dashboard To Improve Productivity Summary PDF
This slide covers social media marketing dashboard to improve productivity. It involves details such as activity breakdown, sources and traffic summary.Pitch your topic with ease and precision using this Social Media Marketing Activities KPI Dashboard To Improve Productivity Summary PDF. This layout presents information on Activity Breakdown, Conversion Rate, Traffic Summary. It is also available for immediate download and adjustment. So, changes can be made in the color, design, graphics or any other component to create a unique layout.

Technology Sales Enablement Survey Results Pictures PDF
The following slide showcase survey results conducted to find out the usage of sales enablement technology in organizations. The responses covered are maximum benefit to teams and improved efficiency.Pitch your topic with ease and precision using this Technology Sales Enablement Survey Results Pictures PDF. This layout presents information on Teams Benefited, Sales Marketing, Percent Respondents. It is also available for immediate download and adjustment. So, changes can be made in the color, design, graphics or any other component to create a unique layout.

Personal Job Assignment And Productivity Assessment Dashboard Sample PDF
The following slide highlights the employee workload and productivity assessment dashboard illustrating key headings which include employee work, productivity, workload by employee, assessment and summary. Pitch your topic with ease and precision using this Personal Job Assignment And Productivity Assessment Dashboard Sample PDF. This layout presents information on Employee Work, Assessment, Productivity. It is also available for immediate download and adjustment. So, changes can be made in the color, design, graphics or any other component to create a unique layout.

Sales Departmental Goals Achievement Graph Ppt Inspiration Slide Download PDF
This slide illustrates graphical representation of achievement percentage of each team member. It includes achievement percent, name, due date and target of respective member. Pitch your topic with ease and precision using this Sales Departmental Goals Achievement Graph Ppt Inspiration Slide Download PDF. This layout presents information on Sales Departmental, Goals, Achievement Graph. It is also available for immediate download and adjustment. So, changes can be made in the color, design, graphics or any other component to create a unique layout.
Education Dashboard For Tracking Gender Based Retention Metrics Template PDF
This slide illustrates student retention analysis dashboard. It include metrics based on gender, campus, ethnicity, and age group. Pitch your topic with ease and precision using this Education Dashboard For Tracking Gender Based Retention Metrics Template PDF. This layout presents information on Gender Based, Retention Rates, Age Group, Campus Wise. It is also available for immediate download and adjustment. So, changes can be made in the color, design, graphics or any other component to create a unique layout.

Education Dashboard With Absenteeism And Grade Details Metrics Diagrams PDF
This slide covers dashboard for tracking causes and rates of student absenteeism. It also include metrics such as average grades by subject and department. Pitch your topic with ease and precision using this Education Dashboard With Absenteeism And Grade Details Metrics Diagrams PDF. This layout presents information on Grade Department, English Proficiency, Medical Abs. It is also available for immediate download and adjustment. So, changes can be made in the color, design, graphics or any other component to create a unique layout.
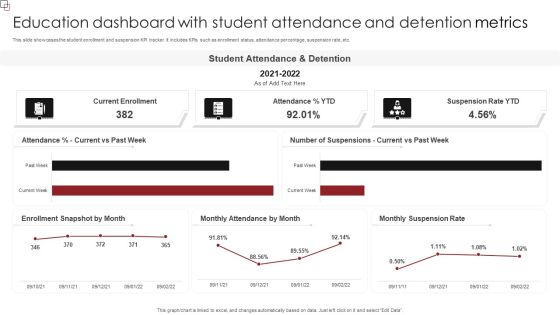
Education Dashboard With Student Attendance And Detention Metrics Inspiration PDF
This slide showcases the student enrollment and suspension KPI tracker. It includes KPIs such as enrollment status, attendance percentage, suspension rate, etc. Pitch your topic with ease and precision using this Education Dashboard With Student Attendance And Detention Metrics Inspiration PDF. This layout presents information on Student Attendance, Suspension Rate YTD, Current Enrollment. It is also available for immediate download and adjustment. So, changes can be made in the color, design, graphics or any other component to create a unique layout.
Training And Education Metrics Tracking Dashboard Guidelines PDF
This slide showcases dashboard for tracking training programs details. It include metrics such as training to invited percentage, unique trained, training man-days, total program names, etc. Pitch your topic with ease and precision using this Training And Education Metrics Tracking Dashboard Guidelines PDF. This layout presents information on Location Wise Training, Training Concerning Vertical, Tennessee. It is also available for immediate download and adjustment. So, changes can be made in the color, design, graphics or any other component to create a unique layout.

Help Desk Call Centre Service Level Agreement KPI Dashboard Pictures PDF
This graph or chart is linked to excel, and changes automatically based on data. Just left click on it and select Edit Data. Showcasing this set of slides titled Help Desk Call Centre Service Level Agreement KPI Dashboard Pictures PDF. The topics addressed in these templates are Call Type Today, Occupancy Today, Call Summary Today. All the content presented in this PPT design is completely editable. Download it and make adjustments in color, background, font etc. as per your unique business setting.
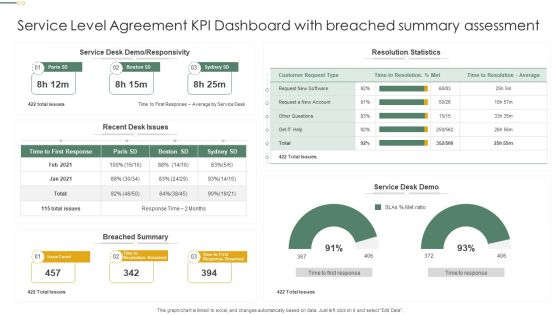
Service Level Agreement KPI Dashboard With Breached Summary Assessment Professional PDF
This graph or chart is linked to excel, and changes automatically based on data. Just left click on it and select Edit Data. Pitch your topic with ease and precision using this Service Level Agreement KPI Dashboard With Breached Summary Assessment Professional PDF. This layout presents information on Resolution Statistics, Service Desk Demo, Breached Summary. It is also available for immediate download and adjustment. So, changes can be made in the color, design, graphics or any other component to create a unique layout.
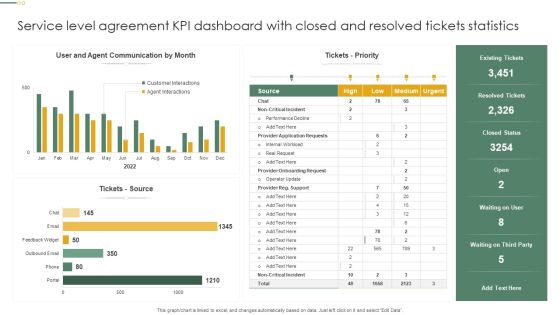
Service Level Agreement KPI Dashboard With Closed And Resolved Tickets Statistics Inspiration PDF
This graph or chart is linked to excel, and changes automatically based on data. Just left click on it and select Edit Data. Showcasing this set of slides titled Service Level Agreement KPI Dashboard With Closed And Resolved Tickets Statistics Inspiration PDF. The topics addressed in these templates are Tickets Priority, Tickets Source, Resolved Tickets. All the content presented in this PPT design is completely editable. Download it and make adjustments in color, background, font etc. as per your unique business setting.
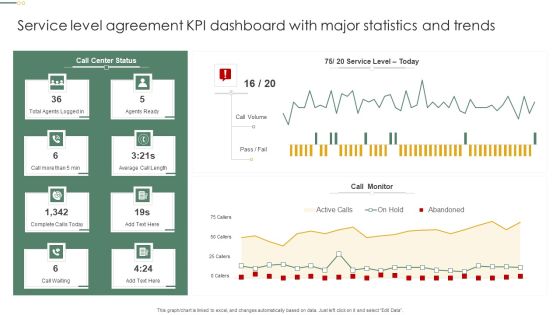
Service Level Agreement KPI Dashboard With Major Statistics And Trends Pictures PDF
This graph or chart is linked to excel, and changes automatically based on data. Just left click on it and select Edit Data. Pitch your topic with ease and precision using this Service Level Agreement KPI Dashboard With Major Statistics And Trends Pictures PDF. This layout presents information on Call Monitor, Call Volume, Agents Ready. It is also available for immediate download and adjustment. So, changes can be made in the color, design, graphics or any other component to create a unique layout.
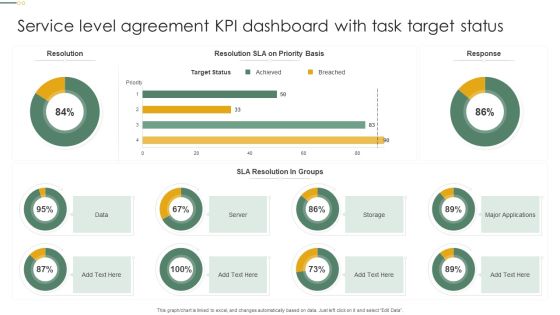
Service Level Agreement KPI Dashboard With Task Target Status Microsoft PDF
This graph or chart is linked to excel, and changes automatically based on data. Just left click on it and select Edit Data. Pitch your topic with ease and precision using this Service Level Agreement KPI Dashboard With Task Target Status Microsoft PDF. This layout presents information on Target Status, Sla Resolution, Groups, Server. It is also available for immediate download and adjustment. So, changes can be made in the color, design, graphics or any other component to create a unique layout.
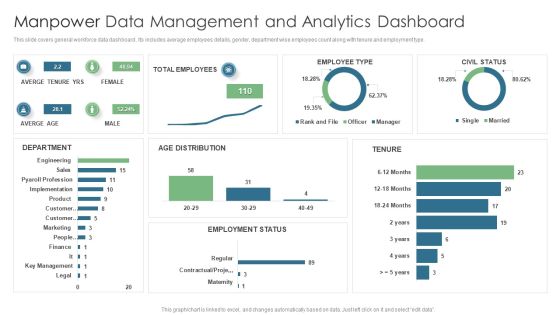
Manpower Data Management And Analytics Dashboard Topics PDF
This slide covers general workforce data dashboard . Its includes average employees details, gender, department wise employees count along with tenure and employment type. Pitch your topic with ease and precision using this Manpower Data Management And Analytics Dashboard Topics PDF. This layout presents information on Total Employees, Averge Tenure Yrs, Employee Type. It is also available for immediate download and adjustment. So, changes can be made in the color, design, graphics or any other component to create a unique layout.
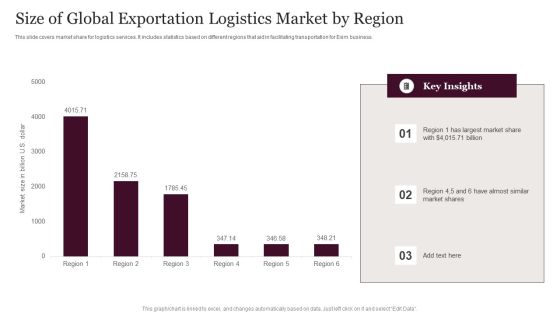
Size Of Global Exportation Logistics Market By Region Information PDF
This slide covers market share for logistics services. It includes statistics based on different regions that aid in facilitating transportation for Exim business. Pitch your topic with ease and precision using this Size Of Global Exportation Logistics Market By Region Information PDF. This layout presents information on Global Exportation Logistics, Market By Region. It is also available for immediate download and adjustment. So, changes can be made in the color, design, graphics or any other component to create a unique layout.
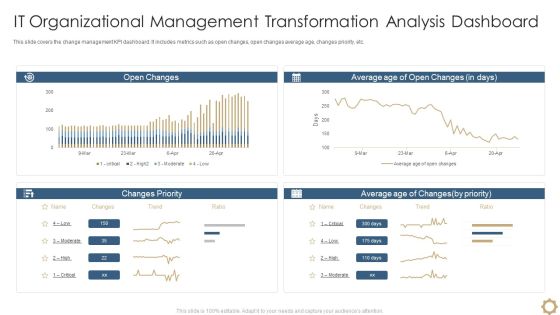
It Organizational Management Transformation Analysis Dashboard Download PDF
This slide covers the change management KPI dashboard. It includes metrics such as open changes, open changes average age, changes priority, etc. Showcasing this set of slides titled It Organizational Management Transformation Analysis Dashboard Download PDF. The topics addressed in these templates are It Organizational Management, Transformation Analysis Dashboard. All the content presented in this PPT design is completely editable. Download it and make adjustments in color, background, font etc. as per your unique business setting.

Open Organizational Management Transformation Kpi Dashboard Information PDF
This slide covers the KPI tracking dashboard for optimizing open changes. It includes metrics such as open changes by risk, status, due date, waiting for approval, etc. Pitch your topic with ease and precision using this Open Organizational Management Transformation Kpi Dashboard Information PDF. This layout presents information on Open Organizational Management, Transformation Kpi Dashboard. It is also available for immediate download and adjustment. So, changes can be made in the color, design, graphics or any other component to create a unique layout.
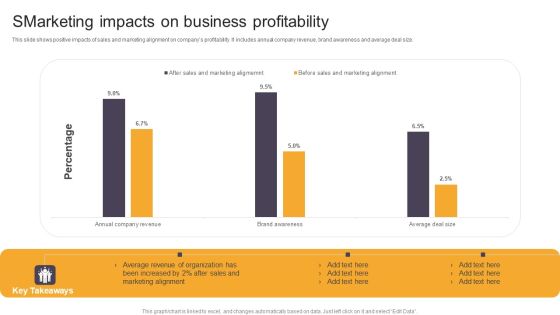
Smarketing Impacts On Business Profitability Ppt Outline Graphics Template PDF
This slide shows positive impacts of sales and marketing alignment on companys profitability. It includes annual company revenue, brand awareness and average deal size. Pitch your topic with ease and precision using this Smarketing Impacts On Business Profitability Ppt Outline Graphics Template PDF. This layout presents information on Sales And Marketing, Average Revenue, Organization. It is also available for immediate download and adjustment. So, changes can be made in the color, design, graphics or any other component to create a unique layout.

Business Products Stock Turnover Ratio Ppt File Aids PDF
This slide shows the comparison of quarterly stock turnover ratio of three products of a company during the year. Highest profitable product was product C Pitch your topic with ease and precision using this Business Products Stock Turnover Ratio Ppt File Aids PDF. This layout presents information on Better Management, Production Level, Turnover Ratio. It is also available for immediate download and adjustment. So, changes can be made in the color, design, graphics or any other component to create a unique layout.
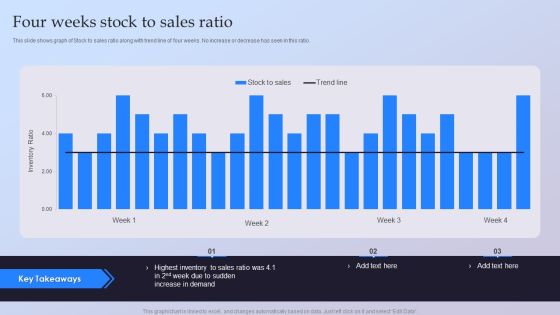
Four Weeks Stock To Sales Ratio Ppt Ideas Guide PDF
This slide shows graph of Stock to sales ratio along with trend line of four weeks. No increase or decrease has seen in this ratio. Pitch your topic with ease and precision using this Four Weeks Stock To Sales Ratio Ppt Ideas Guide PDF. This layout presents information on Highest Inventory, Sales Ratio, Increase Demand. It is also available for immediate download and adjustment. So, changes can be made in the color, design, graphics or any other component to create a unique layout.

Organizational Stock Ratio Management Dashboard Ppt Layouts Outline PDF
This slide shows the Stock management dashboard of an organization. It includes KPIs such as available, reorder, in shipping and total Stock. Showcasing this set of slides titled Organizational Stock Ratio Management Dashboard Ppt Layouts Outline PDF. The topics addressed in these templates are Stock Value, Average Net Profit, Quantity, Available. All the content presented in this PPT design is completely editable. Download it and make adjustments in color, background, font etc. as per your unique business setting.

Advertisement Campaign Dashboard Representing Conversions Target And Value Microsoft PDF
The following slide highlights the promotion campaign dashboard which illustrates the campaign impressions, CTR rate, conversions and total amount spent. Showcasing this set of slides titled Advertisement Campaign Dashboard Representing Conversions Target And Value Microsoft PDF. The topics addressed in these templates are Advertisement Campaign, Dashboard Representing, Conversions Target And Value. All the content presented in this PPT design is completely editable. Download it and make adjustments in color, background, font etc. as per your unique business setting.

Customer Acquisition Method In Brand Campaign Advertisement Themes PDF
This slide showcase the methods used by companies for product promotion in campaign. It includes influencer marketing, organic search and paid search. Pitch your topic with ease and precision using this Customer Acquisition Method In Brand Campaign Advertisement Themes PDF. This layout presents information on Product Promotion, Marketing, Organic Research. It is also available for immediate download and adjustment. So, changes can be made in the color, design, graphics or any other component to create a unique layout.
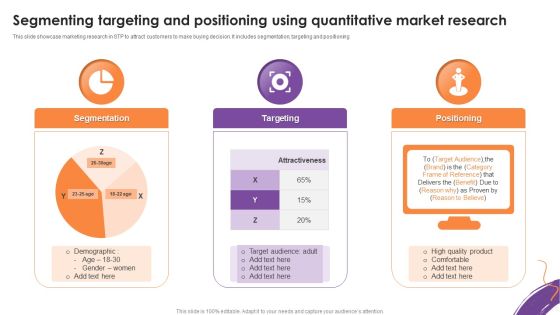
Segmenting Targeting And Positioning Using Quantitative Market Research Download PDF
This slide showcase marketing research in STP to attract customers to make buying decision. It includes segmentation, targeting and positioning. Showcasing this set of slides titled Segmenting Targeting And Positioning Using Quantitative Market Research Download PDF. The topics addressed in these templates are Segmentation, Targeting, Positioning. All the content presented in this PPT design is completely editable. Download it and make adjustments in color, background, font etc. as per your unique business setting.
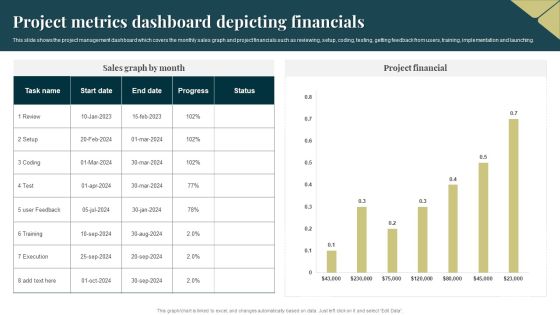
Project Metrics Dashboard Depicting Financials Pictures PDF
This slide shows the project management dashboard which covers the monthly sales graph and project financials such as reviewing, setup, coding, testing, getting feedback from users, training, implementation and launching. Pitch your topic with ease and precision using this Project Metrics Dashboard Depicting Financials Pictures PDF. This layout presents information on Execution, Project Financial. It is also available for immediate download and adjustment. So, changes can be made in the color, design, graphics or any other component to create a unique layout.
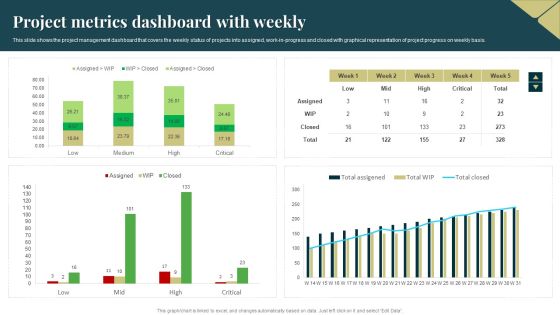
Project Metrics Dashboard With Weekly Formats PDF
This slide shows the project management dashboard that covers the weekly status of projects into assigned, work in progress and closed with graphical representation of project progress on weekly basis. Showcasing this set of slides titled Project Metrics Dashboard With Weekly Formats PDF. The topics addressed in these templates are Project Metrics, Dashboard With Weekly. All the content presented in this PPT design is completely editable. Download it and make adjustments in color, background, font etc. as per your unique business setting.

Dashboard Showcasing Target User Procurement Background PDF
This slide represents target and potential user acquisition dashboard. It cover number of user, channel wise users, brand wise user acquisition etc. Showcasing this set of slides titled Dashboard Showcasing Target User Procurement Background PDF. The topics addressed in these templates are Acquisition Through, Acquisition Brand, Potential. All the content presented in this PPT design is completely editable. Download it and make adjustments in color, background, font etc. as per your unique business setting.

Staff Average Age Statistics According To Department Demonstration PDF
This slide illustrates the staff average age working in different departments. It includes departments such as senior management, manual, admin professional and technical and academic. Showcasing this set of slides titled Staff Average Age Statistics According To Department Demonstration PDF. The topics addressed in these templates are Administration Professional, Management, Employee. All the content presented in this PPT design is completely editable. Download it and make adjustments in color, background, font etc. as per your unique business setting.
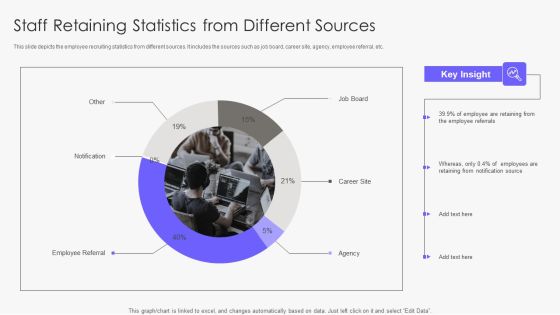
Staff Retaining Statistics From Different Sources Sample PDF
This slide depicts the employee recruiting statistics from different sources. It includes the sources such as job board, career site, agency, employee referral, etc. Showcasing this set of slides titled Staff Retaining Statistics From Different Sources Sample PDF. The topics addressed in these templates are Employee Referrals, Notification Source. All the content presented in this PPT design is completely editable. Download it and make adjustments in color, background, font etc. as per your unique business setting.
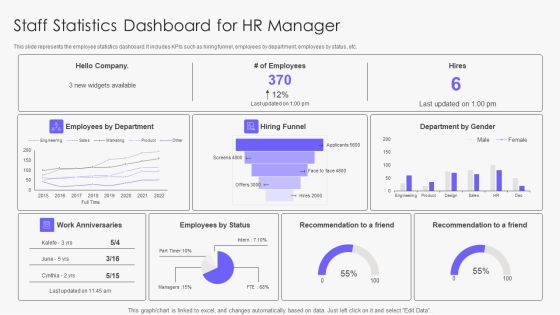
Staff Statistics Dashboard For Hr Manager Rules PDF
This slide represents the employee statistics dashboard. It includes KPIs such as hiring funnel, employees by department, employees by status, etc. Pitch your topic with ease and precision using this Staff Statistics Dashboard For Hr Manager Rules PDF. This layout presents information on Hiring Funnel, Employees By Status, Employees By Department. It is also available for immediate download and adjustment. So, changes can be made in the color, design, graphics or any other component to create a unique layout.
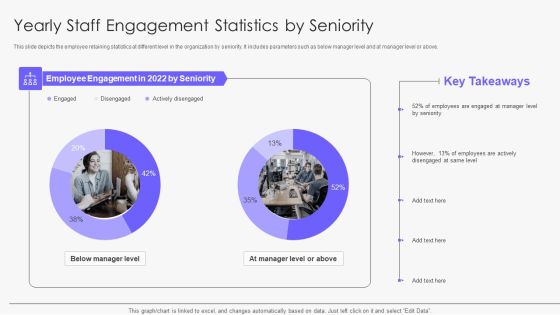
Yearly Staff Engagement Statistics By Seniority Download PDF
This slide depicts the employee retaining statistics at different level in the organization by seniority. It includes parameters such as below manager level and at manager level or above. Showcasing this set of slides titled Yearly Staff Engagement Statistics By Seniority Download PDF. The topics addressed in these templates are Yearly Staff Engagement Statistics. All the content presented in this PPT design is completely editable. Download it and make adjustments in color, background, font etc. as per your unique business setting.

Yearly Staff Engagement Trend Statistics Demonstration PDF
This slide represents the line graph for analyzing employee engagement trend . It includes the statistics such as percentage of engaged and actively disengaged employees. Pitch your topic with ease and precision using this Yearly Staff Engagement Trend Statistics Demonstration PDF. This layout presents information on Team, Employees, Average. It is also available for immediate download and adjustment. So, changes can be made in the color, design, graphics or any other component to create a unique layout.

Cyber Security KPI Dashboard With Metrics Microsoft PDF
This slide showcases dashboard of security support cell based on complaints recorded from ABC company. It includes complaints, non complaints, open and close tickets and security incident by quarter. Showcasing this set of slides titled Cyber Security KPI Dashboard With Metrics Microsoft PDF. The topics addressed in these templates are Cyber Security, Kpi Dashboard With Metrics. All the content presented in this PPT design is completely editable. Download it and make adjustments in color, background, font etc. as per your unique business setting.
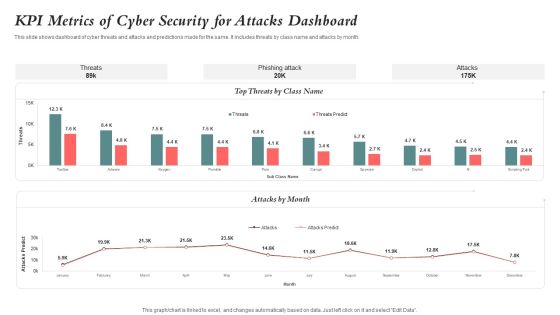
KPI Metrics Of Cyber Security For Attacks Dashboard Guidelines PDF
This slide shows dashboard of cyber threats and attacks and predictions made for the same. It includes threats by class name and attacks by month. Showcasing this set of slides titled KPI Metrics Of Cyber Security For Attacks Dashboard Guidelines PDF. The topics addressed in these templates are Kpi Metrics, Cyber Security, Attacks Dashboard. All the content presented in this PPT design is completely editable. Download it and make adjustments in color, background, font etc. as per your unique business setting.

Team Distrust Barrier To Business Effective Communication Infographics PDF
The following slide showcases team distrust that affect workforce communication. Main problems faced by employee are that they dont receive clear instructions, inability to collaborate etc. Pitch your topic with ease and precision using this Team Distrust Barrier To Business Effective Communication Infographics PDF. This layout presents information on Team Distrust Barrier, Business Effective Communication. It is also available for immediate download and adjustment. So, changes can be made in the color, design, graphics or any other component to create a unique layout.

Campaign Metrics With Lead Generated Through Regions Clipart PDF
This template covers about lead generated through regions on daily and monthly basis . Further, it includes top social media channels and lead breakdown. Showcasing this set of slides titled Campaign Metrics With Lead Generated Through Regions Clipart PDF. The topics addressed in these templates are Key Conversion Metrics, Quality, Social Media. All the content presented in this PPT design is completely editable. Download it and make adjustments in color, background, font etc. as per your unique business setting.

Campaign Metrics With Traffic Report Information PDF
This template covers about traffic generated with daily number of sessions by user. This further includes behavioral response through analyzing page views. Pitch your topic with ease and precision using this Campaign Metrics With Traffic Report Information PDF. This layout presents information on Origins, Behaviour, Bounce Rate. It is also available for immediate download and adjustment. So, changes can be made in the color, design, graphics or any other component to create a unique layout.

Increment In Social Media Engagement Through Campaign Metrics Professional PDF
This slide covers increment in social media engagement through campaign KPI which include lead break breakdown, online analytics of web traffic and key conversion metrics. Pitch your topic with ease and precision using this Increment In Social Media Engagement Through Campaign Metrics Professional PDF. This layout presents information on Quality, Key Conversion Metrics, Social Media. It is also available for immediate download and adjustment. So, changes can be made in the color, design, graphics or any other component to create a unique layout.
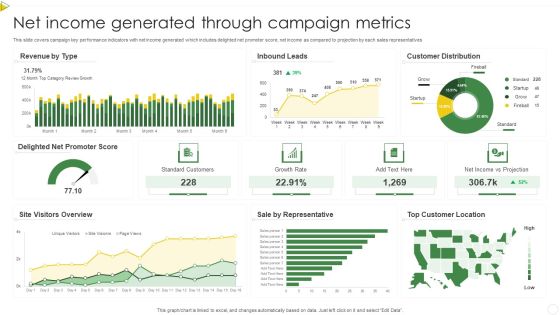
Net Income Generated Through Campaign Metrics Summary PDF
This slide covers campaign key performance indicators with net income generated which includes delighted net promoter score, net income as compared to projection by each sales representatives. Pitch your topic with ease and precision using this Net Income Generated Through Campaign Metrics Summary PDF. This layout presents information on Standard Customers, Growth Rate, Net Income. It is also available for immediate download and adjustment. So, changes can be made in the color, design, graphics or any other component to create a unique layout.
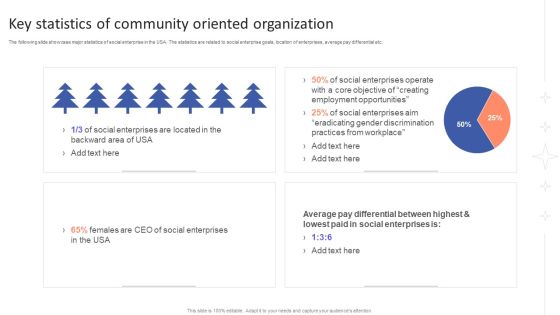
Key Statistics Of Community Oriented Organization Graphics PDF
The following slide showcase major statistics of social enterprise in the USA. The statistics are related to social enterprise goals, location of enterprises, average pay differential etc. Showcasing this set of slides titled Key Statistics Of Community Oriented Organization Graphics PDF. The topics addressed in these templates are Employment Opportunities, Social Enterprises, Average Pay. All the content presented in this PPT design is completely editable. Download it and make adjustments in color, background, font etc. as per your unique business setting.
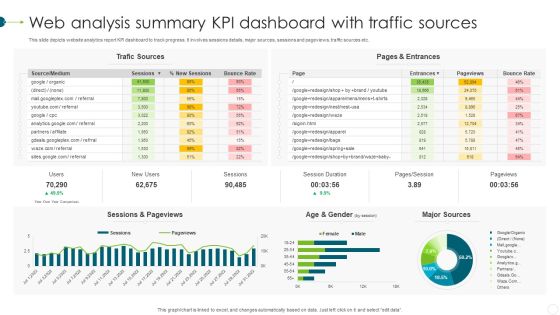
Web Analysis Summary KPI Dashboard With Traffic Sources Portrait PDF
This slide depicts website analytics report KPI dashboard to track progress. It involves sessions details, major sources, sessions and pageviews, traffic sources etc. Showcasing this set of slides titled Web Analysis Summary KPI Dashboard With Traffic Sources Portrait PDF. The topics addressed in these templates are Web Analysis Summary, KPI Dashboard, Traffic Sources. All the content presented in this PPT design is completely editable. Download it and make adjustments in color, background, font etc. as per your unique business setting.

Web Analysis Summary KPI Dashboards With Globally Sessions Mockup PDF
This slide depicts website analytics dashboard. It depicts details such as number of sessions, views, users, average website bounces and new sessions etc. Showcasing this set of slides titled Web Analysis Summary KPI Dashboards With Globally Sessions Mockup PDF. The topics addressed in these templates are Website Analytics, Metrics, Website Performance. All the content presented in this PPT design is completely editable. Download it and make adjustments in color, background, font etc. as per your unique business setting.

Web Monthly Usage Analysis Summary Dashboard Clipart PDF
This slide depicts website usage analytics report for tracking performance. It involves number of users, sessions, bounce rate and average session duration. Pitch your topic with ease and precision using this Web Monthly Usage Analysis Summary Dashboard Clipart PDF. This layout presents information on Agency Metrics, Source Rate, Goal. It is also available for immediate download and adjustment. So, changes can be made in the color, design, graphics or any other component to create a unique layout.
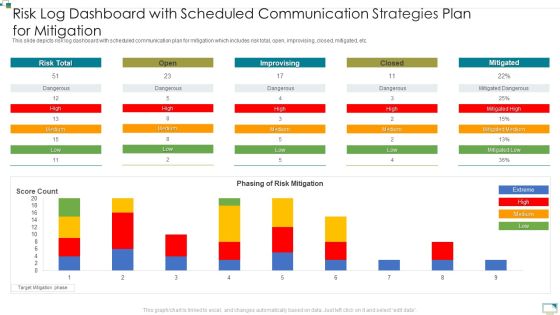
Risk Log Dashboard With Scheduled Communication Strategies Plan For Mitigation Brochure PDF
This slide depicts risk log dashboard with scheduled communication plan for mitigation which includes risk total, open, improvising, closed, mitigated, etc. Pitch your topic with ease and precision using this Risk Log Dashboard With Scheduled Communication Strategies Plan For Mitigation Brochure PDF. This layout presents information on Risk Total, Phasing, Risk Mitigation. It is also available for immediate download and adjustment. So, changes can be made in the color, design, graphics or any other component to create a unique layout.
Problem Tracker And Mitigation KPI Dashboard Sample PDF
The following slide summarizes the annual data of issue management. It mainly constitutes of number of issues, status, average time taken to resolve, statistics for resolved and resolved issues etc. Showcasing this set of slides titled Problem Tracker And Mitigation KPI Dashboard Sample PDF. The topics addressed in these templates are Problem Tracker, Mitigation KPI Dashboard. All the content presented in this PPT design is completely editable. Download it and make adjustments in color, background, font etc. as per your unique business setting.
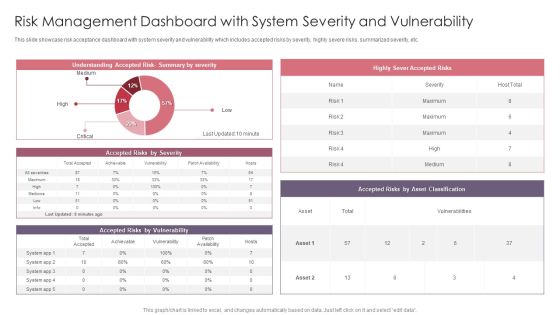
Risk Management Dashboard With System Severity And Vulnerability Template PDF
This slide showcase risk acceptance dashboard with system severity and vulnerability which includes accepted risks by severity, highly severe risks, summarized severity, etc. Showcasing this set of slides titled Risk Management Dashboard With System Severity And Vulnerability Template PDF. The topics addressed in these templates are Risk Management Dashboard, System Severity And Vulnerability. All the content presented in this PPT design is completely editable. Download it and make adjustments in color, background, font etc. as per your unique business setting.
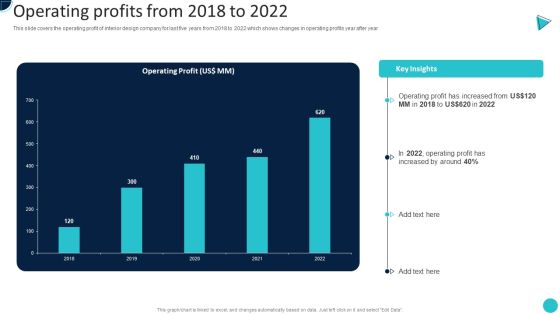
Home Decoration Company Profile Operating Profits From 2018 To 2022 Inspiration PDF
This slide covers the operating profit of interior design company for last five years from 2018 to 2022 which shows changes in operating profits year after year.Deliver and pitch your topic in the best possible manner with this Home Decoration Company Profile Operating Profits From 2018 To 2022 Inspiration PDF. Use them to share invaluable insights on Operating Profit, Increased, Increased Around and impress your audience. This template can be altered and modified as per your expectations. So, grab it now.

Home Decoration Company Profile Revenue And Net Profit Analysis Themes PDF
This slide focuses on financial highlights of interior design company which represents revenue and net profit for last five years from 2018 to 2022.Deliver an awe inspiring pitch with this creative Home Decoration Company Profile Revenue And Net Profit Analysis Themes PDF bundle. Topics like Net Profit, Increased, Companys Revenue can be discussed with this completely editable template. It is available for immediate download depending on the needs and requirements of the user.

Commercial And Urban Architect Business Profile Total Projects Completed In 2022 Formats PDF
This slide highlights the total projects completed by architecture company through pie chart. It includes data of residential single and multi family homes, commercial, public, interiors, small projects and heritage projects. Deliver an awe inspiring pitch with this creative Commercial And Urban Architect Business Profile Total Projects Completed In 2022 Formats PDF bundle. Topics like Urban Design, Commercial, Small Projects can be discussed with this completely editable template. It is available for immediate download depending on the needs and requirements of the user.

Customer Relationship Management Lifecycle Analytics Dashboard With Sales Record Brochure PDF
This slide signifies the customer relationship management analytics dashboard. It covers information about sales record by different representative, total products sold, sales by different month, etc.Pitch your topic with ease and precision using this Customer Relationship Management Lifecycle Analytics Dashboard With Sales Record Brochure PDF. This layout presents information on Sales Record, Representative, Total Items. It is also available for immediate download and adjustment. So, changes can be made in the color, design, graphics or any other component to create a unique layout.
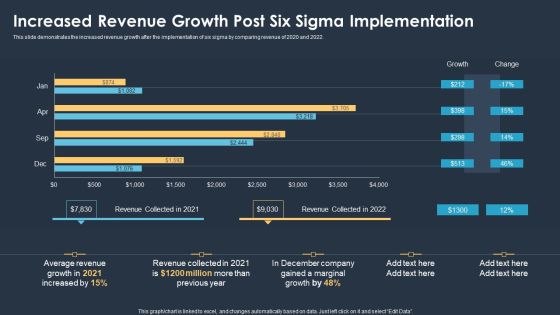
Six Sigma Methodologies For Process Optimization Increased Revenue Growth Post Six Sigma Implementation Template PDF
This slide demonstrates the increased revenue growth after the implementation of six sigma by comparing revenue of 2020 and 2022. Pitch your topic with ease and precision using this Six Sigma Methodologies For Process Optimization Increased Revenue Growth Post Six Sigma Implementation Template PDF. This layout presents information on Average Revenue Growth, Marginal Growth. It is also available for immediate download and adjustment. So, changes can be made in the color, design, graphics or any other component to create a unique layout.
