Cost Dashboard

Client Helpline Dashboard With Resolution And Response Rate Ppt File Example Topics PDF
This graph or chart is linked to excel, and changes automatically based on data. Just left click on it and select Edit Data. Showcasing this set of slides titled Client Helpline Dashboard With Resolution And Response Rate Ppt File Example Topics PDF. The topics addressed in these templates are Resolutions, Response Time, Response Time Weekday. All the content presented in this PPT design is completely editable. Download it and make adjustments in color, background, font etc. as per your unique business setting.

Client Helpline Dashboard With Ticket Resolution Ppt Model Graphics Design PDF
This graph or chart is linked to excel, and changes automatically based on data. Just left click on it and select Edit Data. Pitch your topic with ease and precision using this Client Helpline Dashboard With Ticket Resolution Ppt Model Graphics Design PDF. This layout presents information on Ticket Due Times, Sourcewise Tickets, Open Tickets. It is also available for immediate download and adjustment. So, changes can be made in the color, design, graphics or any other component to create a unique layout.

Help Desk Call Centre Service Level Agreement KPI Dashboard Pictures PDF
This graph or chart is linked to excel, and changes automatically based on data. Just left click on it and select Edit Data. Showcasing this set of slides titled Help Desk Call Centre Service Level Agreement KPI Dashboard Pictures PDF. The topics addressed in these templates are Call Type Today, Occupancy Today, Call Summary Today. All the content presented in this PPT design is completely editable. Download it and make adjustments in color, background, font etc. as per your unique business setting.
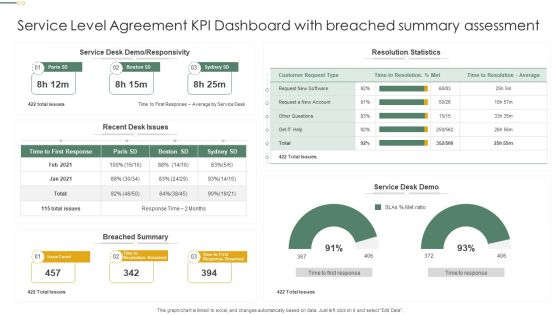
Service Level Agreement KPI Dashboard With Breached Summary Assessment Professional PDF
This graph or chart is linked to excel, and changes automatically based on data. Just left click on it and select Edit Data. Pitch your topic with ease and precision using this Service Level Agreement KPI Dashboard With Breached Summary Assessment Professional PDF. This layout presents information on Resolution Statistics, Service Desk Demo, Breached Summary. It is also available for immediate download and adjustment. So, changes can be made in the color, design, graphics or any other component to create a unique layout.
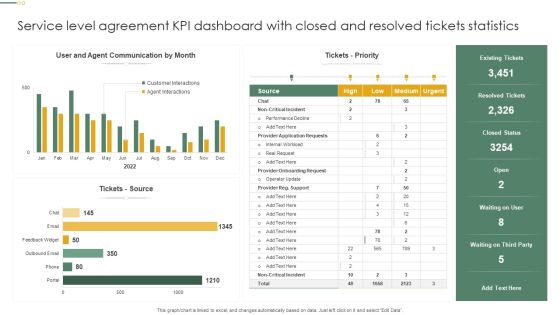
Service Level Agreement KPI Dashboard With Closed And Resolved Tickets Statistics Inspiration PDF
This graph or chart is linked to excel, and changes automatically based on data. Just left click on it and select Edit Data. Showcasing this set of slides titled Service Level Agreement KPI Dashboard With Closed And Resolved Tickets Statistics Inspiration PDF. The topics addressed in these templates are Tickets Priority, Tickets Source, Resolved Tickets. All the content presented in this PPT design is completely editable. Download it and make adjustments in color, background, font etc. as per your unique business setting.
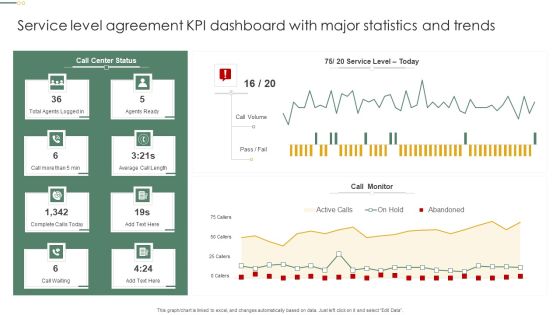
Service Level Agreement KPI Dashboard With Major Statistics And Trends Pictures PDF
This graph or chart is linked to excel, and changes automatically based on data. Just left click on it and select Edit Data. Pitch your topic with ease and precision using this Service Level Agreement KPI Dashboard With Major Statistics And Trends Pictures PDF. This layout presents information on Call Monitor, Call Volume, Agents Ready. It is also available for immediate download and adjustment. So, changes can be made in the color, design, graphics or any other component to create a unique layout.
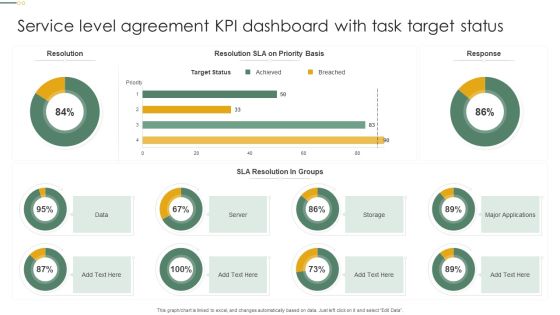
Service Level Agreement KPI Dashboard With Task Target Status Microsoft PDF
This graph or chart is linked to excel, and changes automatically based on data. Just left click on it and select Edit Data. Pitch your topic with ease and precision using this Service Level Agreement KPI Dashboard With Task Target Status Microsoft PDF. This layout presents information on Target Status, Sla Resolution, Groups, Server. It is also available for immediate download and adjustment. So, changes can be made in the color, design, graphics or any other component to create a unique layout.

Helpdesk SLA KPL Dashboard Illustrating Calls Details Ppt Slides Show PDF
This graph or chart is linked to excel, and changes automatically based on data. Just left click on it and select Edit Data. Showcasing this set of slides titled Helpdesk SLA KPL Dashboard Illustrating Calls Details Ppt Slides Show PDF. The topics addressed in these templates are Call Type Today, Trunk Utilization Today, Call Summery Today. All the content presented in this PPT design is completely editable. Download it and make adjustments in color, background, font etc. as per your unique business setting.

Service SLA KPL Changes And Incidents Dashboard Ppt Inspiration Infographics PDF
This graph or chart is linked to excel, and changes automatically based on data. Just left click on it and select Edit Data. Pitch your topic with ease and precision using this Service SLA KPL Changes And Incidents Dashboard Ppt Inspiration Infographics PDF. This layout presents information on Time Spent Department, Incidents Closed, Operator Group. It is also available for immediate download and adjustment. So, changes can be made in the color, design, graphics or any other component to create a unique layout.

SLA KPL Dashboard Indicating Compliance Priority With KPI Ppt File Format PDF
This graph or chart is linked to excel, and changes automatically based on data. Just left click on it and select Edit Data. Showcasing this set of slides titled SLA KPL Dashboard Indicating Compliance Priority With KPI Ppt File Format PDF. The topics addressed in these templates are KPI Graph, Insights Here, SLA Compliance Priority. All the content presented in this PPT design is completely editable. Download it and make adjustments in color, background, font etc. as per your unique business setting.

SLA KPL Overview Dashboard Depicting Service Targets Ppt Slides Maker PDF
This graph or chart is linked to excel, and changes automatically based on data. Just left click on it and select Edit Data. Pitch your topic with ease and precision using this SLA KPL Overview Dashboard Depicting Service Targets Ppt Slides Maker PDF. This layout presents information on Monthly Trend, Service Target, Quarterly Trend. It is also available for immediate download and adjustment. So, changes can be made in the color, design, graphics or any other component to create a unique layout.

Dashboard To Measure Performance Of E Commerce Retail Business Growth Marketing Techniques Icons PDF
This following slide displays the key metrics that can help an organization to measure effectiveness of e-commerce strategies. These can be revenue generated using e-commerce platform, conversion rates etc. If your project calls for a presentation, then Slidegeeks is your go to partner because we have professionally designed, easy to edit templates that are perfect for any presentation. After downloading, you can easily edit Dashboard To Measure Performance Of E Commerce Retail Business Growth Marketing Techniques Icons PDF and make the changes accordingly. You can rearrange slides or fill them with different images. Check out all the handy templates
HR Manager KPI Dashboard With Employee Attrition Tracking Report Brochure PDF
This slide covers performance key indicators for HR manager. It also indicates employee turnover count, new recruitment, retention, training and development of new employees. Showcasing this set of slides titled HR Manager KPI Dashboard With Employee Attrition Tracking Report Brochure PDF. The topics addressed in these templates are Recruitment, Employee Turnover, Development. All the content presented in this PPT design is completely editable. Download it and make adjustments in color, background, font etc. as per your unique business setting.
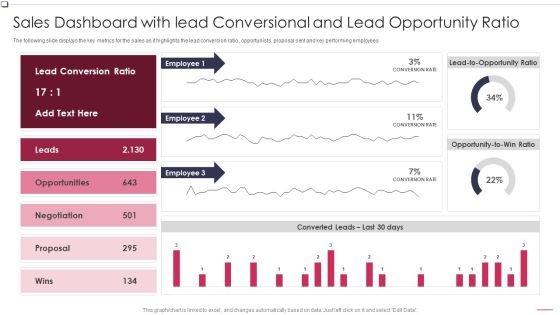
Sales Dashboard With Lead Conversional Ratio Business To Business Promotion Sales Lead Slides PDF
The following slide displays the key metrics for the sales as it highlights the lead conversion ratio , opportunists, proposal sent and key performing employees. Deliver an awe inspiring pitch with this creative Sales Dashboard With Lead Conversional Ratio Business To Business Promotion Sales Lead Slides PDF bundle. Topics like Opportunity Ratio, Converted Leads, Conversional can be discussed with this completely editable template. It is available for immediate download depending on the needs and requirements of the user.

Digital Audit Dashboard Highlighting Website Visitors With Device And Social Networks Download PDF
This slide highlights the website visitors by different countries which also includes the users and session data from last 10 days, it also includes user demographic. Device and new vs returning user.Deliver an awe inspiring pitch with this creative Digital Audit Dashboard Highlighting Website Visitors With Device And Social Networks Download PDF bundle. Topics like Website Visitors, Social Networks can be discussed with this completely editable template. It is available for immediate download depending on the needs and requirements of the user.

Digital Audit Dashboard Highlighting Website Visitors With Device And Social Networks Themes PDF
This slide highlights the website visitors by different countries which also includes the users and session data from last 10 days, it also includes user demographic. Device and new vs returning user.Deliver an awe inspiring pitch with this creative Digital Audit Dashboard Highlighting Website Visitors With Device And Social Networks Themes PDF bundle. Topics like Visitors Country, Social Networks, Demographics can be discussed with this completely editable template. It is available for immediate download depending on the needs and requirements of the user.

Deployment Procedure Of Hyper Automation RPA And Hyper Automation Impact Dashboard For Healthcare Formats PDF
The following slide provides an overview of the impact of RPA and Hyper automation on healthcare , the provided highlights patients in and out time, patient data. There are so many reasons you need a Deployment Procedure Of Hyper Automation RPA And Hyper Automation Impact Dashboard For Healthcare Formats PDF. The first reason is you can not spend time making everything from scratch, Thus, Slidegeeks has made presentation templates for you too. You can easily download these templates from our website easily.

Agile Team Member Customer Relationship Management Dashboard With Deals Funnel Mockup PDF
This slide illustrates graphical representation of CRM sales team member data. It includes pipeline, business components and activity level, categories etc. Pitch your topic with ease and precision using this Agile Team Member Customer Relationship Management Dashboard With Deals Funnel Mockup PDF. This layout presents information on Funnel Of Deals, Sent Campaigns Emails, Sales Chart. It is also available for immediate download and adjustment. So, changes can be made in the color, design, graphics or any other component to create a unique layout.

Customer Relationship Management Salesperson Dashboard With Pipeline And Activity Level Designs PDF
This slide illustrates graphical representation of CRM sales team member data. It includes pipeline, business components and activity level, categories etc. Pitch your topic with ease and precision using this Customer Relationship Management Salesperson Dashboard With Pipeline And Activity Level Designs PDF. This layout presents information on Categories, Business Components, Team Member. It is also available for immediate download and adjustment. So, changes can be made in the color, design, graphics or any other component to create a unique layout.

Growing Churn Rate In IT Organization Dashboard Employee Attrition Rate Employee Download PDF
Deliver and pitch your topic in the best possible manner with this growing churn rate in it organization dashboard employee attrition rate employee download pdf. Use them to share invaluable insights on turnover rate year over year, turnover rate by division, actual vs benchmark work time in months per division and impress your audience. This template can be altered and modified as per your expectations. So, grab it now.

Sales Dashboard With Lead Conversional And Lead Opportunity Ratio Company Qualification Procedure Information PDF
The following slide displays the key metrics for the sales as it highlights the lead conversion ratio , opportunists, proposal sent and key performing employees.Deliver and pitch your topic in the best possible manner with this Sales Dashboard With Lead Conversional And Lead Opportunity Ratio Company Qualification Procedure Information PDF Use them to share invaluable insights on Lead Conversion, Opportunities, Negotiation and impress your audience. This template can be altered and modified as per your expectations. So, grab it now.
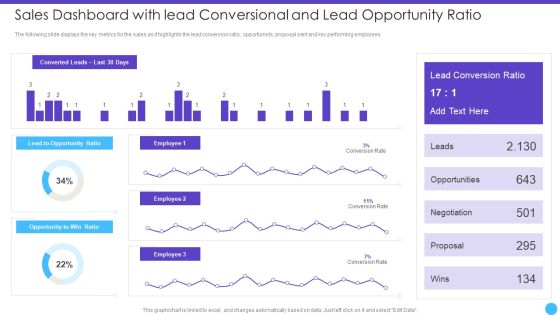
Sales Lead Qualification Rating Framework Sales Dashboard With Lead Conversional And Lead Opportunity Ratio Structure PDF
The following slide displays the key metrics for the sales as it highlights the lead conversion ratio , opportunists, proposal sent and key performing employees.Deliver an awe inspiring pitch with this creative Sales Lead Qualification Rating Framework Sales Dashboard With Lead Conversional And Lead Opportunity Ratio Structure PDF bundle. Topics like Opportunities, Negotiation, Proposal can be discussed with this completely editable template. It is available for immediate download depending on the needs and requirements of the user.

Sales Lead Qualification Procedure And Parameter Sales Dashboard With Lead Conversional Graphics PDF
The following slide displays the key metrics for the sales as it highlights the lead conversion ratio , opportunists, proposal sent and key performing employees.Deliver an awe inspiring pitch with this creative Sales Lead Qualification Procedure And Parameter Sales Dashboard With Lead Conversional Graphics PDF bundle. Topics like Lead Conversion, Opportunities, Negotiation can be discussed with this completely editable template. It is available for immediate download depending on the needs and requirements of the user.
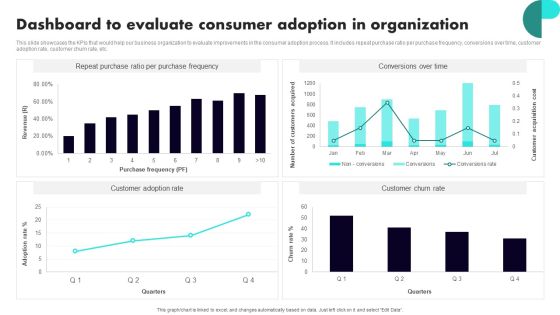
Implementing Client Onboarding Process Dashboard To Evaluate Consumer Adoption In Organization Diagrams PDF
This slide showcases the KPIs that would help our business organization to evaluate improvements in the consumer adoption process. It includes repeat purchase ratio per purchase frequency, conversions over time, customer adoption rate, customer churn rate, etc. Do you have an important presentation coming up Are you looking for something that will make your presentation stand out from the rest Look no further than Implementing Client Onboarding Process Dashboard To Evaluate Consumer Adoption In Organization Diagrams PDF. With our professional designs, you can trust that your presentation will pop and make delivering it a smooth process. And with Slidegeeks, you can trust that your presentation will be unique and memorable. So why wait Grab Implementing Client Onboarding Process Dashboard To Evaluate Consumer Adoption In Organization Diagrams PDF today and make your presentation stand out from the rest.
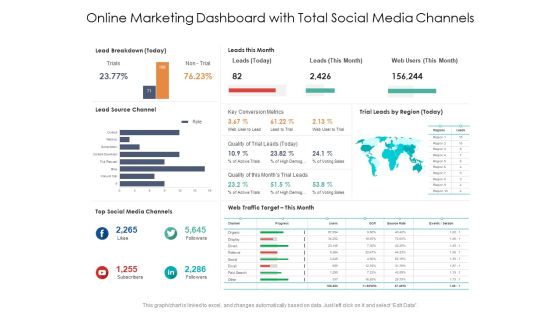
Online Marketing Dashboard With Total Social Media Channels Ppt PowerPoint Presentation Show Maker PDF
Presenting this set of slides with name online marketing dashboard with total social media channels ppt powerpoint presentation show maker pdf. The topics discussed in these slides are lead breakdown, leads this month, key conversion metrics, quality of trial leads, web traffic target, top social media channels, lead source channel. This is a completely editable PowerPoint presentation and is available for immediate download. Download now and impress your audience.

Inbound Interruption Commerce Promotion Practices E Mail Campaign Dashboard Ppt Inspiration Topics PDF
The following slide displays the key metrics for the E-mail marketing campaign of the organization, the following slide highlights the direct sessions, the organic sessions and the frequency oat which e-mail have been sent. Deliver and pitch your topic in the best possible manner with this inbound interruption commerce promotion practices E mail campaign dashboard ppt inspiration topics pdf. Use them to share invaluable insights on organic sessions, email marketing, google analytics and impress your audience. This template can be altered and modified as per your expectations. So, grab it now.
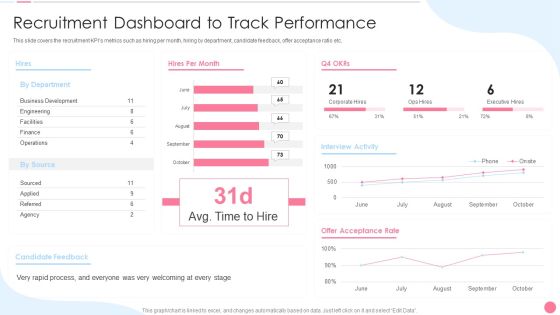
Social Media Hiring Approach Recruitment Dashboard To Track Performance Formats PDF
This slide covers the recruitment KPIs metrics such as hiring per month, hiring by department, candidate feedback, offer acceptance ratio etc. Deliver and pitch your topic in the best possible manner with this Social Media Hiring Approach Recruitment Dashboard To Track Performance Formats PDF. Use them to share invaluable insights on Business Development, Engineering, Acceptance Rate and impress your audience. This template can be altered and modified as per your expectations. So, grab it now.
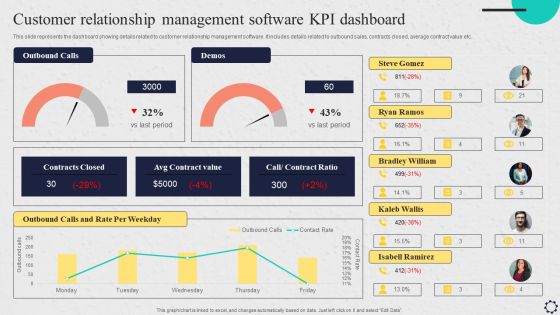
Software Implementation Strategy Customer Relationship Management Software Kpi Dashboard Clipart PDF
This slide represents the dashboard showing details related to customer relationship management software. It includes details related to outbound sales, contracts closed, average contract value etc. Are you in need of a template that can accommodate all of your creative concepts This one is crafted professionally and can be altered to fit any style. Use it with Google Slides or PowerPoint. Include striking photographs, symbols, depictions, and other visuals. Fill, move around, or remove text boxes as desired. Test out color palettes and font mixtures. Edit and save your work, or work with colleagues. Download Software Implementation Strategy Customer Relationship Management Software Kpi Dashboard Clipart PDF and observe how to make your presentation outstanding. Give an impeccable presentation to your group and make your presentation unforgettable.

Global Cloud Based Email Security Market KPI Dashboard For E Mail Security Ideas PDF
Presenting this set of slides with name global cloud based email security market kpi dashboard for e mail security ideas pdf. The topics discussed in these slides are test backup restore, physical backup or archive media that are fully encrypted, obsolete user accounts, average time to restore backup. This is a completely editable PowerPoint presentation and is available for immediate download. Download now and impress your audience.

Online Product Planning Ecommerce Management KPI Dashboard Ppt Layouts Background Image PDF
Presenting this set of slides with name online product planning ecommerce management kpi dashboard ppt layouts background image pdf. The topics discussed in these slides are total volume sold this month, average purchase value, growth in average purchase value, growth in volume sold this month, growth in sales this month, total sales this month. This is a completely editable PowerPoint presentation and is available for immediate download. Download now and impress your audience.

Dashboard Showing Sales Gap Analysis Ppt PowerPoint Presentation Infographic Template Graphics Pictures PDF
Presenting this set of slides with name dashboard showing sales gap analysis ppt powerpoint presentation infographic template graphics pictures pdf. The topics discussed in these slides are bookings month, total forecast month open opportumities, forecasted value closing number deals month, sales cycle, bookings this quarter, goal. This is a completely editable PowerPoint presentation and is available for immediate download. Download now and impress your audience.

Workforce Management System Dashboard With Job Openings Ppt PowerPoint Presentation Styles Graphics PDF
Presenting this set of slides with name workforce management system dashboard with job openings ppt powerpoint presentation styles graphics pdf. The topics discussed in these slides are upcoming birthdays, documents not submitted, expiry alerts, employee work anniversary, new joining employee, new joining employee, pending self appraisal, pending final settlement. This is a completely editable PowerPoint presentation and is available for immediate download. Download now and impress your audience.

Dashboard Showing Causes Of Employee Attrition Ppt PowerPoint Presentation Summary Design Templates PDF
Presenting this set of slides with name dashboard showing causes of employee attrition ppt powerpoint presentation summary design templates pdf. The topics discussed in these slides are work travel causing attrition by percentage, overtime causing attrition by percentage, attrition due to monthly salary by percentage, salary structure. This is a completely editable PowerPoint presentation and is available for immediate download. Download now and impress your audience.
Employee Turnover Dashboard With Gender Wise Attrition Rate Ppt PowerPoint Presentation Model Icons PDF
Presenting this set of slides with name employee turnover dashboard with gender wise attrition rate ppt powerpoint presentation model icons pdf. The topics discussed in these slides are estimated attrition, gender wise attrition rate, department wise attrition rate, attrition rate due salary hike, attrition rate due to distance from home, work travel causing attrition. This is a completely editable PowerPoint presentation and is available for immediate download. Download now and impress your audience.

Business Dashboard Showing Total Revenue Ppt PowerPoint Presentation Visual Aids Icon PDF
Presenting this set of slides with name business dashboard showing total revenue ppt powerpoint presentation visual aids icon pdf. The topics discussed in these slides are total revenue, 22 product types share in total revenue, 6 product lines product types revenue share within product line, profit and quatity running total, product line color key. This is a completely editable PowerPoint presentation and is available for immediate download. Download now and impress your audience.

Consumer Assessment Dashboard For Business To Business Service Ppt PowerPoint Presentation Professional Smartart PDF
Presenting this set of slides with name consumer assessment dashboard for business to business service ppt powerpoint presentation professional smartart pdf. The topics discussed in these slides are total active customers, total acv this quarter, new mrr this quarter, leads to win funnel, prospects by bus seg and vertical, enterprise, mid market, small business. This is a completely editable PowerPoint presentation and is available for immediate download. Download now and impress your audience.

Consumer Assessment Dashboard With Response Time Ppt PowerPoint Presentation Professional Visual Aids PDF
Presenting this set of slides with name consumer assessment dashboard with response time ppt powerpoint presentation professional visual aids pdf. The topics discussed in these slides are first call resolution, unresolved calls, avg response time, best day to call, response time by weekday, response time, resolutions. This is a completely editable PowerPoint presentation and is available for immediate download. Download now and impress your audience.

business intelligence and analytics dashboard ppt powerpoint presentation icon example topics pdf
Presenting this set of slides with name business intelligence and analytics dashboard ppt powerpoint presentation icon example topics pdf. The topics discussed in these slides are geographic distribution of total revenue, top 5 product by total revenue, measuring running by total revenue, how close are we to tour planned total revenue. This is a completely editable PowerPoint presentation and is available for immediate download. Download now and impress your audience.

Water NRM Water Management KPI Dashboard Showing Water Quality Test Results Information PDF
Presenting this set of slides with name water nrm water management kpi dashboard showing water quality test results information pdf. The topics discussed in these slides are contaminants causing epa non compliance, water quality, water quality test results, samples exceeding health guidelines samples with unregulated contaminates detected. This is a completely editable PowerPoint presentation and is available for immediate download. Download now and impress your audience.
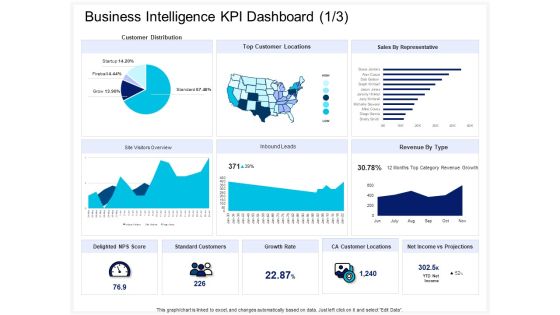
Enterprise Problem Solving And Intellect Business Intelligence KPI Dashboard Growth Ppt PowerPoint Presentation Model Images PDF
Presenting this set of slides with name enterprise problem solving and intellect business intelligence kpi dashboard growth ppt powerpoint presentation model images pdf. The topics discussed in these slides are sales representative, delighted nps score, standard customers, growth rate, ca customer locations, net income vs projections, revenue type, top customer locations, customer distribution. This is a completely editable PowerPoint presentation and is available for immediate download. Download now and impress your audience.

Sales Management Dashboard With Win Rate Ppt PowerPoint Presentation Show Demonstration PDF
Presenting this set of slides with name sales management dashboard with win rate ppt powerpoint presentation show demonstration pdf. The topics discussed in these slides are team quota attainment for quarter, current sales content, team closed deals qtd, win rate, closed business by type, pipeline top deals. This is a completely editable PowerPoint presentation and is available for immediate download. Download now and impress your audience.
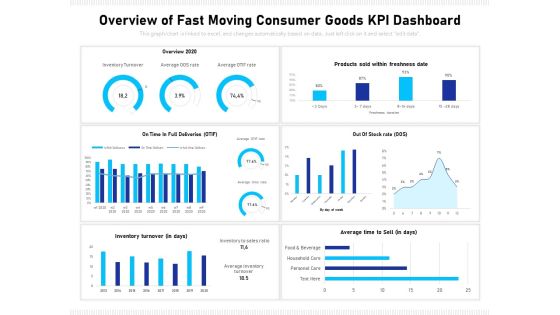
Overview Of Fast Moving Consumer Goods Kpi Dashboard Ppt PowerPoint Presentation Show Visual Aids PDF
Showcasing this set of slides titled overview of fast moving consumer goods kpi dashboard ppt powerpoint presentation show visual aids pdf. The topics addressed in these templates are overview 2020, on time in full deliveries otif, out of stock rate oos, inventory turnover in days, average time to sell in days. All the content presented in this PPT design is completely editable. Download it and make adjustments in color, background, font etc. as per your unique business setting.

Business Opportunity Assessment Dashboard With Various Ppt PowerPoint Presentation Professional Graphics Download PDF
Pitch your topic with ease and precision using this business opportunity assessment dashboard with various ppt powerpoint presentation professional graphics download pdf. This layout presents information on opportunity size, individual opportunity count by sales stages, opportunity count by region, opportunity count by sales stage. It is also available for immediate download and adjustment. So, changes can be made in the color, design, graphics or any other component to create a unique layout.

CRM System Competitive Dashboard With Sales Pipeline Ppt PowerPoint Presentation Icon Outfit PDF
Showcasing this set of slides titled crm system competitive dashboard with sales pipeline ppt powerpoint presentation icon outfit pdf. The topics addressed in these templates are sales forecast by competitor, win loss report, open opportunity revenue by competitor, sales pipeline by sales rep, competitor. All the content presented in this PPT design is completely editable. Download it and make adjustments in color, background, font etc. as per your unique business setting.

CRM System Dashboard With Sales Pipeline Ppt PowerPoint Presentation Gallery Icons PDF
Pitch your topic with ease and precision using this crm system dashboard with sales pipeline ppt powerpoint presentation gallery icons pdf. This layout presents information on margin by sale rep, deal size vs discount, sale activity by sales rep, margin by sale rep, sales pipeline by sales rep, neglected accounts. It is also available for immediate download and adjustment. So, changes can be made in the color, design, graphics or any other component to create a unique layout.

Dashboard For Analyzing Assets And Portfolio Performance Ppt PowerPoint Presentation Summary Slide PDF
Pitch your topic with ease and precision using this dashboard for analyzing assets and portfolio performance ppt powerpoint presentation summary slide pdf. This layout presents information on asset management by manager, top 10 clients by assets, top 10 assets owned, portfolio performance. It is also available for immediate download and adjustment. So, changes can be made in the color, design, graphics or any other component to create a unique layout.

Dashboard Showing Procurement Cycle Time Ppt PowerPoint Presentation Icon Example Topics PDF
Pitch your topic with ease and precision using this dashboard showing procurement cycle time ppt powerpoint presentation icon example topics pdf. This layout presents information on top suppliers by partner status, rate of contract compliance by supplier category, avg procurement cycle supplier classification. It is also available for immediate download and adjustment. So, changes can be made in the color, design, graphics or any other component to create a unique layout.
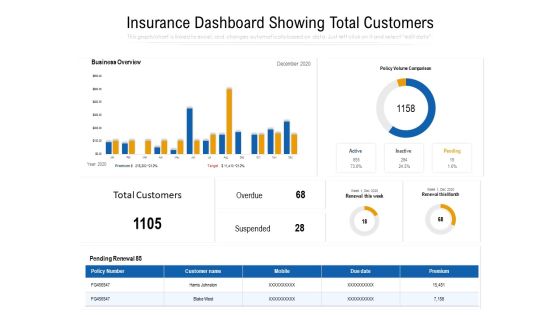
Insurance Dashboard Showing Total Customers Ppt PowerPoint Presentation Pictures Model PDF
Showcasing this set of slides titled insurance dashboard showing total customers ppt powerpoint presentation slides graphics tutorials pdf. The topics addressed in these templates are business overview, policy volume comparison, suspended, renewal this week, renewal this month, premium. All the content presented in this PPT design is completely editable. Download it and make adjustments in color, background, font etc. as per your unique business setting.
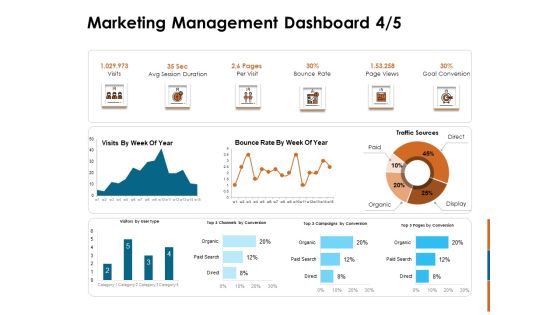
Key Statistics Of Marketing Marketing Management Dashboard Rate Ppt PowerPoint Presentation Show Graphics Template PDF
Deliver and pitch your topic in the best possible manner with this key statistics of marketing marketing management dashboard rate ppt powerpoint presentation show graphics template pdf. Use them to share invaluable insights on visits, avg session duration, per visit, bounce rate, page views, goal conversion and impress your audience. This template can be altered and modified as per your expectations. So, grab it now.
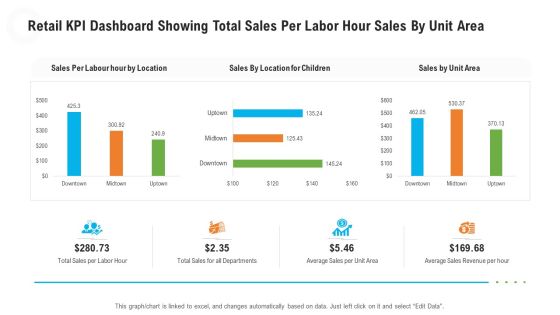
Retail KPI Dashboard Showing Total Sales Per Labor Hour Sales By Unit Area Designs PDF
Deliver and pitch your topic in the best possible manner with this retail KPI dashboard showing total sales per labor hour sales by unit area designs pdf. Use them to share invaluable insights on total sales per labor hour, total sales for all departments, average sales per unit area, average sales revenue per hour and impress your audience. This template can be altered and modified as per your expectations. So, grab it now.
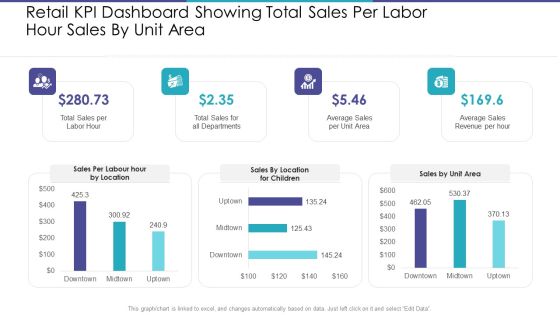
Retail KPI Dashboard Showing Total Sales Per Labor Hour Sales By Unit Area Information PDF
Deliver and pitch your topic in the best possible manner with this retail kpi dashboard showing total sales per labor hour sales by unit area information pdf. Use them to share invaluable insights on total sales for all departments, average sales per unit area, average sales revenue per hour and impress your audience. This template can be altered and modified as per your expectations. So, grab it now.

B2C Marketing Initiatives Strategies For Business RACE Digital Marketing Dashboard Ppt Infographic Template Objects PDF
This infographic is used to improve the digital marketing in the company by using the RACE framework model. Deliver an awe inspiring pitch with this creative B2C marketing initiatives strategies for business RACE digital marketing dashboard ppt infographic template objects pdf bundle. Topics like revenue, customer communications, inbound marketing, social referrals, conversion rate can be discussed with this completely editable template. It is available for immediate download depending on the needs and requirements of the user.

Health IT System Business Performance Dashboard Ppt Summary File Formats PDF
This Slide provides a detailed overview of health information system market analysis. It covers region wise annual growth insights. Showcasing this set of slides titled health it system business performance dashboard ppt summary file formats pdf. The topics addressed in these templates are market contributes, cloud segment, revenue contributing. All the content presented in this PPT design is completely editable. Download it and make adjustments in color, background, font etc. as per your unique business setting.

Improvement In Employee Turnover In Technology Industry Dashboard Employee Attrition Rate Diagrams PDF
This slide shows the various factors related to the employees attrition rate growth in the company. Deliver and pitch your topic in the best possible manner with this improvement in employee turnover in technology industry dashboard employee attrition rate diagrams pdf. Use them to share invaluable insights on annual fluctuation, fluctuation report, workforce and impress your audience. This template can be altered and modified as per your expectations. So, grab it now.

Application Development Best Practice Tools And Templates Jira Dashboard For Software Development Elements PDF
This slide covers the marketing software project status which focuses on calendar issues, project statistics, different blog projects, etc. Deliver an awe inspiring pitch with this creative application development best practice tools and templates jira dashboard for software development elements pdf bundle. Topics like marketing blog projects, issues statistics marketing blog projects, issues calendar can be discussed with this completely editable template. It is available for immediate download depending on the needs and requirements of the user.
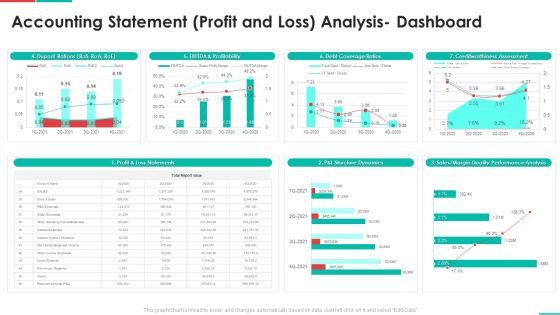
Roadmap For Financial Accounting Transformation Accounting Statement Profit And Loss Analysis Dashboard Clipart PDF
Deliver an awe inspiring pitch with this creative roadmap for financial accounting transformation accounting statement profit and loss analysis dashboard clipart pdf bundle. Topics like profit and loss statements, p and l structure dynamics, sales or margin quality performance analysis, creditworthiness assessment, debt coverage ratios can be discussed with this completely editable template. It is available for immediate download depending on the needs and requirements of the user.
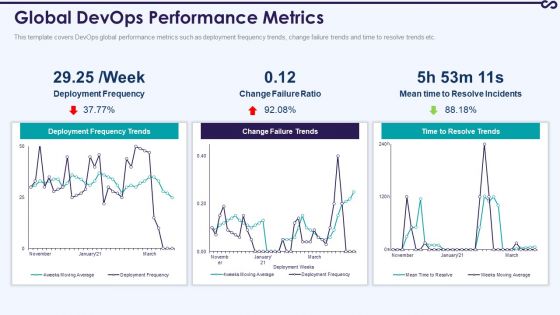
Development And Operations KPI Dashboard IT Global Devops Performance Metrics Themes PDF
This template covers DevOps global performance metrics such as deployment frequency trends, change failure trends and time to resolve trends etc. Deliver an awe inspiring pitch with this creative development and operations kpi dashboard it global devops performance metrics themes pdf bundle. Topics like global devops performance metrics can be discussed with this completely editable template. It is available for immediate download depending on the needs and requirements of the user.

Customer Rapport Strategy To Build Loyal Client Base Customer Experience Dashboard Designs PDF
Mentioned slide provides comprehensive statistics for measuring and evaluating customer experience level with respect to brand persona. It covers customer satisfaction index, rewards member index etc. Deliver an awe inspiring pitch with this creative customer rapport strategy to build loyal client base customer experience dashboard designs pdf bundle. Topics like customer duration, rewards member, customer satisfaction can be discussed with this completely editable template. It is available for immediate download depending on the needs and requirements of the user.

Clinical Risk Assessment Dashboard For Improving Quality And Safety In Healthcare Brochure PDF
This slide illustrates key initiatives taken by HR department for resolving global team conflicts. Pitch your topic with ease and precision using this Clinical Risk Assessment Dashboard For Improving Quality And Safety In Healthcare Brochure PDF This layout presents information on Ward Administration, Patient Experience, Risk Assessment It is also available for immediate download and adjustment. So, changes can be made in the color, design, graphics or any other component to create a unique layout.

Dashboard For Information Technology Incident Risk Assessment SLA Warnings Sample PDF
This slide highlights detailed assessment of open incident and service requests by team and management for ensuring smooth operations of IT department.Showcasing this set of slides titled Dashboard For Information Technology Incident Risk Assessment SLA Warnings Sample PDF The topics addressed in these templates are Open Incidents, Requests By Service, Open Incidents All the content presented in this PPT design is completely editable. Download it and make adjustments in color, background, font etc. as per your unique business setting.
 Home
Home