Cost Dashboard

Approach Optimization For Brand Promotion Strategy Dashboard Showing Digital Marketing Performance Introduction PDF
Slidegeeks is one of the best resources for PowerPoint templates. You can download easily and regulate Approach Optimization For Brand Promotion Strategy Dashboard Showing Digital Marketing Performance Introduction PDF for your personal presentations from our wonderful collection. A few clicks is all it takes to discover and get the most relevant and appropriate templates. Use our Templates to add a unique zing and appeal to your presentation and meetings. All the slides are easy to edit and you can use them even for advertisement purposes.

Retail Marketing Campaign Effective Techniques Retail Marketing Campaign Analytics Dashboard Topics PDF
This slide shows the retail campaign performance highlighting the total product sales after implementing new strategies, total number of customers increased and number of new visitors in store. The best PPT templates are a great way to save time, energy, and resources. Slidegeeks have 100 percent editable powerpoint slides making them incredibly versatile. With these quality presentation templates, you can create a captivating and memorable presentation by combining visually appealing slides and effectively communicating your message. Download Retail Marketing Campaign Effective Techniques Retail Marketing Campaign Analytics Dashboard Topics PDF from Slidegeeks and deliver a wonderful presentation.
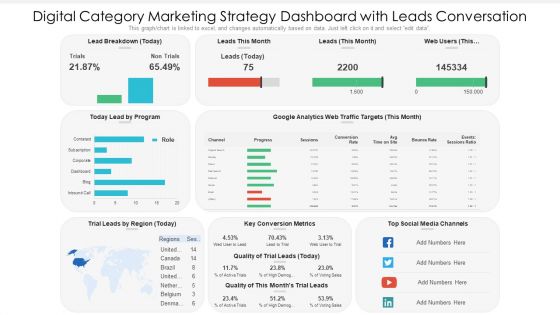
Digital Category Marketing Strategy Dashboard With Leads Conversation Ppt PowerPoint Presentation Slides Information PDF
This graph chart is linked to excel, and changes automatically based on data. Just left click on it and select edit data. Pitch your topic with ease and precision using this digital category marketing strategy dashboard with leads conversation ppt powerpoint presentation slides information pdf. This layout presents information on key conversion metrics, social media channels, lead by program. It is also available for immediate download and adjustment. So, changes can be made in the color, design, graphics or any other component to create a unique layout.
Education Metrics Dashboard For Tracking Student Ethnicity And Specially Abled Characteristics Brochure PDF
This slide covers the education key performance indicator tracker. It include metrics such as total applications, conversion rate, offers year to date, applications by ethnicity and disabilities, etc. Showcasing this set of slides titled Education Metrics Dashboard For Tracking Student Ethnicity And Specially Abled Characteristics Brochure PDF. The topics addressed in these templates are Total Applications, Conversion Rate 2022, Ethnicity. All the content presented in this PPT design is completely editable. Download it and make adjustments in color, background, font etc. as per your unique business setting.
Implementing Digital Transformation Performance Tracking Kpi Dashboard For Digital Background PDF
Mentioned slide provides information about the key performance indicators that can be used by managers to measure the success of digital marketing strategy, KPIs covered are status, progress, priority and timeline. Boost your pitch with our creative Implementing Digital Transformation Performance Tracking Kpi Dashboard For Digital Background PDF. Deliver an awe-inspiring pitch that will mesmerize everyone. Using these presentation templates you will surely catch everyones attention. You can browse the ppts collection on our website. We have researchers who are experts at creating the right content for the templates. So you dont have to invest time in any additional work. Just grab the template now and use them.

KPI Dashboard To Track Automation Performance In Employee Onboarding Introduction PDF
The following slide outlines performance key performance indicator KPI which can be used to evaluate business process automation performance in employee onboarding. The metrics highlighted in the slide are onboarding completion status, hires per office, etc. Deliver an awe inspiring pitch with this creative KPI Dashboard To Track Automation Performance In Employee Onboarding Introduction PDF bundle. Topics like Onboarding Completion Status, Onboardings In Progress, Employee Onboarding can be discussed with this completely editable template. It is available for immediate download depending on the needs and requirements of the user.

KPI Dashboard To Track Automation Performance In Employee Onboarding Achieving Operational Efficiency Download PDF
The following slide outlines performance key performance indicator KPI which can be used to evaluate business process automation performance in employee onboarding. The metrics highlighted in the slide are onboarding completion status, hires per office, etc.Deliver an awe inspiring pitch with this creative KPI Dashboard To Track Automation Performance In Employee Onboarding Achieving Operational Efficiency Download PDF bundle. Topics like Onboarding Completion, Onboarding, Onboarding Completion can be discussed with this completely editable template. It is available for immediate download depending on the needs and requirements of the user.

Portfolio Administration Dashboard Budget Ppt PowerPoint Presentation Complete Deck With Slides
This portfolio administration dashboard budget ppt powerpoint presentation complete deck with slides acts as backup support for your ideas, vision, thoughts, etc. Use it to present a thorough understanding of the topic. This PPT slideshow can be utilized for both in-house and outside presentations depending upon your needs and business demands. Entailing twelve slides with a consistent design and theme, this template will make a solid use case. As it is intuitively designed, it suits every business vertical and industry. All you have to do is make a few tweaks in the content or any other component to design unique presentations. The biggest advantage of this complete deck is that it can be personalized multiple times once downloaded. The color, design, shapes, and other elements are free to modify to add personal touches. You can also insert your logo design in this PPT layout. Therefore a well-thought and crafted presentation can be delivered with ease and precision by downloading this portfolio administration dashboard budget ppt powerpoint presentation complete deck with slides PPT slideshow.

Product And Services Promotion Marketing Performance Dashboard With Advertisement Graphics PDF
This graph or chart is linked to excel, and changes automatically based on data. Just left click on it and select Edit Data. Slidegeeks is here to make your presentations a breeze with Product And Services Promotion Marketing Performance Dashboard With Advertisement Graphics PDF With our easy-to-use and customizable templates, you can focus on delivering your ideas rather than worrying about formatting. With a variety of designs to choose from, youre sure to find one that suits your needs. And with animations and unique photos, illustrations, and fonts, you can make your presentation pop. So whether youre giving a sales pitch or presenting to the board, make sure to check out Slidegeeks first.
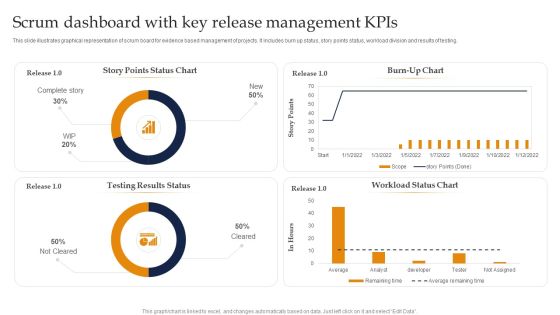
Scrum Dashboard With Key Release Management Kpis Ppt Summary Vector PDF
This slide illustrates graphical representation of scrum board for evidence based management of projects. It includes burn up status, story points status, workload division and results of testing. Showcasing this set of slides titled Scrum Dashboard With Key Release Management Kpis Ppt Summary Vector PDF. The topics addressed in these templates are Burn Up Chart, Workload Status Chart, Testing Results Status. All the content presented in this PPT design is completely editable. Download it and make adjustments in color, background, font etc. as per your unique business setting.
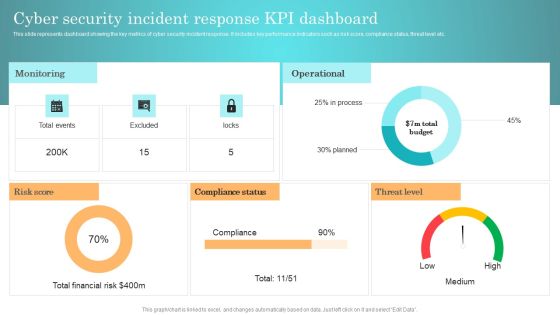
Incident Response Techniques Deployement Cyber Security Incident Response KPI Dashboard Background PDF
This slide represents dashboard showing the key metrics of cyber security incident response. It includes key performance indicators such as risk score, compliance status, threat level etc. From laying roadmaps to briefing everything in detail, our templates are perfect for you. You can set the stage with your presentation slides. All you have to do is download these easy to edit and customizable templates. Incident Response Techniques Deployement Cyber Security Incident Handler Contact Information Guidelines PDF will help you deliver an outstanding performance that everyone would remember and praise you for. Do download this presentation today.

Cloud Performance Tracking Dashboard Cloud Computing Complexities And Solutions Structure PDF
This slide covers the Key performance indicators for tracking performance of the cloud such as violations break down, sources, rules and severity. Are you searching for a xxxxxxxxxxxxxxxxxxxxxx that is uncluttered, straightforward, and original Its easy to edit, and you can change the colors to suit your personal or business branding. For a presentation that expresses how much effort you ve put in, this template is ideal With all of its features, including tables, diagrams, statistics, and lists, its perfect for a business plan presentation. Make your ideas more appealing with these professional slides. Download Cloud Performance Tracking Dashboard Cloud Computing Complexities And Solutions Structure PDF from Slidegeeks today.

Client Helpline Dashboard At Valet Information Dsk Ppt Gallery Slide Portrait PDF
This graph or chart is linked to excel, and changes automatically based on data. Just left click on it and select Edit Data. Pitch your topic with ease and precision using this Client Helpline Dashboard At Valet Information Dsk Ppt Gallery Slide Portrait PDF. This layout presents information on Valet Damage Claims, Valet Wait Times, Information Desk. It is also available for immediate download and adjustment. So, changes can be made in the color, design, graphics or any other component to create a unique layout.

Firm KPI Dashboard With Average Click Through Rate Ppt Inspiration Sample PDF
This graph or chart is linked to excel, and changes automatically based on data. Just left click on it and select Edit Data. Pitch your topic with ease and precision using this Firm KPI Dashboard With Average Click Through Rate Ppt Inspiration Sample PDF. This layout presents information on Total Clicks, Total Impressive, Average CTR, Average Position. It is also available for immediate download and adjustment. So, changes can be made in the color, design, graphics or any other component to create a unique layout.

Service Level Agreement KPI Dashboard Indicating Violation Count And Overdue Requests Diagrams PDF
This graph or chart is linked to excel, and changes automatically based on data. Just left click on it and select Edit Data. Showcasing this set of slides titled Service Level Agreement KPI Dashboard Indicating Violation Count And Overdue Requests Diagrams PDF. The topics addressed in these templates are Total Requests Category, Total Requests Status, Urgent Requests. All the content presented in this PPT design is completely editable. Download it and make adjustments in color, background, font etc. as per your unique business setting.

Service Level Agreement KPI Dashboard With Current Risk Statistics Topics PDF
This graph or chart is linked to excel, and changes automatically based on data. Just left click on it and select Edit Data. Pitch your topic with ease and precision using this Service Level Agreement KPI Dashboard With Current Risk Statistics Topics PDF. This layout presents information on Current Risk SLAS, Current Breached Slas, Personal Active SLA It is also available for immediate download and adjustment. So, changes can be made in the color, design, graphics or any other component to create a unique layout.

Company Financial Performance Indicators Dashboard With Liquidity And Turnover Ratios Formats PDF
This graph or chart is linked to excel, and changes automatically based on data. Just left click on it and select Edit Data. Pitch your topic with ease and precision using this Company Financial Performance Indicators Dashboard With Liquidity And Turnover Ratios Formats PDF. This layout presents information on Cash Balance, Days Inventory Outstanding, Days Payable Outstanding. It is also available for immediate download and adjustment. So, changes can be made in the color, design, graphics or any other component to create a unique layout.
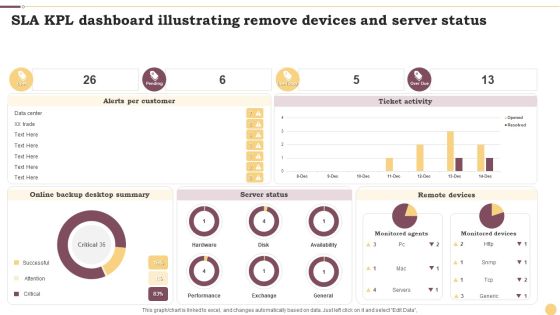
SLA KPL Dashboard Illustrating Remove Devices And Server Status Ppt Inspiration Layout Ideas PDF
This graph or chart is linked to excel, and changes automatically based on data. Just left click on it and select Edit Data. Showcasing this set of slides titled SLA KPL Dashboard Illustrating Remove Devices And Server Status Ppt Inspiration Layout Ideas PDF. The topics addressed in these templates are Alerts Per Customer, Ticket Activity, Server Status. All the content presented in this PPT design is completely editable. Download it and make adjustments in color, background, font etc. as per your unique business setting.

SLA KPL Dashboard Illustrating Risk And Active Services Ppt Portfolio Design Inspiration PDF
This graph or chart is linked to excel, and changes automatically based on data. Just left click on it and select Edit Data. Pitch your topic with ease and precision using this SLA KPL Dashboard Illustrating Risk And Active Services Ppt Portfolio Design Inspiration PDF. This layout presents information on My Active SLAs, Database Group, Priority. It is also available for immediate download and adjustment. So, changes can be made in the color, design, graphics or any other component to create a unique layout.
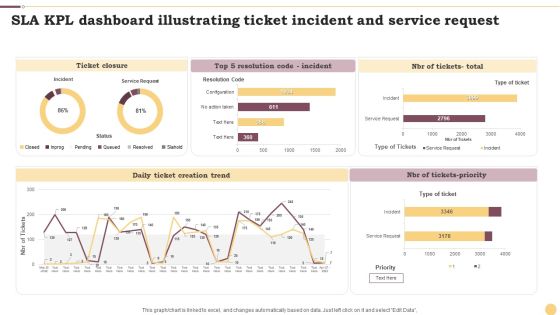
SLA KPL Dashboard Illustrating Ticket Incident And Service Request Ppt File Portrait PDF
This graph or chart is linked to excel, and changes automatically based on data. Just left click on it and select Edit Data. Showcasing this set of slides titled SLA KPL Dashboard Illustrating Ticket Incident And Service Request Ppt File Portrait PDF. The topics addressed in these templates are Ticket Closure, Daily Ticket, Creation Trend, NBR Tickets Priority. All the content presented in this PPT design is completely editable. Download it and make adjustments in color, background, font etc. as per your unique business setting.
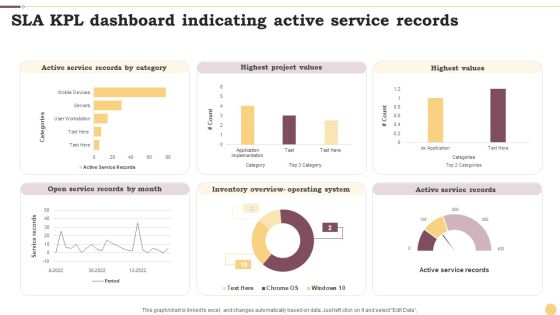
SLA KPL Dashboard Indicating Active Service Records Ppt Professional Graphics Example PDF
This graph or chart is linked to excel, and changes automatically based on data. Just left click on it and select Edit Data. Pitch your topic with ease and precision using this SLA KPL Dashboard Indicating Active Service Records Ppt Professional Graphics Example PDF. This layout presents information on Active Service Records, Highest Project Values, Highest Values. It is also available for immediate download and adjustment. So, changes can be made in the color, design, graphics or any other component to create a unique layout.

Product Marketing Dashboard For Pay Per Click Campaign Ppt PowerPoint Presentation File Files PDF
This modern and well arranged Product Marketing Dashboard For Pay Per Click Campaign Ppt PowerPoint Presentation File Files PDF provides lots of creative possibilities. It is very simple to customize and edit with the Powerpoint Software. Just drag and drop your pictures into the shapes. All facets of this template can be edited with Powerpoint no extra software is necessary. Add your own material, put your images in the places assigned for them, adjust the colors, and then you can show your slides to the world, with an animated slide included.
Tracking Customer Sales Funnel Dashboard Managing Sales Pipeline Health Topics PDF
This slide covers information regarding the customer sales funnel tracking with sales volume and total market. This modern and well-arranged Tracking Customer Sales Funnel Dashboard Managing Sales Pipeline Health Topics PDF provides lots of creative possibilities. It is very simple to customize and edit with the Powerpoint Software. Just drag and drop your pictures into the shapes. All facets of this template can be edited with Powerpoint no extra software is necessary. Add your own material, put your images in the places assigned for them, adjust the colors, and then you can show your slides to the world, with an animated slide included.
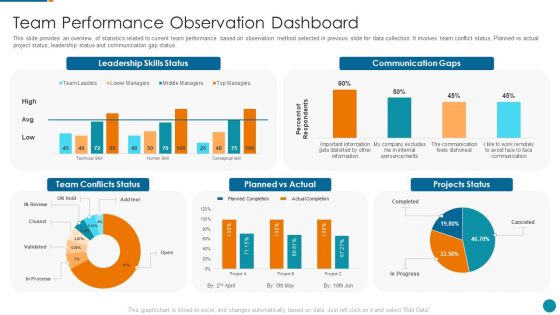
Strategic Procedure To Improve Employee Efficiency Team Performance Observation Dashboard Formats PDF
This slide provides an overview of statistics related to current team performance based on observation method selected in previous slide for data collection. It involves team conflict status, Planned vs actual project status, leadership status and communication gap status.Deliver an awe inspiring pitch with this creative strategic procedure to improve employee efficiency team performance observation dashboard formats pdf bundle. Topics like leadership skills status, communication gaps, planned vs actual can be discussed with this completely editable template. It is available for immediate download depending on the needs and requirements of the user.

Website And Social Media Digital Audit Dashboard Highlighting Website Visitors With Device Rules PDF
This slide highlights the website visitors by different countries which also includes the users and session data from last 10 days, it also includes user demographic. Device and new vs returning user. Deliver an awe inspiring pitch with this creative Website And Social Media Digital Audit Dashboard Highlighting Website Visitors With Device Rules PDF bundle. Topics like Website Visitors Country, User Demographics, Social Networks can be discussed with this completely editable template. It is available for immediate download depending on the needs and requirements of the user.
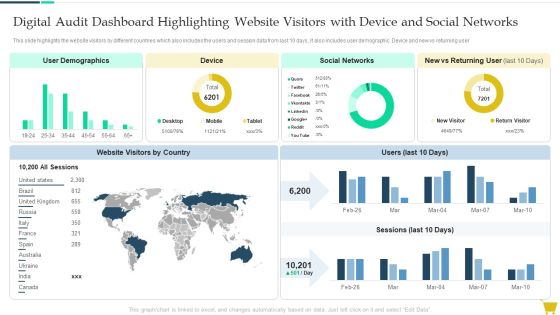
Digital Audit Dashboard Highlighting Website Visitors With Device And Social Networks Guidelines PDF
This slide highlights the website visitors by different countries which also includes the users and session data from last 10 days, it also includes user demographic. Device and new vs returning user. Deliver and pitch your topic in the best possible manner with this Digital Audit Dashboard Highlighting Website Visitors With Device And Social Networks Guidelines PDF. Use them to share invaluable insights on Device, Social Networks, User Demographics and impress your audience. This template can be altered and modified as per your expectations. So, grab it now.
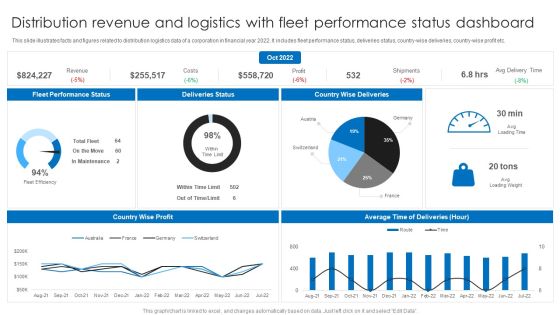
Distribution Revenue And Logistics With Fleet Performance Status Dashboard Ppt Layouts Background PDF
This slide illustrates facts and figures related to distribution logistics data of a corporation in financial year 2022. It includes fleet performance status, deliveries status, country-wise deliveries, country-wise profit etc. Pitch your topic with ease and precision using this Distribution Revenue And Logistics With Fleet Performance Status Dashboard Ppt Layouts Background PDF. This layout presents information on Deliveries Status, Country Wise Deliveries, Fleet Performance Status. It is also available for immediate download and adjustment. So, changes can be made in the color, design, graphics or any other component to create a unique layout.

Employee Performance Management To Enhance Organizational Growth KPI Dashboard To Track Employee Topics PDF
The Employee Performance Management To Enhance Organizational Growth KPI Dashboard To Track Employee Topics PDF is a compilation of the most recent design trends as a series of slides. It is suitable for any subject or industry presentation, containing attractive visuals and photo spots for businesses to clearly express their messages. This template contains a variety of slides for the user to input data, such as structures to contrast two elements, bullet points, and slides for written information. Slidegeeks is prepared to create an impression.
SEO Tracking Dashboard For Backlinks And Keywords Ppt PowerPoint Presentation File Deck PDF
Purpose of the following slide is to measure the SEO performance of the organization as it measures the keywords, backlinks, the total number of sessions and average call duration The SEO Tracking Dashboard For Backlinks And Keywords Ppt PowerPoint Presentation File Deck PDF is a compilation of the most recent design trends as a series of slides. It is suitable for any subject or industry presentation, containing attractive visuals and photo spots for businesses to clearly express their messages. This template contains a variety of slides for the user to input data, such as structures to contrast two elements, bullet points, and slides for written information. Slidegeeks is prepared to create an impression.

BI Technique For Data Informed Decisions Sap Analytics Cloud Dashboard For Product Sales Analysis Sample PDF
This slide illustrates the SAP Analytics Cloud dashboard to monitor product sales performance. It provides information regarding the gross margin and net revenue earned, product performance state wise and year wise. Welcome to our selection of the Budget Plan For BI Technique For Data Informed Decisions Clipart PDF. These are designed to help you showcase your creativity and bring your sphere to life. Planning and Innovation are essential for any business that is just starting out. This collection contains the designs that you need for your everyday presentations. All of our PowerPoints are 100 percent editable, so you can customize them to suit your needs. This multi purpose template can be used in various situations. Grab these presentation templates today.
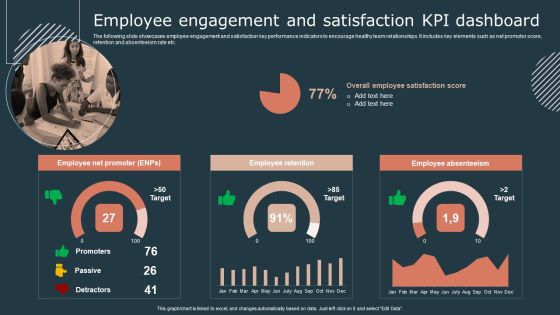
Effective Workforce Participation Action Planning Employee Engagement And Satisfaction Kpi Dashboard Themes PDF
The following slide showcases employee engagement and satisfaction key performance indicators to encourage healthy team relationships. It includes key elements such as net promotor score, retention and absenteeism rate etc. From laying roadmaps to briefing everything in detail, our templates are perfect for you. You can set the stage with your presentation slides. All you have to do is download these easy to edit and customizable templates. Effective Workforce Participation Action Planning Employee Engagement And Satisfaction Kpi Dashboard Themes PDF will help you deliver an outstanding performance that everyone would remember and praise you for. Do download this presentation today.

Project Management Dashboard With Project Goals Deliverables And Target Ppt PowerPoint Presentation Summary Demonstration PDF
The following slide showcases the overview of multiple projects to ensure maximum utilization of resources. It constitutes of elements such as project deliverables, health status, budget, accomplishment rate, target deadline etc.Showcasing this set of slides titled Project Management Dashboard With Project Goals Deliverables And Target Ppt PowerPoint Presentation Summary Demonstration PDF. The topics addressed in these templates are Accomplishment Rate, Optimize Website, Deliverables. All the content presented in this PPT design is completely editable. Download it and make adjustments in color, background, font etc. as per your unique business setting.
Market Insights Research Results With KPI Dashboard Ppt PowerPoint Presentation Icon File Formats PDF
The given below slide highlights the KPAs of market research associated with customer satisfaction. It includes net promoter score, customer effort score, monthly NPS and CES trend etc.Pitch your topic with ease and precision using this Market Insights Research Results With KPI Dashboard Ppt PowerPoint Presentation Icon File Formats PDF. This layout presents information on Satisfaction Score, Customer Effort, Customer Score. It is also available for immediate download and adjustment. So, changes can be made in the color, design, graphics or any other component to create a unique layout.
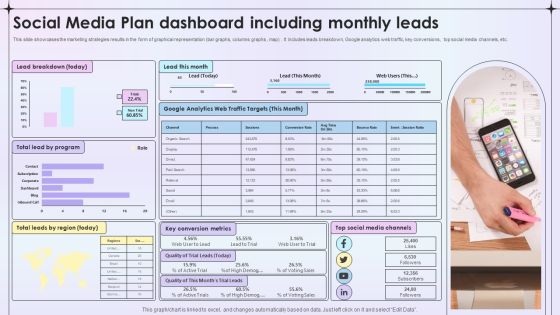
Social Media Plan Dashboard Including Monthly Leads Ppt File Slides PDF
This slide showcases the marketing strategies results in the form of graphical representation bar graphs, columns graphs , map. It includes leads breakdown, Google analytics web traffic, key conversions , top social media channels, etc. Showcasing this set of slides titled Social Media Plan Dashboard Including Monthly Leads Ppt File Slides PDF. The topics addressed in these templates are Lead Breakdown, Key Conversion Metrics, Social Media Channels. All the content presented in this PPT design is completely editable. Download it and make adjustments in color, background, font etc. as per your unique business setting.
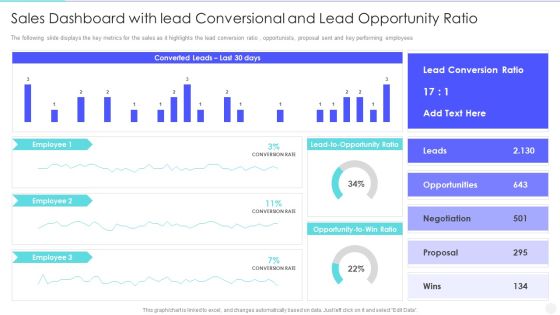
Increase Returns By Examining And Executing New Sales Qualification Procedure Sales Dashboard With Lead Themes PDF
The following slide displays the key metrics for the sales as it highlights the lead conversion ratio , opportunists, proposal sent and key performing employees. Deliver and pitch your topic in the best possible manner with this increase returns by examining and executing new sales qualification procedure sales dashboard with lead themes pdf. Use them to share invaluable insights on opportunities, negotiation, lead conversion ratio and impress your audience. This template can be altered and modified as per your expectations. So, grab it now.
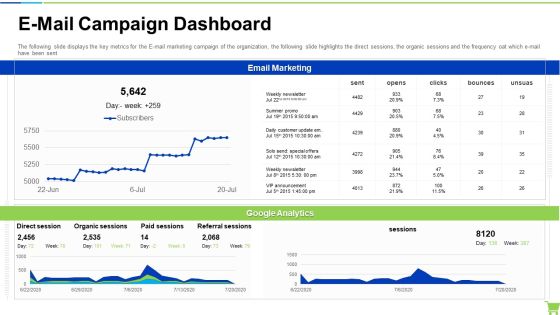
Developing And Controlling B2b Marketing Plan E-Mail Campaign Dashboard Portrait PDF
The following slide displays the key metrics for the E mail marketing campaign of the organization, the following slide highlights the direct sessions, the organic sessions and the frequency oat which e-mail have been sent. Deliver and pitch your topic in the best possible manner with this developing and controlling b2b marketing plan e-mail campaign dashboard portrait pdf. Use them to share invaluable insights on email marketing, google analytics and impress your audience. This template can be altered and modified as per your expectations. So, grab it now.

B2B And B2C Startups Marketing Mix Strategies Social Media Marketing Dashboard Download PDF
The following slide displays key metrics that can help the organization to measure effectiveness of social media marketing strategy, these can be growth in engagement, audience growth etc. Want to ace your presentation in front of a live audience Our B2B And B2C Startups Marketing Mix Strategies Social Media Marketing Dashboard Download PDF can help you do that by engaging all the users towards you. Slidegeeks experts have put their efforts and expertise into creating these impeccable powerpoint presentations so that you can communicate your ideas clearly. Moreover, all the templates are customizable, and easy to edit and downloadable. Use these for both personal and commercial use.

Online Marketing Techniques For Acquiring Clients Dashboard To Measure Performance Information PDF
This following slide displays the key metrics that can help an organization to measure effectiveness of social media strategies. These can be leads generated, leads by region, web traffic targets etc. Take your projects to the next level with our ultimate collection of Online Marketing Techniques For Acquiring Clients Dashboard To Measure Performance Information PDF. Slidegeeks has designed a range of layouts that are perfect for representing task or activity duration, keeping track of all your deadlines at a glance. Tailor these designs to your exact needs and give them a truly corporate look with your own brand colors they will make your projects stand out from the rest.

Implementing Digital Marketing Dashboard To Measure Performance Of Social Media Professional PDF
This following slide displays the key metrics that can help an organization to measure effectiveness of social media strategies. These can be leads generated, leads by region, web traffic targets etc. Want to ace your presentation in front of a live audience Our Implementing Digital Marketing Dashboard To Measure Performance Of Social Media Professional PDF can help you do that by engaging all the users towards you. Slidegeeks experts have put their efforts and expertise into creating these impeccable powerpoint presentations so that you can communicate your ideas clearly. Moreover, all the templates are customizable, and easy-to-edit and downloadable. Use these for both personal and commercial use.
Effective Company Event Communication Plan Dashboard For Tracking Active Number Microsoft PDF
This slide covers metrics for analyzing the number of most active event participants. It includes KPIs such as check-in status, contract roles, top industries, contract by country, top 5 job functions, etc. Deliver and pitch your topic in the best possible manner with this Effective Company Event Communication Plan Dashboard For Tracking Active Number Microsoft PDF Use them to share invaluable insights on Marketing, Management Less, Attendance and impress your audience. This template can be altered and modified as per your expectations. So, grab it now.

KPI Dashboard Of Workforce Performance In Organization Ppt Gallery Portfolio PDF
This slide shows the performance of employees in an organization. It includes KPIs such as headcount, average employee age, gender diversity ratio, absenteeism, etc. Showcasing this set of slides titled KPI Dashboard Of Workforce Performance In Organization Ppt Gallery Portfolio PDF. The topics addressed in these templates are Employee Count Status, Employee Count Department, Average Employee Age. All the content presented in this PPT design is completely editable. Download it and make adjustments in color, background, font etc. as per your unique business setting.
Effective Company Event Communication Tactics Dashboard For Tracking Active Number Of Attendances Demonstration PDF
This slide covers metrics for analyzing the number of most active event participants. It includes KPIs such as check-in status, contract roles, top industries, contract by country, top 5 job functions, etc. Deliver and pitch your topic in the best possible manner with this Effective Company Event Communication Tactics Dashboard For Tracking Active Number Of Attendances Demonstration PDF. Use them to share invaluable insights on Attendance, Exhibitors, Management and impress your audience. This template can be altered and modified as per your expectations. So, grab it now.
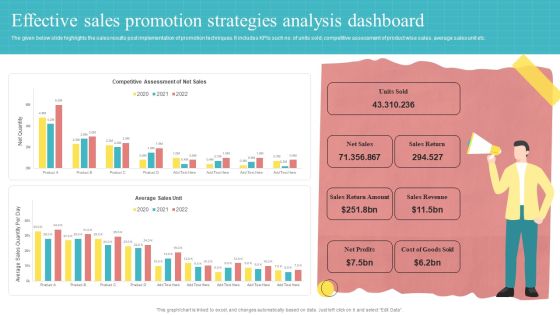
Effective Sales Promotion Strategies Analysis Dashboard Ppt PowerPoint Presentation Slides Background Designs PDF
The given below slide highlights the sales results post implementation of promotion techniques. It includes KPIs such no. of units sold, competitive assessment of product wise sales, average sales unit etc.Showcasing this set of slides titled Effective Sales Promotion Strategies Analysis Dashboard Ppt PowerPoint Presentation Slides Background Designs PDF. The topics addressed in these templates are Return Amount, Sales Return, Sales Revenue. All the content presented in this PPT design is completely editable. Download it and make adjustments in color, background, font etc. as per your unique business setting.

Stock Performance Metrics Dashboard For FMCG Company Ppt Ideas Design Inspiration PDF
This slide showcases the metrics for analyzing inventory turnover. It includes KPIs such as product sold within freshness date, out of stock rate, on time in full deliveries, etc. Showcasing this set of slides titled Stock Performance Metrics Dashboard For FMCG Company Ppt Ideas Design Inspiration PDF. The topics addressed in these templates are Inventory Turnover, Overview 2015, Inventory Turnover. All the content presented in this PPT design is completely editable. Download it and make adjustments in color, background, font etc. as per your unique business setting.

Selling App Development Launch And Marketing Application Performance Dashboard Inspiration PDF
This slide covers application performance in market KPIs and metrics such as impressions, clicks, searches for app, conversion rate etc. This Selling App Development Launch And Marketing Application Performance Dashboard Inspiration PDF from Slidegeeks makes it easy to present information on your topic with precision. It provides customization options, so you can make changes to the colors, design, graphics, or any other component to create a unique layout. It is also available for immediate download, so you can begin using it right away. Slidegeeks has done good research to ensure that you have everything you need to make your presentation stand out. Make a name out there for a brilliant performance.
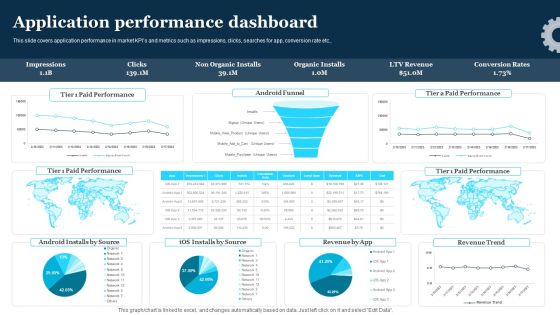
Play Store Launch Techniques For Shopping Apps Application Performance Dashboard Template PDF
This slide covers application performance in market KPIs and metrics such as impressions, clicks, searches for app, conversion rate etc., Present like a pro with Play Store Launch Techniques For Shopping Apps Application Performance Dashboard Template PDF Create beautiful presentations together with your team, using our easy to use presentation slides. Share your ideas in real time and make changes on the fly by downloading our templates. So whether you are in the office, on the go, or in a remote location, you can stay in sync with your team and present your ideas with confidence. With Slidegeeks presentation got a whole lot easier. Grab these presentations today.
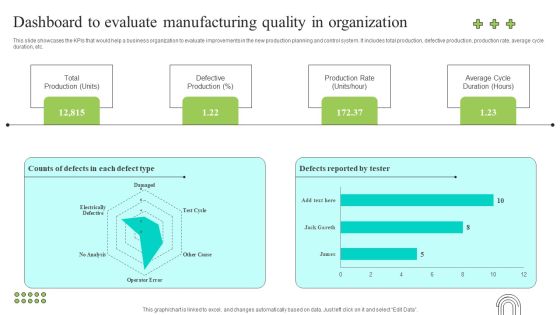
Effective Production Planning And Monitoring Techniques Dashboard To Evaluate Manufacturing Quality Brochure PDF
This slide showcases the KPIs that would help a business organization to evaluate improvements in the new production planning and control system. It includes total production, defective production, production rate, average cycle duration, etc. Make sure to capture your audiences attention in your business displays with our gratis customizable Effective Production Planning And Monitoring Techniques Dashboard To Evaluate Manufacturing Quality Brochure PDF. These are great for business strategies, office conferences, capital raising or task suggestions. If you desire to acquire more customers for your tech business and ensure they stay satisfied, create your own sales presentation with these plain slides.

Dashboard For Tracking And Measuring Business Sales And Revenue Ppt PowerPoint Presentation Slides Introduction PDF
Showcasing this set of slides titled dashboard for tracking and measuring business sales and revenue ppt powerpoint presentation slides introduction pdf. The topics addressed in these templates are revenue by pipeline jun 2020, new deals by month this year 2020, forecast june 2020, revenue goal attainment by owner jun 2020, revenue goal attainment jun 2020, pipeline coverage jul 2020. All the content presented in this PPT design is completely editable. Download it and make adjustments in color, background, font etc. as per your unique business setting.

Determining Crisis Management BCP Crisis Management Dashboard Ppt PowerPoint Presentation Gallery Introduction PDF
This slide depicts how crisis are managed in the organization while keeping recovery as the priorities. It includes Risks, Assumptions, Issues, Dependencies, Actions and Repairs and the severity of each. Deliver and pitch your topic in the best possible manner with this determining crisis management bcp crisis management dashboard ppt powerpoint presentation gallery introduction pdf. Use them to share invaluable insights on mitigated, upheld, closed, committed, closed, circulation, resolution date. and impress your audience. This template can be altered and modified as per your expectations. So, grab it now.

Measuring Influencer Marketing ROI Influencer Dashboard Template Reach And Followers Clipart PDF
If you have tools that let you analyze the influencers reach, audience and previous campaigns, that can help you to better understand the impact of the influencer. Deliver and pitch your topic in the best possible manner with this measuring influencer marketing roi influencer dashboard template reach and followers clipart pdf. Use them to share invaluable insights on campaign name, social platform, status, reviews, location and impress your audience. This template can be altered and modified as per your expectations. So, grab it now.
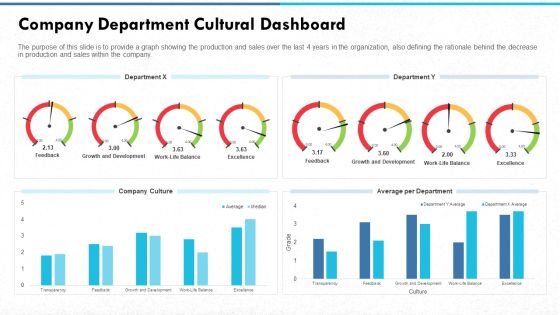
Managing Strong Company Culture In Business Company Department Cultural Dashboard Sample PDF
The purpose of this slide is to provide a graph showing the production and sales over the last 4 years in the organization, also defining the rationale behind the decrease in production and sales within the company. Deliver an awe-inspiring pitch with this creative managing strong company culture in business company department cultural dashboard sample pdf. bundle. Topics like company culture, average per department, department y, department x can be discussed with this completely editable template. It is available for immediate download depending on the needs and requirements of the user.
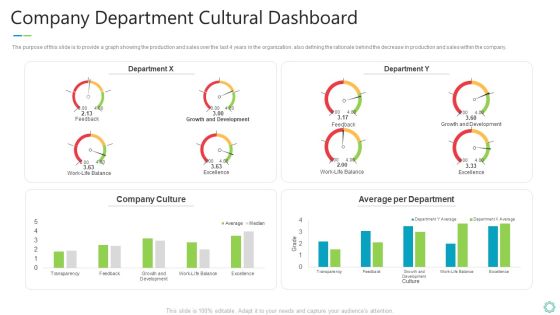
Transforming Organizational Processes And Outcomes Company Department Cultural Dashboard Introduction PDF
The purpose of this slide is to provide a graph showing the production and sales over the last 4 years in the organization, also defining the rationale behind the decrease in production and sales within the company. Deliver an awe inspiring pitch with this creative transforming organizational processes and outcomes company department cultural dashboard introduction pdf bundle. Topics like growth, development, excellence, culture can be discussed with this completely editable template. It is available for immediate download depending on the needs and requirements of the user.

Customer Relationship Strategy For Building Loyalty Customer Experience Dashboard Designs PDF
Mentioned slide provides comprehensive statistics for measuring and evaluating customer experience level with respect to brand persona. It covers customer satisfaction index, rewards member index etc. Deliver an awe inspiring pitch with this creative customer relationship strategy for building loyalty customer experience dashboard designs pdf bundle. Topics like customer duration, rewards member, complaint index in hundreds, customer satisfaction index by regions can be discussed with this completely editable template. It is available for immediate download depending on the needs and requirements of the user.

Customer Relationship Strategy For Building Loyalty Customer Service Dashboard Mockup PDF
This slide majorly aims to provide insights about the impact of customer intimacy strategy on customer service quality. It shows complaint ticket status, customer happiness ratings, and average traffic analysis etc. Deliver and pitch your topic in the best possible manner with this customer relationship strategy for building loyalty customer service dashboard mockup pdf. Use them to share invaluable insights on traffic analysis, average tickets reply time and impress your audience. This template can be altered and modified as per your expectations. So, grab it now.
Sales Process Catalogue Template Sales Management Activities Tracking Dashboard Summary PDF
This slide provides information regarding various metrics catered to track sales team performance in terms of average revenue per account, win rate, NPS, along with sales representative performance tracking through number of opportunities created, lead response time, etc. Deliver an awe inspiring pitch with this creative sales process catalogue template sales management activities tracking dashboard summary pdf bundle. Topics like sales pipeline, sales activity by sales rep, sales pipeline by sales rep, closed business, month over month growth, forecast by month can be discussed with this completely editable template. It is available for immediate download depending on the needs and requirements of the user.
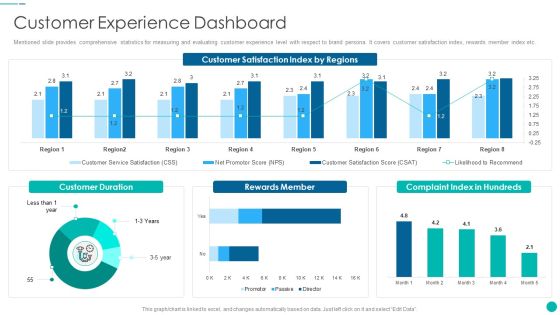
Tactical Procedure For Increasing Customer Intimacy Customer Experience Dashboard Topics PDF
Mentioned slide provides comprehensive statistics for measuring and evaluating customer experience level with respect to brand persona. It covers customer satisfaction index, rewards member index etc. Deliver an awe inspiring pitch with this creative tactical procedure for increasing customer intimacy customer experience dashboard topics pdf bundle. Topics like customer duration, rewards member, complaint index in hundreds, customer satisfaction index by regions can be discussed with this completely editable template. It is available for immediate download depending on the needs and requirements of the user.

Tactical Procedure For Increasing Customer Intimacy Customer Service Dashboard Ideas PDF
This slide majorly aims to provide insights about the impact of customer intimacy strategy on customer service quality. It shows complaint ticket status, customer happiness ratings, and average traffic analysis etc. Deliver and pitch your topic in the best possible manner with this tactical procedure for increasing customer intimacy customer service dashboard ideas pdf. Use them to share invaluable insights on traffic analysis, average tickets reply time and impress your audience. This template can be altered and modified as per your expectations. So, grab it now.
Marketing Playbook To Maximize ROI Sales Management Activities Tracking Dashboard Guidelines PDF
This slide provides information regarding various metrics catered to track sales team performance in terms of average revenue per account, win rate, NPS, along with sales representative performance tracking through number of opportunities created, lead response time, etc. Deliver and pitch your topic in the best possible manner with this marketing playbook to maximize roi sales management activities tracking dashboard guidelines pdf. Use them to share invaluable insights on closed business, sales pipeline, month over month growth, sales activity by sales rep and impress your audience. This template can be altered and modified as per your expectations. So, grab it now.

Health And Safety Performance Measurements Dashboard For Manufacturing Company Guidelines PDF
This slide covers the information related to the incidents that has happened during a year on a monthly basis due to not following safety measures. It also includes total number of incidents in a company, near incidents reported , etc. Showcasing this set of slides titled Health And Safety Performance Measurements Dashboard For Manufacturing Company Guidelines PDF The topics addressed in these templates are Incident Ackumulated , Incidents After Safety, Incidence Avoidance All the content presented in this PPT design is completely editable. Download it and make adjustments in color, background, font etc. as per your unique business setting.

Health And Safety Performance Measurements Dashboard With Employee Stats Template PDF
This slide comprises of many types of activities that have taken place in an organization in terms of the safety and it also shows how the employees performance are going on in terms of safety . It includes training hours, total man-hour , severity of the accidents , etc.Pitch your topic with ease and precision using this Health And Safety Performance Measurements Dashboard With Employee Stats Template PDF This layout presents information on Safety Observation, Injuries Frequency, Unsafe Conditions It is also available for immediate download and adjustment. So, changes can be made in the color, design, graphics or any other component to create a unique layout.
 Home
Home