Cost Dashboard
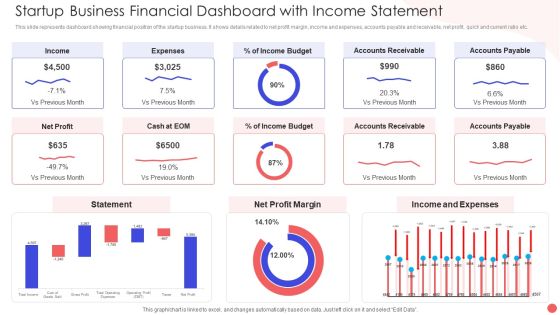
Startup Business Financial Dashboard With Income Statement Portrait PDF
This slide represents dashboard showing financial position of the startup business. It shows details related to net profit margin, income and expenses, accounts payable and receivable, net profit, quick and current ratio etc. Showcasing this set of slides titled Startup Business Financial Dashboard With Income Statement Portrait PDF. The topics addressed in these templates are Accounts Receivable Income, Income And Expenses, Net Profit Margin. All the content presented in this PPT design is completely editable. Download it and make adjustments in color, background, font etc. as per your unique business setting.

HR Analytical Workforce Administration Kpi Dashboard Introduction PDF
The below slide provides an insights to various KPAs of HR analytics. It includes elements such as extra time worked, leave hours, job order wise workforce expenses, expected versus actual hours etc. Showcasing this set of slides titled HR Analytical Workforce Administration Kpi Dashboard Introduction PDF. The topics addressed in these templates are Workforce Expenses, Administration KPI Dashboard. All the content presented in this PPT design is completely editable. Download it and make adjustments in color, background, font etc. as per your unique business setting.
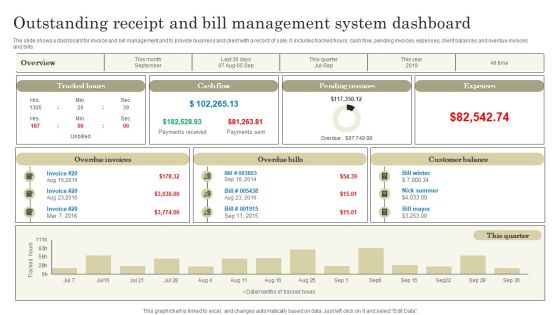
Outstanding Receipt And Bill Management System Dashboard Pictures PDF
The slide shows a dashboard for invoice and bill management and to provide business and client with a record of sale. It includes tracked hours, cash flow, pending invoices, expenses, client balances and overdue invoices and bills. Showcasing this set of slides titled Outstanding Receipt And Bill Management System Dashboard Pictures PDF. The topics addressed in these templates are Tracked hours, Cash flow, Pending invoices, Expenses. All the content presented in this PPT design is completely editable. Download it and make adjustments in color, background, font etc. as per your unique business setting.

Dashboard To Assess Ecommerce Financial Performance Across Regions Infographics PDF
This slide showcases ecommerce key performance indicators KPI dashboard with financial statement. It provides information about total sales, orders, net profit, net profit margin, average order value, channels, etc.Here you can discover an assortment of the finest PowerPoint and Google Slides templates. With these templates, you can create presentations for a variety of purposes while simultaneously providing your audience with an eye-catching visual experience. Download Dashboard To Assess Ecommerce Financial Performance Across Regions Infographics PDF to deliver an impeccable presentation. These templates will make your job of preparing presentations much quicker, yet still, maintain a high level of quality. Slidegeeks has experienced researchers who prepare these templates and write high-quality content for you. Later on, you can personalize the content by editing the Dashboard To Assess Ecommerce Financial Performance Across Regions Infographics PDF.
Lead Tracking Dashboard With Metric Comparison Brochure PDF
This slide showcases dashboard of lead pipeline that can help to identify total number of leads generated and expenses incurred to acquire the audience. It also showcases other key performance metrics like lead breakdown by status and number of leads per month. Pitch your topic with ease and precision using this Lead Tracking Dashboard With Metric Comparison Brochure PDF. This layout presents information on Metric Comparison, Lead Pipeline, Lead Breakdown Status. It is also available for immediate download and adjustment. So, changes can be made in the color, design, graphics or any other component to create a unique layout.

KPI Dashboard For Modernizing Hospitality Business Inspiration PDF
The following slide showcases dashboard to track data and perform analytics for managing staff, ordering supplies and to maintain customer satisfaction. It presents information related to expenses, sales, etc. Pitch your topic with ease and precision using this KPI Dashboard For Modernizing Hospitality Business Inspiration PDF. This layout presents information on Fiscal Year, Labor, Modernizing Hospitality. It is also available for immediate download and adjustment. So, changes can be made in the color, design, graphics or any other component to create a unique layout.

IT Project Time Scheduling Dashboard With Task Progress Sample PDF
This slide exhibits IT project time management dashboard with task progress. It contains information about project or task entry, time taken, budget, etc. which can be beneficial in tracking an IT projects weekly budget and time. Showcasing this set of slides titled it project time scheduling dashboard with task progress sample pdf. The topics addressed in these templates are project, budget. All the content presented in this PPT design is completely editable. Download it and make adjustments in color, background, font etc. as per your unique business setting.

Project Portfolio Metrics Dashboard With Activity Plan Clipart PDF
This slide focuses on project portfolio management dashboard which includes completed projects, budget spent, number of team members, associated risks and issues, activity plan with duration, status percentage, budget allocation, critical issues, tasks, comments, etc. Pitch your topic with ease and precision using this Project Portfolio Metrics Dashboard With Activity Plan Clipart PDF. This layout presents information on Budgets, Team, Risks. It is also available for immediate download and adjustment. So, changes can be made in the color, design, graphics or any other component to create a unique layout.
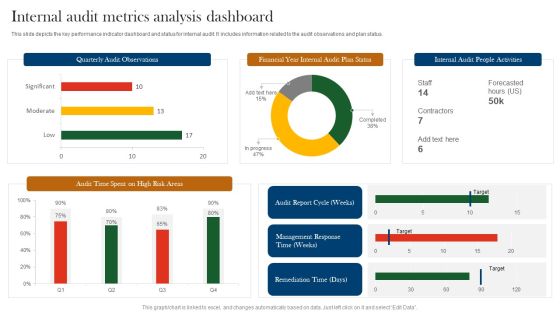
Internal Audit Metrics Analysis Dashboard Ppt Ideas Clipart Images PDF
This slide depicts the key performance indicator dashboard and status for internal audit. It includes information related to the audit observations and plan status. Pitch your topic with ease and precision using this Internal Audit Metrics Analysis Dashboard Ppt Ideas Clipart Images PDF. This layout presents information on Quarterly Audit Observations, Financial Year Internal, Audit Plan Status. It is also available for immediate download and adjustment. So, changes can be made in the color, design, graphics or any other component to create a unique layout.

Dashboard Showing Outcomes Summary Of Project Information PDF
This slide provides the dashboard that depicts the summary of project results which also includes task status, priority, budget, pending items with quarterly statements such as kick-off meetings, staffing, testing, hardware configuration, etc.Showcasing this set of slides titled Dashboard Showing Outcomes Summary Of Project Information PDF The topics addressed in these templates are Hardware Configuration, Agree On Objectives, Final Resource All the content presented in this PPT design is completely editable. Download it and make adjustments in color, background, font etc. as per your unique business setting.

Dashboard Analytics Of Real Time Website Traffic Data Information PDF
The slide showcases a real time dashboard used to analyse, track, and report on the website traffic data in real time with the help of interactive data visualizations. It covers latest data sources, latest devices, views per minute, views per second, latest locations and latest website visitors. Showcasing this set of slides titled Dashboard Analytics Of Real Time Website Traffic Data Information PDF. The topics addressed in these templates are Latest Data Sources, Latest Devices, Views Per Second. All the content presented in this PPT design is completely editable. Download it and make adjustments in color, background, font etc. as per your unique business setting.

Cloud Data Transformation Dashboard For Application Analytics Information PDF
This slide shows data migration best practices dashboard for application analytics. It includes information about software as a service applications, app workload analysis, migration details, document, business unit. Pitch your topic with ease and precision using this Cloud Data Transformation Dashboard For Application Analytics Information PDF. This layout presents information on Software Service Applications, App Workload Analysis, Migration Details. It is also available for immediate download and adjustment. So, changes can be made in the color, design, graphics or any other component to create a unique layout.

Warehouse Fleet And Transportation Performance Analytics Dashboard Pictures PDF
This slide represents a warehouse fleet and transportation management dashboard to visualize and optimize logistics operations through advanced data analyses. It monitors KPIs such as fleet status, delivery status, deliveries by location, average delivery time hours0 and route Km, loading time and weight, and profit by location. Do you have to make sure that everyone on your team knows about any specific topic I yes, then you should give Warehouse Fleet And Transportation Performance Analytics Dashboard Pictures PDF a try. Our experts have put a lot of knowledge and effort into creating this impeccable Warehouse Fleet And Transportation Performance Analytics Dashboard Pictures PDF. You can use this template for your upcoming presentations, as the slides are perfect to represent even the tiniest detail. You can download these templates from the Slidegeeks website and these are easy to edit. So grab these today

Customer Goods Production Manufacturing Company Dashboard With Downtime Pictures PDF
This slide showcases the manufacturing company dashboard which showcases downtime causes top 5 products with price with sold items and revenue, it also includes production volume by top machines. This Customer Goods Production Manufacturing Company Dashboard With Downtime Pictures PDF is perfect for any presentation, be it in front of clients or colleagues. It is a versatile and stylish solution for organizing your meetings. The Customer Goods Production Manufacturing Company Dashboard With Downtime Pictures PDF features a modern design for your presentation meetings. The adjustable and customizable slides provide unlimited possibilities for acing up your presentation. Slidegeeks has done all the homework before launching the product for you. So, dont wait, grab the presentation templates today.

Retail Analytics Dashboard To Measure Merchandise Planning Effectiveness Microsoft PDF
This slide shows the retail analytics dashboard to measure merchandise planning effectiveness which includes conversion rate, sell through rate, return on investment, website traffic, abandonment rate, etc. Make sure to capture your audiences attention in your business displays with our gratis customizable Retail Analytics Dashboard To Measure Merchandise Planning Effectiveness Microsoft PDF. These are great for business strategies, office conferences, capital raising or task suggestions. If you desire to acquire more customers for your tech business and ensure they stay satisfied, create your own sales presentation with these plain slides.

Smart Manufacturing Dashboard To Track Production Quality Rules PDF
This slide represents smart manufacturing dashboard. It covers production volume, downtime causes, top product sold item, sales revenue, active machinery etc.Boost your pitch with our creative Smart Manufacturing Dashboard To Track Production Quality Rules PDF. Deliver an awe-inspiring pitch that will mesmerize everyone. Using these presentation templates you will surely catch everyones attention. You can browse the ppts collection on our website. We have researchers who are experts at creating the right content for the templates. So you do not have to invest time in any additional work. Just grab the template now and use them.

Dashboard For Tracking Aftersales Customer Services Team Performance Designs PDF
This slide covers the KPI dashboard for ticket tracking. It includes metrics such as tickets by month, service level, and details of customer service department agents. Boost your pitch with our creative Dashboard For Tracking Aftersales Customer Services Team Performance Designs PDF. Deliver an awe inspiring pitch that will mesmerize everyone. Using these presentation templates you will surely catch everyones attention. You can browse the ppts collection on our website. We have researchers who are experts at creating the right content for the templates. So you do not have to invest time in any additional work. Just grab the template now and use them.

Email Marketing Campaign Performance Dashboard Analysis Information PDF
This slide allows to track the performance of different email marketing campaigns and provides insights to improve business strategy. It includes monthly open and clicks rate, campaign investment returns, unsubscribed ratio, etc. Showcasing this set of slides titled Email Marketing Campaign Performance Dashboard Analysis Information PDF. The topics addressed in these templates are Performance Dashboard Analysis, Email Marketing Campaign. All the content presented in this PPT design is completely editable. Download it and make adjustments in color, background, font etc. as per your unique business setting.

Dashboard For Hiring Data Analysis By Recruitment Team Formats PDF
The slide highlights the dashboard for hiring data analysis by recruitment team depicting of open job positions, jobs approved, candidates in recruitment pipeline and job assigned to team.Pitch your topic with ease and precision using this Dashboard For Hiring Data Analysis By Recruitment Team Formats PDF This layout presents information on Candidates Recruitment, Marketing Communication, Approved It is also available for immediate download and adjustment. So, changes can be made in the color, design, graphics or any other component to create a unique layout.
Employee Talent Management Procedure Tracking Dashboard With Kpis Download PDF
This slide represents dashboard of the human resource department for tracking the performance and management of organizations workforce. It includes details related to monthly new hires, total active employees, suite people metrics along with key performance indicators. Showcasing this set of slides titled Employee Talent Management Procedure Tracking Dashboard With Kpis Download PDF. The topics addressed in these templates are Total Active Employees, Employees, Suite People Metrics. All the content presented in this PPT design is completely editable. Download it and make adjustments in color, background, font etc. as per your unique business setting.

Company Payout Dashboard For Transaction Data Collection Themes PDF
The slide covers a dashboard to highlight the status of current and previous transactions. Various elements included are card details, my cash, my savings, money sent, amount transfers, transaction history, etc. Pitch your topic with ease and precision using this Company Payout Dashboard For Transaction Data Collection Themes PDF. This layout presents information on Amount Transfers, Earning Month, Previous Transaction. It is also available for immediate download and adjustment. So, changes can be made in the color, design, graphics or any other component to create a unique layout.

Cyber Security Key Performance Indicators Metrics Dashboard Mockup PDF
This slide covers cyber security health status dashboard . It also includes audit and compliance, controls health, project status, incident response process, vulnerability patching schedule, investigation process and training compliance. Pitch your topic with ease and precision using this Cyber Security Key Performance Indicators Metrics Dashboard Mockup PDF. This layout presents information on Cyber Security, Vulnerability Patching Schedule, Compliance Investigation Process. It is also available for immediate download and adjustment. So, changes can be made in the color, design, graphics or any other component to create a unique layout.

Centralized Repository Data Lake Reporting Dashboard Icons PDF
This slide represents the data lake reporting dashboard by covering the total number of users, total lake size, trusted zone size, conversion rate, and retention. Find a pre designed and impeccable Centralized Repository Data Lake Reporting Dashboard Icons PDF. The templates can ace your presentation without additional effort. You can download these easy to edit presentation templates to make your presentation stand out from others. So, what are you waiting for Download the template from Slidegeeks today and give a unique touch to your presentation.
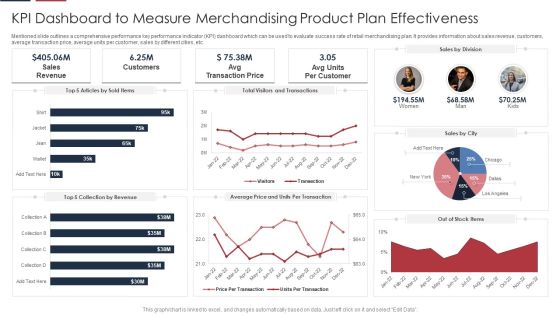
KPI Dashboard To Measure Merchandising Product Plan Effectiveness Guidelines PDF
Mentioned slide outlines a comprehensive performance key performance indicator KPI dashboard which can be used to evaluate success rate of retail merchandising plan. It provides information about sales revenue, customers, average transaction price, average units per customer, sales by different cities, etc. Showcasing this set of slides titled KPI Dashboard To Measure Merchandising Product Plan Effectiveness Guidelines PDF. The topics addressed in these templates are Sales, Customers, Price. All the content presented in this PPT design is completely editable. Download it and make adjustments in color, background, font etc. as per your unique business setting.
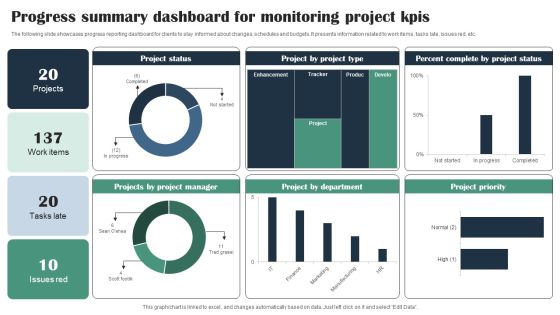
Progress Summary Dashboard For Monitoring Project Kpis Infographics PDF
The following slide showcases progress reporting dashboard for clients to stay informed about changes, schedules and budgets. It presents information related to work items, tasks late, issues red, etc. Pitch your topic with ease and precision using this Progress Summary Dashboard For Monitoring Project Kpis Infographics PDF. This layout presents information on Project Status, Project Manager, Project Type, Percent Complete. It is also available for immediate download and adjustment. So, changes can be made in the color, design, graphics or any other component to create a unique layout.

Net Promoter Score Dashboard Financial Ppt Styles Show PDF
Presenting net promoter score dashboard financial ppt styles show pdf to provide visual cues and insights. Share and navigate important information on three stages that need your due attention. This template can be used to pitch topics like financial, medium, minimum, maximum. In addtion, this PPT design contains high-resolution images, graphics, etc, that are easily editable and available for immediate download.

Stocks Market Capitalization Fundamental Trend Analysis Dashboard Designs PDF
This slide represents the dashboard showing the fundamental analysis of the stock market. It includes data related to top 10 stock market capitalization, top 10 stocks by EPS and top 5 stocks by net profit.Showcasing this set of slides titled Stocks Market Capitalization Fundamental Trend Analysis Dashboard Designs PDF. The topics addressed in these templates are Market Capitalization, Net Profit. All the content presented in this PPT design is completely editable. Download it and make adjustments in color, background, font etc. as per your unique business setting.

Dashboard To Track Several Projects Performance By Firm Template PDF
This slide provides information regarding the dashboard which will help team in tracking different activities associated to multiple projects by monitoring resources, tasks status, bugs and features closed, etc. Do you have an important presentation coming up Are you looking for something that will make your presentation stand out from the rest Look no further than Dashboard To Track Several Projects Performance By Firm Template PDF. With our professional designs, you can trust that your presentation will pop and make delivering it a smooth process. And with Slidegeeks, you can trust that your presentation will be unique and memorable. So why wait Grab Dashboard To Track Several Projects Performance By Firm Template PDF today and make your presentation stand out from the rest.

Dashboard To Track Several Projects Performance By Firm Themes PDF
This slide provides information regarding the dashboard which will help team in tracking different activities associated to multiple projects by monitoring resources, tasks status, bugs and features closed, etc. Find highly impressive Dashboard To Track Several Projects Performance By Firm Themes PDF on Slidegeeks to deliver a meaningful presentation. You can save an ample amount of time using these presentation templates. No need to worry to prepare everything from scratch because Slidegeeks experts have already done a huge research and work for you. You need to download Dashboard To Track Several Projects Performance By Firm Themes PDF for your upcoming presentation. All the presentation templates are 100 percent editable and you can change the color and personalize the content accordingly. Download now

Maintaining Partner Relationships Customer Satisfaction KPI Dashboard Inspiration PDF
Mentioned slide portrays customer satisfaction dashboard with KPIs namely net promoter score, customer effort score and satisfaction scores. Sections covered in satisfaction score are product quality, pricing, design and service. Deliver and pitch your topic in the best possible manner with this Maintaining Partner Relationships Customer Satisfaction KPI Dashboard Inspiration PDF. Use them to share invaluable insights on Net Promoter Score, Customer Effort Score, Quality, Service, Pricing and impress your audience. This template can be altered and modified as per your expectations. So, grab it now.
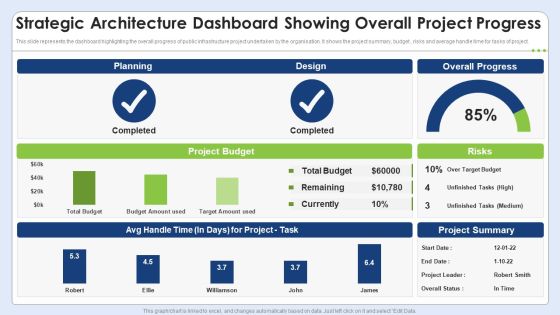
Strategic Architecture Dashboard Showing Overall Project Progress Introduction PDF
This slide represents the dashboard highlighting the overall progress of public infrastructure project undertaken by the organisation. It shows the project summary, budget , risks and average handle time for tasks of project. Showcasing this set of slides titled Strategic Architecture Dashboard Showing Overall Project Progress Introduction PDF. The topics addressed in these templates are Budget, Risks, Target. All the content presented in this PPT design is completely editable. Download it and make adjustments in color, background, font etc. as per your unique business setting.
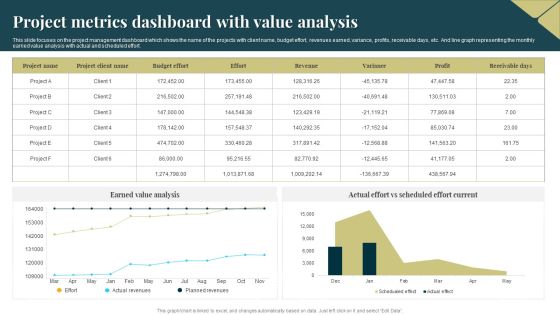
Project Metrics Dashboard With Value Analysis Introduction PDF
This slide focuses on the project management dashboard which shows the name of the projects with client name, budget effort, revenues earned, variance, profits, receivable days, etc. And line graph representing the monthly earned value analysis with actual and scheduled effort. Showcasing this set of slides titled Project Metrics Dashboard With Value Analysis Introduction PDF. The topics addressed in these templates are Budget Effort, Revenues, Earned Value Analysis. All the content presented in this PPT design is completely editable. Download it and make adjustments in color, background, font etc. as per your unique business setting.

Continuous Process Improvement KPI Dashboard For IT Industry Clipart PDF
Following slide depicts the IT industry KPI dashboard which will assist in generating more of profit by improving strategic plan according to changing environment with clients preferences .The KPI mentioned in a slide are such as risk analysis, outstanding task , upcoming task, budget analysis, etc. Pitch your topic with ease and precision using this Continuous Process Improvement KPI Dashboard For IT Industry Clipart PDF. This layout presents information on Overall Progress, Risk Analysis, Budget Analysis. It is also available for immediate download and adjustment. So, changes can be made in the color, design, graphics or any other component to create a unique layout.

KPI Metrics Dashboard Highlighting Employee Retention Rate Structure PDF
The purpose of this slide is to exhibit a key performance indicator KPI dashboard through which managers can analyze the monthly employee retention rate. The metrics covered in the slide are active employees, new candidates hired, internal, exit, employee turnover rate, etc. Do you have to make sure that everyone on your team knows about any specific topic I yes, then you should give KPI Metrics Dashboard Highlighting Employee Retention Rate Structure PDF a try. Our experts have put a lot of knowledge and effort into creating this impeccable KPI Metrics Dashboard Highlighting Employee Retention Rate Structure PDF. You can use this template for your upcoming presentations, as the slides are perfect to represent even the tiniest detail. You can download these templates from the Slidegeeks website and these are easy to edit. So grab these today.

Funds Requisite Evaluation Fixed Asset Dashboard Brochure Demonstration PDF
Presenting this set of slides with name funds requisite evaluation fixed asset dashboard brochure demonstration pdf. The topics discussed in these slides are fixed assets, value, fiscal year. This is a completely editable PowerPoint presentation and is available for immediate download. Download now and impress your audience.

DSS Software Program Augmented Intelligence Information Tracking Dashboard Background PDF
This slide depicts the information tracking dashboard by augmented intelligence model covering the data analysis. Data analysis includes image analysis, storage size, new users on the cloud platform, etc. Do you have to make sure that everyone on your team knows about any specific topic I yes, then you should give DSS Software Program Augmented Intelligence Information Tracking Dashboard Background PDF a try. Our experts have put a lot of knowledge and effort into creating this impeccable DSS Software Program Augmented Intelligence Information Tracking Dashboard Background PDF. You can use this template for your upcoming presentations, as the slides are perfect to represent even the tiniest detail. You can download these templates from the Slidegeeks website and these are easy to edit. So grab these today.
Recommendation Techniques Recommender Systems Performance Tracking Dashboard Brochure PDF
This slide shows the dashboard to keep a track of the performance of recommender systems. The purpose of this slide is to provide a graphical representation of recommendation engines performance to enhance the accuracy and effectiveness of the system. Find highly impressive Recommendation Techniques Recommender Systems Performance Tracking Dashboard Brochure PDF on Slidegeeks to deliver a meaningful presentation. You can save an ample amount of time using these presentation templates. No need to worry to prepare everything from scratch because Slidegeeks experts have already done a huge research and work for you. You need to download Recommendation Techniques Recommender Systems Performance Tracking Dashboard Brochure PDF for your upcoming presentation. All the presentation templates are 100 percent editable and you can change the color and personalize the content accordingly. Download now

Website Analytics Dashboard For Consumer Data Insights Clipart PDF
This slide showcases dashboard for website analytics that can help organization to gather data about visitors and formulate targeted marketing campaigns. It can also help to make individual and group buyer personas. Want to ace your presentation in front of a live audience Our Website Analytics Dashboard For Consumer Data Insights Clipart PDF can help you do that by engaging all the users towards you.. Slidegeeks experts have put their efforts and expertise into creating these impeccable powerpoint presentations so that you can communicate your ideas clearly. Moreover, all the templates are customizable, and easy-to-edit and downloadable. Use these for both personal and commercial use.
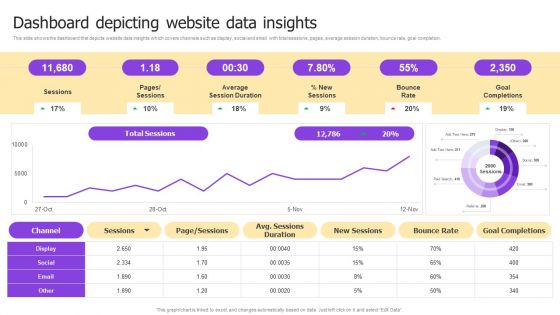
Implementing Brand Development Dashboard Depicting Website Data Insights Guidelines PDF
This slide shows the dashboard that depicts website data insights which covers channels such as display, social and email with total sessions, pages, average session duration, bounce rate, goal completion. Get a simple yet stunning designed Implementing Brand Development Dashboard Depicting Website Data Insights Guidelines PDF. It is the best one to establish the tone in your meetings. It is an excellent way to make your presentations highly effective. So, download this PPT today from Slidegeeks and see the positive impacts. Our easy-to-edit Implementing Brand Development Dashboard Depicting Website Data Insights Guidelines PDF can be your go-to option for all upcoming conferences and meetings. So, what are you waiting for Grab this template today.
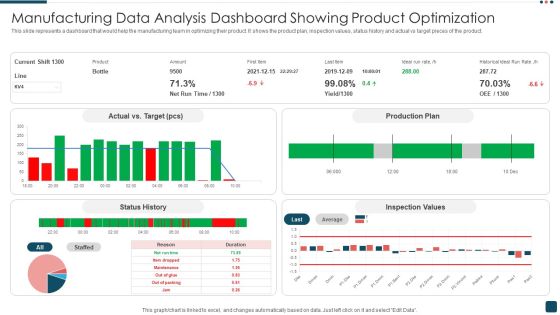
Manufacturing Data Analysis Dashboard Showing Product Optimization Structure PDF
This slide represents a dashboard that would help the manufacturing team in optimizing their product. It shows the product plan, inspection values, status history and actual vs target pieces of the product. Pitch your topic with ease and precision using this Manufacturing Data Analysis Dashboard Showing Product Optimization Structure PDF. This layout presents information on Target, Production Plan, Inspection Values. It is also available for immediate download and adjustment. So, changes can be made in the color, design, graphics or any other component to create a unique layout.
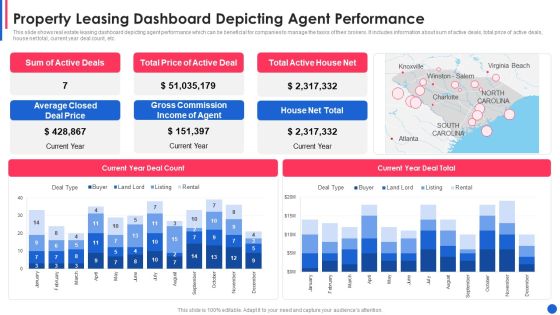
Property Leasing Dashboard Depicting Agent Performance Guidelines PDF
This slide shows real estate leasing dashboard depicting agent performance which can be beneficial for companies to manage the tasks of their brokers. It includes information about sum of active deals, total price of active deals, house net total, current year deal count, etc.Pitch your topic with ease and precision using this property leasing dashboard depicting agent performance guidelines pdf This layout presents information on average closed deal price, gross commission income, total active house net It is also available for immediate download and adjustment. So, changes can be made in the color, design, graphics or any other component to create a unique layout.

Altcoins Portfolio Tracking Metrics Dashboard Ppt Inspiration Background Images PDF
This slide covers dashboard for tracking different cryptocurrencies value and growth. It includes metrics such as incomes and expenses, market values, cryptocurrency transactions history, overall growth percentages, exchange rates, etc. Showcasing this set of slides titled Altcoins Portfolio Tracking Metrics Dashboard Ppt Inspiration Background Images PDF. The topics addressed in these templates are Balance, 3 Currencies, Transactions. All the content presented in this PPT design is completely editable. Download it and make adjustments in color, background, font etc. as per your unique business setting.

Dashboard For Assessing Project Team Productivity Report Mockup PDF
This slide depicts a dashboard for monitoring team productivity reports in project management. It covers various areas such as billing by the consumer, productivity reports, employee billable hours, etc. Pitch your topic with ease and precision using this Dashboard For Assessing Project Team Productivity Report Mockup PDF. This layout presents information on Billing Expense Customer, Employee Productivity Report, Profitability Customer. It is also available for immediate download and adjustment. So, changes can be made in the color, design, graphics or any other component to create a unique layout.

Dashboard For Analysing Aftersales Customer Satisfaction Kpis Mockup PDF
This slide covers a dashboard for tracking consumer satisfaction with metrics such as customer satisfaction score, customer effort score, net promoter score, average response time, etc. Are you searching for a Dashboard For Analysing Aftersales Customer Satisfaction Kpis Mockup PDF that is uncluttered, straightforward, and original Its easy to edit, and you can change the colors to suit your personal or business branding. For a presentation that expresses how much effort you have put in, this template is ideal With all of its features, including tables, diagrams, statistics, and lists, its perfect for a business plan presentation. Make your ideas more appealing with these professional slides. Download Dashboard For Analysing Aftersales Customer Satisfaction Kpis Mockup PDF from Slidegeeks today.

Project Metrics Dashboard With Launch Date Formats PDF
This slide covers the project management dashboard which includes status of project phases such as planning, designing, development and testing that also focuses on launch date of project, overdue tasks with date, deadline, etc. and workload on employees. Showcasing this set of slides titled Project Metrics Dashboard With Launch Date Formats PDF. The topics addressed in these templates are Budget, Project Launch Data, Development. All the content presented in this PPT design is completely editable. Download it and make adjustments in color, background, font etc. as per your unique business setting.
KPI Dashboard For Tracking Customer Retention Infographics PDF
This slide covers the dashboard for analyzing customer loyalty with metrics such as NPS, loyal customer rate, premium users, CLV, customer churn, revenue churn, net retention, MRR growth, etc. Slidegeeks is one of the best resources for PowerPoint templates. You can download easily and regulate KPI Dashboard For Tracking Customer Retention Infographics PDF for your personal presentations from our wonderful collection. A few clicks is all it takes to discover and get the most relevant and appropriate templates. Use our Templates to add a unique zing and appeal to your presentation and meetings. All the slides are easy to edit and you can use them even for advertisement purposes.

Personnel Salary Dashboard For Executive Management And Workers Rules PDF
The following slide highlights the employee payroll dashboard for executive, management and workers illustrating key headings which includes country, pay period, pay groups, payroll summary, payroll results, payroll details, payroll preparation, payroll processing and worker data. Showcasing this set of slides titled Personnel Salary Dashboard For Executive Management And Workers Rules PDF. The topics addressed in these templates are Management, Executive, Employees Fund. All the content presented in this PPT design is completely editable. Download it and make adjustments in color, background, font etc. as per your unique business setting.

Customer Decline Of Sales Analysis Dashboard Rules PDF
The following slide presents a key performance indicating dashboards that can be used by managers in order to analyse customer-lost sales. Major key performance indicators are lost deals rate, lost sales rate, customer data analytics, etc. Pitch your topic with ease and precision using this Customer Decline Of Sales Analysis Dashboard Rules PDF. This layout presents information on Customer Data Analytics. It is also available for immediate download and adjustment. So, changes can be made in the color, design, graphics or any other component to create a unique layout.

Customer Service Metrics Dashboard With Average Response Time Formats PDF
This slide showcases KPI dashboard for customer service that can help to evaluate the performance of call center agents and identify issues arising from different channels. Its key components are number of issues in last 1 day, average time to closes, first call resolution, daily average response time, average time to close by channel and top performing call agents. Pitch your topic with ease and precision using this Customer Service Metrics Dashboard With Average Response Time Formats PDF. This layout presents information on Customer Service, Metrics Dashboard, Average Response Time. It is also available for immediate download and adjustment. So, changes can be made in the color, design, graphics or any other component to create a unique layout.

Call Center Kpis Dashboard With Data Management Infographics PDF
This slide covers contact center metrics KPI dashboard with call data details. It involves details such as total number of contacts handled, product sales, repeated calls and contact handles per day. Pitch your topic with ease and precision using this Call Center Kpis Dashboard With Data Management Infographics PDF. This layout presents information on Achieved, Contacts Handled, Repeated Calls. It is also available for immediate download and adjustment. So, changes can be made in the color, design, graphics or any other component to create a unique layout.

Dashboard To Track Performance Of Digital Loan Applications Pictures PDF
This slide covers dashboard to assess outcomes for loan applications applied by customer through various omnichannel banking services. It includes results based on elements such as debt restructuring, commercial property loans, credit card along with branch based loans, approval rates, etc. Find a pre designed and impeccable Dashboard To Track Performance Of Digital Loan Applications Pictures PDF. The templates can ace your presentation without additional effort. You can download these easy to edit presentation templates to make your presentation stand out from others. So, what are you waiting for Download the template from Slidegeeks today and give a unique touch to your presentation.
Work From Home Performance Management Dashboard Icons PDF
The following slide outlines a comprehensive key performance indicator KPI dashboard that can be used to showcase employees performance during work from home WFH. Information covered in this slide is related to average result area scores etc. Do you have to make sure that everyone on your team knows about any specific topic. I yes, then you should give Work From Home Performance Management Dashboard Icons PDF a try. Our experts have put a lot of knowledge and effort into creating this impeccable Work From Home Performance Management Dashboard Icons PDF. You can use this template for your upcoming presentations, as the slides are perfect to represent even the tiniest detail. You can download these templates from the Slidegeeks website and these are easy to edit. So grab these today.

Dashboard To Assess Ecommerce Financial Performance Across Regions Themes PDF
This slide showcases ecommerce key performance indicators KPI dashboard with financial statement. It provides information about total sales, orders, net profit, net profit margin, average order value, channels, etc. Here you can discover an assortment of the finest PowerPoint and Google Slides templates. With these templates, you can create presentations for a variety of purposes while simultaneously providing your audience with an eye catching visual experience. Download Dashboard To Assess Ecommerce Financial Performance Across Regions Themes PDF to deliver an impeccable presentation. These templates will make your job of preparing presentations much quicker, yet still, maintain a high level of quality. Slidegeeks has experienced researchers who prepare these templates and write high quality content for you. Later on, you can personalize the content by editing the Dashboard To Assess Ecommerce Financial Performance Across Regions Themes PDF.

KPI Dashboard To Measure Effectiveness Of Youtube Marketing Formats PDF
The following slide outlines key performance indicator KPI dashboard which will assist the marketer to track youtube marketing campaign performance. The key metrics covered in the slide are subscribers gained and lost, likes, dislikes, comments, shares etc. Are you searching for a KPI Dashboard To Measure Effectiveness Of Youtube Marketing Formats PDF that is uncluttered, straightforward, and original Its easy to edit, and you can change the colors to suit your personal or business branding. For a presentation that expresses how much effort you have put in, this template is ideal With all of its features, including tables, diagrams, statistics, and lists, its perfect for a business plan presentation. Make your ideas more appealing with these professional slides. Download KPI Dashboard To Measure Effectiveness Of Youtube Marketing Formats PDF from Slidegeeks today.

Kpi Dashboard To Measure Effectiveness Of Youtube Marketing Slides PDF
The following slide outlines key performance indicator KPI dashboard which will assist the marketer to track YouTube marketing campaign performance. The key metrics covered in the slide are subscribers gained and lost, likes, dislikes, comments, shares etc. Do you have an important presentation coming up Are you looking for something that will make your presentation stand out from the rest Look no further than Kpi Dashboard To Measure Effectiveness Of Youtube Marketing Slides PDF. With our professional designs, you can trust that your presentation will pop and make delivering it a smooth process. And with Slidegeeks, you can trust that your presentation will be unique and memorable. So why wait Grab Kpi Dashboard To Measure Effectiveness Of Youtube Marketing Slides PDF today and make your presentation stand out from the rest.

Transformation KPI Dashboard With Relevant Operational Information Portrait PDF
Showcasing this set of slides titled Transformation KPI Dashboard With Relevant Operational Information Portrait PDF. The topics addressed in these templates are Investment, Budget, Innovators. All the content presented in this PPT design is completely editable. Download it and make adjustments in color, background, font etc. as per your unique business setting.
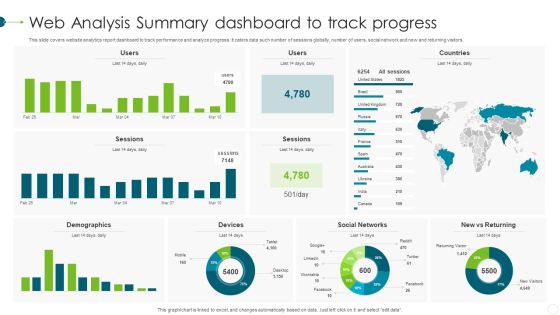
Web Analysis Summary Dashboard To Track Progress Elements PDF
This slide covers website analytics report dashboard to track performance and analyze progress. It caters data such number of sessions globally, number of users, social network and new and returning visitors. Showcasing this set of slides titled Web Analysis Summary Dashboard To Track Progress Elements PDF. The topics addressed in these templates are Demographics, Devices, Social Networks. All the content presented in this PPT design is completely editable. Download it and make adjustments in color, background, font etc. as per your unique business setting.

Implementing Cyber Security Incident Enterprise Cyber Risk Dashboard Professional PDF
This slide represents the key metrics dashboard representing details related to management of cyber security incidents by an enterprise. It includes key performance indicators such as risk analysis progress, risk rating breakdown etc. Do you have an important presentation coming up Are you looking for something that will make your presentation stand out from the rest Look no further than Implementing Cyber Security Incident Enterprise Cyber Risk Dashboard Professional PDF. With our professional designs, you can trust that your presentation will pop and make delivering it a smooth process. And with Slidegeeks, you can trust that your presentation will be unique and memorable. So why wait Grab Implementing Cyber Security Incident Enterprise Cyber Risk Dashboard Professional PDF today and make your presentation stand out from the rest.
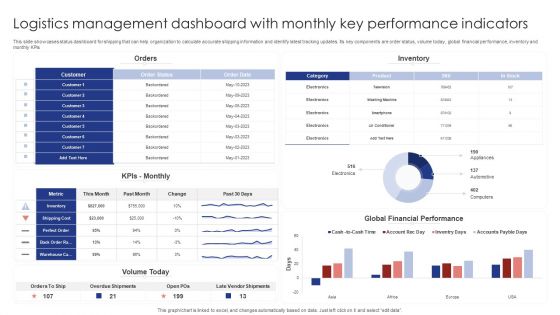
Logistics Management Dashboard With Monthly Key Performance Indicators Rules PDF
This slide showcases status dashboard for shipping that can help organization to calculate accurate shipping information and identify latest tracking updates. Its key components are order status, volume today, global financial performance, inventory and monthly KPIs. Pitch your topic with ease and precision using this Logistics Management Dashboard With Monthly Key Performance Indicators Rules PDF. This layout presents information on Orders, Inventory, Kpis Monthly. It is also available for immediate download and adjustment. So, changes can be made in the color, design, graphics or any other component to create a unique layout.
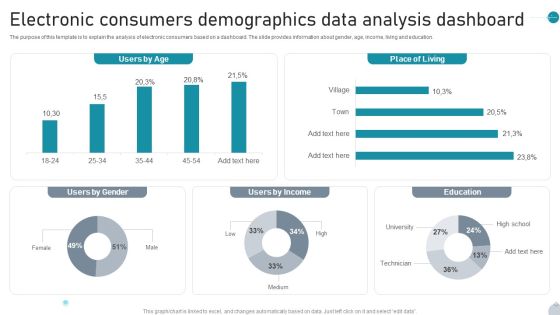
Electronic Consumers Demographics Data Analysis Dashboard Topics PDF
The purpose of this template is to explain the analysis of electronic consumers based on a dashboard. The slide provides information about gender, age, income, living and education. Showcasing this set of slides titled Electronic Consumers Demographics Data Analysis Dashboard Topics PDF. The topics addressed in these templates are Users By Age, Place Of Living, Users By Income All the content presented in this PPT design is completely editable. Download it and make adjustments in color, background, font etc. as per your unique business setting.

 Home
Home