Cost Dashboard

Dashboard For Tracking Direct Mail Advertising Campaign Performance Inspiration PDF
This slide represents dashboard showcasing direct mail marketing campaign performance progress. It provides information regarding click through rate, campaign performance, web conversions, total revenue etc. Showcasing this set of slides titled Dashboard For Tracking Direct Mail Advertising Campaign Performance Inspiration PDF. The topics addressed in these templates are Product Delivery Rate, Deliverables, App Uninstalls. All the content presented in this PPT design is completely editable. Download it and make adjustments in color, background, font etc. as per your unique business setting.
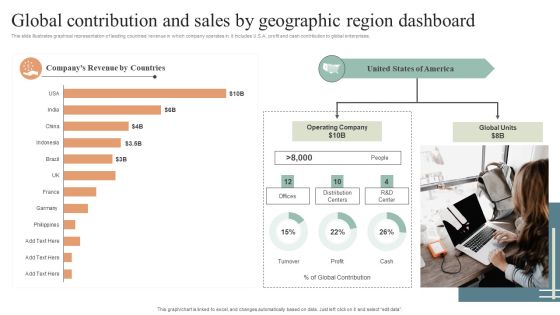
Global Contribution And Sales By Geographic Region Dashboard Diagrams PDF
This slide illustrates graphical representation of leading countries revenue in which company operates in. it includes U.S.A. profit and cash contribution to global enterprises. Pitch your topic with ease and precision using this Global Contribution And Sales By Geographic Region Dashboard Diagrams PDF. This layout presents information on Global Contribution, Sales By Geographic, Region Dashboard. It is also available for immediate download and adjustment. So, changes can be made in the color, design, graphics or any other component to create a unique layout.

Cyber Risk Impact And Probability Analysis Dashboard Brochure PDF
This slide defines the dashboard for analyzing the cyber risk impact and likelihood. It includes information related to the risk, rating and vulnerabilities. Showcasing this set of slides titled Cyber Risk Impact And Probability Analysis Dashboard Brochure PDF. The topics addressed in these templates are Risk Heat Map, Risk Rating Breakdown, Vulnerabilities. All the content presented in this PPT design is completely editable. Download it and make adjustments in color, background, font etc. as per your unique business setting.

Dashboard Illustrating Business Service User Demographics Introduction PDF
The slide showcases dashboard which provides insights on service user demographics which enable to identify target audience. It covers gender ratios, age ratios, geographic location , income and education ratios. Showcasing this set of slides titled Dashboard Illustrating Business Service User Demographics Introduction PDF. The topics addressed in these templates are Location, Income, Age, Education. All the content presented in this PPT design is completely editable. Download it and make adjustments in color, background, font etc. as per your unique business setting.

Dashboard Illustrating Changes In Business Audience Demographics Sample PDF
The slide showcases dashboard which illustrate the change in the company user demographics over the years. It covers gender, age and race ethnicity.Showcasing this set of slides titled Dashboard Illustrating Changes In Business Audience Demographics Sample PDF. The topics addressed in these templates are Gender, Age, Race Ethnicity. All the content presented in this PPT design is completely editable. Download it and make adjustments in color, background, font etc. as per your unique business setting.
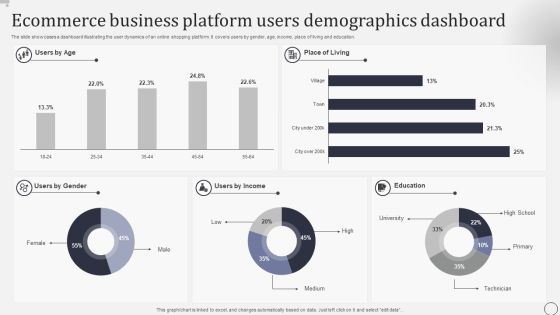
Ecommerce Business Platform Users Demographics Dashboard Rules PDF
The slide showcases a dashboard illustrating the user dynamics of an online shopping platform. It covers users by gender, age, income, place of living and education. Showcasing this set of slides titled Ecommerce Business Platform Users Demographics Dashboard Rules PDF.. The topics addressed in these templates are Users Gender, Users Income, Education. All the content presented in this PPT design is completely editable. Download it and make adjustments in color, background, font etc. as per your unique business setting.
Modifying Banking Functionalities Dashboard Tracking Online Banking Activities Background PDF
This slide contains dashboard that will allow bank to track the online customer activities in terms of new customer connected with bank on online platform, fraud prevention. It will also help the bank in tracking the numbers of employees that are connected to bank through mobile access. Deliver and pitch your topic in the best possible manner with this enhancing financial institution operations dashboard tracking online banking activities rules pdf. Use them to share invaluable insights on management, service, access and impress your audience. This template can be altered and modified as per your expectations. So, grab it now.

Performance Analysis Dashboard Icon For Email Communication Kpis Introduction PDF
Persuade your audience using this Performance Analysis Dashboard Icon For Email Communication Kpis Introduction PDF. This PPT design covers four stages, thus making it a great tool to use. It also caters to a variety of topics including Performance Analysis, Dashboard Icon, Email Communication, Kpis. Download this PPT design now to present a convincing pitch that not only emphasizes the topic but also showcases your presentation skills.
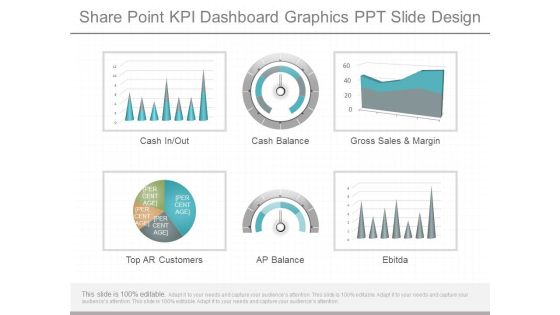
Share Point Kpi Dashboard Graphics Ppt Slide Design
This is a share point kpi dashboard graphics ppt slide design. This is a six stage process. The stages in this process are cash in out, cash balance, gross sales and margin, top ar customers, ap balance, ebitda.

Lead Scoring Lead Nurturing Ideas Dashboard Ppt Sample Download
This is a lead scoring lead nurturing ideas dashboard ppt sample download. This is a four stage process. The stages in this process are adoption of lead scoring solutions chosen, number of dimensions, projects completed, number of scoring rules.

Crm Dashboard Opportunity By Rating Ppt PowerPoint Presentation Template
This is a crm dashboard opportunity by rating ppt powerpoint presentation template. This is a five stage process. The stages in this process are count all opportunity, cold, hot, warm.

Brand Performance Dashboard Template 2 Ppt PowerPoint Presentation Template
This is a brand performance dashboard template 2 ppt powerpoint presentation template. This is a five stage process. The stages in this process are marketing, business, social, icons, management.

Crm Dashboard Current Lead Status Ppt PowerPoint Presentation Graphics
This is a crm dashboard current lead status ppt powerpoint presentation graphics. This is a six stage process. The stages in this process are carol doe, tom parker, peter smith, tony john, john clark.

Crm Dashboard Leads By Source Ppt PowerPoint Presentation Inspiration
This is a crm dashboard leads by source ppt powerpoint presentation inspiration. This is a four stage process. The stages in this process are advertisement, email campaign, online site, exhibition.

Crm Dashboard Pipeline By Sales Stage Ppt PowerPoint Presentation Deck
This is a crm dashboard pipeline by sales stage ppt powerpoint presentation deck. This is a five stage process. The stages in this process are total, quality, develop, propose, close.

Crm Dashboard Leads By Source Ppt PowerPoint Presentation Outline Deck
This is a crm dashboard leads by source ppt powerpoint presentation outline deck. This is a four stage process. The stages in this process are advertisement, email campaign, exhibition, online site.
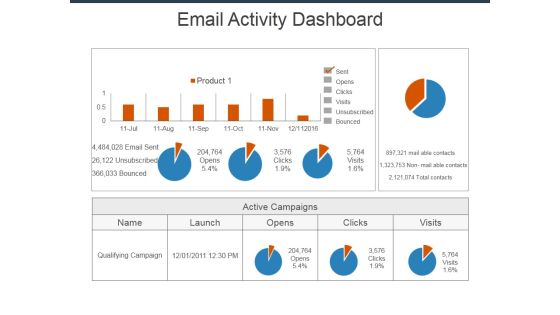
Email Activity Dashboard Ppt Powerpoint Presentation Styles Summary
This is a email activity dashboard ppt powerpoint presentation styles summary. This is a three stage process. The stages in this process are sent, opens, clicks, visits, unsubscribed, bounced, qualifying campaign.

Crm Dashboard Opportunity By Rating Ppt PowerPoint Presentation Ideas Outfit
This is a crm dashboard opportunity by rating ppt powerpoint presentation ideas outfit. This is a three stage process. The stages in this process are open opportunity, count all opportunity, cold, hot, aram.
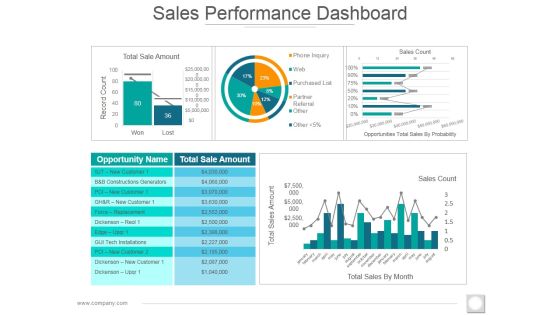
Sales Performance Dashboard Ppt PowerPoint Presentation Styles Images
This is a sales performance dashboard ppt powerpoint presentation styles images. This is a five stage process. The stages in this process are total sale amount, record count, sales count, total sales amount, total sales by month.
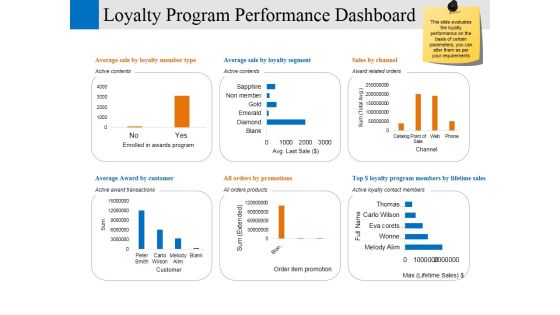
Loyalty Program Performance Dashboard Ppt PowerPoint Presentation Professional Model
This is a loyalty program performance dashboard ppt powerpoint presentation professional model. This is a six stage process. The stages in this process are enrolled in awards program, customer, order item promotion, channel, business.
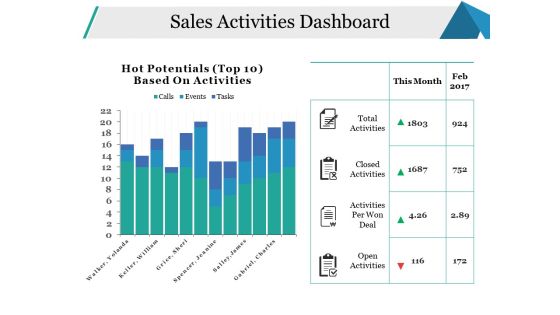
Sales Activities Dashboard Ppt PowerPoint Presentation Pictures Model
This is a sales activities dashboard ppt powerpoint presentation pictures model. This is a two stage process. The stages in this process are open activities, activities per won deal, closed activities, total activities, business.
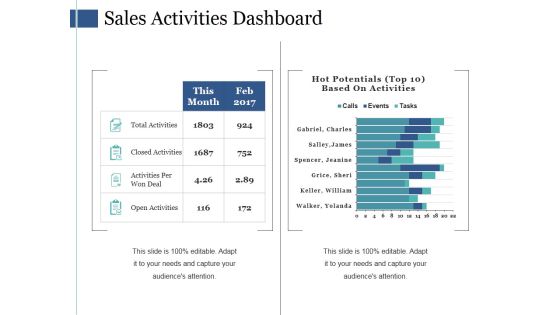
Sales Activities Dashboard Ppt PowerPoint Presentation Ideas Themes
This is a sales activities dashboard ppt powerpoint presentation ideas themes. This is a two stage process. The stages in this process are total activities, closed activities, activities per won deal, open activities.
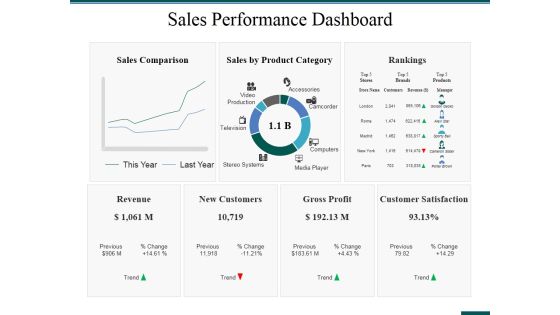
Sales Performance Dashboard Ppt PowerPoint Presentation Ideas Format Ideas
This is a sales performance dashboard ppt powerpoint presentation ideas format ideas. This is a three stage process. The stages in this process are rankings, revenue, new customers, gross profit, customer satisfaction.

Project Dashboard Ppt PowerPoint Presentation Ideas Graphic Tips
This is a project dashboard ppt powerpoint presentation ideas graphic tips. This is a one stage process. The stages in this process are business, marketing, objective, main focus, issues risks, key discussion items.

Sales Activities Dashboard Ppt PowerPoint Presentation Show Skills
This is a sales activities dashboard ppt powerpoint presentation show skills. This is a four stage process. The stages in this process are total activities, closed activities, activities per won deal, open activities, this month.
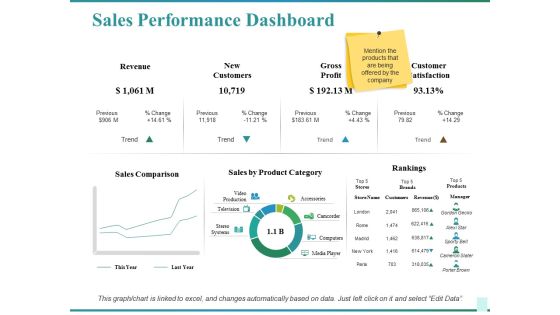
Sales Performance Dashboard Ppt PowerPoint Presentation Show Graphics Design
This is a sales performance dashboard ppt powerpoint presentation show graphics design. This is a two stage process. The stages in this process are sales comparison, sales by product category, rankings, customer satisfaction, revenue.

Sales Performance Dashboard Template Ppt PowerPoint Presentation Professional Elements
This is a sales performance dashboard template ppt powerpoint presentation professional elements. This is a eight stage process. The stages in this process are sales comparison, sales by product category, sales by month, brand profitability, revenue.
Project Management Dashboard Testing Ppt PowerPoint Presentation Icon File Formats
This is a project management dashboard testing ppt powerpoint presentation icon file formats. This is a three stage process. The stages in this process are business, management, marketing, percentage.
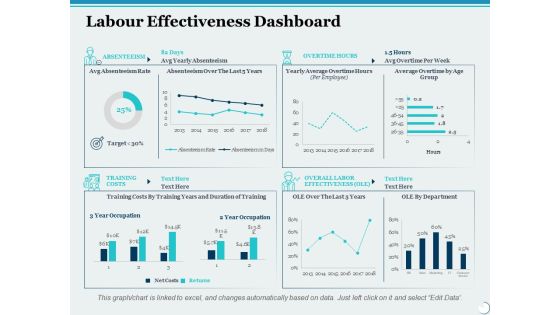
Labour Effectiveness Dashboard Ppt PowerPoint Presentation Slides File Formats
This is a labour effectiveness dashboard ppt powerpoint presentation slides file formats. This is a four stage process. The stages in this process are percentage, product, management, marketing, business.
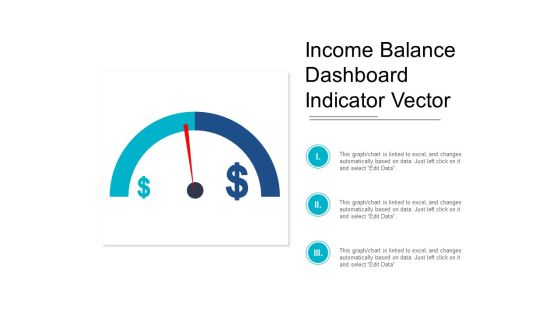
Income Balance Dashboard Indicator Vector Ppt PowerPoint Presentation Professional Diagrams
This is a income balance dashboard indicator vector ppt powerpoint presentation professional diagrams. This is a three stage process. The stages in this process are growth, increase sales, increase revenue.
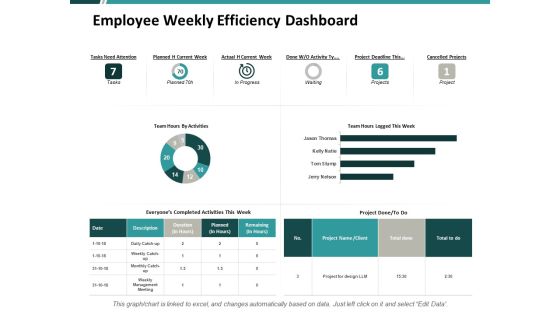
Employee Weekly Efficiency Dashboard Ppt PowerPoint Presentation Portfolio Show
This is a employee weekly efficiency dashboard ppt powerpoint presentation portfolio show. This is a three stage process. The stages in this process are financial, minimum, maximum, marketing, strategy.

Project Budget Planning Dashboard With Income Statement Breakdown Professional PDF
This slide covers a dashboard which will help project managers for taking financial business decision by examining the income statement, income statement breakdown, cash flow and internal rate of return. Pitch your topic with ease and precision using this project budget planning dashboard with income statement breakdown professional pdf. This layout presents information on income statement, income statement breakdown, cash flow, internal rate of return . It is also available for immediate download and adjustment. So, changes can be made in the color, design, graphics or any other component to create a unique layout.

Datafy Performance Tracking Dashboard For E-Commerce Website Information PDF
This slide represents the performance tracking dashboard for an e-commerce website by covering the details of visitors and return visitors, total customers and products, the top three products and product categories, and average visit duration and purchase per visit. The best PPT templates are a great way to save time, energy, and resources. Slidegeeks have percent editable powerpoint slides making them incredibly versatile. With these quality presentation templates, you can create a captivating and memorable presentation by combining visually appealing slides and effectively communicating your message. Download Datafy Performance Tracking Dashboard For E-Commerce Website Information PDF from Slidegeeks and deliver a wonderful presentation.
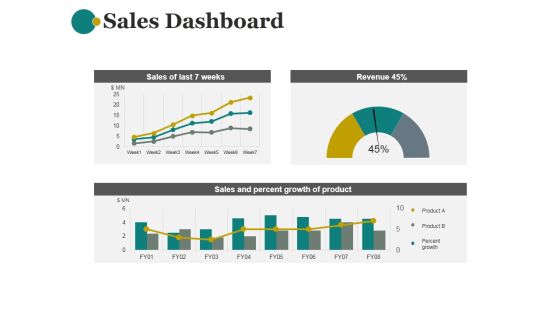
Sales Dashboard Template 1 Ppt PowerPoint Presentation Show
This is a sales dashboard template 1 ppt powerpoint presentation show. This is a three stage process. The stages in this process are sales of last 7 weeks, revenue, sales and percent growth of product.

Sales Dashboard Template 2 Ppt PowerPoint Presentation Examples
This is a sales dashboard template 2 ppt powerpoint presentation examples. This is a four stage process. The stages in this process are sales distribution, win loss ratio, lead sources revenue share, total sales by month.

Crm Dashboard Opportunity By Rating Ppt PowerPoint Presentation Model
This is a crm dashboard opportunity by rating ppt powerpoint presentation model. This is a three stage process. The stages in this process are open opportunity, cold, hot, warm.

Monthly Social Media Dashboard Ppt PowerPoint Presentation Gallery Templates
This is a monthly social media dashboard ppt powerpoint presentation gallery templates. This is a four stage process. The stages in this process are facebook, twitter, google, pinterest, you tube.

Crm Dashboard Template Ppt PowerPoint Presentation Gallery Shapes
This is a crm dashboard template ppt powerpoint presentation gallery shapes. This is a four stage process. The stages in this process are open tickets, closed tickets, new orders, new clients.

Dashboard For Innovative Product Concept Performance In Market Formats PDF
This slide represents dashboard for innovative product performance in market. It includes usage intention, willingness to pay, purchase intention etc. Pitch your topic with ease and precision using this Dashboard For Innovative Product Concept Performance In Market Formats PDF This layout presents information on Usage Intention, Willingess To Pay, Purchase Intention . It is also available for immediate download and adjustment. So, changes can be made in the color, design, graphics or any other component to create a unique layout.

Investment Crowdfunding Dashboard With Capital Raising Pitch Status Sample PDF
The following slide exhibits equity crowdfunding dashboard which can be used by business startups to check their capital raising pitch status. It includes information about investment, inventors, opportunities, live, valuation, target, raised, time left, etc.Presenting Investment Crowdfunding Dashboard With Capital Raising Pitch Status Sample PDF to dispense important information. This template comprises three stages. It also presents valuable insights into the topics including Total Investments, Total Investors, Current Opportunities. This is a completely customizable PowerPoint theme that can be put to use immediately. So, download it and address the topic impactfully.

Customer Retention Dashboard For CNN E Commerce Company Ideas PDF
The slide shows the Customer Retention Rate dashboard in order to measure variables such as churn rate, net customer gained, net promotor score, retention rate etc. Deliver and pitch your topic in the best possible manner with this customer retention dashboard for CNN e commerce company ideas pdf. Use them to share invaluable insights on net promoter score, current month to date, current month to date, customer retention rate and impress your audience. This template can be altered and modified as per your expectations. So, grab it now.
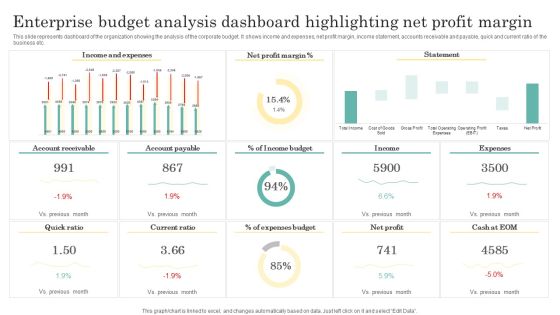
Enterprise Budget Analysis Dashboard Highlighting Net Profit Margin Clipart PDF
This slide represents dashboard of the organization showing the analysis of the corporate budget. It shows income and expenses, net profit margin, income statement, accounts receivable and payable, quick and current ratio of the business etc. Showcasing this set of slides titled Enterprise Budget Analysis Dashboard Highlighting Net Profit Margin Clipart PDF. The topics addressed in these templates are Income And Expenses, Net Profit Margin, Income Budget. All the content presented in this PPT design is completely editable. Download it and make adjustments in color, background, font etc. as per your unique business setting.

Logistics KPI Metrics And Analytics Dashboard Ppt Slides Images PDF
Persuade your audience using this Logistics KPI Metrics And Analytics Dashboard Ppt Slides Images PDF. This PPT design covers four stages, thus making it a great tool to use. It also caters to a variety of topics including Logistics KPI, Metrics And Analytics, Dashboard. Download this PPT design now to present a convincing pitch that not only emphasizes the topic but also showcases your presentation skills.

Dashboard For Monitoring And Corporate Financial Statement Budgets Template PDF
This slide brings forth dashboard for monitoring and reporting the financial budgets of various branches of an enterprise emphasis on income and expenditure by each branch. The key performing indicators are actual vs budgeted revenue, revenue distribution by branches etc. Showcasing this set of slides titled Dashboard For Monitoring And Corporate Financial Statement Budgets Template PDF. The topics addressed in these templates are Revenue Distribution, Revenue Source, Revenue Expenses. All the content presented in this PPT design is completely editable. Download it and make adjustments in color, background, font etc. as per your unique business setting.
Scrum Master Dashboard For Project Management Priority Icons PDF
This slide provides information regarding scrum master dashboard for project management to track overall project progress. Deliver an awe-inspiring pitch with this creative scrum master dashboard for project management priority icons pdf bundle. Topics like projects, key resources, marketing sight, sales pipeline, forecast can be discussed with this completely editable template. It is available for immediate download depending on the needs and requirements of the user.
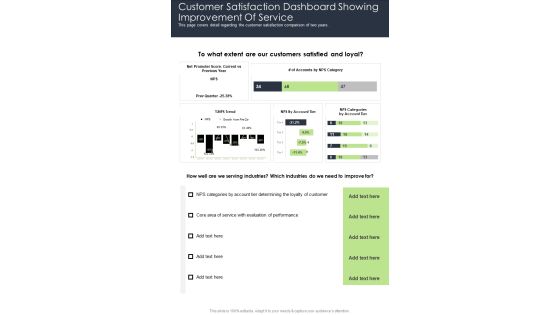
Customer Satisfaction Dashboard Showing Improvement Of Service One Pager Documents
This page covers detail regarding the customer satisfaction comparison of two years. Presenting you a fantastic Customer Satisfaction Dashboard Showing Improvement Of Service One Pager Documents. This piece is crafted on hours of research and professional design efforts to ensure you have the best resource. It is completely editable and its design allow you to rehash its elements to suit your needs. Get this Customer Satisfaction Dashboard Showing Improvement Of Service One Pager Documents A4 One-pager now.

Project Expenses Dashboard With Yearly Billing Pictures PDF
Showcasing this set of slides titled Project Expenses Dashboard With Yearly Billing Pictures PDF. The topics addressed in these templates are Project Billing By Year, Budget Wise Projects. All the content presented in this PPT design is completely editable. Download it and make adjustments in color, background, font etc. as per your unique business setting.
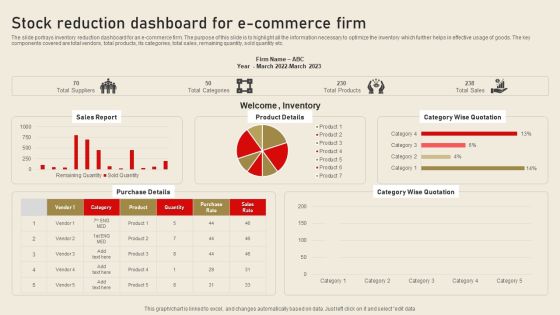
Stock Reduction Dashboard For E Commerce Firm Ideas PDF
The slide portrays inventory reduction dashboard for an e commerce firm. The purpose of this slide is to highlight all the information necessary to optimize the inventory which further helps in effective usage of goods. The key components covered are total vendors, total products, its categories, total sales, remaining quantity, sold quantity etc. Showcasing this set of slides titled Stock Reduction Dashboard For E Commerce Firm Ideas PDF. The topics addressed in these templates are Sales Report, Product Details, Category Wise Quotation. All the content presented in this PPT design is completely editable. Download it and make adjustments in color, background, font etc. as per your unique business setting.

Customer Retention Dashboard For CNN E Commerce Company Brochure PDF
The slide shows the Customer Retention Rate dashboard in order to measure variables such as churn rate, net customer gained, net promotor score, retention rate etc. Deliver and pitch your topic in the best possible manner with this customer retention dashboard for CNN e commerce company brochure pdf. Use them to share invaluable insights on net promoter score, current month to date, current month to date, customer retention rate and impress your audience. This template can be altered and modified as per your expectations. So, grab it now.

Customer Retention Dashboard For CNN E Commerce Company Sample PDF
The slide shows the Customer Retention Rate dashboard in order to measure variables such as churn rate, net customer gained, net promotor score, retention rate etc. Deliver and pitch your topic in the best possible manner with this customer retention dashboard for CNN e commerce company sample pdf. Use them to share invaluable insights on customer retention rate, net customers gained this month, net promoter score and impress your audience. This template can be altered and modified as per your expectations. So, grab it now.

E Commerce Project Planning And Revenue Management Dashboard Introduction PDF
The following slide highlights the ecommerce project planning and revenue management dashboard illustrating key headings which includes product and marketing channel plan, revenue and conversion rate by product, revenue by channel, conversion rate by channel and revenue by state. Showcasing this set of slides titled E Commerce Project Planning And Revenue Management Dashboard Introduction PDF. The topics addressed in these templates are New Customers, Ecommerce Revenue, Repeat Purchase Rate. All the content presented in this PPT design is completely editable. Download it and make adjustments in color, background, font etc. as per your unique business setting.

Company Payout Dashboard Evaluation For E Commerce Business Background PDF
The slide illustrates a dashboard to assess business transactions and comparing it with last year. Various LPIs involved are percent change in no. of payments, payment modes, recent customers and monthly payments. Showcasing this set of slides titled Company Payout Dashboard Evaluation For E Commerce Business Background PDF. The topics addressed in these templates are Payment Modes, Recent Customers, Monthly Payments. All the content presented in this PPT design is completely editable. Download it and make adjustments in color, background, font etc. as per your unique business setting.
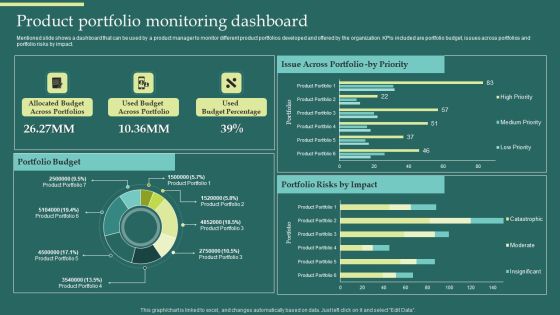
Product Portfolios And Strategic Product Portfolio Monitoring Dashboard Introduction PDF
Mentioned slide shows a dashboard that can be used by a product manager to monitor different product portfolios developed and offered by the organization. KPIs included are portfolio budget, issues across portfolios and portfolio risks by impact. Explore a selection of the finest Product Portfolios And Strategic Product Portfolio Monitoring Dashboard Introduction PDF here. With a plethora of professionally designed and pre-made slide templates, you can quickly and easily find the right one for your upcoming presentation. You can use our Product Portfolios And Strategic Product Portfolio Monitoring Dashboard Introduction PDF to effectively convey your message to a wider audience. Slidegeeks has done a lot of research before preparing these presentation templates. The content can be personalized and the slides are highly editable. Grab templates today from Slidegeeks.

Diversified Profitable Portfolio Dashboard Showcasing Portfolio Investment Performance Guidelines PDF
Deliver and pitch your topic in the best possible manner with this Diversified Profitable Portfolio Dashboard Showcasing Portfolio Investment Performance Guidelines PDF. Use them to share invaluable insights on Rider Survey, Community Survey, Tasks By Project and impress your audience. This template can be altered and modified as per your expectations. So, grab it now.
Organizational Plan Overview Corporate Financial Performance Tracking Dashboard Icons PDF
This slide provides information regarding dashboard utilized by firm to monitor financial performance. The performance is tracked through revenues generated, vendors associated, profit generated, etc. Here you can discover an assortment of the finest PowerPoint and Google Slides templates. With these templates, you can create presentations for a variety of purposes while simultaneously providing your audience with an eye-catching visual experience. Download Organizational Plan Overview Corporate Financial Performance Tracking Dashboard Icons PDF to deliver an impeccable presentation. These templates will make your job of preparing presentations much quicker, yet still, maintain a high level of quality. Slidegeeks has experienced researchers who prepare these templates and write high-quality content for you. Later on, you can personalize the content by editing the Organizational Plan Overview Corporate Financial Performance Tracking Dashboard Icons PDF.

Project Metrics Dashboard With Budget Allocation Portrait PDF
This slide focuses on the project management dashboard which covers the description of tasks which are not yet started, work in progress, completed, projects that are on hold, cancelled with the issues and its status such as requested, approved, planning, in progress, etc. Showcasing this set of slides titled Project Metrics Dashboard With Budget Allocation Portrait PDF. The topics addressed in these templates are Projects, Resource, Allocated Budget. All the content presented in this PPT design is completely editable. Download it and make adjustments in color, background, font etc. as per your unique business setting.

Share Market Dashboard Highlighting Price Moving Average Trend Themes PDF
Following slide outlines stock market dashboard of an industry. The various metrics highlighted in the slide are stock codes, previous day price of stock, percent of price change, maximum and lowest price of stock, moving average trend etc. Pitch your topic with ease and precision using this Share Market Dashboard Highlighting Price Moving Average Trend Themes PDF. This layout presents information on Moving Average, Stock Price, Performing Stocks. It is also available for immediate download and adjustment. So, changes can be made in the color, design, graphics or any other component to create a unique layout.

Product Management Project Performance With Workload KPI Dashboard Structure PDF
This slide provides dashboard showcasing product development project performance progress which helps managers identify areas of improvement. It provides information such as project budget overview, issue breakdown, workload management and hour spent on project. Pitch your topic with ease and precision using this Product Management Project Performance With Workload KPI Dashboard Structure PDF. This layout presents information on Project Budget Overview, Workload Management. It is also available for immediate download and adjustment. So, changes can be made in the color, design, graphics or any other component to create a unique layout.

Agile Human Resource Transformation KPI Dashboard Microsoft PDF
This slide highlights the impact of agile HR transformation to analyze the key performing areas. The dashboard includes key metrics showcasing employee headcount, diversity, hiring status, leave days and the termination data. Showcasing this set of slides titled Agile Human Resource Transformation KPI Dashboard Microsoft PDF. The topics addressed in these templates are Employees, Diversity, Hiring, Leave Days, Termination. All the content presented in this PPT design is completely editable. Download it and make adjustments in color, background, font etc. as per your unique business setting.

Resource Planning Management Dashboard With Effective Utilization Mockup PDF
This slide shows the resourcing plan dashboard which focuses on the over and under utilization, trend by team, data by team which includes resource and utilization time of software developer, web designer and project manager. Pitch your topic with ease and precision using this Resource Planning Management Dashboard With Effective Utilization Mockup PDF. This layout presents information on Web Designer, Software Developer, Team. It is also available for immediate download and adjustment. So, changes can be made in the color, design, graphics or any other component to create a unique layout.

 Home
Home