AI PPT Maker
Templates
PPT Bundles
Design Services
Business PPTs
Business Plan
Management
Strategy
Introduction PPT
Roadmap
Self Introduction
Timelines
Process
Marketing
Agenda
Technology
Medical
Startup Business Plan
Cyber Security
Dashboards
SWOT
Proposals
Education
Pitch Deck
Digital Marketing
KPIs
Project Management
Product Management
Artificial Intelligence
Target Market
Communication
Supply Chain
Google Slides
Research Services
 One Pagers
All Categories
-
Home
- Customer Favorites
- Cost Dashboard
Cost Dashboard
Post Engagement Data From Social Platforms Data Analysis Template PDF
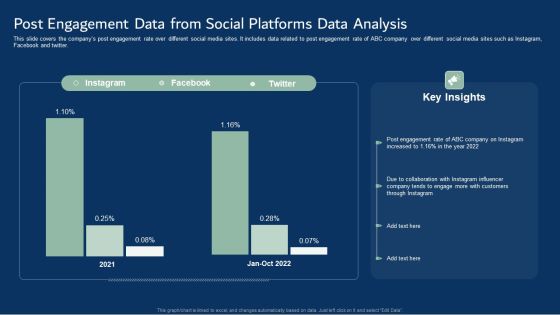
This slide covers the companys post engagement rate over different social media sites. It includes data related to post engagement rate of ABC company over different social media sites such as Instagram, Facebook and twitter. Pitch your topic with ease and precision using this Post Engagement Data From Social Platforms Data Analysis Template PDF. This layout presents information on Post Engagement Data, Social Platforms Data Analysis. It is also available for immediate download and adjustment. So, changes can be made in the color, design, graphics or any other component to create a unique layout.
Magnifying Glass Marketing Guide For Segmentation Targeting And Positioning To Enhance Promotional Strategy Formats PDF
Slidegeeks is one of the best resources for PowerPoint templates. You can download easily and regulate Magnifying Glass Marketing Guide For Segmentation Targeting And Positioning To Enhance Promotional Strategy Formats PDF for your personal presentations from our wonderful collection. A few clicks is all it takes to discover and get the most relevant and appropriate templates. Use our Templates to add a unique zing and appeal to your presentation and meetings. All the slides are easy to edit and you can use them even for advertisement purposes.
Digital Trends In Customer Finance Market Template PDF
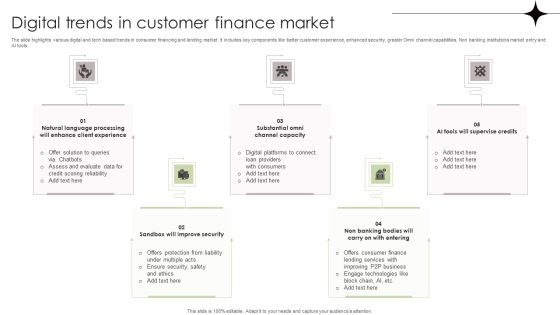
The slide highlights various digital and tech based trends in consumer financing and lending market. It includes key components like better customer experience, enhanced security, greater Omni channel capabilities, Non banking institutions market entry and AI tools. Persuade your audience using this Digital Trends In Customer Finance Market Template PDF. This PPT design covers five stages, thus making it a great tool to use. It also caters to a variety of topics including Evaluate Data, Ensure Security, Lending Services. Download this PPT design now to present a convincing pitch that not only emphasizes the topic but also showcases your presentation skills.

Omnichannel Services Solution In Financial Sector Checklists For Omnichannel Banking Service Attributes Brochure PDF
This slide covers key features of omnichannel banking services. The purpose of this template is to differentiate omnichannel banking services from various financial activities. It includes attributes such as importance of customer experience, real time data synchronization, use of data analytics, utilization of big data, etc. Do you have an important presentation coming up Are you looking for something that will make your presentation stand out from the rest Look no further than Omnichannel Services Solution In Financial Sector Checklists For Omnichannel Banking Service Attributes Brochure PDF. With our professional designs, you can trust that your presentation will pop and make delivering it a smooth process. And with Slidegeeks, you can trust that your presentation will be unique and memorable. So why wait Grab Omnichannel Services Solution In Financial Sector Checklists For Omnichannel Banking Service Attributes Brochure PDF today and make your presentation stand out from the rest.

Business Diagram Human Mind Diagram With Pie Graph For Representation PowerPoint Slide
This diagram displays human face graphic divided into sections. This section can be used for data display. Use this diagram to build professional presentations for your viewers.

Business Diagram Six Staged Pie Charts For Text Representation PowerPoint Slide
This slide displays graphic six staged pie charts. Download this diagram to present and compare business data. Use this diagram to display business process workflows in any presentation.
Business Diagram Three Text Boxes For Timer For Time Management PowerPoint Slide
This business diagram displays three text boxes. This diagram contains text boxes for data representation. Use this diagram to display business process workflows in any presentations.
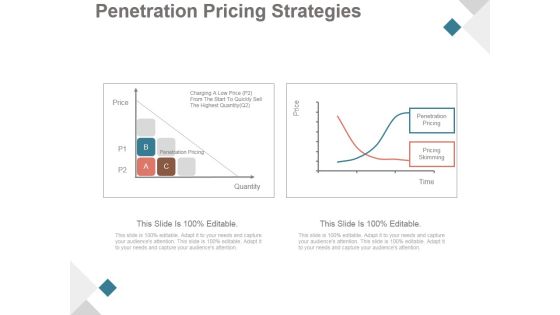
Penetration Pricing Strategies Ppt PowerPoint Presentation Slide
This is a penetration pricing strategies ppt powerpoint presentation slide. This is a two stage process. The stages in this process are penetration pricing, pricing skimming, quantity, price.

Data Discovery Market Expansion Trends Microsoft PDF
This slide shows data discovery market growth trends for highlighting future figures and importance of data discovery. It includes market size, regional wise distribution and key market players etc. Showcasing this set of slides titled Data Discovery Market Expansion Trends Microsoft PDF. The topics addressed in these templates are Market Size, Key Market Players, Market Distribution. All the content presented in this PPT design is completely editable. Download it and make adjustments in color, background, font etc. as per your unique business setting.
Statistical Data For Identity Fraud Reports Icons PDF
This slide showcases identity thefts and frauds complaints in various years. This template focuses on providing layers of protection to customers digital identities and reduce risk of financial loss. It includes information related to consumer complainants, etc. Showcasing this set of slides titled Statistical Data For Identity Fraud Reports Icons PDF. The topics addressed in these templates are Poor Management Information, Lack Of Transparency, Protected Accounts. All the content presented in this PPT design is completely editable. Download it and make adjustments in color, background, font etc. as per your unique business setting.

Price Analysis Diagram For Analysis In Financial Data Ppt Infographics Summary PDF
Showcasing this set of slides titled price analysis diagram for analysis in financial data ppt infographics summary pdf. The topics addressed in these templates are price analysis diagram for analysis in financial data. All the content presented in this PPT design is completely editable. Download it and make adjustments in color, background, font etc. as per your unique business setting.
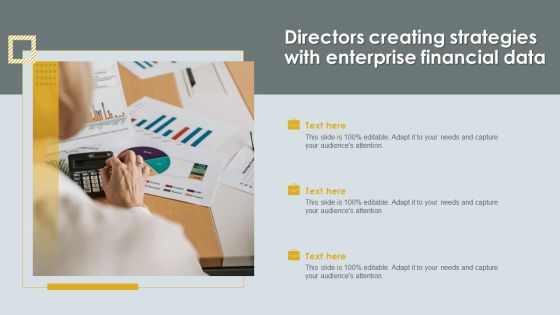
Directors Creating Strategies With Enterprise Financial Data Slides PDF
Presenting Directors Creating Strategies With Enterprise Financial Data Slides PDF to dispense important information. This template comprises Three stages. It also presents valuable insights into the topics including Directors Creating Strategies, Enterprise Financial Data. This is a completely customizable PowerPoint theme that can be put to use immediately. So, download it and address the topic impactfully.
Latest Facts About Data In Financial Services Icon Professional PDF
Pitch your topic with ease and precision using this Latest Facts About Data In Financial Services Icon Professional PDF. This layout presents information on Latest Facts About Data, Financial Services. It is also available for immediate download and adjustment. So, changes can be made in the color, design, graphics or any other component to create a unique layout.

Information Analysis Role In Demand And Supply For Banking Sector Ppt Model Example PDF
This slide showcase data analytics use for analyzing investment demand and supply for banking sector for optimize use if credit generation. It includes risk that are associated with investment flow, demand for investment and supply. Persuade your audience using this Information Analysis Role In Demand And Supply For Banking Sector Ppt Model Example PDF. This PPT design covers three stages, thus making it a great tool to use. It also caters to a variety of topics including Risk, Supply, Demand. Download this PPT design now to present a convincing pitch that not only emphasizes the topic but also showcases your presentation skills.
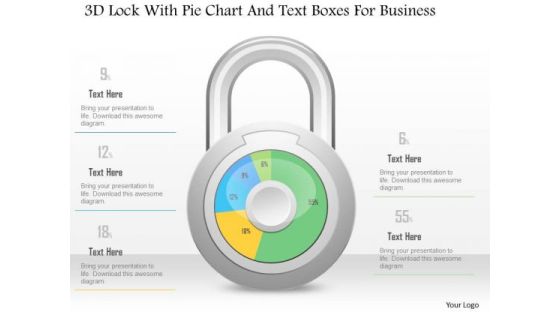
Business Diagram 3d Lock With Pie Chart And Text Boxes For Business PowerPoint Slide
This Power Point diagram has been crafted with pie chart in shape of lock. It contains diagram of lock pie chart to compare and present data in an effective manner. Use this diagram to build professional presentations for your viewers.

Business Diagram 3d Lock With Pie Graph For Result Representation PowerPoint Slide
This Power Point diagram has been crafted with pie chart in shape of lock. It contains diagram of lock pie chart to compare and present data in an effective manner. Use this diagram to build professional presentations for your viewers.

Business Diagram 3d Pencil With Text Boxes For Representation PowerPoint Slide
This Power Point diagram displays graphic of pencil with icons and text spaces. It contains diagram of colorful pencil for data display. Use this diagram to build professional presentations for your viewers.
Business Diagram Human Icons With Bubbles And Different Icons Inside PowerPoint Slide
This diagram displays graph with percentage value growth. This business slide is suitable to present and compare business data. Use this diagram to build professional presentations for your viewers.

Business Diagram Three Staged Pencil Diagram For Graph Formation PowerPoint Slide
This business diagram displays set of pencils. This Power Point template has been designed to compare and present business data. Download this diagram to represent stages of business growth.
Kpis For Tracking Fleet Information Effectively Icons PDF
This slide showcases factors which fleet data needs to keep track of. This template focuses on increasing uptime and improving conditions for their mobile workforce. It includes information related to vehicle performance, safety behaviour, etc. Persuade your audience using this Kpis For Tracking Fleet Information Effectively Icons PDF. This PPT design covers four stages, thus making it a great tool to use. It also caters to a variety of topics including Predictive Safety Behavior, Vehicle Performance, Inspection Maintenance. Download this PPT design now to present a convincing pitch that not only emphasizes the topic but also showcases your presentation skills.

Ppt Homogenous Way To Avoid Development Losses Four Steps PowerPoint Templates
PPT homogenous way to avoid development losses four steps PowerPoint Templates-The theme of this PowerPoint template is linear arrows. Use them to illustrate a stepwise process or a phase structure. You can easily change its colors-PPT homogenous way to avoid development losses four steps PowerPoint Templates-Arrow, Bank, Benefit, Business, Calculate, Calculation, Capitalist, Communication, Company, Concern, Connection, Data, Diagram, Digital, Drawing, Earnings, Economic, Finance, Financial, Flow, Forecast, Gain, Goal, Graph, Growth, Illustration, Increase, Information, Interest, Investing, Management, Market, Money, Move, Network, Objective, Plan, Process, Profit, Progress, Report, Rise, Risk, Shares, Statistics, Stock, System, Technology

Intelligence Amplification IA IT Augmented Intelligence In Finance And Financial Services Structure PDF
This slide depicts the usage of augmented intelligence in finance and financial services to provide better solutions to the clients problems. It also cates to the indulgence of institutions in trends for the correct demography, optimizing budgets, and gaining more market share. The Intelligence Amplification IA IT Augmented Intelligence In Finance And Financial Services Structure PDF is a compilation of the most recent design trends as a series of slides. It is suitable for any subject or industry presentation, containing attractive visuals and photo spots for businesses to clearly express their messages. This template contains a variety of slides for the user to input data, such as structures to contrast two elements, bullet points, and slides for written information. Slidegeeks is prepared to create an impression.

Business Framework Economic Value Add PowerPoint Presentation
This image slide displays business framework for economic value added diagram. This image slide may be used in your presentations to depict firms economic profits and business financial reports. You may change color, size and orientation of any icon to your liking. Create professional presentations using this image slide.

Key Metrics To Measure Current Performance Of Ecommerce Website Clipart PDF
This slide represents the key performance indicators to track and monitor the performance of ecommerce website to draw effective strategies to tackle the problems. It includes key metrics for ecommerce website performance measurement such as average order value and shopping cart abandonment rate.The best PPT templates are a great way to save time, energy, and resources. Slidegeeks have 100precent editable powerpoint slides making them incredibly versatile. With these quality presentation templates, you can create a captivating and memorable presentation by combining visually appealing slides and effectively communicating your message. Download Key Metrics To Measure Current Performance Of Ecommerce Website Clipart PDF from Slidegeeks and deliver a wonderful presentation.
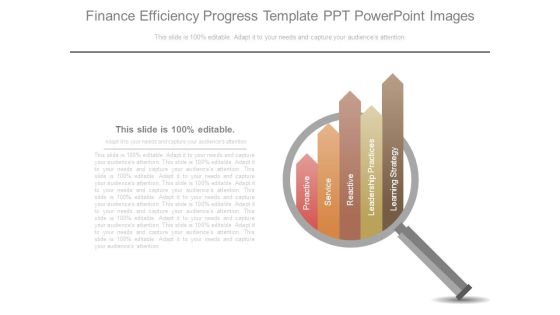
Finance Efficiency Progress Template Ppt Powerpoint Images
This is a finance efficiency progress template ppt powerpoint images. This is a five stage process. The stages in this process are proactive, service, reactive, leadership practices, learning strategy.
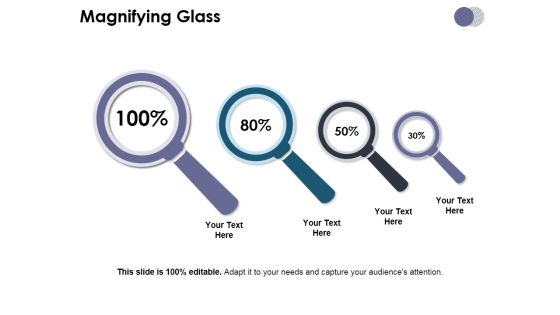
Magnifying Glass Ppt PowerPoint Presentation Professional Backgrounds
This is a magnifying glass ppt powerpoint presentation professional backgrounds. This is a four stage process. The stages in this process are magnifying glass, search, marketing, strategy, business.
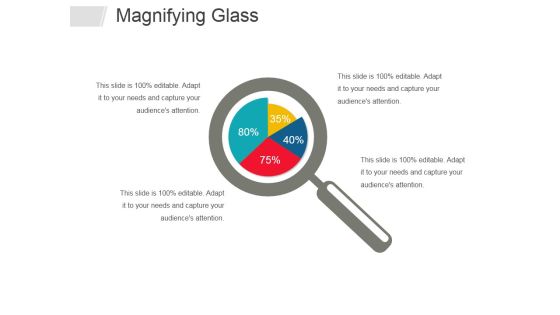
Magnifying Glass Ppt PowerPoint Presentation Infographics Slide Portrait
This is a magnifying glass ppt powerpoint presentation infographics slide portrait. This is a four stage process. The stages in this process are magnifying glass, management, marketing, business, percentage.

Development Procedure To Summarize Expense Information Ppt Layouts Sample PDF
The following slide showcases budget development process to summarize data. The steps include revenue transferred, budget analysis, data compilation and budget presented for approval. Persuade your audience using this Development Procedure To Summarize Expense Information Ppt Layouts Sample PDF. This PPT design covers five stages, thus making it a great tool to use. It also caters to a variety of topics including Revenue Transfer, Budget Analysis, Data Compilation. Download this PPT design now to present a convincing pitch that not only emphasizes the topic but also showcases your presentation skills.
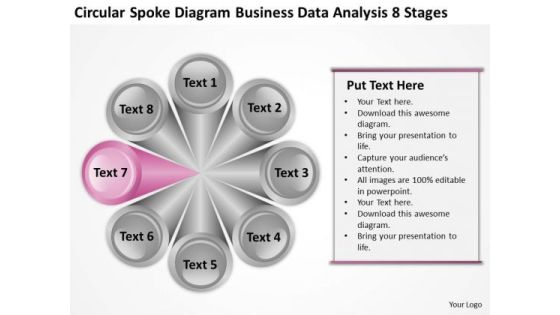
Spoke Diagram Business Data Analysis 8 Stages Plan PowerPoint Templates
We present our spoke diagram business data analysis 8 stages plan PowerPoint templates.Present our Finance PowerPoint Templates because You can Double your output with our PowerPoint Templates and Slides. They make beating deadlines a piece of cake. Download our Leadership PowerPoint Templates because Our PowerPoint Templates and Slides are aesthetically designed to attract attention. We gaurantee that they will grab all the eyeballs you need. Download our Circle Charts PowerPoint Templates because Our PowerPoint Templates and Slides will let your words and thoughts hit bullseye everytime. Use our Business PowerPoint Templates because It will mark the footprints of your journey. Illustrate how they will lead you to your desired destination. Use our Process and Flows PowerPoint Templates because Our PowerPoint Templates and Slides offer you the widest possible range of options.Use these PowerPoint slides for presentations relating to Chart, segmented, pie, hub, wheel, isolated, divided, business, communication, diagram, circle, graphic, process, element, tire, graph, marketing, illustration, icon, circular, round, clipart, design, success, set, spoke, button. The prominent colors used in the PowerPoint template are Purple, White, Gray.

Strategic B2B Marketing Plan Technological Investment Priorities To Achieve Marketing Goals Inspiration PDF
This slide shows the bar graph that represents the priorities of company for making investments in technology such as automation system, data management platform, etc.Deliver an awe inspiring pitch with this creative strategic b2b marketing plan technological investment priorities to achieve marketing goals inspiration pdf bundle. Topics like measurement and analytics, marketing automation platform, data management platform can be discussed with this completely editable template. It is available for immediate download depending on the needs and requirements of the user.
Safety And Health Kpis For Tracking Performance Graph Mockup PDF
This slide represents graph showing key performance indicators tracked by companies for assessment of safety and health performance of their workplace. It includes key metrics such as workforce awareness, safety meetings held, recordable injuries, lost work days, compliance, severity rates etc. Pitch your topic with ease and precision using this Safety And Health Kpis For Tracking Performance Graph Mockup PDF. This layout presents information on Safety And Health, Kpis For Tracking, Performance Graph. It is also available for immediate download and adjustment. So, changes can be made in the color, design, graphics or any other component to create a unique layout.

Data Analytics Management Impacts Of Big Data Management On Business Processes Sample PDF
This slide represents the impacts of the big data deployment on the organization, and it shows the effect on decision making, decrease in expenses, customer service, and speed to market.Deliver and pitch your topic in the best possible manner with this Data Analytics Management Impacts Of Big Data Management On Business Processes Sample PDF. Use them to share invaluable insights on Advanced Analytics, Decrease Expenses, Customer Service and impress your audience. This template can be altered and modified as per your expectations. So, grab it now.
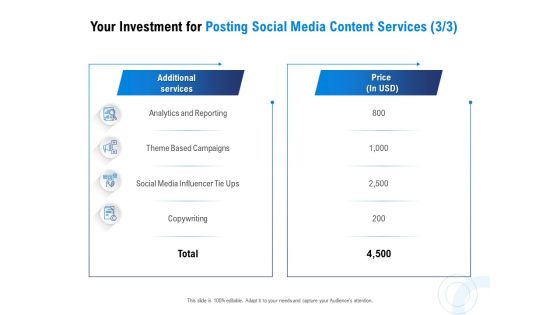
Posting Social Media Content Your Investment For Posting Social Media Content Services Price Rules PDF
Presenting this set of slides with name posting social media content your investment for posting social media content services price rules pdf. The topics discussed in these slides are analytics and reporting, theme based campaigns, social media influencer tie ups, price. This is a completely editable PowerPoint presentation and is available for immediate download. Download now and impress your audience.

Effectiveness Of Social Media Data Insights For Marketers Ideas PDF
The following slide depicts the effectiveness of social media insights for marketers. This data analysis helps them to formulate strategies, understand the target audience, evaluate campaign performance, assess ROI etc. Showcasing this set of slides titled Effectiveness Of Social Media Data Insights For Marketers Ideas PDF. The topics addressed in these templates are Effectiveness, Social Media, Marketers. All the content presented in this PPT design is completely editable. Download it and make adjustments in color, background, font etc. as per your unique business setting.

Strategic Market Insight Implementation Guide Product Yearly Sales Trend Analysis Sample Clipart PDF
The following slide showcases a graph of yearly sales for analyzing trends over different periods. It highlights components such as yearly product sales, data analysis and key reasons. Slidegeeks is one of the best resources for PowerPoint templates. You can download easily and regulate Strategic Market Insight Implementation Guide Product Yearly Sales Trend Analysis Sample Clipart PDF for your personal presentations from our wonderful collection. A few clicks is all it takes to discover and get the most relevant and appropriate templates. Use our Templates to add a unique zing and appeal to your presentation and meetings. All the slides are easy to edit and you can use them even for advertisement purposes.

Year Based Company Financial Highlights Ppt Images
This is a year based company financial highlights ppt images. This is a two stage process. The stages in this process are turnover, gross dividend per share, shareholders funds, paid up share capital.
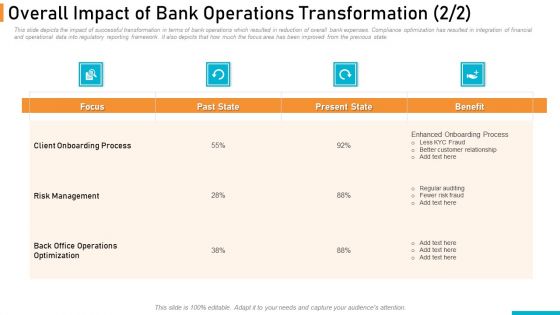
Executing Online Solution In Banking Overall Impact Of Bank Operations Transformation Benefit Designs PDF
This slide depicts the impact of successful transformation in terms of bank operations which resulted in reduction of overall bank expenses. Compliance optimization has resulted in integration of financial and operational data into regulatory reporting framework. It also depicts that how much the focus area has been improved from the previous state.Deliver and pitch your topic in the best possible manner with this executing online solution in banking overall impact of bank operations transformation benefit designs pdf. Use them to share invaluable insights on risk management, client onboarding process, back office operations optimization and impress your audience. This template can be altered and modified as per your expectations. So, grab it now.

Five Sections Circle For Various Business Divisions Ppt PowerPoint Presentation File Templates PDF
Presenting five sections circle for various business divisions ppt powerpoint presentation file templates pdf to dispense important information. This template comprises five stages. It also presents valuable insights into the topics including finance, management, technology. This is a completely customizable PowerPoint theme that can be put to use immediately. So, download it and address the topic impactfully.
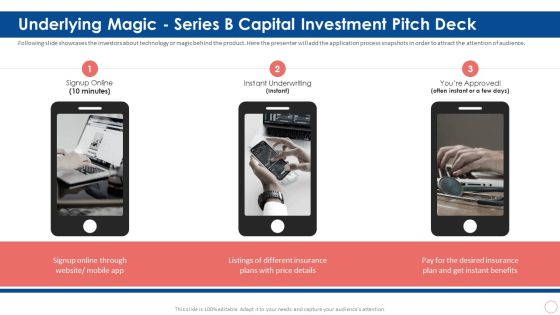
Underlying Magic Series B Capital Investment Pitch Deck Ppt Summary Graphics Template PDF
Following slide showcases the investors about technology or magic behind the product. Here the presenter will add the application process snapshots in order to attract the attention of audience. Presenting underlying magic series b capital investment pitch deck ppt summary graphics template pdf to provide visual cues and insights. Share and navigate important information on three stages that need your due attention. This template can be used to pitch topics like plans, price, insurance. In addtion, this PPT design contains high resolution images, graphics, etc, that are easily editable and available for immediate download.

Different Human Resource Automation Best Practices Themes PDF
This slide focuses on the different practices for human resource automation such as reduces error rates, motivates employees, simplifies complex workflows, maintains data security, focuses on employees needs and expectations, etc. Persuade your audience using this Different Human Resource Automation Best Practices Themes PDF. This PPT design covers four stages, thus making it a great tool to use. It also caters to a variety of topics including Reduces Error Rates, Motivates Employees, Maintaining Data Security. Download this PPT design now to present a convincing pitch that not only emphasizes the topic but also showcases your presentation skills.
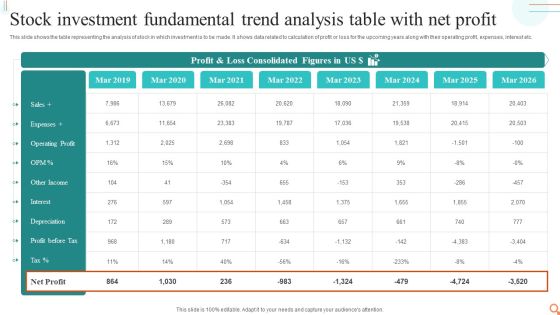
Stock Investment Fundamental Trend Analysis Table With Net Profit Sample PDF
This slide shows the table representing the analysis of stock in which investment is to be made. It shows data related to calculation of profit or loss for the upcoming years along with their operating profit, expenses, interest etc.Showcasing this set of slides titled Stock Investment Fundamental Trend Analysis Table With Net Profit Sample PDF. The topics addressed in these templates are Profit Loss, Consolidated Figures, Operating Profit. All the content presented in this PPT design is completely editable. Download it and make adjustments in color, background, font etc. as per your unique business setting.

Predictive Data Model Predictive Analytics In Banking And Finance Industry Introduction PDF
This slide represents the application of predictive analytics in the finance and banking sector as they deal with vast amounts of data. It helps these industries identify fraudulent transactions, generate credit score, monitor credit risks, and optimize cross-sell or up-sell possibilities. Retrieve professionally designed Predictive Data Model Predictive Analytics In Banking And Finance Industry Introduction PDF to effectively convey your message and captivate your listeners. Save time by selecting pre-made slideshows that are appropriate for various topics, from business to educational purposes. These themes come in many different styles, from creative to corporate, and all of them are easily adjustable and can be edited quickly. Access them as PowerPoint templates or as Google Slides themes. You do not have to go on a hunt for the perfect presentation because Slidegeeks got you covered from everywhere.
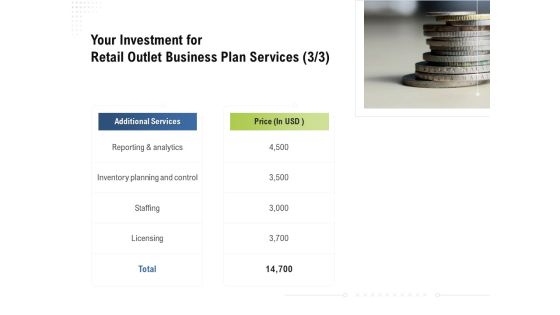
Strategic Plan Retail Store Your Investment For Retail Outlet Business Plan Services Price Brochure PDF
Presenting this set of slides with name strategic plan retail store your investment for retail outlet business plan services price brochure pdf. The topics discussed in these slides are reporting and analytics, inventory planning and control, staffing, licensing. This is a completely editable PowerPoint presentation and is available for immediate download. Download now and impress your audience.

Proof Concept Variety Shop Your Investment For Retail Store Opening Feasibility Study Services Price Themes PDF
Presenting this set of slides with name proof concept variety shop your investment for retail store opening feasibility study services price themes pdf. The topics discussed in these slides are reporting and analytics, inventory planning and control, staffing licensing. This is a completely editable PowerPoint presentation and is available for immediate download. Download now and impress your audience.

Bar Graph Icon For Data Analysis Ppt PowerPoint Presentation Pictures Ideas
This is a bar graph icon for data analysis ppt powerpoint presentation pictures ideas. This is a four stage process. The stages in this process are financial analysis, quantitative, statistical modelling.

Magnifying Glass Ppt PowerPoint Presentation Styles Layout Ideas
This is a magnifying glass ppt powerpoint presentation styles layout ideas. This is a four stage process. The stages in this process are magnifying glass, percentage, business, marketing.

Pie Chart Data Comparisons 5 Stages Business Plan Templates PowerPoint Slides
We present our pie chart data comparisons 5 stages business plan templates PowerPoint Slides.Present our Marketing PowerPoint Templates because Our PowerPoint Templates and Slides are Clear and concise. Use them and dispel any doubts your team may have. Present our Finance PowerPoint Templates because You can Create a matrix with our PowerPoint Templates and Slides. Feel the strength of your ideas click into place. Download our Business PowerPoint Templates because You can Inspire your team with our PowerPoint Templates and Slides. Let the force of your ideas flow into their minds. Present our Sales PowerPoint Templates because Our PowerPoint Templates and Slides are aesthetically designed to attract attention. We gaurantee that they will grab all the eyeballs you need. Present our Success PowerPoint Templates because Our PowerPoint Templates and Slides are specially created by a professional team with vast experience. They diligently strive to come up with the right vehicle for your brilliant Ideas. Use these PowerPoint slides for presentations relating to Analysis, Analyzing, Brands, Business, Chart, Colorful, Commerce, Compare, Comparison, Data, Economical, Finance, Financial, Grow, Growth, Market, Market Share, Marketing, Measure, Pen, Pie, Pie Chart, Presentation, Profit, Revenue, Sales, Sales Chat, Sales Increase, Share, Statistical, Success, Successful. The prominent colors used in the PowerPoint template are Blue, Gray, White.

Pie Chart Data Comparisons 5 Stages Examples Small Business Plans PowerPoint Slides
We present our pie chart data comparisons 5 stages examples small business plans PowerPoint Slides.Download our Marketing PowerPoint Templates because you can Set pulses racing with our PowerPoint Templates and Slides. They will raise the expectations of your team. Present our Finance PowerPoint Templates because Our PowerPoint Templates and Slides are the chords of your song. String them along and provide the lilt to your views. Download and present our Business PowerPoint Templates because It will Raise the bar of your Thoughts. They are programmed to take you to the next level. Download our Sales PowerPoint Templates because Our PowerPoint Templates and Slides will fulfill your every need. Use them and effectively satisfy the desires of your audience. Present our Success PowerPoint Templates because You can Be the puppeteer with our PowerPoint Templates and Slides as your strings. Lead your team through the steps of your script.Use these PowerPoint slides for presentations relating to Analysis, Analyzing, Brands, Business, Chart, Colorful, Commerce, Compare, Comparison, Data, Economical, Finance, Financial, Grow, Growth, Market, Market Share, Marketing, Measure, Pen, Pie, Pie Chart, Presentation, Profit, Revenue, Sales, Sales Chat, Sales Increase, Share, Statistical, Success, Successful. The prominent colors used in the PowerPoint template are Yellow, Gray, White.
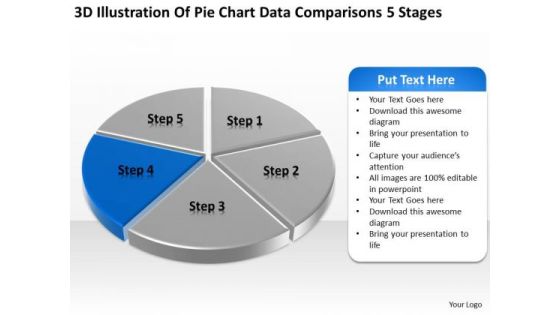
Pie Chart Data Comparisons 5 Stages How To Develop Business Plan PowerPoint Templates
We present our pie chart data comparisons 5 stages how to develop business plan PowerPoint templates.Present our Marketing PowerPoint Templates because You can Be the star of the show with our PowerPoint Templates and Slides. Rock the stage with your ideas. Download and present our Finance PowerPoint Templates because Timeline crunches are a fact of life. Meet all deadlines using our PowerPoint Templates and Slides. Use our Business PowerPoint Templates because You can Be the puppeteer with our PowerPoint Templates and Slides as your strings. Lead your team through the steps of your script. Download and present our Sales PowerPoint Templates because Our PowerPoint Templates and Slides are a sure bet. Gauranteed to win against all odds. Download our Success PowerPoint Templates because Our PowerPoint Templates and Slides will provide weight to your words. They will bring out the depth of your thought process.Use these PowerPoint slides for presentations relating to Analysis, Analyzing, Brands, Business, Chart, Colorful, Commerce, Compare, Comparison, Data, Economical, Finance, Financial, Grow, Growth, Market, Market Share, Marketing, Measure, Pen, Pie, Pie Chart, Presentation, Profit, Revenue, Sales, Sales Chat, Sales Increase, Share, Statistical, Success, Successful. The prominent colors used in the PowerPoint template are Blue, Gray, White.
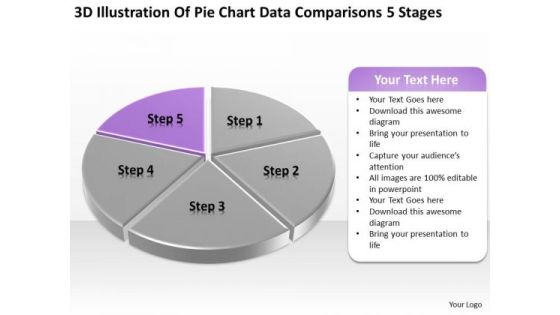
Pie Chart Data Comparisons 5 Stages Ppt Designing Business Plan PowerPoint Templates
We present our pie chart data comparisons 5 stages ppt designing business plan PowerPoint templates.Use our Marketing PowerPoint Templates because Our PowerPoint Templates and Slides are innately eco-friendly. Their high recall value negate the need for paper handouts. Download our Finance PowerPoint Templates because Our PowerPoint Templates and Slides are truly out of this world. Even the MIB duo has been keeping tabs on our team. Use our Business PowerPoint Templates because You should Bet on your luck with our PowerPoint Templates and Slides. Be assured that you will hit the jackpot. Present our Sales PowerPoint Templates because Our PowerPoint Templates and Slides are created with admirable insight. Use them and give your group a sense of your logical mind. Present our Success PowerPoint Templates because Our PowerPoint Templates and Slides are focused like a searchlight beam. They highlight your ideas for your target audience.Use these PowerPoint slides for presentations relating to Analysis, Analyzing, Brands, Business, Chart, Colorful, Commerce, Compare, Comparison, Data, Economical, Finance, Financial, Grow, Growth, Market, Market Share, Marketing, Measure, Pen, Pie, Pie Chart, Presentation, Profit, Revenue, Sales, Sales Chat, Sales Increase, Share, Statistical, Success, Successful. The prominent colors used in the PowerPoint template are Purple, Gray, White.

Big Data Insight For Time Spent Analysis Over Internet Diagram Ppt Slides
This is a big data insight for time spent analysis over internet diagram ppt slides. This is a ten stage process. The stages in this process are learning, public services, banking and finance, energy, mobility, health, retail, communication and media, web services, self measurement.
Human Resource Management Functions Icon Depicting Recruitment Infographics PDF
Presenting human resource management functions icon depicting recruitment infographics pdf to dispense important information. This template comprises three stages. It also presents valuable insights into the topics including human resource management functions icon depicting recruitment. This is a completely customizable PowerPoint theme that can be put to use immediately. So, download it and address the topic impactfully.
Human Resource 4 Months Project Status Update Icon Topics PDF
Presenting Human Resource 4 Months Project Status Update Icon Topics PDF to dispense important information. This template comprises three stages. It also presents valuable insights into the topics including Human Resource, 4 Months Project, Status Update Icon. This is a completely customizable PowerPoint theme that can be put to use immediately. So, download it and address the topic impactfully.
Business Diagram Battery Icon With Power Icons Energy Technology PowerPoint Slide
This business diagram displays battery icon with power charging. Use this diagram, in your presentations to display energy saving, battery and technology. Create professional presentations using this diagram slide.
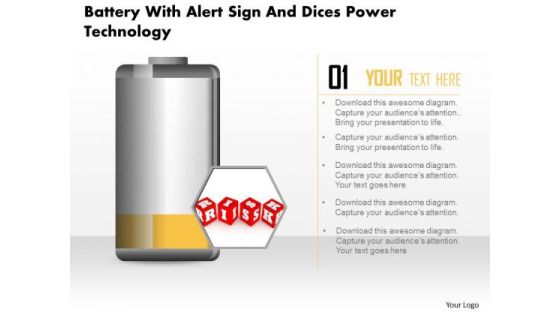
Business Diagram Battery With Alert Sign And Dices Power Technology PowerPoint Slide
This business diagram displays risk alert on battery icon. Use this diagram, in your presentations to display energy saving, battery and technology. Create professional presentations using this diagram slide.
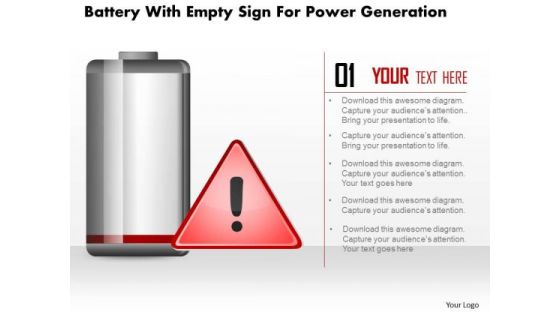
Business Diagram Battery With Empty Sign For Power Generation PowerPoint Slide
This business diagram displays empty sign alert on battery icon. Use this diagram, in your presentations to display energy saving, battery and technology. Create professional presentations using this diagram slide.

Business Diagram Five Staged Timeline Diagram For Business PowerPoint Slide
This PowerPoint template displays five points timeline diagram. This business diagram has been designed with graphic of timeline with five points, text space and start, end points. Use this diagram, in your presentations to display process steps, stages, timelines and business management. Make wonderful presentations using this business slide.
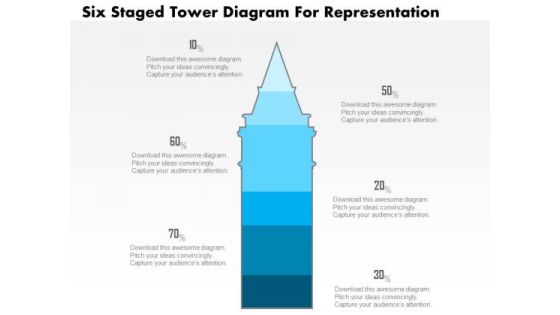
Business Diagram Five Staged Tower Diagram For Representation PowerPoint Slide
This business slide displays five staged tower diagram. It contains blue tower graphic divided into five parts. This diagram slide depicts processes, stages, steps, points, options information display. Use this diagram, in your presentations to express your views innovatively.
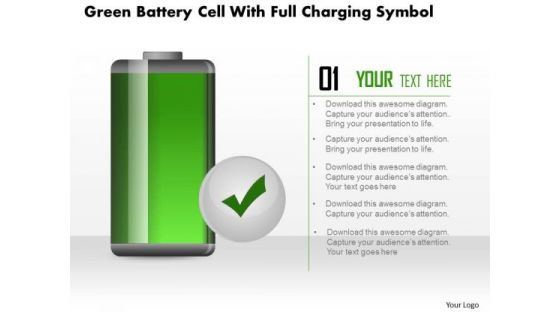
Business Diagram Green Battery Cell With Full Charging Symbol PowerPoint Slide
This business diagram displays full battery charge icon. Use this diagram, in your presentations to display energy saving, battery and technology. Create professional presentations using this diagram slide.

Business Diagram Four Steps With 3d Business Person Standing Over It PowerPoint Slide
This business diagram displays bar graph with business person standing on it. This Power Point template has been designed to display personal growth. You may use this diagram to impart professional appearance to your presentations.
