Cost Dashboard
Employment Icon Person With Magnifying Glass Ppt Powerpoint Presentation Summary Show
This is a employment icon person with magnifying glass ppt powerpoint presentation summary show. This is a four stage process. The stages in this process are recruitment icon, hiring icon, staffing icon.
Group Of Employees With Magnifying Glass Vector Icon Ppt Powerpoint Presentation Portfolio Layout Ideas
This is a group of employees with magnifying glass vector icon ppt powerpoint presentation portfolio layout ideas. This is a four stage process. The stages in this process are recruitment icon, hiring icon, staffing icon.
Talent Search New Hire Vector Icon Ppt Powerpoint Presentation Icon Tips
This is a talent search new hire vector icon ppt powerpoint presentation icon tips. This is a four stage process. The stages in this process are recruitment icon, hiring icon, staffing icon.

Analyzing And Deploying Effective CMS Key Metrics To Measure Current Performance Of Ecommerce Website Infographics PDF
This slide represents the key performance indicators to track and monitor the performance of ecommerce website to draw effective strategies to tackle the problems. It includes key metrics for ecommerce website performance measurement such as average order value and shopping cart abandonment rate. Do you know about Slidesgeeks Analyzing And Deploying Effective CMS Key Metrics To Measure Current Performance Of Ecommerce Website Infographics PDF These are perfect for delivering any kind od presentation. Using it, create PowerPoint presentations that communicate your ideas and engage audiences. Save time and effort by using our pre designed presentation templates that are perfect for a wide range of topic. Our vast selection of designs covers a range of styles, from creative to business, and are all highly customizable and easy to edit. Download as a PowerPoint template or use them as Google Slides themes.
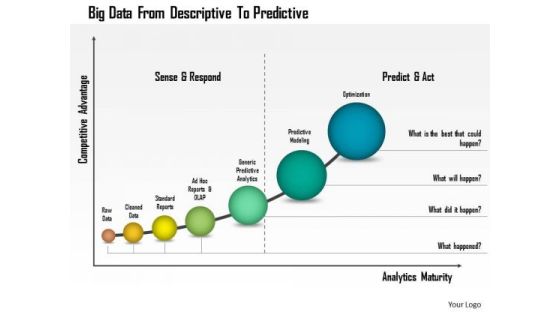
Business Diagram Big Data From Descriptive To Predictive Presentation Template
This business diagram has been designed with graphic of linear bar graph. This growing bar graph depicts the concept of big data analysis. Use this professional diagram for your financial and business analysis.

Roto Hog Stock Exchange Sales Call Management Money Management Ppt PowerPoint Presentation Gallery Graphics Design
This is a roto hog stock exchange sales call management money management ppt powerpoint presentation gallery graphics design. This is a three stage process. The stages in this process are roto hog stock exchange, sales call management, money management.
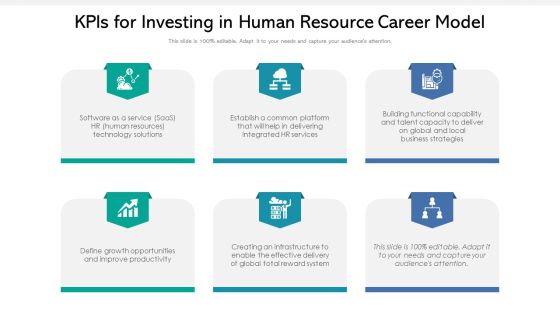
Kpis For Investing In Human Resource Career Model Ppt Powerpoint Presentation Gallery Show PDF
Persuade your audience using this kpis for investing in human resource career model ppt powerpoint presentation gallery show pdf. This PPT design covers six stages, thus making it a great tool to use. It also caters to a variety of topics including opportunities, resources, technology. Download this PPT design now to present a convincing pitch that not only emphasizes the topic but also showcases your presentation skills.

Ppt 3d Linear Abstraction To Prevent Marketing Losses Six Steps PowerPoint Templates
PPT 3d linear abstraction to prevent marketing losses six steps PowerPoint Templates-This diagram usually denotes Timeline process depicted as Linear arrows will be perfect for presentations on schedules, deadlines, milestones, annual reports, year planning, benchmarking, etc.-PPT 3d linear abstraction to prevent marketing losses six steps PowerPoint Templates-Asset, Bank, Banking, Business, Care, Careful, Cash, Commerce, Concept, Crime, Criminal, Currency, Defend, Deposit, Economic, Economy, , Finance, , Financial, Frugal, Future, Goal, Hold, Hope, Identity, Invest, Investment, Keep, Lock, Lockdown, Loss, Market, Money, Optimism, Opulence, Opulent, Planning, Possibility, Precious, Prevention, Profit, Prosperity, Protect, Protection, Reserve, Robbery, Safe, Safety, Save, Saving, Secure, Security, Shelter, Speculate, Tax
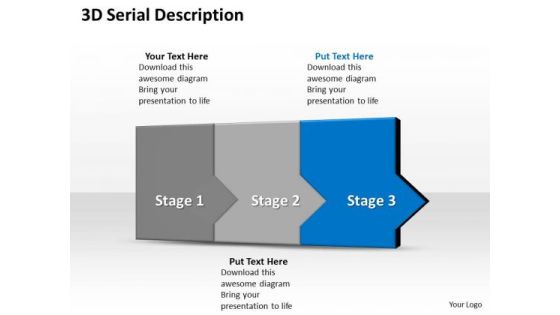
Ppt 3d Sequential Description To Prevent Marketing Losses Three Steps PowerPoint Templates
PPT 3d sequential description to prevent marketing losses three steps PowerPoint Templates-This diagram usually denotes Timeline process depicted as Linear arrows will be perfect for presentations on schedules, deadlines, milestones, annual reports, year planning, benchmarking, etc.-PPT 3d sequential description to prevent marketing losses three steps PowerPoint Templates-Asset, Bank, Banking, Business, Care, Careful, Cash, Commerce, Concept, Crime, Criminal, Currency, Defend, Deposit, Economic, Economy, , Finance, , Financial, Frugal, Future, Goal, Hold, Hope, Identity, Invest, Investment, Keep, Lock, Lockdown, Loss, Market, Money, Optimism, Opulence, Opulent, Planning, Possibility, Precious, Prevention, Profit, Prosperity, Protect, Protection, Reserve, Robbery, Safe, Safety, Save, Saving, Secure, Security, Shelter, Speculate, Tax

Ppt 3d Successive Representation To Avoid Marketing Losses Four Steps PowerPoint Templates
PPT 3d successive representation to avoid marketing losses four steps PowerPoint Templates-This diagram usually denotes Timeline process depicted as Linear arrows will be perfect for presentations on schedules, deadlines, milestones, annual reports, year planning, benchmarking, etc.-PPT 3d successive representation to avoid marketing losses four steps PowerPoint Templates-Asset, Bank, Banking, Business, Care, Careful, Cash, Commerce, Concept, Crime, Criminal, Currency, Defend, Deposit, Economic, Economy, , Finance, , Financial, Frugal, Future, Goal, Hold, Hope, Identity, Invest, Investment, Keep, Lock, Lockdown, Loss, Market, Money, Optimism, Opulence, Opulent, Planning, Possibility, Precious, Prevention, Profit, Prosperity, Protect, Protection, Reserve, Robbery, Safe, Safety, Save, Saving, Secure, Security, Shelter, Speculate, Tax
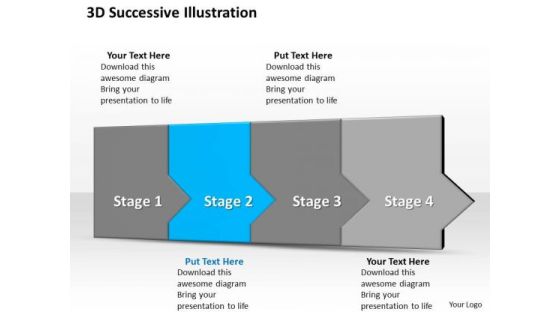
Ppt 3d Successive Representation To Prevent Marketing Losses Four Steps PowerPoint Templates
PPT 3d successive representation to prevent marketing losses four steps PowerPoint Templates-This diagram usually denotes Timeline process depicted as Linear arrows will be perfect for presentations on schedules, deadlines, milestones, annual reports, year planning, benchmarking, etc.-PPT 3d successive representation to prevent marketing losses four steps PowerPoint Templates-Asset, Bank, Banking, Business, Care, Careful, Cash, Commerce, Concept, Crime, Criminal, Currency, Defend, Deposit, Economic, Economy, , Finance, , Financial, Frugal, Future, Goal, Hold, Hope, Identity, Invest, Investment, Keep, Lock, Lockdown, Loss, Market, Money, Optimism, Opulence, Opulent, Planning, Possibility, Precious, Prevention, Profit, Prosperity, Protect, Protection, Reserve, Robbery, Safe, Safety, Save, Saving, Secure, Security, Shelter, Speculate, Tax

Deploying Content Distribution Network System Key CDN Metrics To Watch Topics PDF
This slide represents the key CDN metrics to watch while looking for a CDN provider, such as the time it takes DNS to reply. The best PPT templates are a great way to save time, energy, and resources. Slidegeeks have 100 percent editable powerpoint slides making them incredibly versatile. With these quality presentation templates, you can create a captivating and memorable presentation by combining visually appealing slides and effectively communicating your message. Download Deploying Content Distribution Network System Key CDN Metrics To Watch Topics PDF from Slidegeeks and deliver a wonderful presentation.

Overview Healthcare Business Management Financial Performance Key Trends Infographics PDF
Presenting this set of slides with name overview healthcare business management financial performance key trends infographics pdf. The topics discussed in these slides are data analytics, cybersecurity investment, avoid overbuilding, creative partnerships and affiliations, value based payments. This is a completely editable PowerPoint presentation and is available for immediate download. Download now and impress your audience.
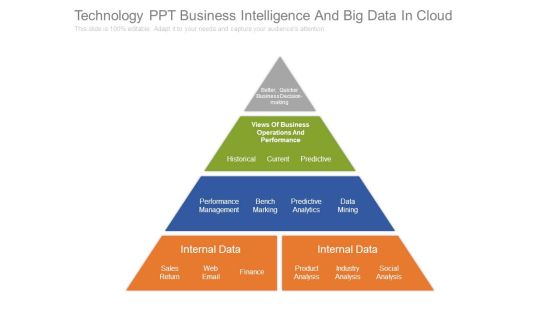
Technology Ppt Business Intelligence And Big Data In Cloud
This is a technology ppt business intelligence and big data in cloud. This is a four stage process. The stages in this process are better, quicker business decision making, views of business operations and performance, historical, current, predictive, performance management, bench marking, predictive analytics, data mining, internal data, sales return, web email, finance, product analysis, industry analysis, social analysis.

Company Financial Accounting Key Performance Indicators Ppt Slides PDF
This slide shows the key metrics of finance used in every organization. It includes profitability, liquidity, leverage, efficiency and valuation ratios. Presenting Company Financial Accounting Key Performance Indicators Ppt Slides PDF to dispense important information. This template comprises five stages. It also presents valuable insights into the topics including Profitability, Liquidity, Leverage. This is a completely customizable PowerPoint theme that can be put to use immediately. So, download it and address the topic impactfully.
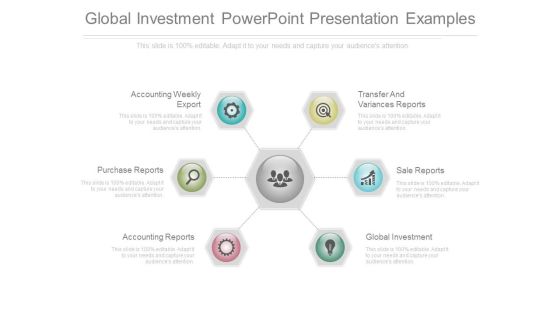
Global Investment Powerpoint Presentation Examples
This is a global investment powerpoint presentation examples. This is a six stage process. The stages in this process are accounting weekly export, transfer and variances reports, purchase reports, sale reports, accounting reports, global investment.\n\n

Pharmaceutical Company Key Performance Indicators Clipart PDF
The slide shows the key Performance Indicator KPI s which will help the company to track the success rate of implemented strategies. Major KPIs include number of products sold, pharma products manufactures, research and development expenses per year, total number of patients, etc.Presenting pharmaceutical company key performance indicators clipart pdf to provide visual cues and insights. Share and navigate important information on one stage that need your due attention. This template can be used to pitch topics like research and development, key performance indicator, pharma products manufactured In addtion, this PPT design contains high resolution images, graphics, etc, that are easily editable and available for immediate download.

E Commerce Company Investor Funding Elevator Pitch Deck Financial Projections Introduction PDF
The slide outlines the financial projections of the company containing estimated increase in GMV, net income, number of customers and product categories derived from current fiscal data. Do you have to make sure that everyone on your team knows about any specific topic I yes, then you should give E Commerce Company Investor Funding Elevator Pitch Deck Financial Projections Introduction PDF a try. Our experts have put a lot of knowledge and effort into creating this impeccable E Commerce Company Investor Funding Elevator Pitch Deck Financial Projections Introduction PDF. You can use this template for your upcoming presentations, as the slides are perfect to represent even the tiniest detail. You can download these templates from the Slidegeeks website and these are easy to edit. So grab these today.

B2b Marketing Business Sample Diagram Ppt Slides
This is a b2b marketing business sample diagram ppt slides. This is a one stage process. The stages in this process are communication, electronic, retailer, mobile, used, system, collaboration, volume, business, b2b, marketing, commerce, media, service, edi, chain, data, internet, sell, automated, may, using.

Guidebook For Executing Business Market Intelligence Statistics Report Showing Market Graphics PDF
This slide presents an statistics reports providing valuable insights of global market based on data collection and analysis. It covers key elements such as forecasted market CAGR, incremental growth, estimated YoY rate, revenue generating market region and key drivers. Do you have to make sure that everyone on your team knows about any specific topic I yes, then you should give Guidebook For Executing Business Market Intelligence Statistics Report Showing Market Graphics PDF a try. Our experts have put a lot of knowledge and effort into creating this impeccable Guidebook For Executing Business Market Intelligence Statistics Report Showing Market Graphics PDF. You can use this template for your upcoming presentations, as the slides are perfect to represent even the tiniest detail. You can download these templates from the Slidegeeks website and these are easy to edit. So grab these today.

Bar Graph Ppt PowerPoint Presentation Model
This is a bar graph ppt powerpoint presentation model. This is a five stage process. The stages in this process are business, marketing, bar slides, management, finance.

Portfolio Management Investment Allocation KPIS Ppt PowerPoint Presentation Styles Grid
Presenting this set of slides with name portfolio management investment allocation kpis ppt powerpoint presentation styles grid. This is a eight stage process. The stages in this process are portfolio summary, current allocations, net allocations. This is a completely editable PowerPoint presentation and is available for immediate download. Download now and impress your audience.
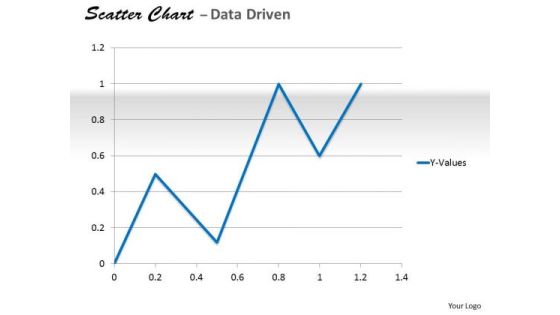
Data Analysis In Excel Analyzing Of Relationship Chart PowerPoint Templates
Delight Them With Our data analysis in excel analyzing of relationship chart Powerpoint Templates .

Data Warehousing IT Data Warehouse Vs Data Mart Ppt Infographic Template Background Image PDF
This slide represents a comparison between data warehouse and data mart and how data marts can be designed for sole operational reasons. Deliver an awe inspiring pitch with this creative data warehousing it data warehouse vs data mart ppt infographic template background image pdf bundle. Topics like marketing, finance, sales, formatted and processed data, data mart, data warehouse can be discussed with this completely editable template. It is available for immediate download depending on the needs and requirements of the user.
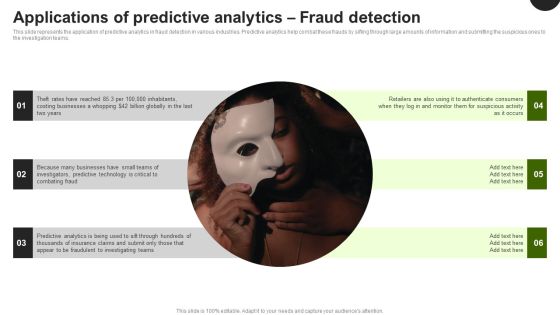
Predictive Analytics In The Age Of Big Data Applications Of Predictive Analytics Fraud Detection Formats PDF
This slide represents the application of predictive analytics in fraud detection in various industries. Predictive analytics help combat these frauds by sifting through large amounts of information and submitting the suspicious ones to the investigation teams. Boost your pitch with our creative Predictive Analytics In The Age Of Big Data Applications Of Predictive Analytics Fraud Detection Formats PDF. Deliver an awe-inspiring pitch that will mesmerize everyone. Using these presentation templates you will surely catch everyones attention. You can browse the ppts collection on our website. We have researchers who are experts at creating the right content for the templates. So you do not have to invest time in any additional work. Just grab the template now and use them.

Brand Budgeting Ppt PowerPoint Presentation Pictures Slides
This is a brand budgeting ppt powerpoint presentation pictures slides. This is a seven stage process. The stages in this process are name development, brand mark, core brand presentation, advertising, social media.

Pitch Deck To Raise Funding From Equity Crowdfunding Magnifying Glass Ppt Infographics Introduction PDF
Presenting this set of slides with name pitch deck to raise funding from equity crowdfunding magnifying glass ppt infographics introduction pdf. This is a five stage process. The stages in this process are magnifying glass. This is a completely editable PowerPoint presentation and is available for immediate download. Download now and impress your audience.

Convertible Note Pitch Deck Funding Strategy Magnifying Glass Ppt PowerPoint Presentation Gallery File Formats PDF
Presenting this set of slides with name convertible note pitch deck funding strategy magnifying glass ppt powerpoint presentation gallery file formats pdf. This is a seven stage process. The stages in this process are magnifying glass. This is a completely editable PowerPoint presentation and is available for immediate download. Download now and impress your audience.
Investor Deck For Capital Generation From Substitute Funding Options Magnifying Glass Slides PDF
Presenting this set of slides with name investor deck for capital generation from substitute funding options magnifying glass slides pdf. This is a five stage process. The stages in this process are magnifying glass. This is a completely editable PowerPoint presentation and is available for immediate download. Download now and impress your audience.

Procurement Pricing Benchmarks Analysis Report With Key Metrics Designs PDF
This slide shows the report representing the procurement price benchmarks for various organizations. It represents analysis of market average, best-in-class and all others on the basis of procurement key metrics. Pitch your topic with ease and precision using this Procurement Pricing Benchmarks Analysis Report With Key Metrics Designs PDF. This layout presents information on Spend Under Management, Contract Complaint. It is also available for immediate download and adjustment. So, changes can be made in the color, design, graphics or any other component to create a unique layout.

Business Monthly Operational Budget Report Summary With Actual Data Structure PDF
The following slide highlights the monthly operational budget report with actual data. It provides information about particulars, item, budget, revenue, expenses, salaries, materials, overhead, total and balance.Showcasing this set of slides titled Business Monthly Operational Budget Report Summary With Actual Data Structure PDF The topics addressed in these templates are Particulars, Membership Receivables, Administrative All the content presented in this PPT design is completely editable. Download it and make adjustments in color, background, font etc. as per your unique business setting.

Business Data Analysis Chart For Project PowerPoint Templates
Document Your Views On Our business data analysis chart for project Powerpoint Templates. They Will Create A Strong Impression.
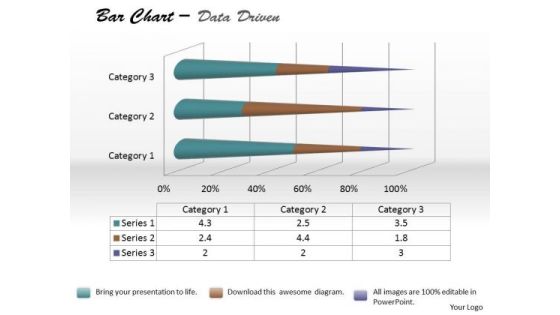
Data Analysis Bar Chart For Foreign Trade PowerPoint Templates
Be The Doer With Our data analysis bar chart for foreign trade Powerpoint Templates. Put Your Thoughts Into Practice.

Data Analysis Excel Business Tool Scatter Chart PowerPoint Templates
Dominate Proceedings With Your Ideas. Our data analysis excel business tool scatter chart Powerpoint Templates Will Empower Your Thoughts.
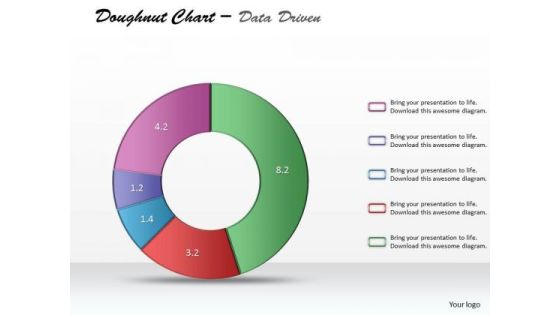
Data Analysis Excel Categorical Statistics Doughnut Chart PowerPoint Templates
Establish Your Dominion With Our data analysis excel categorical statistics doughnut chart Powerpoint Templates. Rule The Stage With Your Thoughts.

Data Analysis Techniques 3d Grouped Bar Chart PowerPoint Templates
Place The Orders With Your Thoughts. Our data analysis techniques 3d grouped bar chart Powerpoint Templates Know The Drill.
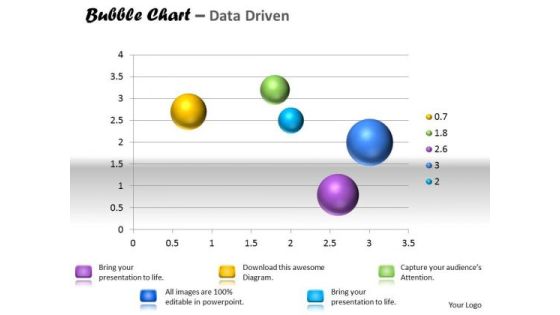
Data Analysis Template Interactive Bubble Chart PowerPoint Templates
Our data analysis template interactive bubble chart Powerpoint Templates Are A Wonder Drug. They Help Cure Almost Any Malaise.
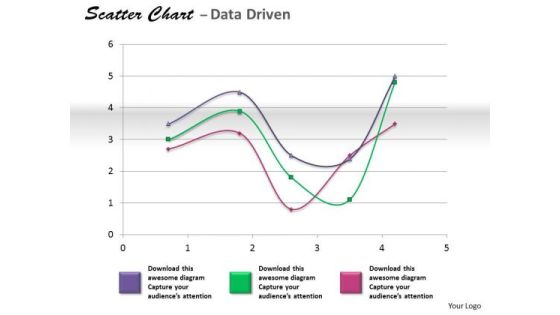
Financial Data Analysis Coordinate With Scatter Chart PowerPoint Templates
Get The Doers Into Action. Activate Them With Our financial data analysis coordinate with scatter chart Powerpoint Templates .
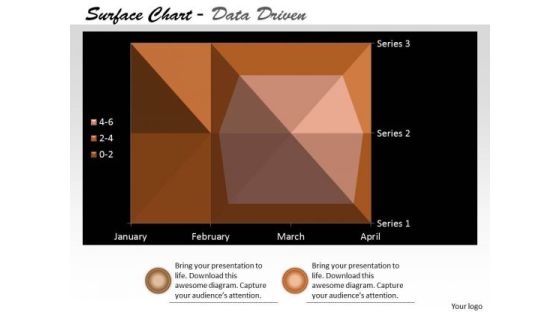
Multivariate Data Analysis Surface Chart Plots Trends PowerPoint Templates
Our multivariate data analysis surface chart plots trends Powerpoint Templates Heighten Concentration. Your Audience Will Be On The Edge.
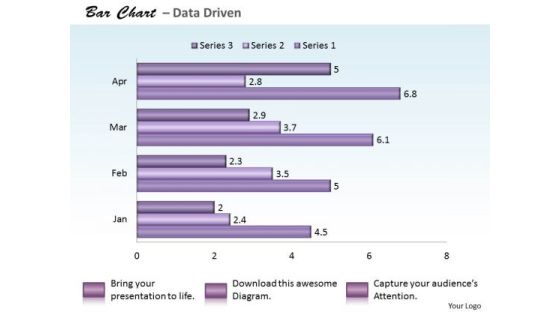
Quantitative Data Analysis Bar Chart For PowerPoint Templates
Reduce The Drag With Our quantitative data analysis bar chart for Powerpoint Templates . Give More Lift To Your Thoughts.

Data Analysis Techniques 3d Effective Display Chart PowerPoint Templates
Dribble Away With Our data analysis techniques 3d effective display chart Powerpoint Templates . Score A Goal With Your Ideas.

Financial Reporting Manager With Data Powerpoint Slides
This PowerPoint template has been designed with graphics of finance manager and percentage data. This diagram is useful to exhibit financial management. This diagram slide can be used to make impressive presentations.

Business Education PowerPoint Templates Business Bar Graph Data Driven Ppt Slides
Business Education PowerPoint Templates Business bar graph data driven PPT Slides-This PowerPoint slide is a data driven Columns Chart. The number of columns depend on the data.-Business Editable PowerPoint Templates Business beveled column chart PPT Slides-This ppt can be used for concepts relating to-chart,, graph, growth, investment, , market, percentage, , presentation report, results, statistics, stock, success and business.
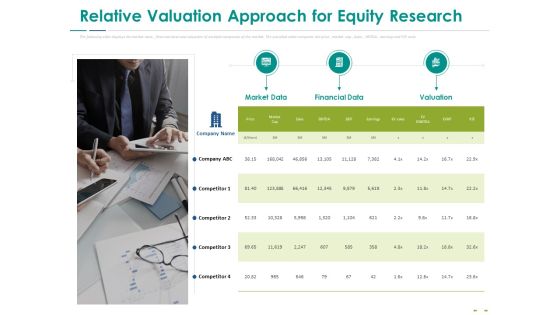
Stock Market Research Report Relative Valuation Approach For Equity Research Inspiration PDF
The following slide displays the market data, financial data and valuation of multiple companies of the market. The provided table compares the price, market cap, Sales, EBITDA, earning and P or E ratio. Presenting stock market research report relative valuation approach for equity research inspiration pdf to provide visual cues and insights. Share and navigate important information on one stages that need your due attention. This template can be used to pitch topics like market data, financial data, valuation. In addition, this PPT design contains high-resolution images, graphics, etc, that are easily editable and available for immediate download.

Big Data Analytics Lifecycle Lifecycle Phases Of Big Data Analytics Ppt Gallery Sample PDF
This slide depicts the lifecycle phases of big data analytics, including business case evaluation, data identification, data filtering, data extraction, data aggregation, data analysis, data visualization, and final analysis output. Slidegeeks is one of the best resources for PowerPoint templates. You can download easily and regulate Big Data Analytics Lifecycle Lifecycle Phases Of Big Data Analytics Ppt Gallery Sample PDF for your personal presentations from our wonderful collection. A few clicks is all it takes to discover and get the most relevant and appropriate templates. Use our Templates to add a unique zing and appeal to your presentation and meetings. All the slides are easy to edit and you can use them even for advertisement purposes.

Formulating Money Laundering Tms And Data Analytics Process Flow Sample PDF
This slide represents transaction monitoring system process flow. It provides information about data analytics, risk framework, alerting, ad hoc analysis, case management, external source entrance, stop list, politically exposed persons PEP, watch list, etc. Do you have to make sure that everyone on your team knows about any specific topic I yes, then you should give Formulating Money Laundering Tms And Data Analytics Process Flow Sample PDF a try. Our experts have put a lot of knowledge and effort into creating this impeccable Formulating Money Laundering Tms And Data Analytics Process Flow Sample PDF. You can use this template for your upcoming presentations, as the slides are perfect to represent even the tiniest detail. You can download these templates from the Slidegeeks website and these are easy to edit. So grab these today.
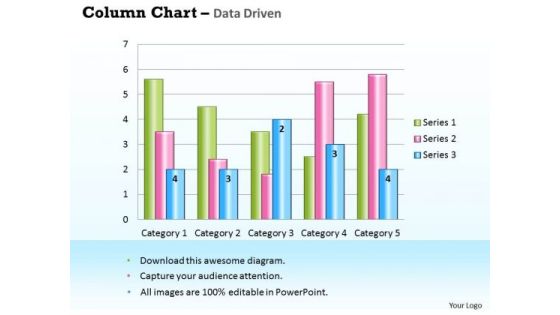
Business Data Analysis Chart For Case Studies PowerPoint Templates
Get Out Of The Dock With Our business data analysis chart for case studies Powerpoint Templates. Your Mind Will Be Set Free.
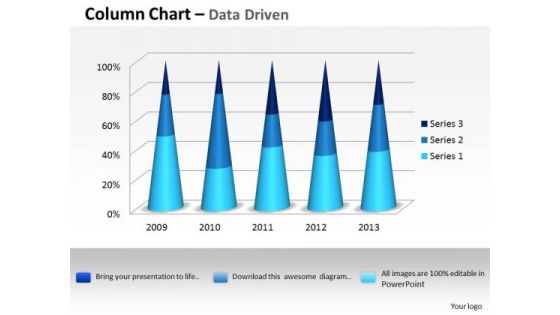
Data Analysis Excel 3d Process Variation Column Chart PowerPoint Templates
Put In A Dollop Of Our data analysis excel 3d process variation column chart Powerpoint Templates. Give Your Thoughts A Distinctive Flavor.
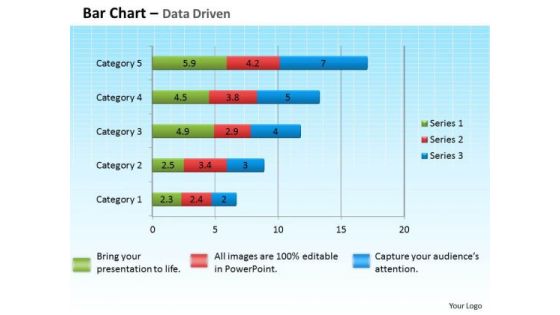
Data Analysis Excel Bar Graph To Compare PowerPoint Templates
Get The Domestics Right With Our data analysis excel bar graph to compare Powerpoint Templates. Create The Base For Thoughts To Grow.

Data Analysis Excel Bubble Chart For Business Tasks PowerPoint Templates
Doll Up Your Thoughts With Our data analysis excel bubble chart for business tasks Powerpoint Templates. They Will Make A Pretty Picture.

Data Analysis In Excel 3d Classification Of Chart PowerPoint Templates
With Our data analysis in excel 3d classification of chart Powerpoint Templates You Will Be Doubly Sure. They Possess That Stamp Of Authority.
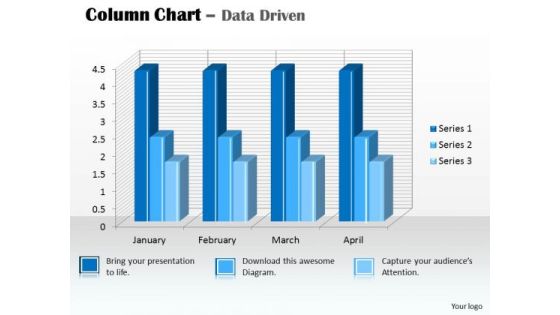
Data Analysis In Excel 3d Column Chart For PowerPoint Templates
Our data analysis in excel 3d column chart for Powerpoint Templates And Your Ideas Make A Great Doubles Pair. Play The Net With Assured Hands.

Data Analysis Programs 3d Bar Chart To Dispaly PowerPoint Templates
Lower The Drawbridge With Our data analysis programs 3d bar chart to dispaly Powerpoint Templates . Capture The Minds Of Your Audience.
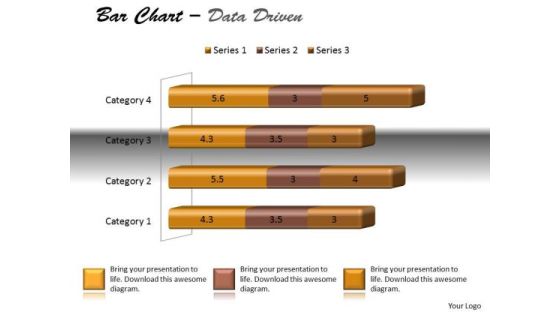
Data Analysis Techniques 3d Bar Chart For Modification PowerPoint Templates
Dreams Generate Thoughts, Thoughts Generate Ideas. Give Them Life With Our data analysis techniques 3d bar chart for modification Powerpoint Templates .
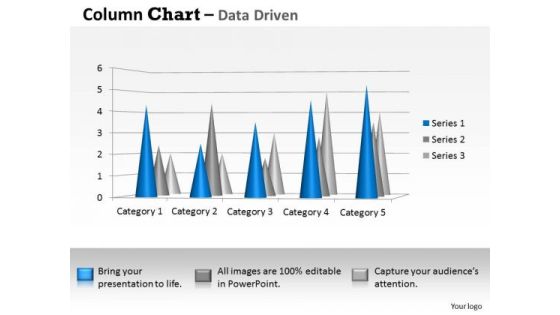
Data Analysis Techniques 3d Distribution Of In Sets PowerPoint Templates
Your Thoughts Will Be The Main Course. Provide The Dressing With Our data analysis techniques 3d distribution of in sets Powerpoint Templates .

Data Analysis Techniques 3d Graphical Presentation Of PowerPoint Templates
Our data analysis techniques 3d graphical presentation of Powerpoint Templates Will Follow The Drill. They Accomplish The Task Assigned To Them.

Data Analysis Techniques 3d In Segments Pie Chart PowerPoint Templates
Drink To The Success Of Your Campaign. Our data analysis techniques 3d in segments pie chart Powerpoint Templates Will Raise A Toast.

Data Analysis Template Driven Visualization Area Chart PowerPoint Slides Templates
Draw On The Energy Of Our data analysis template driven visualization area chart powerpoint slides Templates . Your Thoughts Will Perk Up.

Financial Data Analysis Area Chart For Showing Trends PowerPoint Templates
Document Your Views On Our financial data analysis area chart for showing trends Powerpoint Templates . They Will Create A Strong Impression.
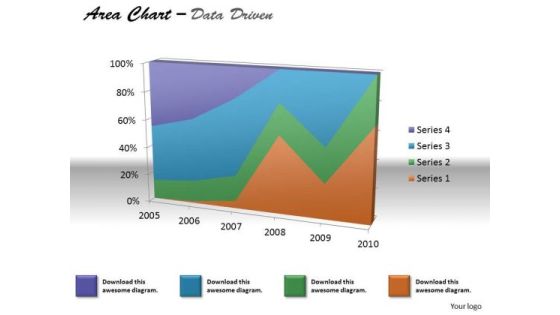
Financial Data Analysis Area Chart For Various Values PowerPoint Templates
Document The Process On Our financial data analysis area chart for various values Powerpoint Templates . Make A Record Of Every Detail.
 Home
Home