Cost Dashboard
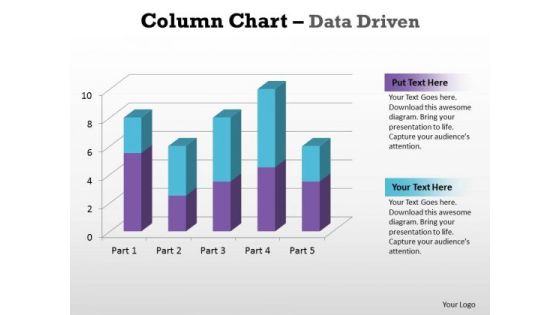
Business Graphic PowerPoint Templates Business Column Chart Data Driven Ppt Slides
Business Graphic PowerPoint Templates Business column chart data driven PPT Slides-With help of visual aids like this template you can capture the attention of the audience and make the presentation very interactive and lively.-Business Graphic PowerPoint Templates Business column chart data driven PPT Slides-This ppt can be used for concepts relating to-chart,, graph, growth, investment, , market, percentage, , presentation report, results, statistics, stock, success and business.

Audit For Financial Investment Cash Flow Statement Kpis Portrait PDF
Deliver an awe inspiring pitch with this creative audit for financial investment cash flow statement kpis portrait pdf bundle. Topics like investing activities, net increase in cash, financing activities can be discussed with this completely editable template. It is available for immediate download depending on the needs and requirements of the user.
Human Resource Strategy For Company Employee Vector Icon Ppt PowerPoint Presentation Show Icons PDF
Persuade your audience using this human resource strategy for company employee vector icon ppt powerpoint presentation show icons pdf. This PPT design covers three stages, thus making it a great tool to use. It also caters to a variety of topics including human resource strategy for company employee vector icon. Download this PPT design now to present a convincing pitch that not only emphasizes the topic but also showcases your presentation skills.

Business Intelligence And Big Key Essential Features Of Data Analytics Tools Topics PDF
The slide elaborates the key features of Data Analytics software which are required to improve business results. The features includes easy raw data processing, scalability, and technical support etc. This is a business intelligence and big key essential features of data analytics tools topics pdf template with various stages. Focus and dispense information on six stages using this creative set, that comes with editable features. It contains large content boxes to add your information on topics like raw data processing, reporting feature, security features, technologies support, scalability quick integrations. You can also showcase facts, figures, and other relevant content using this PPT layout. Grab it now.

Datafy Budget Planning For Datafication Project Download PDF
This slide describes the budget planning for the datafication project, including an increased budget for IT solutions, staff increase by creating new posts, external technical consulting, external analytical line of business, no other new investments and others. There are so many reasons you need a Improve Productivity, Facilitate Digital Transformation, Manage Data. The first reason is you cant spend time making everything from scratch, Thus, Slidegeeks has made presentation templates for you too. You can easily download these templates from our website easily.
Human Resource Job Hiring Vector Icon Ppt Powerpoint Presentation Ideas Icon
This is a human resource job hiring vector icon ppt powerpoint presentation ideas icon. This is a stage process. The stages in this process are recruitment icon, hiring icon, staffing icon.

Investment Summary Report Of ABC Stocks Introduction PDF
The following slide shows portfolio activity over a certain period of time to analyze the market value of firms investment. It also includes period returns, contributions, revenue and expenses. Pitch your topic with ease and precision using this Investment Summary Report Of ABC Stocks Introduction PDF. This layout presents information on Summary Report, Value Summary, Revenues, Expenses. It is also available for immediate download and adjustment. So, changes can be made in the color, design, graphics or any other component to create a unique layout.

Engineering Services Company Valuation Ratios Engineering Company Financial Analysis Report Brochure PDF
The following slide highlights the valuation ratio of the engineering company to assess the organizations worth on the basis of share price, sales, and market capitalization, Key ratios included are enterprise value, EV per net sales, price to book value, market cap per sales, retention ratio and earnings yield. The Engineering Services Company Valuation Ratios Engineering Company Financial Analysis Report Brochure PDF is a compilation of the most recent design trends as a series of slides. It is suitable for any subject or industry presentation, containing attractive visuals and photo spots for businesses to clearly express their messages. This template contains a variety of slides for the user to input data, such as structures to contrast two elements, bullet points, and slides for written information. Slidegeeks is prepared to create an impression.

Graphical Exploratory Data Analysis Powerpoint Slides Clipart
This is a graphical exploratory data analysis powerpoint slides clipart. This is a five stage process. The stages in this process are techniques, information, predictive, focuses, business.

Startup Presentation For Collaborative Capital Funding Magnifying Glass Introduction PDF
Presenting this set of slides with name startup presentation for collaborative capital funding magnifying glass introduction pdf. This is a two stage process. The stages in this process are magnifying glass. This is a completely editable PowerPoint presentation and is available for immediate download. Download now and impress your audience.

Boost Marketing And Sales Through Live Chat The Growth Of Chatbots A Snapshot Ppt File Slide Download PDF
Deliver and pitch your topic in the best possible manner with this boost marketing and sales through live chat the growth of chatbots a snapshot ppt file slide download pdf. Use them to share invaluable insights on the growth of chatbots a snapshot and impress your audience. This template can be altered and modified as per your expectations. So, grab it now.
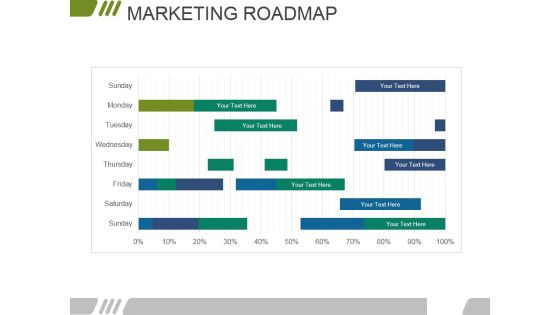
Marketing Roadmap Ppt PowerPoint Presentation Pictures Designs
This is a marketing roadmap ppt powerpoint presentation pictures designs. This is a eight stage process. The stages in this process are business, marketing, roadmap, finance, management.

Market Segmentation Ppt PowerPoint Presentation Summary Visuals
This is a market segmentation ppt powerpoint presentation summary visuals. This is a four stage process. The stages in this process are tables, marketing, strategy, planning, finance.
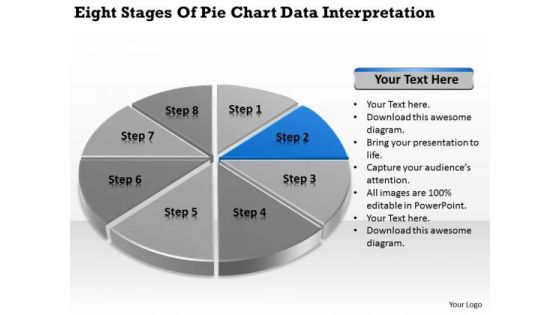
Stages Of Pie Chart Data Interpretation Vending Machine Business Plan PowerPoint Slides
We present our stages of pie chart data interpretation vending machine business plan PowerPoint Slides.Present our Circle Charts PowerPoint Templates because You should Bet on your luck with our PowerPoint Templates and Slides. Be assured that you will hit the jackpot. Present our Marketing PowerPoint Templates because Our PowerPoint Templates and Slides will provide you the cutting edge. Slice through the doubts in the minds of your listeners. Download our Business PowerPoint Templates because you should Experience excellence with our PowerPoint Templates and Slides. They will take your breath away. Download our Shapes PowerPoint Templates because It will Raise the bar of your Thoughts. They are programmed to take you to the next level. Present our Process and Flows PowerPoint Templates because Our PowerPoint Templates and Slides will give good value for money. They also have respect for the value of your time.Use these PowerPoint slides for presentations relating to achievement, analysis, background, bank, banking, business, calculation, chart, circle, commerce, commercial, commission, concept, credit, crisis, debt, deposit, design, detail, diagram, earnings, economics, economy, element, finance, goal, gold, golden, graph, graphic, growth, icon, idea, illustration, income, increase, invest, isolated, level, loss, market, marketing, metal, modern, money, new, object, part, percent, percentage, pie, plot, politics, profit, progress, ratio, reflection, reflective. The prominent colors used in the PowerPoint template are Blue, Gray, Black.

Customized Investment Plan Ppt Infographic Template
This is a customized investment plan ppt infographic template. This is a five stage process. The stages in this process are develop an investment plan, implement your investment plan, review investment results, reporting and managing expectation, establish financial goals.

Project Key Performance Indicators Progress Scorecard Portrait PDF
This slide covers status summary of different KPIs in a project along with indicators scale. It also contains elements such as resources , project delivery summary with key risks, assumptions and dependencies.Pitch your topic with ease and precision using this Project Key Performance Indicators Progress Scorecard Portrait PDF. This layout presents information on Limited Availability Resources, Limited Funding Options, Key Resources . It is also available for immediate download and adjustment. So, changes can be made in the color, design, graphics or any other component to create a unique layout.

Pandl Kpis Investment Ppt PowerPoint Presentation Slides Background Designs
Presenting this set of slides with name pandl kpis investment ppt powerpoint presentation slides background designs. The topics discussed in these slides are financial, marketing, management, investment, analysis. This is a completely editable PowerPoint presentation and is available for immediate download. Download now and impress your audience.

Mini Charter For Data Analytics Project With Metrics And Milestones Clipart PDF
This slide shows the formal document that describes the scope of business analytics project covering its goals, key metrics, resources, teams and milestones etc. This Mini Charter For Data Analytics Project With Metrics And Milestones Clipart PDF from Slidegeeks makes it easy to present information on your topic with precision. It provides customization options, so you can make changes to the colors, design, graphics, or any other component to create a unique layout. It is also available for immediate download, so you can begin using it right away. Slidegeeks has done good research to ensure that you have everything you need to make your presentation stand out. Make a name out there for a brilliant performance.

Forecasted Financial Data Analytics Expansion Trends Slides PDF
This slide shows financial data analytics growth trends till 2029 that highlights geographical distribution of growth among different countries. It include key market players and geographical growth etc. Showcasing this set of slides titled Forecasted Financial Data Analytics Expansion Trends Slides PDF. The topics addressed in these templates are Machine Learning, Projected Growth, Industry. All the content presented in this PPT design is completely editable. Download it and make adjustments in color, background, font etc. as per your unique business setting.
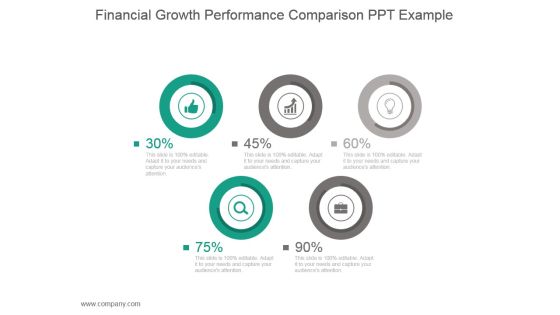
Financial Growth Performance Comparison Ppt Example
This is a financial growth performance comparison ppt example. This is a five stage process. The stages in this process are business, strategy, marketing, finance, icons.

Financial Growth Ppt PowerPoint Presentation Layout
This is a financial growth ppt powerpoint presentation layout. This is a three stage process. The stages in this process are business, marketing, finance, percentage, growth.

data collection scatter diagram ppt powerpoint presentation inspiration
This is a data collection scatter diagram ppt powerpoint presentation inspiration. This is a three stage process. The stages in this process are business, planning, marketing, scatter diagram, finance.

Digitalized Roles And Responsibilities In Human Resource Duties Management Guidelines PDF
This slide covers the processes that digitalized the human resource roles and responsibilities to make the overall working structure more efficient, effective, and well connected. Digitalized management includes employee experience, data analytics, digital enablement, platform technologies, etc. Persuade your audience using this Digitalized Roles And Responsibilities In Human Resource Duties Management Guidelines PDF. This PPT design covers five stages, thus making it a great tool to use. It also caters to a variety of topics including Digital Strategy, Data Analytics, Employee Experience, Digital Enablement. Download this PPT design now to present a convincing pitch that not only emphasizes the topic but also showcases your presentation skills.
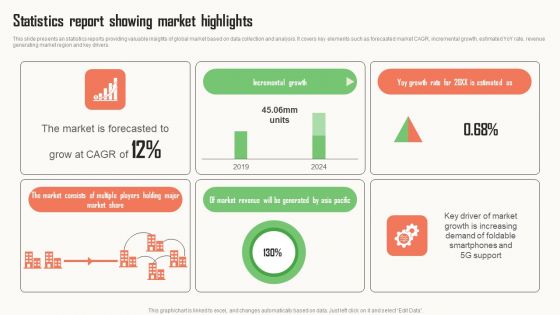
Strategic Market Insight Implementation Guide Statistics Report Showing Market Highlights Themes PDF
This slide presents an statistics reports providing valuable insights of global market based on data collection and analysis. It covers key elements such as forecasted market CAGR, incremental growth, estimated YoY rate, revenue generating market region and key drivers. From laying roadmaps to briefing everything in detail, our templates are perfect for you. You can set the stage with your presentation slides. All you have to do is download these easy to edit and customizable templates. Strategic Market Insight Implementation Guide Statistics Report Showing Market Highlights Themes PDF will help you deliver an outstanding performance that everyone would remember and praise you for. Do download this presentation today.
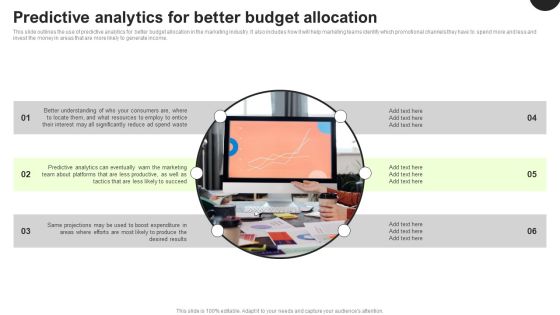
Predictive Analytics In The Age Of Big Data Predictive Analytics For Better Budget Allocation Inspiration PDF
This slide outlines the use of predictive analytics for better budget allocation in the marketing industry. It also includes how it will help marketing teams identify which promotional channels they have to spend more and less and invest the money in areas that are more likely to generate income. Make sure to capture your audiences attention in your business displays with our gratis customizable Predictive Analytics In The Age Of Big Data Predictive Analytics For Better Budget Allocation Inspiration PDF. These are great for business strategies, office conferences, capital raising or task suggestions. If you desire to acquire more customers for your tech business and ensure they stay satisfied, create your own sales presentation with these plain slides.

Audit For Financial Investment P And L Kpis Pictures PDF
Deliver an awe-inspiring pitch with this creative audit for financial investment p and l kpis pictures pdf bundle. Topics like operating profit, revenue, net profit can be discussed with this completely editable template. It is available for immediate download depending on the needs and requirements of the user.

Audit For Financial Investment Balance Sheet Kpis Sample PDF
Deliver an awe inspiring pitch with this creative audit for financial investment balance sheet kpis sample pdf bundle. Topics like total liabilities, current liabilities, current assets can be discussed with this completely editable template. It is available for immediate download depending on the needs and requirements of the user.
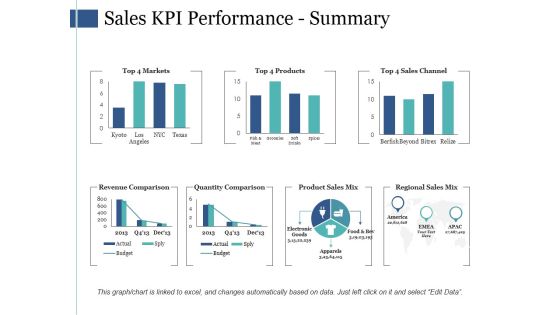
Sales Kpi Performance Summary Ppt PowerPoint Presentation Infographic Template Infographics
This is a sales kpi performance summary ppt powerpoint presentation infographic template infographics. This is a seven stage process. The stages in this process are revenue comparison, quantity comparison, product sales mix, regional sales mix.

Data Analytics In Portfolio Management Powerpoint Templates
This is a data analytics in portfolio management powerpoint templates. This is a five stage process. The stages in this process are decision management, valuation, risk management, project finance, investment portfolio.

Paying Loads Of Money To Manage Big Data Ppt PowerPoint Presentation File Files PDF
Presenting Paying Loads Of Money To Manage Big Data Ppt PowerPoint Presentation File Files PDF to provide visual cues and insights. Share and navigate important information on four stages that need your due attention. This template can be used to pitch topics like Services, Extreme Security, Required Frameworks. In addtion, this PPT design contains high resolution images, graphics, etc, that are easily editable and available for immediate download.

AGENDA Data Driven Promotional Guide To Increase Return On Investment Designs PDF
Are you in need of a template that can accommodate all of your creative concepts This one is crafted professionally and can be altered to fit any style. Use it with Google Slides or PowerPoint. Include striking photographs, symbols, depictions, and other visuals. Fill, move around, or remove text boxes as desired. Test out color palettes and font mixtures. Edit and save your work, or work with colleagues. Download AGENDA Data Driven Promotional Guide To Increase Return On Investment Designs PDF and observe how to make your presentation outstanding. Give an impeccable presentation to your group and make your presentation unforgettable.
Icon For Data Tracking And Market Assessment Framework Brochure PDF
This is a Icon For Data Tracking And Market Assessment Framework Brochure PDF template with various stages. Focus and dispense information on three stages using this creative set, that comes with editable features. It contains large content boxes to add your information on topics like Icon For Data, Tracking Market, Assessment Framework. You can also showcase facts, figures, and other relevant content using this PPT layout. Grab it now.

Clustered Bar Ppt PowerPoint Presentation Good
This is a clustered bar ppt powerpoint presentation good. This is a five stage process. The stages in this process are product, circular, business, marketing, bar graph.
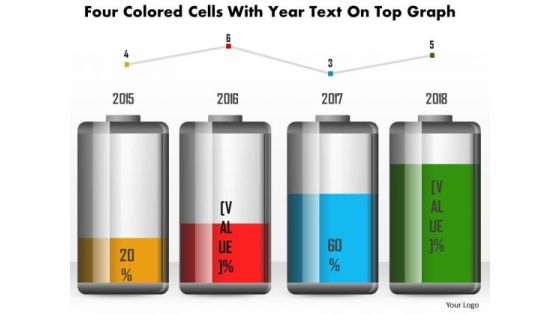
Business Diagram Four Colored Cells With Year Text On Top Graph PowerPoint Slide
This business diagram has been designed with battery cell graphic for business timeline. This slide can be used for business planning and management. Use this diagram for your business and success milestones related presentations.

Key Company Financial Operation Performance Metrics Ppt Infographic Template Example Introduction PDF
This slide showcases key performance indicators for every business. Key metrics covered are return on assets and equity, working capital ratio, debt and equity ratio. Showcasing this set of slides titled Key Company Financial Operation Performance Metrics Ppt Infographic Template Example Introduction PDF. The topics addressed in these templates are Return on Assets, Working Capital Ratio, Return on Equity. All the content presented in this PPT design is completely editable. Download it and make adjustments in color, background, font etc. as per your unique business setting.
Funding Updates Debt Ppt PowerPoint Presentation Icon Background Designs
This is a funding updates debt ppt powerpoint presentation icon background designs. This is a two stage process. The stages in this process are debt, updates, business, marketing, compare, management.

Debt Retrieval Techniques Understanding Our Cash Flow Statements Kpi Fy 20 21 Ppt Infographic Template Background Images PDF
Purpose of the following slide is to show the major key performing indicators of the organization , these KPIs can be the operation activities, cash flow from financing activities, investing activities and the net decrease in cash flow This is a debt retrieval techniques understanding our cash flow statements kpi fy 20 21 ppt infographic template background images pdf template with various stages. Focus and dispense information on four stages using this creative set, that comes with editable features. It contains large content boxes to add your information on topics like cash flow from operations, cash flow from investing activities, cash flow from financing activities, change in cash and cash equivalents. You can also showcase facts, figures, and other relevant content using this PPT layout. Grab it now.

Our Pricing Packages For Real Estate Promotion And Investment Planning Service Proposal Infographics PDF
This slide showcases various packages that are provided by property management company to its clients. It includes components like services offered, monthly management fees, lease renewal fee, financial reports etc Elevate your presentations with our intuitive Our Pricing Packages For Real Estate Promotion And Investment Planning Service Proposal Infographics PDF template. Whether you are delivering a pitch, sharing data, or presenting ideas, our visually-stunning single-slide PPT template is the perfect tool to captivate your audience. With 100 percent editable features and a user-friendly interface, creating professional presentations has never been easier. Download now and leave a lasting impression.

Telecom Technology Industry Report With Growth Drivers Pictures PDF
The following slide highlights telecommunication technology industry report with growth drivers such as application services, BPO, digital operations, cybersecurity, data analytics, automation, robotics, business technology and consulting etc. Showcasing this set of slides titled Telecom Technology Industry Report With Growth Drivers Pictures PDF. The topics addressed in these templates are Application Services, Cybersecurity Data, Other Market Drivers. All the content presented in this PPT design is completely editable. Download it and make adjustments in color, background, font etc. as per your unique business setting.

Actual Time Marketing Data Analysis Ppt PowerPoint Presentation Gallery Pictures PDF
The slide exhibits the evaluation of real-time marketing data to assess the program performance. Various KPIs included are planned and actual budget, real-time marketing benefits and year-wise budget allocation. Showcasing this set of slides titled Actual Time Marketing Data Analysis Ppt PowerPoint Presentation Gallery Pictures PDF. The topics addressed in these templates are Planned, Actual Budget, Budget Allocation, Real Time Marketing, Benefits. All the content presented in this PPT design is completely editable. Download it and make adjustments in color, background, font etc. as per your unique business setting.
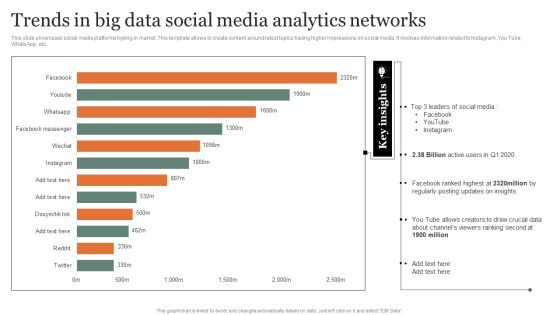
Trends In Big Data Social Media Analytics Networks Guidelines PDF
This slide showcases social media platforms hyping in market. This template allows to create content around latest topics having higher impressions on social media. It involves information related to Instagram, You Tube, WhatsApp, etc. Showcasing this set of slides titled Trends In Big Data Social Media Analytics Networks Guidelines PDF Topics. The topics addressed in these templates are Analytics Networks, Posting Updates, Ranking Second. All the content presented in this PPT design is completely editable. Download it and make adjustments in color, background, font etc. as per your unique business setting.
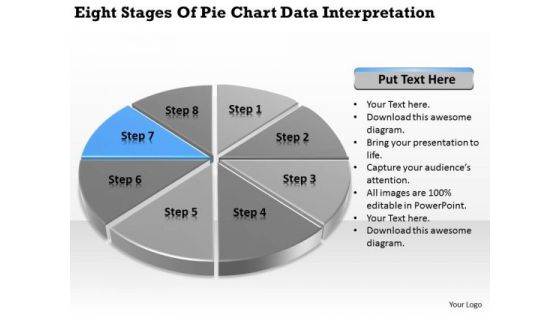
Stages Of Pie Chart Data Interpretation Business Plan Template PowerPoint Templates
We present our stages of pie chart data interpretation business plan template PowerPoint templates.Download and present our Circle Charts PowerPoint Templates because You can Stir your ideas in the cauldron of our PowerPoint Templates and Slides. Cast a magic spell on your audience. Download our Marketing PowerPoint Templates because Our PowerPoint Templates and Slides will let you Hit the target. Go the full distance with ease and elan. Use our Business PowerPoint Templates because Our PowerPoint Templates and Slides are truly out of this world. Even the MIB duo has been keeping tabs on our team. Download our Shapes PowerPoint Templates because Watching this your Audience will Grab their eyeballs, they wont even blink. Download our Process and Flows PowerPoint Templates because It will Give impetus to the hopes of your colleagues. Our PowerPoint Templates and Slides will aid you in winning their trust.Use these PowerPoint slides for presentations relating to achievement, analysis, background, bank, banking, business, calculation, chart, circle, commerce, commercial, commission, concept, credit, crisis, debt, deposit, design, detail, diagram, earnings, economics, economy, element, finance, goal, gold, golden, graph, graphic, growth, icon, idea, illustration, income, increase, invest, isolated, level, loss, market, marketing, metal, modern, money, new, object, part, percent, percentage, pie, plot, politics, profit, progress, ratio, reflection, reflective. The prominent colors used in the PowerPoint template are Blue, Gray, Black.
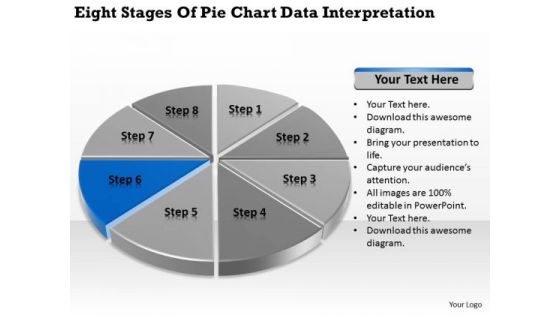
Stages Of Pie Chart Data Interpretation Example Business Plan PowerPoint Slides
We present our stages of pie chart data interpretation example business plan PowerPoint Slides.Download and present our Circle Charts PowerPoint Templates because It will let you Set new benchmarks with our PowerPoint Templates and Slides. They will keep your prospects well above par. Download our Marketing PowerPoint Templates because Our PowerPoint Templates and Slides will weave a web of your great ideas. They are gauranteed to attract even the most critical of your colleagues. Use our Business PowerPoint Templates because It will Strengthen your hand with your thoughts. They have all the aces you need to win the day. Present our Shapes PowerPoint Templates because It will get your audience in sync. Present our Process and Flows PowerPoint Templates because Our PowerPoint Templates and Slides will generate and maintain the level of interest you desire. They will create the impression you want to imprint on your audience.Use these PowerPoint slides for presentations relating to achievement, analysis, background, bank, banking, business, calculation, chart, circle, commerce, commercial, commission, concept, credit, crisis, debt, deposit, design, detail, diagram, earnings, economics, economy, element, finance, goal, gold, golden, graph, graphic, growth, icon, idea, illustration, income, increase, invest, isolated, level, loss, market, marketing, metal, modern, money, new, object, part, percent, percentage, pie, plot, politics, profit, progress, ratio, reflection, reflective. The prominent colors used in the PowerPoint template are Blue navy, Gray, Black.

Stages Of Pie Chart Data Interpretation How To Write Business Plan PowerPoint Templates
We present our stages of pie chart data interpretation how to write business plan PowerPoint templates.Present our Circle Charts PowerPoint Templates because Our PowerPoint Templates and Slides will provide you a launch platform. Give a lift off to your ideas and send them into orbit. Present our Marketing PowerPoint Templates because Our PowerPoint Templates and Slides will let you Hit the right notes. Watch your audience start singing to your tune. Use our Business PowerPoint Templates because Our PowerPoint Templates and Slides come in all colours, shades and hues. They help highlight every nuance of your views. Download our Shapes PowerPoint Templates because It can Leverage your style with our PowerPoint Templates and Slides. Charm your audience with your ability. Use our Process and Flows PowerPoint Templates because You can Connect the dots. Fan expectations as the whole picture emerges.Use these PowerPoint slides for presentations relating to achievement, analysis, background, bank, banking, business, calculation, chart, circle, commerce, commercial, commission, concept, credit, crisis, debt, deposit, design, detail, diagram, earnings, economics, economy, element, finance, goal, gold, golden, graph, graphic, growth, icon, idea, illustration, income, increase, invest, isolated, level, loss, market, marketing, metal, modern, money, new, object, part, percent, percentage, pie, plot, politics, profit, progress, ratio, reflection, reflective. The prominent colors used in the PowerPoint template are Blue, Gray, Black.

Pitch Presentation Raising Series C Funds Investment Company Current Market Scenario And Potential Mockup PDF
This slide shows the some of the key trends in E Commerce Industry like Increased Global Sales, higher demand for online products, higher online surfing etc. along with US luxury apparel market size. Deliver an awe inspiring pitch with this creative pitch presentation raising series c funds investment company current market scenario and potential mockup pdf bundle. Topics like industry, global, income, consumers, retail sales can be discussed with this completely editable template. It is available for immediate download depending on the needs and requirements of the user.

Predictive Analytics Methods Predictive Analytics In Banking And Finance Industry Pictures PDF
This slide represents the application of predictive analytics in the finance and banking sector as they deal with vast amounts of data. It helps these industries identify fraudulent transactions, generate credit score, monitor credit risks, and optimize cross-sell or up-sell possibilities. Coming up with a presentation necessitates that the majority of the effort goes into the content and the message you intend to convey. The visuals of a PowerPoint presentation can only be effective if it supplements and supports the story that is being told. Keeping this in mind our experts created Predictive Analytics Methods Predictive Analytics In Banking And Finance Industry Pictures PDF to reduce the time that goes into designing the presentation. This way, you can concentrate on the message while our designers take care of providing you with the right template for the situation.

Data In Stacked Format 6 Stages Small Business Plan Template PowerPoint Slides
We present our data in stacked format 6 stages small business plan template PowerPoint Slides.Download and present our Finance PowerPoint Templates because Our PowerPoint Templates and Slides provide you with a vast range of viable options. Select the appropriate ones and just fill in your text. Download our Marketing PowerPoint Templates because Our PowerPoint Templates and Slides will bullet point your ideas. See them fall into place one by one. Present our Spheres PowerPoint Templates because You can Create a matrix with our PowerPoint Templates and Slides. Feel the strength of your ideas click into place. Download and present our Business PowerPoint Templates because our PowerPoint Templates and Slides are the string of your bow. Fire of your ideas and conquer the podium. Present our Boxes PowerPoint Templates because Our PowerPoint Templates and Slides are aesthetically designed to attract attention. We gaurantee that they will grab all the eyeballs you need.Use these PowerPoint slides for presentations relating to Accounting, bar, business, chart, data, diagram, dimension, economy, education, finance, financial, flow, graph, graphic, grow, increase, information, investment, learning, management, market, money, performance, piece, process, profit, report, stack, statistic, success, think, transaction, trend, work. The prominent colors used in the PowerPoint template are Blue, Green, Black.
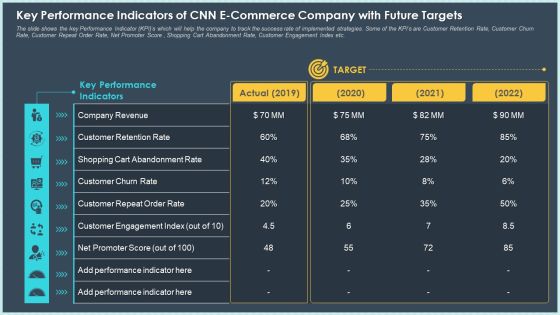
Key Performance Indicators Of CNN E Commerce Company With Future Targets Information PDF
The slide shows the key Performance Indicator KPIs which will help the company to track the success rate of implemented strategies. Some of the KPIs are Customer Retention Rate, Customer Churn Rate, Customer Repeat Order Rate, Net Promoter Score , Shopping Cart Abandonment Rate, Customer Engagement Index etc. Deliver an awe-inspiring pitch with this creative key performance indicators of cnn e commerce company with future targets information pdf bundle. Topics like customer churn rate, company revenue, performance indicator can be discussed with this completely editable template. It is available for immediate download depending on the needs and requirements of the user.
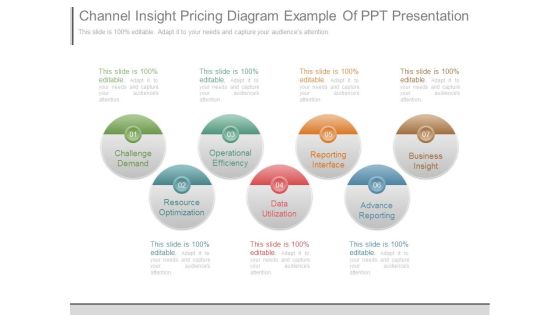
Channel Insight Pricing Diagram Example Of Ppt Presentation
This is a channel insight pricing diagram example of ppt presentation. This is a seven stage process. The stages in this process are challenge demand, operational efficiency, reporting interface, business insight, resource optimization, data utilization, advance reporting.

Information Analysis Journey To Achieve Return On Investment Ppt File Slide Download PDF
This slide showcase data analytics effective transformation journey to achieve organizational data explicitly with industry investment. It includes understanding requirement, data engineering, workflow integration, data acquisition, data visualization and outcomes. Presenting Information Analysis Journey To Achieve Return On Investment Ppt File Slide Download PDF to dispense important information. This template comprises six stages. It also presents valuable insights into the topics including Understanding Requirements, Data Acquisition, Data Engineering. This is a completely customizable PowerPoint theme that can be put to use immediately. So, download it and address the topic impactfully.

Bank Website Data Reference Diagram Mockup PDF
This slide showcases data architecture diagram of website that depicts various sections and contents. The diagram includes users, delivery channels, core business processes, information and technology enablers. Showcasing this set of slides titled Bank Website Data Reference Diagram Mockup PDF. The topics addressed in these templates are Core Business Process, Data Information, Technology Enablers. All the content presented in this PPT design is completely editable. Download it and make adjustments in color, background, font etc. as per your unique business setting.

Assessment And Market Position Of Competitors Product Product Range Ppt PowerPoint Presentation Pictures Design Ideas
This is a assessment and market position of competitors product product range ppt powerpoint presentation pictures design ideas. This is a five stage process. The stages in this process are design, price, performance, quality, additional functions.

Assessment And Market Position Of Competitors Product Product Range Ppt PowerPoint Presentation Pictures Icons
This is a assessment and market position of competitors product product range ppt powerpoint presentation pictures icons. This is a four stage process. The stages in this process are design, price, performance, quality, additional functions.
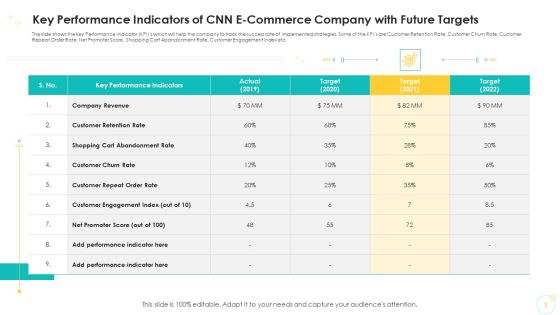
Key Performance Indicators Of CNN E Commerce Company With Future Targets Formats PDF
The slide shows the key Performance Indicator KPIs which will help the company to track the success rate of implemented strategies. Some of the KPIs are Customer Retention Rate, Customer Churn Rate, Customer Repeat Order Rate, Net Promoter Score , Shopping Cart Abandonment Rate, Customer Engagement Index etc.Deliver an awe-inspiring pitch with this creative key performance indicators of CNN e commerce company with future targets formats pdf. bundle. Topics like customer retention rate, net promoter score can be discussed with this completely editable template. It is available for immediate download depending on the needs and requirements of the user.

Key Performance Indicators Of CNN E Commerce Company With Future Targets Slides PDF
The slide shows the key Performance Indicator KPIs which will help the company to track the success rate of implemented strategies. Some of the KPIs are Customer Retention Rate, Customer Churn Rate, Customer Repeat Order Rate, Net Promoter Score , Shopping Cart Abandonment Rate, Customer Engagement Index etc.Deliver and pitch your topic in the best possible manner with this key performance indicators of CNN e commerce company with future targets slides pdf. Use them to share invaluable insights on shopping cart abandonment rate, customer repeat order rate and impress your audience. This template can be altered and modified as per your expectations. So, grab it now.

Key Performance Indicators Of CNN E Commerce Company With Future Targets Diagrams PDF
The slide shows the key Performance Indicator KPIs which will help the company to track the success rate of implemented strategies. Some of the KPIs are Customer Retention Rate, Customer Churn Rate, Customer Repeat Order Rate, Net Promoter Score , Shopping Cart Abandonment Rate, Customer Engagement Index etc.Deliver and pitch your topic in the best possible manner with this key performance indicators of CNN e commerce company with future targets diagrams pdf. Use them to share invaluable insights on customer retention rate, shopping cart abandonment rate, 2019 to 2022 and impress your audience. This template can be altered and modified as per your expectations. So, grab it now.
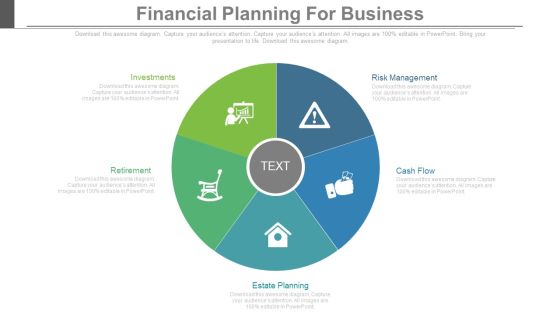
Financial Planning For Business Ppt Slides
This is a financial planning for business ppt slides. This is a five stage process. The stages in this process are business, success, marketing.
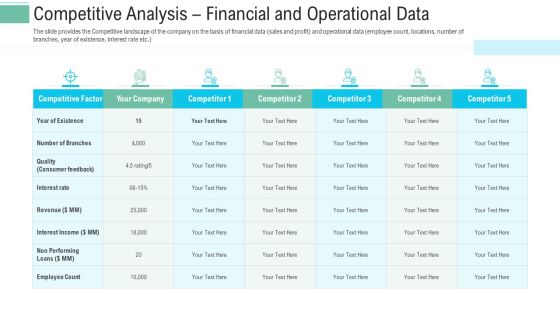
Pitch Presentation Raise Money Spot Market Competitive Analysis Financial And Operational Data Structure PDF
The slide provides the Competitive landscape of the company on the basis of financial data sales and profit and operational data employee count, locations, number of branches, year of existence, interest rate etc. Deliver and pitch your topic in the best possible manner with this pitch presentation raise money spot market competitive analysis financial and operational data structure pdf. Use them to share invaluable insights on consumer feedback, revenue, interest rate and impress your audience. This template can be altered and modified as per your expectations. So, grab it now.

Applicant Selection Employee Hiring Vector Icon Ppt Powerpoint Presentation Show Influencers
This is a applicant selection employee hiring vector icon ppt powerpoint presentation show influencers. This is a one stage process. The stages in this process are recruitment icon, hiring icon, staffing icon.
Employee Search Vector Icon Ppt Powerpoint Presentation Model Themes
This is a employee search vector icon ppt powerpoint presentation model themes. This is a three stage process. The stages in this process are recruitment icon, hiring icon, staffing icon.
 Home
Home