AI PPT Maker
Templates
PPT Bundles
Design Services
Business PPTs
Business Plan
Management
Strategy
Introduction PPT
Roadmap
Self Introduction
Timelines
Process
Marketing
Agenda
Technology
Medical
Startup Business Plan
Cyber Security
Dashboards
SWOT
Proposals
Education
Pitch Deck
Digital Marketing
KPIs
Project Management
Product Management
Artificial Intelligence
Target Market
Communication
Supply Chain
Google Slides
Research Services
 One Pagers
All Categories
-
Home
- Customer Favorites
- Comparison Dashboard
Comparison Dashboard
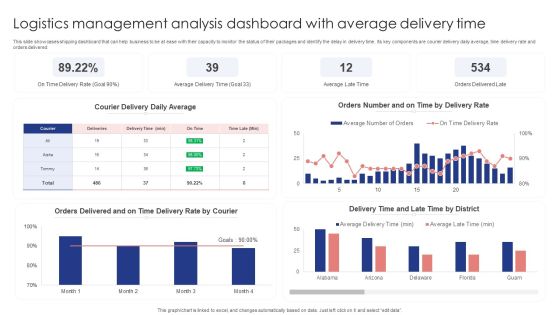
Logistics Management Analysis Dashboard With Average Delivery Time Themes PDF
This slide showcases shipping dashboard that can help business to be at ease with their capacity to monitor the status of their packages and identify the delay in delivery time. Its key components are courier delivery daily average, time delivery rate and orders delivered. Showcasing this set of slides titled Logistics Management Analysis Dashboard With Average Delivery Time Themes PDF. The topics addressed in these templates are Courier Delivery Daily Average, Delivery Rate, Orders Delivered. All the content presented in this PPT design is completely editable. Download it and make adjustments in color, background, font etc. as per your unique business setting.

Logistics Management Revenue Analysis Dashboard With Orders Revenue Brochure PDF
This slide showcases shipping dashboard that can help company to calculate the revenue generated from delivered products and track the monthly order status. Its key components are highest revenue days, subscription revenue, order status, order revenue and transaction paid status. Showcasing this set of slides titled Logistics Management Revenue Analysis Dashboard With Orders Revenue Brochure PDF. The topics addressed in these templates are Order Revenue, Transaction Paid, Subscription Revenue. All the content presented in this PPT design is completely editable. Download it and make adjustments in color, background, font etc. as per your unique business setting.
Logistics Management Time Tracking Dashboard With Warehousing Costs Template PDF
This slide showcases shipping dashboard that can help company to deliver the products in stipulated time and keep warehousing operating expenses within pre decided budget. Its also displays perfect order rate and total shipments by country. Pitch your topic with ease and precision using this Logistics Management Time Tracking Dashboard With Warehousing Costs Template PDF. This layout presents information on Warehouse Operating Costs, Perfect Order Rate, On Time Shipments. It is also available for immediate download and adjustment. So, changes can be made in the color, design, graphics or any other component to create a unique layout.
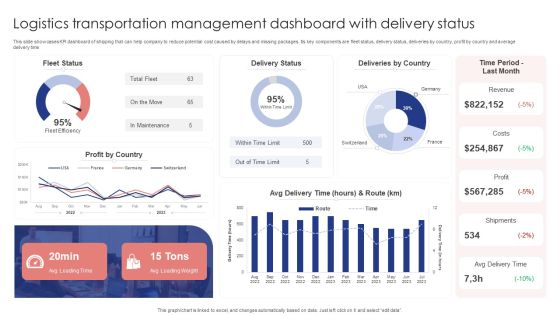
Logistics Transportation Management Dashboard With Delivery Status Portrait PDF
This slide showcases KPI dashboard of shipping that can help company to reduce potential cost caused by delays and missing packages. Its key components are fleet status, delivery status, deliveries by country, profit by country and average delivery time. Showcasing this set of slides titled Logistics Transportation Management Dashboard With Delivery Status Portrait PDF. The topics addressed in these templates are Fleet Status, Delivery Status, Deliveries By Country. All the content presented in this PPT design is completely editable. Download it and make adjustments in color, background, font etc. as per your unique business setting.

Share Market Dashboard Indicating Candlestick Time Series Formats PDF
Following slide showcase stock market KPI dashboard which will assist company to understand stock performance. It provides information about open, close, highest and lowest price of stock on particular day, candlestick time series etc. Pitch your topic with ease and precision using this Share Market Dashboard Indicating Candlestick Time Series Formats PDF. This layout presents information on Candlestick Time Series, Stock Change, US Sector. It is also available for immediate download and adjustment. So, changes can be made in the color, design, graphics or any other component to create a unique layout.
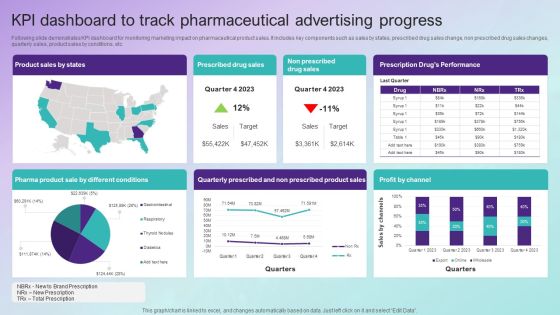
KPI Dashboard To Track Pharmaceutical Advertising Progress Topics PDF
Following slide demonstrates KPI dashboard for monitoring marketing impact on pharmaceutical product sales. It includes key components such as sales by states, prescribed drug sales change, non prescribed drug sales changes, quarterly sales, product sales by conditions, etc. Showcasing this set of slides titled KPI Dashboard To Track Pharmaceutical Advertising Progress Topics PDF. The topics addressed in these templates are Product Sales By States, Prescribed Drug Sales, Non Prescribed Drug Sales, Profit By Channel. All the content presented in this PPT design is completely editable. Download it and make adjustments in color, background, font etc. as per your unique business setting.
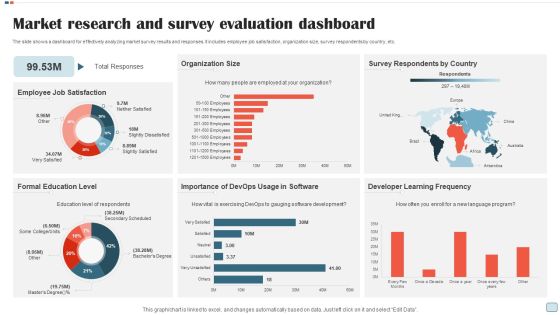
Market Research And Survey Evaluation Dashboard Rules PDF
The slide shows a dashboard for effectively analyzing market survey results and responses. It includes employee job satisfaction, organization size, survey respondents by country, etc. Pitch your topic with ease and precision using this Market Research And Survey Evaluation Dashboard Rules PDF. This layout presents information on Employee Job Satisfaction, Organization Size, Survey Respondents By Country. It is also available for immediate download and adjustment. So, changes can be made in the color, design, graphics or any other component to create a unique layout.

KPI Dashboard To Measure Performance Of Saas Company Introduction PDF
This slide provides an overview of the SaaS metrics dashboard. The company can track the overall progress of their business model by tracking metrics such as quality leads, ARPA, signups past 4 weeks, net MRR churn rate, new business MRR, etc. Pitch your topic with ease and precision using this KPI Dashboard To Measure Performance Of Saas Company Introduction PDF. This layout presents information on Industry, Position, Customers, Quality Leads. It is also available for immediate download and adjustment. So, changes can be made in the color, design, graphics or any other component to create a unique layout.
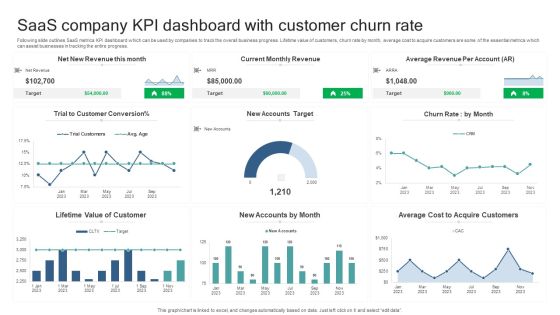
Saas Company KPI Dashboard With Customer Churn Rate Microsoft PDF
Following slide outlines SaaS metrics KPI dashboard which can be used by companies to track the overall business progress. Lifetime value of customers, churn rate by month, average cost to acquire customers are some of the essential metrics which can assist businesses in tracking the entire progress. Pitch your topic with ease and precision using this Saas Company KPI Dashboard With Customer Churn Rate Microsoft PDF. This layout presents information on Lifetime Value Of Customer, New Accounts By Month, Average Cost Acquire Customers. It is also available for immediate download and adjustment. So, changes can be made in the color, design, graphics or any other component to create a unique layout.
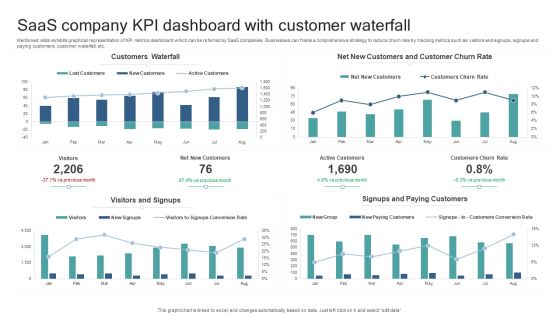
Saas Company KPI Dashboard With Customer Waterfall Slides PDF
Mentioned slide exhibits graphical representation of KPI metrics dashboard which can be referred by SaaS companies. Businesses can frame a comprehensive strategy to reduce churn rate by tracking metrics such as visitors and signups, signups and paying customers, customer waterfall, etc. Pitch your topic with ease and precision using this Saas Company KPI Dashboard With Customer Waterfall Slides PDF. This layout presents information on Customers Waterfall, Visitors And Signups, Signups And Paying Customers. It is also available for immediate download and adjustment. So, changes can be made in the color, design, graphics or any other component to create a unique layout.

Website Analytics Dashboard To Track Business Performance Guidelines PDF
This slide exhibits visual report to track web performance metrics such as bounce rates, conversion rate, etc. It focuses on visualizing how effectively any website is converting traffic. It involves information related to number of users, page visitors, etc. Pitch your topic with ease and precision using this Website Analytics Dashboard To Track Business Performance Guidelines PDF. This layout presents information on Website Analytics, Dashboard To Track, Business Performance. It is also available for immediate download and adjustment. So, changes can be made in the color, design, graphics or any other component to create a unique layout.

Dashboard For Assessing Project Team Productivity Report Mockup PDF
This slide depicts a dashboard for monitoring team productivity reports in project management. It covers various areas such as billing by the consumer, productivity reports, employee billable hours, etc. Pitch your topic with ease and precision using this Dashboard For Assessing Project Team Productivity Report Mockup PDF. This layout presents information on Billing Expense Customer, Employee Productivity Report, Profitability Customer. It is also available for immediate download and adjustment. So, changes can be made in the color, design, graphics or any other component to create a unique layout.
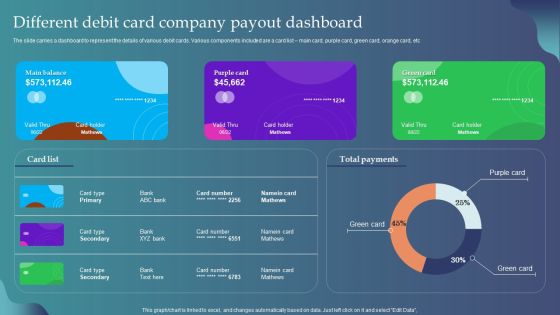
Different Debit Card Company Payout Dashboard Ppt Pictures Inspiration PDF
The slide carries a dashboard to represent the details of various debit cards. Various components included are a card list main card, purple card, green card, orange card, etc. Showcasing this set of slides titled Different Debit Card Company Payout Dashboard Ppt Pictures Inspiration PDF. The topics addressed in these templates are Main Balance, Purple Card, Green Card, Total Payments. All the content presented in this PPT design is completely editable. Download it and make adjustments in color, background, font etc. as per your unique business setting.

Inventory Management Dashboard To Forecasting Stock Budget Elements PDF
The following slide depicts the inventory analysis dashboard to determine inventory accuracy. It includes elements such as order cycle time, stock trend, ratio analysis, product wise inventory analysis etc. Pitch your topic with ease and precision using this Inventory Management Dashboard To Forecasting Stock Budget Elements PDF. This layout presents information on Inventory Ratio Analysis, Product Wise Inventory Analysis, Stock Trend. It is also available for immediate download and adjustment. So, changes can be made in the color, design, graphics or any other component to create a unique layout.
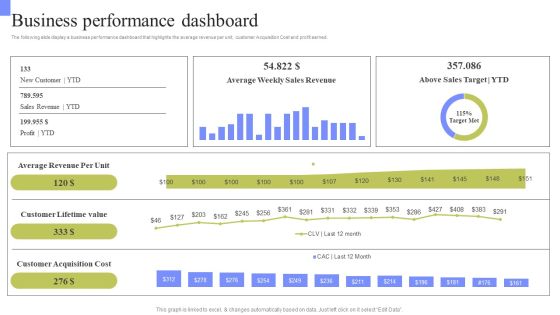
Periodic Revenue Model Business Performance Dashboard Rules PDF
The following slide display a business performance dashboard that highlights the average revenue per unit, customer Acquisition Cost and profit earned. This Periodic Revenue Model Business Performance Dashboard Rules PDF from Slidegeeks makes it easy to present information on your topic with precision. It provides customization options, so you can make changes to the colors, design, graphics, or any other component to create a unique layout. It is also available for immediate download, so you can begin using it right away. Slidegeeks has done good research to ensure that you have everything you need to make your presentation stand out. Make a name out there for a brilliant performance.

Cut Of Procurement Cost Dashboard With Spend Analysis Elements PDF
This slide showcases containment cost dashboard to identify and formulate appropriate expense reduction strategies for the company. It includes components such as product grouping, contact overview, top vendors, etc. Showcasing this set of slides titled Cut Of Procurement Cost Dashboard With Spend Analysis Elements PDF. The topics addressed in these templates are Spend Category, Product Grouping, Contract Overview. All the content presented in this PPT design is completely editable. Download it and make adjustments in color, background, font etc. as per your unique business setting.

Continuous Process Improvement KPI Dashboard For IT Industry Clipart PDF
Following slide depicts the IT industry KPI dashboard which will assist in generating more of profit by improving strategic plan according to changing environment with clients preferences .The KPI mentioned in a slide are such as risk analysis, outstanding task , upcoming task, budget analysis, etc. Pitch your topic with ease and precision using this Continuous Process Improvement KPI Dashboard For IT Industry Clipart PDF. This layout presents information on Overall Progress, Risk Analysis, Budget Analysis. It is also available for immediate download and adjustment. So, changes can be made in the color, design, graphics or any other component to create a unique layout.
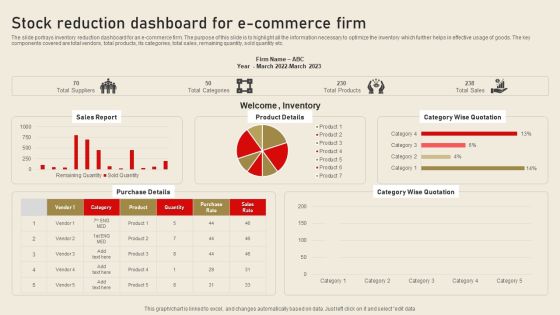
Stock Reduction Dashboard For E Commerce Firm Ideas PDF
The slide portrays inventory reduction dashboard for an e commerce firm. The purpose of this slide is to highlight all the information necessary to optimize the inventory which further helps in effective usage of goods. The key components covered are total vendors, total products, its categories, total sales, remaining quantity, sold quantity etc. Showcasing this set of slides titled Stock Reduction Dashboard For E Commerce Firm Ideas PDF. The topics addressed in these templates are Sales Report, Product Details, Category Wise Quotation. All the content presented in this PPT design is completely editable. Download it and make adjustments in color, background, font etc. as per your unique business setting.

Metric Dashboard To Track Supplier Diversity And Performance Designs PDF
This slide represents KPI dashboard for tracking supplier diversity in organization and measure performance. It provides information regarding organization spending cost, supplier count, diversity type, status etc. Pitch your topic with ease and precision using this Metric Dashboard To Track Supplier Diversity And Performance Designs PDF. This layout presents information on Diversity Type, Diversity Status, Diverse Supplier. It is also available for immediate download and adjustment. So, changes can be made in the color, design, graphics or any other component to create a unique layout.

Dashboard For Tracking Sales Order Processing Rate Inspiration PDF
The following slide showcases sales order fulfilment rate dashboard to measure efficiency of shipping, process and packaging. It includes components such as partially fulfilled orders, pending orders, total number of orders etc. Showcasing this set of slides titled Dashboard For Tracking Sales Order Processing Rate Inspiration PDF. The topics addressed in these templates are Order Fulfilment, Partially Fulfilled, Pending. All the content presented in this PPT design is completely editable. Download it and make adjustments in color, background, font etc. as per your unique business setting.
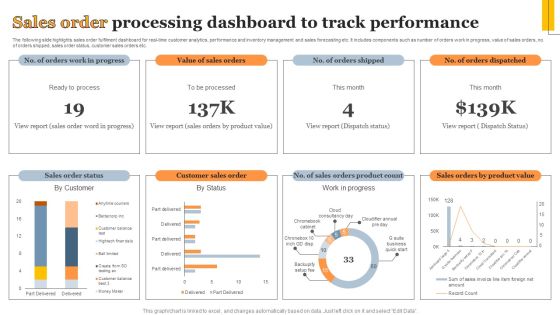
Sales Order Processing Dashboard To Track Performance Information PDF
The following slide highlights sales order fulfilment dashboard for real-time customer analytics, performance and inventory management and sales forecasting etc. It includes components such as number of orders work in progress, value of sales orders, no. of orders shipped, sales order status, customer sales orders etc. Showcasing this set of slides titled Sales Order Processing Dashboard To Track Performance Information PDF. The topics addressed in these templates are Sales Order Status, Customer Sales Order, Work Progress. All the content presented in this PPT design is completely editable. Download it and make adjustments in color, background, font etc. as per your unique business setting.

Strategic Kpi Dashboard To Reporting Project Progress Sample PDF
Following slide demonstrates strategic plan progress tracking dashboard to determine business performance. It includes strategy progress such as pending, on track, disruption, major problems, discontinued strategy and completed strategy Pitch your topic with ease and precision using this Strategic Kpi Dashboard To Reporting Project Progress Sample PDF. This layout presents information on Overall Summary, Plan Summary, Growth Rate. It is also available for immediate download and adjustment. So, changes can be made in the color, design, graphics or any other component to create a unique layout.

Employee Retention And Turnover Rates Monitoring Dashboard Mockup PDF
This slide showcases a dashboard to supervise and monitor employee retention and turnover score. It includes key components such as active employees, hires, exits, retention rate, turnover rate, etc. If your project calls for a presentation, then Slidegeeks is your go to partner because we have professionally designed, easy to edit templates that are perfect for any presentation. After downloading, you can easily edit Employee Retention And Turnover Rates Monitoring Dashboard Mockup PDF and make the changes accordingly. You can rearrange slides or fill them with different images. Check out all the handy templates

Market Share Growth Dashboard For Business Feasibility Study Demonstration PDF
This slide showcases dashboard for market share growth that can help company to estimate the potential for profits and analyze business feasibility. Its key components are last year market share, last year relative market share, YOY relative market share growth and YOY growth Showcasing this set of slides titled Market Share Growth Dashboard For Business Feasibility Study Demonstration PDF. The topics addressed in these templates are Market Share, Feasibility Study, Growth. All the content presented in this PPT design is completely editable. Download it and make adjustments in color, background, font etc. as per your unique business setting.

Digital Advertising Campaign Dashboard For Effective Performance Management Sample PDF
This slide represents dashboard showcasing digital marketing campaign performance which helps track project progress. It provides information regarding campaign cost, conversions, ad impressions, cost per click etc. Pitch your topic with ease and precision using this Digital Advertising Campaign Dashboard For Effective Performance Management Sample PDF. This layout presents information on Total Campaign Cost, Conversions, Ad Impressions, Cost Per Click, Cost Per Ad Impressions. It is also available for immediate download and adjustment. So, changes can be made in the color, design, graphics or any other component to create a unique layout.

Skill Enhancement Plan Dashboard For Training Program Evaluation Download PDF
This slide showcases dashboard that can help organization to evaluate the training program implemented in organization. Its key components are training cost, number of participants, hours of training, cost per participant and occupancy rate. From laying roadmaps to briefing everything in detail, our templates are perfect for you. You can set the stage with your presentation slides. All you have to do is download these easy-to-edit and customizable templates. Skill Enhancement Plan Dashboard For Training Program Evaluation Download PDF will help you deliver an outstanding performance that everyone would remember and praise you for. Do download this presentation today.
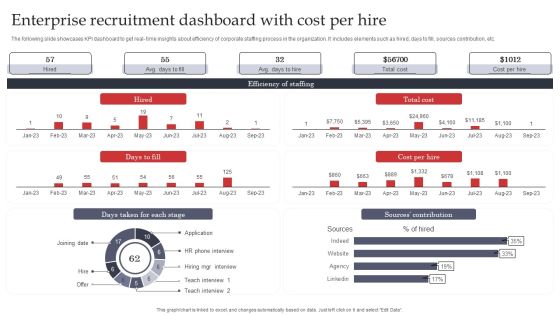
Enterprise Recruitment Dashboard With Cost Per Hire Graphics PDF
The following slide showcases KPI dashboard to get real- time insights about efficiency of corporate staffing process in the organization. It includes elements such as hired, days to fill, sources contribution, etc. Pitch your topic with ease and precision using this Enterprise Recruitment Dashboard With Cost Per Hire Graphics PDF. This layout presents information on Enterprise, Contribution, Cost. It is also available for immediate download and adjustment. So, changes can be made in the color, design, graphics or any other component to create a unique layout.

Energy Monitoring Dashboard With Emission Rate Mockup PDF
The slide showcases energy monitoring dashboard which showcases the monthly energy consumption and emission rate of a facility. It covers cost predicted, change in cost, usage estimate, energy intensity and carbon footprint or emission rate. Pitch your topic with ease and precision using this Energy Monitoring Dashboard With Emission Rate Mockup PDF. This layout presents information on Active Appliances, Cost Predicted, Energy Intensity. It is also available for immediate download and adjustment. So, changes can be made in the color, design, graphics or any other component to create a unique layout.

Customer Segmentation Dashboard For Market Research Ppt Portfolio Format PDF
The following slide presents a customer segmentation dashboard distributing customers on demographics basis. It includes key components such as gender, technology adoption lifecycle, education and brand innovation consent. Find a pre designed and impeccable Customer Segmentation Dashboard For Market Research Ppt Portfolio Format PDF. The templates can ace your presentation without additional effort. You can download these easy to edit presentation templates to make your presentation stand out from others. So, what are you waiting for Download the template from Slidegeeks today and give a unique touch to your presentation.

Vendor Quality Performance KPI Dashboard For Distributors Template PDF
This slide exhibits vendor performance annual dashboard that track supply chain strategies and reduce cost and increase margins. It includes elements such as purchasing value, quality performance, supplier wise purchase value, etc. Pitch your topic with ease and precision using this Vendor Quality Performance KPI Dashboard For Distributors Template PDF. This layout presents information on Purchase Value, Quality Performance, Supplier Wise Purchase Value. It is also available for immediate download and adjustment. So, changes can be made in the color, design, graphics or any other component to create a unique layout.
KPI Dashboard To Monitor Land Asset Management Practices Clipart PDF
Following slide demonstrate KPI dashboard for tracking expenses incurred on real estate asset maintenance and to reduce operational cost. It includes elements such as net income, monthly income and expenses, last quarter rent collection status, rental revenue , budget, etc. Pitch your topic with ease and precision using this KPI Dashboard To Monitor Land Asset Management Practices Clipart PDF. This layout presents information on Revenue, Budget, Income. It is also available for immediate download and adjustment. So, changes can be made in the color, design, graphics or any other component to create a unique layout.
Dashboard To Track Automated Manufacturing Workflow Progress Professional PDF
Following slide demonstrates KPI dashboard for monitoring automated manufacturing processes performance which can be used by businesses to increase organization efficiency. It includes key components such as total business revenue, Number of customers, total units produced, production rate, monthly production by manufacturing lines, etc. Showcasing this set of slides titled Dashboard To Track Automated Manufacturing Workflow Progress Professional PDF. The topics addressed in these templates are Machine Utilization, Product Delivery, Defective Units Produced. All the content presented in this PPT design is completely editable. Download it and make adjustments in color, background, font etc. as per your unique business setting.

Dashboard To Track Effectiveness Of Owned Media Marketing Structure PDF
This slide illustrates a dashboard which can be used by brand managers to track the effectiveness of earned media in the domain of digital marketing. The key elements include brand mentions, social media reach, customer interactions, positive and negative feedback Pitch your topic with ease and precision using this Dashboard To Track Effectiveness Of Owned Media Marketing Structure PDF. This layout presents information on Brand Mentions, Social Media, Marketing. It is also available for immediate download and adjustment. So, changes can be made in the color, design, graphics or any other component to create a unique layout.

Business Units Risk Ratings And Analysis Software Dashboard Ideas PDF
This slide covers risk distribution among different business units. It also includes inherent risk ratings for anti-bribery, commodity markets, competition, cyber security along with residual risk distribution matrix. Pitch your topic with ease and precision using this Business Units Risk Ratings And Analysis Software Dashboard Ideas PDF. This layout presents information on Risk Dashboard, Inherent Risk Medium, Controls Rising Weak. It is also available for immediate download and adjustment. So, changes can be made in the color, design, graphics or any other component to create a unique layout.
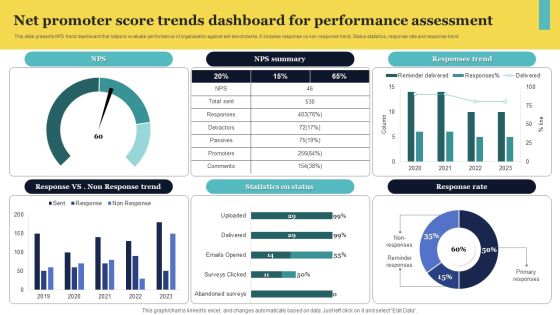
Net Promoter Score Trends Dashboard For Performance Assessment Elements PDF
This slide presents NPS trend dashboard that helps to evaluate performance of organisation against set benchmarks. It includes response vs non-response trend, Status statistics, response rate and response trend Pitch your topic with ease and precision using this Net Promoter Score Trends Dashboard For Performance Assessment Elements PDF. This layout presents information on Response Trend, Summary, Status. It is also available for immediate download and adjustment. So, changes can be made in the color, design, graphics or any other component to create a unique layout.
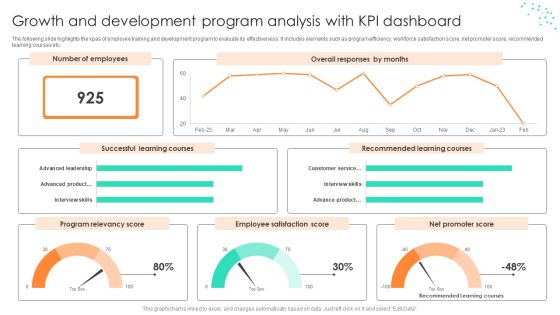
Growth And Development Program Analysis With KPI Dashboard Structure PDF
The following slide highlights the kpas of employee training and development program to evaluate its effectiveness. It includes elements such as program efficiency, workforce satisfaction score, net promoter score, recommended learning courses etc. Pitch your topic with ease and precision using this Growth And Development Program Analysis With KPI Dashboard Structure PDF. This layout presents information on Analysis With KPI Dashboard, Growth And Development Program. It is also available for immediate download and adjustment. So, changes can be made in the color, design, graphics or any other component to create a unique layout.
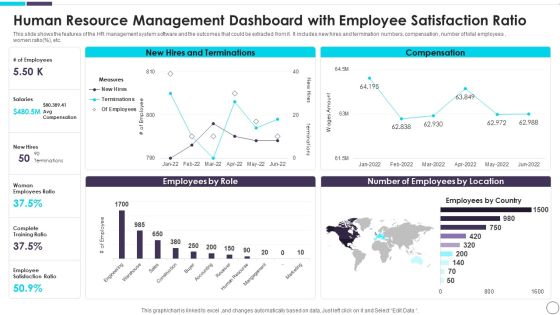
Human Resource Management Dashboard With Employee Satisfaction Ratio Inspiration PDF
This slide shows the features of the HR management system software and the outcomes that could be extracted from it. It includes new hires and termination numbers, compensation , number of total employees , women ratio persent, etc. Showcasing this set of slides titled Human Resource Management Dashboard With Employee Satisfaction Ratio Inspiration PDF The topics addressed in these templates are Human Resource Management Dashboard With Employee Satisfaction Ratio All the content presented in this PPT design is completely editable. Download it and make adjustments in color, background, font etc. as per your unique business setting.
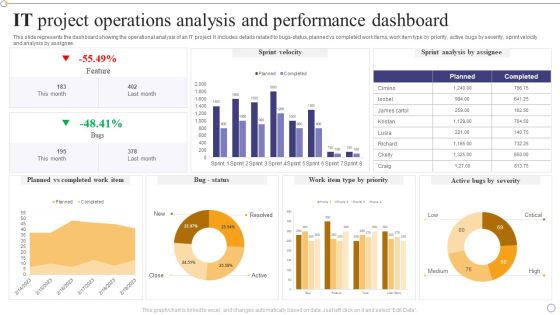
IT Project Operations Analysis And Performance Dashboard Themes PDF
This slide represents the dashboard showing the operational analysis of an IT project. It includes details related to bugs-status, planned vs completed work items, work item type by priority, active bugs by severity, sprint velocity and analysis by assignee.Showcasing this set of slides titled IT Project Operations Analysis And Performance Dashboard Themes PDF. The topics addressed in these templates are Planned Completed, Sprint Analysis, Feature. All the content presented in this PPT design is completely editable. Download it and make adjustments in color, background, font etc. as per your unique business setting.
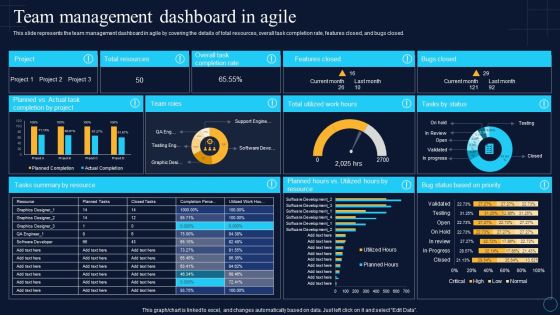
Team Management Dashboard In Agile Software Development Approaches Themes PDF
This slide represents the team management dashboard in agile by covering the details of total resources, overall task completion rate, features closed, and bugs closed.Welcome to our selection of the Team Management Dashboard In Agile Software Development Approaches Themes PDF. These are designed to help you showcase your creativity and bring your sphere to life. Planning and Innovation are essential for any business that is just starting out. This collection contains the designs that you need for your everyday presentations. All of our PowerPoints are 100 precent editable, so you can customize them to suit your needs. This multi-purpose template can be used in various situations. Grab these presentation templates today.

Sales Opportunity Monitoring Dashboard Ppt Professional Mockup PDF
This Sales Opportunity Monitoring Dashboard Ppt Professional Mockup PDF is perfect for any presentation, be it in front of clients or colleagues. It is a versatile and stylish solution for organizing your meetings. The Sales Opportunity Monitoring Dashboard Ppt Professional Mockup PDF features a modern design for your presentation meetings. The adjustable and customizable slides provide unlimited possibilities for acing up your presentation. Slidegeeks has done all the homework before launching the product for you. So, do not wait, grab the presentation templates today
Social Media Performance Tracking And Monitoring Dashboard Mockup PDF
The following slide showcases a dashboard to track and measure social media platforms performance. It includes key elements such as website traffic, social media referral rate, site revenue, social media site revenue, etc. This Social Media Performance Tracking And Monitoring Dashboard Mockup PDF is perfect for any presentation, be it in front of clients or colleagues. It is a versatile and stylish solution for organizing your meetings. The product features a modern design for your presentation meetings. The adjustable and customizable slides provide unlimited possibilities for acing up your presentation. Slidegeeks has done all the homework before launching the product for you. So, do not wait, grab the presentation templates today
Social Media Performance Tracking And Monitoring Dashboard Information PDF
The following slide showcases a dashboard to track and measure social media platforms performance. It includes key elements such as website traffic, social media referral rate, site revenue, social media site revenue, etc. This Social Media Performance Tracking And Monitoring Dashboard Information PDF is perfect for any presentation, be it in front of clients or colleagues. It is a versatile and stylish solution for organizing your meetings. The product features a modern design for your presentation meetings. The adjustable and customizable slides provide unlimited possibilities for acing up your presentation. Slidegeeks has done all the homework before launching the product for you. So, do not wait, grab the presentation templates today
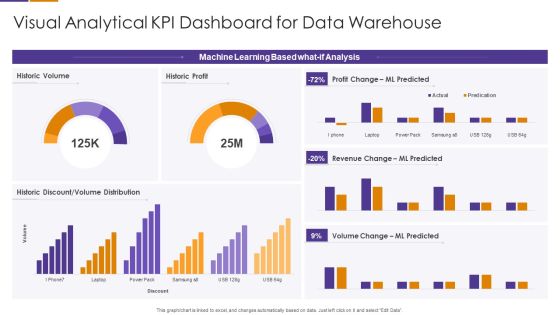
Visual Analytical KPI Dashboard For Data Warehouse Template PDF
Pitch your topic with ease and precision using this Visual Analytical KPI Dashboard For Data Warehouse Template PDF This layout presents information on Machine Learning Based, Volume Change, Revenue Change It is also available for immediate download and adjustment. So, changes can be made in the color, design, graphics or any other component to create a unique layout.
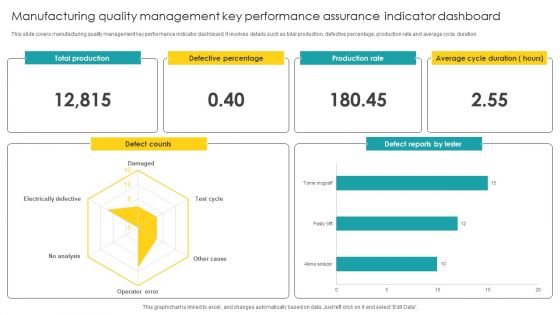
Manufacturing Quality Management Key Performance Assurance Indicator Dashboard Microsoft PDF
Pitch your topic with ease and precision using this Manufacturing Quality Management Key Performance Assurance Indicator Dashboard Microsoft PDF. This layout presents information on Quality Management, Key Performance Assurance. It is also available for immediate download and adjustment. So, changes can be made in the color, design, graphics or any other component to create a unique layout.
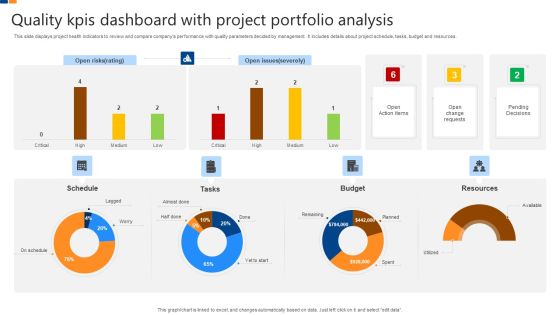
Quality Kpis Dashboard With Project Portfolio Analysis Download PDF
This slide displays project health indicators to review and compare companys performance with quality parameters decided by management. It includes details about project schedule, tasks, budget and resources. Showcasing this set of slides titled Quality Kpis Dashboard With Project Portfolio Analysis Download PDF. The topics addressed in these templates are Schedule, Tasks, Budget, Resources. All the content presented in this PPT design is completely editable. Download it and make adjustments in color, background, font etc. as per your unique business setting.
Transformation KPI Dashboard With Key Metrics And Status Icons PDF
Pitch your topic with ease and precision using this Transformation KPI Dashboard With Key Metrics And Status Icons PDF. This layout presents information on Measure, System Implemented, Innovation. It is also available for immediate download and adjustment. So, changes can be made in the color, design, graphics or any other component to create a unique layout.
KPI Dashboard Showing Warehouse Data And Fleet Status Icons PDF
Pitch your topic with ease and precision using this KPI Dashboard Showing Warehouse Data And Fleet Status Icons PDF This layout presents information on Deliveries By Country, Delivery Status, Profit By Country It is also available for immediate download and adjustment. So, changes can be made in the color, design, graphics or any other component to create a unique layout.
Warehouse Data KPI With Order Performance Dashboard Icons PDF
Pitch your topic with ease and precision using this Warehouse Data KPI With Order Performance Dashboard Icons PDF This layout presents information on Inventory Accuracy, Order Accuracy Europe, Total Accuracy It is also available for immediate download and adjustment. So, changes can be made in the color, design, graphics or any other component to create a unique layout.

Mobile App Quality Control Dashboard With Test Log Graphics PDF
Pitch your topic with ease and precision using this Mobile App Quality Control Dashboard With Test Log Graphics PDF. This layout presents information on Arrangement, Elements, Data. It is also available for immediate download and adjustment. So, changes can be made in the color, design, graphics or any other component to create a unique layout.

Dashboard Depicting Company Book Value With Calculations Microsoft PDF
Pitch your topic with ease and precision using this dashboard depicting company book value with calculations microsoft pdf. This layout presents information on cash, investments, personal, retirement, secured. It is also available for immediate download and adjustment. So, changes can be made in the color, design, graphics or any other component to create a unique layout.

Project Procurement Planning And Management Dashboard Designs PDF
Pitch your topic with ease and precision using this project procurement planning and management dashboard designs pdf. This layout presents information on suppliers, market share, procurement. It is also available for immediate download and adjustment. So, changes can be made in the color, design, graphics or any other component to create a unique layout.

Project Procurement Quality Management And Planning Dashboard Slides PDF
Pitch your topic with ease and precision using this project procurement quality management and planning dashboard slides pdf. This layout presents information on budget, purchases, suppliers. It is also available for immediate download and adjustment. So, changes can be made in the color, design, graphics or any other component to create a unique layout.
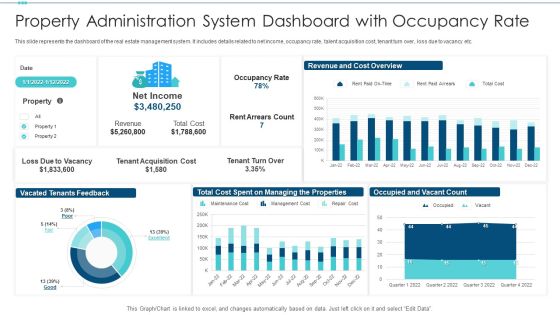
Property Administration System Dashboard With Occupancy Rate Infographics PDF
Pitch your topic with ease and precision using this property administration system dashboard with occupancy rate infographics pdf. This layout presents information on revenue, cost, occupancy rate. It is also available for immediate download and adjustment. So, changes can be made in the color, design, graphics or any other component to create a unique layout.
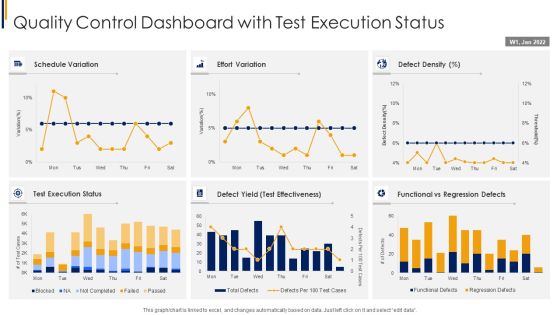
Quality Control Dashboard With Test Execution Status Themes PDF
Pitch your topic with ease and precision using this Quality Control Dashboard With Test Execution Status Themes PDF. This layout presents information on Schedule Variation, Defect Density, Regression Defects. It is also available for immediate download and adjustment. So, changes can be made in the color, design, graphics or any other component to create a unique layout.
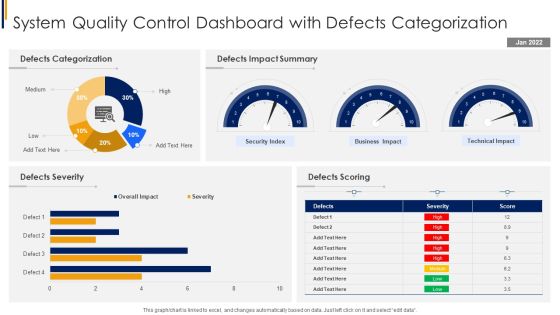
System Quality Control Dashboard With Defects Categorization Download PDF
Pitch your topic with ease and precision using this System Quality Control Dashboard With Defects Categorization Download PDF. This layout presents information on Defects Categorization, Defects Severity, Defects Scoring. It is also available for immediate download and adjustment. So, changes can be made in the color, design, graphics or any other component to create a unique layout.
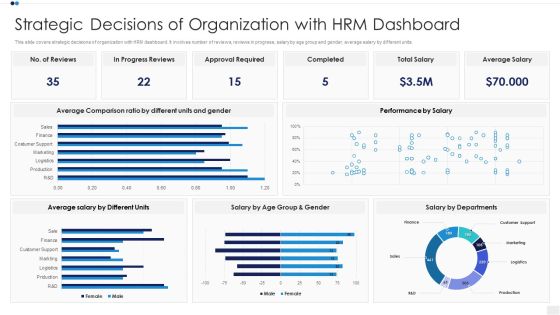
Strategic Decisions Of Organization With HRM Dashboard Information PDF
Pitch your topic with ease and precision using this Strategic Decisions Of Organization With HRM Dashboard Information PDF This layout presents information on Progress Reviews, Approval Required, Completed It is also available for immediate download and adjustment. So, changes can be made in the color, design, graphics or any other component to create a unique layout.

Customer Service Performance Monitoring Dashboard For Quality Assurance Professional PDF
Pitch your topic with ease and precision using this Customer Service Performance Monitoring Dashboard For Quality Assurance Professional PDF This layout presents information on Overall Satisfaction Score, Satisfaction Score Per Agent, Answered In Less It is also available for immediate download and adjustment. So, changes can be made in the color, design, graphics or any other component to create a unique layout.

Staffing Dashboard Presenting Candidate Applications For Recruitment Elements PDF
Pitch your topic with ease and precision using this Staffing Dashboard Presenting Candidate Applications For Recruitment Elements PDF This layout presents information on Recent Hiring Manager Reviews, Pipeline Summary, Plumber Technician Residencia It is also available for immediate download and adjustment. So, changes can be made in the color, design, graphics or any other component to create a unique layout.
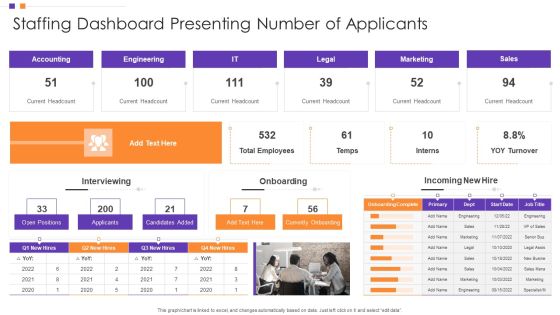
Staffing Dashboard Presenting Number Of Applicants Template PDF
Pitch your topic with ease and precision using this Staffing Dashboard Presenting Number Of Applicants Template PDF This layout presents information on Currently Onboarding, Current Headcount, Open Positions It is also available for immediate download and adjustment. So, changes can be made in the color, design, graphics or any other component to create a unique layout.
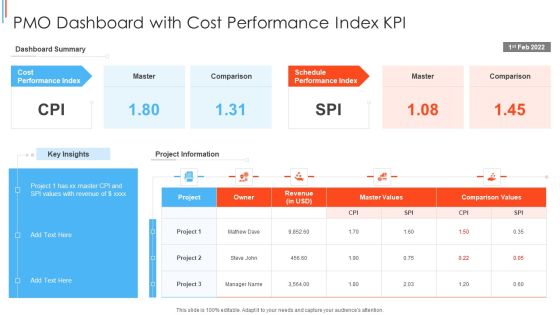
PMO Dashboard With Cost Performance Index KPI Ideas PDF
Pitch your topic with ease and precision using this PMO Dashboard With Cost Performance Index KPI Ideas PDF This layout presents information on Project Information, Cost Performance Index, Schedule Performance Index It is also available for immediate download and adjustment. So, changes can be made in the color, design, graphics or any other component to create a unique layout.
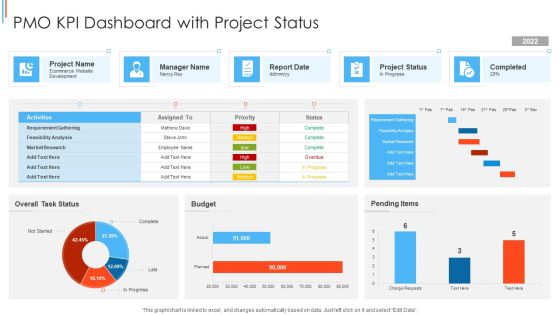
PMO KPI Dashboard With Project Status Template PDF
Pitch your topic with ease and precision using this PMO KPI Dashboard With Project Status Template PDF This layout presents information on Requirement Gathering, Feasibility Analysis, Market Research It is also available for immediate download and adjustment. So, changes can be made in the color, design, graphics or any other component to create a unique layout.

Waterfall Project Management Technique Dashboard Representing Work Status Inspiration PDF
Pitch your topic with ease and precision using this Waterfall Project Management Technique Dashboard Representing Work Status Inspiration PDF. This layout presents information on Risks, Tasks, Budget. It is also available for immediate download and adjustment. So, changes can be made in the color, design, graphics or any other component to create a unique layout.

Communication KPI Dashboard For Evaluating Enterprise Program Effectiveness Demonstration PDF
Pitch your topic with ease and precision using this Communication KPI Dashboard For Evaluating Enterprise Program Effectiveness Demonstration PDF This layout presents information on Participation Departments, Company Section Visitors Engagement It is also available for immediate download and adjustment. So, changes can be made in the color, design, graphics or any other component to create a unique layout.
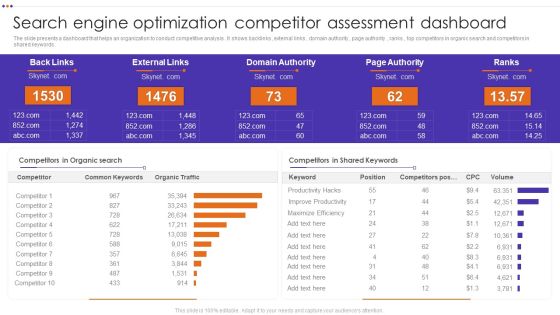
Search Engine Optimization Competitor Assessment Dashboard Graphics PDF
Pitch your topic with ease and precision using this Search Engine Optimization Competitor Assessment Dashboard Graphics PDF. This layout presents information on Domain Authority, External Links, Competitors In Organic. It is also available for immediate download and adjustment. So, changes can be made in the color, design, graphics or any other component to create a unique layout.
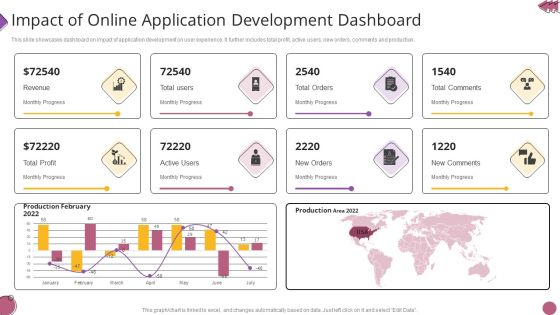
Impact Of Online Application Development Dashboard Elements PDF
Pitch your topic with ease and precision using this Impact Of Online Application Development Dashboard Elements PDF. This layout presents information on Total Orders, Total Comments, New Comments. It is also available for immediate download and adjustment. So, changes can be made in the color, design, graphics or any other component to create a unique layout.

Portfolio Risk Evaluation Dashboard With Regulatory Parameters Slides PDF
Pitch your topic with ease and precision using this Portfolio Risk Evaluation Dashboard With Regulatory Parameters Slides PDF. This layout presents information on Probability Of Default, Expected Loss, Credit Risk Rating. It is also available for immediate download and adjustment. So, changes can be made in the color, design, graphics or any other component to create a unique layout.
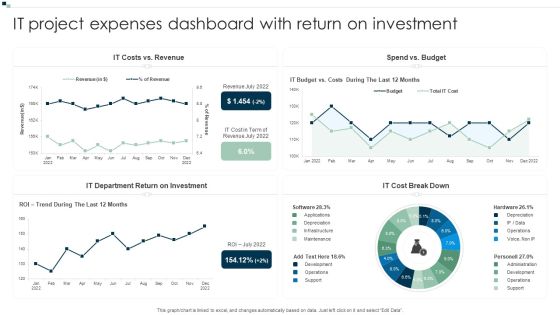
IT Project Expenses Dashboard With Return On Investment Topics PDF
Pitch your topic with ease and precision using this IT Project Expenses Dashboard With Return On Investment Topics PDF. This layout presents information on Revenue, Costs, Budget. It is also available for immediate download and adjustment. So, changes can be made in the color, design, graphics or any other component to create a unique layout.
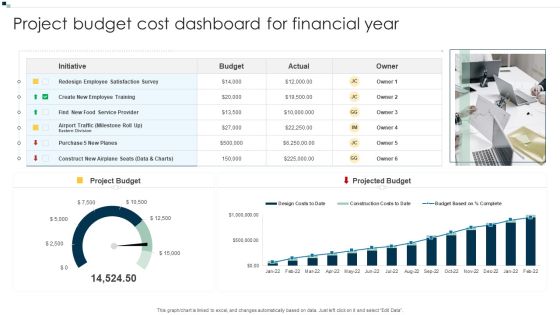
Project Budget Cost Dashboard For Financial Year Ideas PDF
Pitch your topic with ease and precision using this Project Budget Cost Dashboard For Financial Year Ideas PDF. This layout presents information on Budget, Service Provider, Redesign Employee. It is also available for immediate download and adjustment. So, changes can be made in the color, design, graphics or any other component to create a unique layout.
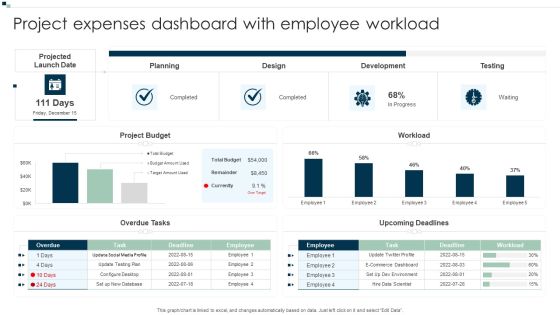
Project Expenses Dashboard With Employee Workload Background PDF
Pitch your topic with ease and precision using this Project Expenses Dashboard With Employee Workload Background PDF. This layout presents information on Planning, Design, Development. It is also available for immediate download and adjustment. So, changes can be made in the color, design, graphics or any other component to create a unique layout.
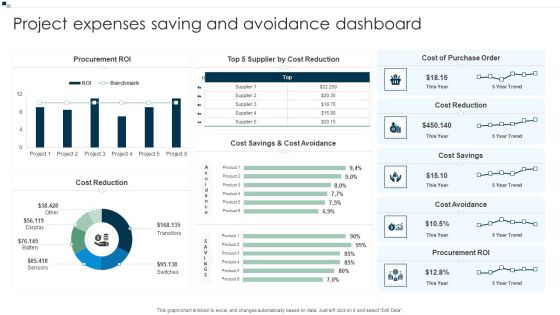
Project Expenses Saving And Avoidance Dashboard Guidelines PDF
Pitch your topic with ease and precision using this Project Expenses Saving And Avoidance Dashboard Guidelines PDF. This layout presents information on Procurement Roi, Supplier By Cost Reduction, Cost Of Purchase Order. It is also available for immediate download and adjustment. So, changes can be made in the color, design, graphics or any other component to create a unique layout.

Dashboard For Product Campaign Survey Response Results KPI Pictures PDF
Pitch your topic with ease and precision using this Dashboard For Product Campaign Survey Response Results KPI Pictures PDF. This layout presents information on Awareness Recent, Product Campaign, Product Future. It is also available for immediate download and adjustment. So, changes can be made in the color, design, graphics or any other component to create a unique layout.
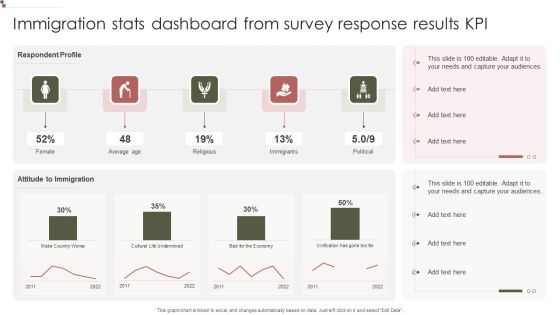
Immigration Stats Dashboard From Survey Response Results KPI Elements PDF
Pitch your topic with ease and precision using this Immigration Stats Dashboard From Survey Response Results KPI Elements PDF. This layout presents information on Attitude Immigration, Respondent Profile, Immigrants. It is also available for immediate download and adjustment. So, changes can be made in the color, design, graphics or any other component to create a unique layout.
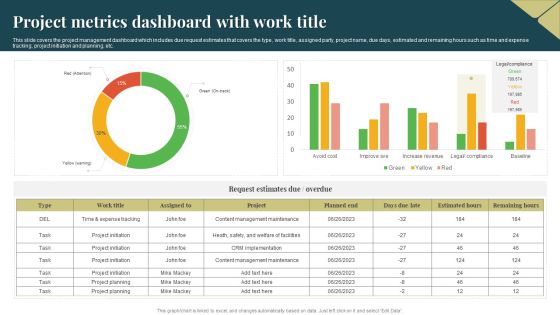
Project Metrics Dashboard With Work Title Sample PDF
Pitch your topic with ease and precision using this Project Metrics Dashboard With Work Title Sample PDF. This layout presents information on Implementation, Content Management, Project. It is also available for immediate download and adjustment. So, changes can be made in the color, design, graphics or any other component to create a unique layout.

Dashboard For Tracking Organizational OGSM Model Metrics Microsoft PDF
Pitch your topic with ease and precision using this Dashboard For Tracking Organizational OGSM Model Metrics Microsoft PDF. This layout presents information on Revenue, Market Share, Gross Margin. It is also available for immediate download and adjustment. So, changes can be made in the color, design, graphics or any other component to create a unique layout.
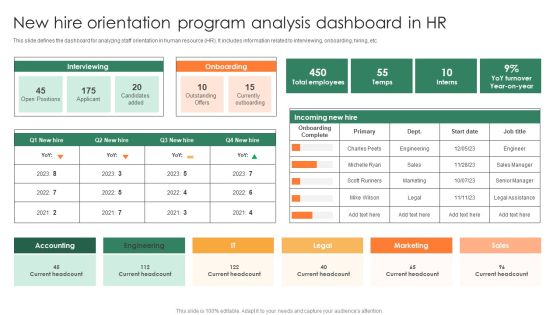
New Hire Orientation Program Analysis Dashboard In HR Clipart PDF
Pitch your topic with ease and precision using this New Hire Orientation Program Analysis Dashboard In HR Clipart PDF. This layout presents information on Currently Outboarding, Current Headcount, Onboarding Complete. It is also available for immediate download and adjustment. So, changes can be made in the color, design, graphics or any other component to create a unique layout.
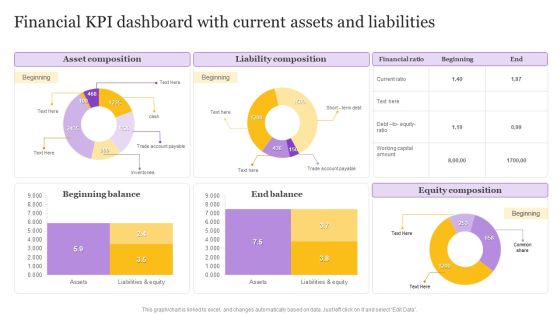
Financial KPI Dashboard With Current Assets And Liabilities Themes PDF
Pitch your topic with ease and precision using this Financial KPI Dashboard With Current Assets And Liabilities Themes PDF. This layout presents information on Equity Composition, Liability Composition, Asset Composition. It is also available for immediate download and adjustment. So, changes can be made in the color, design, graphics or any other component to create a unique layout.

Financial KPI Dashboard With Debt Equity Ratio Rules PDF
Pitch your topic with ease and precision using this Financial KPI Dashboard With Debt Equity Ratio Rules PDF. This layout presents information on Working Capital Ratio, Return On Assets, Return On Equity. It is also available for immediate download and adjustment. So, changes can be made in the color, design, graphics or any other component to create a unique layout.
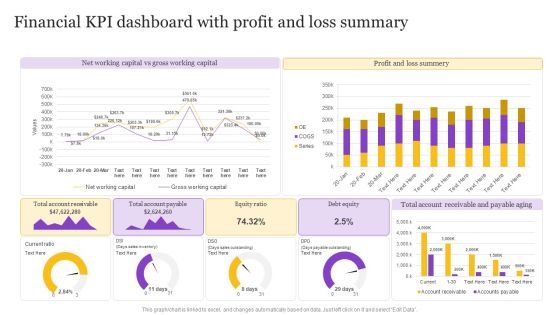
Financial KPI Dashboard With Profit And Loss Summary Professional PDF
Pitch your topic with ease and precision using this Financial KPI Dashboard With Profit And Loss Summary Professional PDF. This layout presents information on Net Working Capital, Gross Working Capital. It is also available for immediate download and adjustment. So, changes can be made in the color, design, graphics or any other component to create a unique layout.
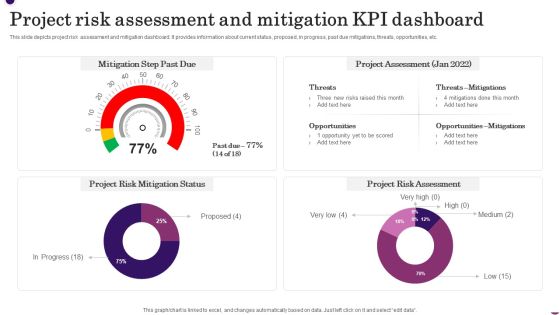
Project Risk Assessment And Mitigation KPI Dashboard Summary PDF
Pitch your topic with ease and precision using this Project Risk Assessment And Mitigation KPI Dashboard Summary PDF. This layout presents information on Mitigation Step Past Due, Project Assessment, Mitigation Status, Project Risk Assessment. It is also available for immediate download and adjustment. So, changes can be made in the color, design, graphics or any other component to create a unique layout.
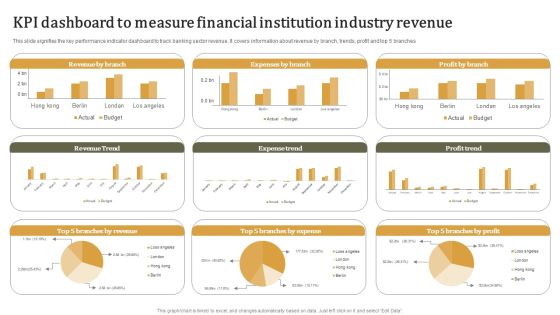
KPI Dashboard To Measure Financial Institution Industry Revenue Summary PDF
Pitch your topic with ease and precision using this KPI Dashboard To Measure Financial Institution Industry Revenue Summary PDF. This layout presents information on Measure Financial, Institution Industry . It is also available for immediate download and adjustment. So, changes can be made in the color, design, graphics or any other component to create a unique layout.

Workplace Diversity And Inclusion Strategy Deployment Impact Dashboard Demonstration PDF
Pitch your topic with ease and precision using this Workplace Diversity And Inclusion Strategy Deployment Impact Dashboard Demonstration PDF. This layout presents information on Workplace Inclusive Environment, Workplace Internal Mobility, Annual Employee Performance, Disability In Workspace. It is also available for immediate download and adjustment. So, changes can be made in the color, design, graphics or any other component to create a unique layout.

Dashboard For Product And Earning Breakup Themes PDF
Pitch your topic with ease and precision using this Dashboard For Product And Earning Breakup Themes PDF. This layout presents information on Product, Earning Breakup. It is also available for immediate download and adjustment. So, changes can be made in the color, design, graphics or any other component to create a unique layout.
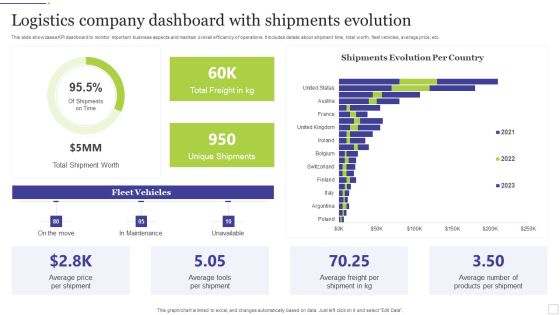
Logistics Company Dashboard With Shipments Evolution Summary PDF
Pitch your topic with ease and precision using this Logistics Company Dashboard With Shipments Evolution Summary PDF. This layout presents information on Logistics Company, Shipments Evolution. It is also available for immediate download and adjustment. So, changes can be made in the color, design, graphics or any other component to create a unique layout.

Customer Relationship Management Dashboard CRM Assessment Scale Microsoft PDF
Deliver an awe inspiring pitch with this creative customer relationship management dashboard crm assessment scale microsoft pdf bundle. Topics like intuitive interface, new features and improvement, tons of business integrations, customized reporting can be discussed with this completely editable template. It is available for immediate download depending on the needs and requirements of the user.
Nps Reports And Dashboard Circular Diagram Ppt Summary Guide PDF
This is a nps reports and dashboard circular diagram ppt summary guide pdf template with various stages. Focus and dispense information on six stages using this creative set, that comes with editable features. It contains large content boxes to add your information on topics like circular diagram. You can also showcase facts, figures, and other relevant content using this PPT layout. Grab it now.

Nps Reports And Dashboard Roadmap Ppt Infographic Template Maker PDF
This is a nps reports and dashboard roadmap ppt infographic template maker pdf template with various stages. Focus and dispense information on five stages using this creative set, that comes with editable features. It contains large content boxes to add your information on topics like roadmap. You can also showcase facts, figures, and other relevant content using this PPT layout. Grab it now.

Development And Operations KPI Dashboard IT Circular Diagram Graphics PDF
This is a development and operations kpi dashboard it circular diagram graphics pdf template with various stages. Focus and dispense information on seven stages using this creative set, that comes with editable features. It contains large content boxes to add your information on topics like circular diagram. You can also showcase facts, figures, and other relevant content using this PPT layout. Grab it now.
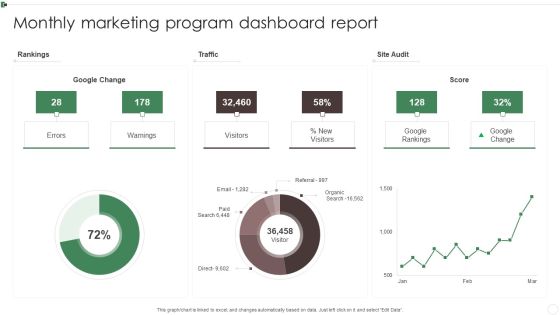
Monthly Marketing Program Dashboard Report Ppt Inspiration Information PDF
This graph or chart is linked to excel, and changes automatically based on data. Just left click on it and select Edit Data. Pitch your topic with ease and precision using this Monthly Marketing Program Dashboard Report Ppt Inspiration Information PDF. This layout presents information on Rankings, Traffic, Site Audit, Warnings. It is also available for immediate download and adjustment. So, changes can be made in the color, design, graphics or any other component to create a unique layout.

Client Helpline Dashboard Performance Key Metrics Ppt Outline Deck PDF
This graph or chart is linked to excel, and changes automatically based on data. Just left click on it and select Edit Data. Pitch your topic with ease and precision using this Client Helpline Dashboard Performance Key Metrics Ppt Outline Deck PDF. This layout presents information on Key Metrics, Trend, Compare. It is also available for immediate download and adjustment. So, changes can be made in the color, design, graphics or any other component to create a unique layout.

Corporate Earnings And Risk Metrics Dashboard Guidelines PDF
This slide illustrates graphical representation of risk key performance indicators. It includes financial risks, operational risk and risk expenditure etc. Pitch your topic with ease and precision using this Corporate Earnings And Risk Metrics Dashboard Guidelines PDF. This layout presents information on Financial Risk, Operational Risk Expenditure. It is also available for immediate download and adjustment. So, changes can be made in the color, design, graphics or any other component to create a unique layout.

Manufacturing Audit And Review Team Inspection Dashboard Microsoft PDF
This slide illustrates data related to inspections done by audit teams in manufacturing corporation. It includes graph for last 10 audits, audit report for september 2023 etc.Pitch your topic with ease and precision using this Manufacturing Audit And Review Team Inspection Dashboard Microsoft PDF. This layout presents information on Audit Report, Preparedness, Site Inspection. It is also available for immediate download and adjustment. So, changes can be made in the color, design, graphics or any other component to create a unique layout.

Dashboard For Personalized Digital Marketing Kpis Rules PDF
This slide showcases dashboard that can help organization to measure the KPIs after implementing personalized marketing campaigns. Its key elements are lead breakdown, web user to lead, lead to trial, leads by region and google analtics web traffic. This Dashboard For Personalized Digital Marketing Kpis Rules PDF from Slidegeeks makes it easy to present information on your topic with precision. It provides customization options, so you can make changes to the colors, design, graphics, or any other component to create a unique layout. It is also available for immediate download, so you can begin using it right away. Slidegeeks has done good research to ensure that you have everything you need to make your presentation stand out. Make a name out there for a brilliant performance.

Procurement Dashboard To Measure Suppliers Performance Infographics PDF
This slide provides an overview of the procurement dashboard to determine vendors capacity for providing the right goods and services. The KPIs covered are defect rate, on-time supplies, supplier availability, delivery and lead time. This Procurement Dashboard To Measure Suppliers Performance Infographics PDF from Slidegeeks makes it easy to present information on your topic with precision. It provides customization options, so you can make changes to the colors, design, graphics, or any other component to create a unique layout. It is also available for immediate download, so you can begin using it right away. Slidegeeks has done good research to ensure that you have everything you need to make your presentation stand out. Make a name out there for a brilliant performance.

CDD Process Client Onboarding Dashboard Data Ppt Layouts Deck PDF
This is a cdd process client onboarding dashboard data ppt layouts deck pdf template with various stages. Focus and dispense information on two stages using this creative set, that comes with editable features. It contains large content boxes to add your information on topics like xyz enterprises internal implementation, xyz enterprises external implementation. You can also showcase facts, figures, and other relevant content using this PPT layout. Grab it now.

Client Onboarding Framework Client Onboarding Dashboard Data Background PDF
This is a client onboarding framework client onboarding dashboard data background pdf template with various stages. Focus and dispense information on two stages using this creative set, that comes with editable features. It contains large content boxes to add your information on topics like xyz enterprises internal implementation, xyz enterprises external implementation. You can also showcase facts, figures, and other relevant content using this PPT layout. Grab it now.
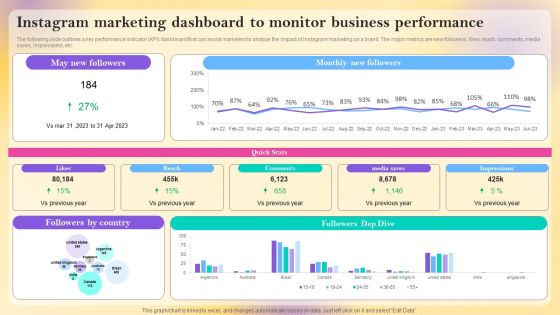
Instagram Marketing Dashboard To Monitor Business Performance Information PDF
The following slide outlines a key performance indicator KPI dashboard that can assist marketers to analyze the impact of Instagram marketing on a brand. The major metrics are new followers, likes, reach, comments, media saves, impressions, etc. This Instagram Marketing Dashboard To Monitor Business Performance Information PDF is perfect for any presentation, be it in front of clients or colleagues. It is a versatile and stylish solution for organizing your meetings. The product features a modern design for your presentation meetings. The adjustable and customizable slides provide unlimited possibilities for acing up your presentation. Slidegeeks has done all the homework before launching the product for you. So, do not wait, grab the presentation templates today

Social Media Artificial Intelligence Data Visualization Capabilities Dashboard Inspiration PDF
This slide illustrates graphical representation of visualization abilities of artificial intelligence on social media. It includes total impressions, total clicks, performance review etc. Pitch your topic with ease and precision using this Social Media Artificial Intelligence Data Visualization Capabilities Dashboard Inspiration PDF. This layout presents information on Artificial Intelligence, Data Visualization Capabilities. It is also available for immediate download and adjustment. So, changes can be made in the color, design, graphics or any other component to create a unique layout.
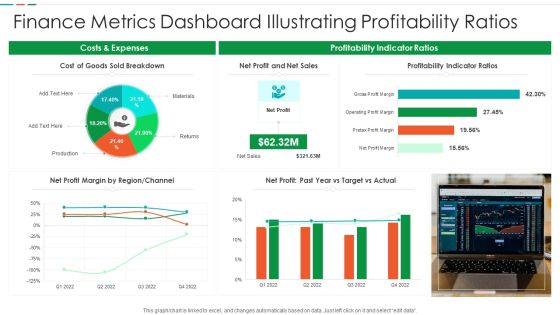
Finance Metrics Dashboard Illustrating Profitability Ratios Diagrams PDF
This graph or chart is linked to excel, and changes automatically based on data. Just left click on it and select edit data. Pitch your topic with ease and precision using this Finance Metrics Dashboard Illustrating Profitability Ratios Diagrams PDF. This layout presents information on Cost Goods Sold, Net Profit Net, Sales Profitability Indicator. It is also available for immediate download and adjustment. So, changes can be made in the color, design, graphics or any other component to create a unique layout.

Finance Metrics Dashboard Indicating Portfolio Performance Microsoft PDF
This graph or chart is linked to excel, and changes automatically based on data. Just left click on it and select edit data. Pitch your topic with ease and precision using this Finance Metrics Dashboard Indicating Portfolio Performance Microsoft PDF. This layout presents information on Portfolio Performance Portfolio, Asset Management Manager, Top 10 Assets. It is also available for immediate download and adjustment. So, changes can be made in the color, design, graphics or any other component to create a unique layout.

Finance Metrics Dashboard Indicating Short Term Assets Download PDF
This graph or chart is linked to excel, and changes automatically based on data. Just left click on it and select edit data. Pitch your topic with ease and precision using this Finance Metrics Dashboard Indicating Short Term Assets Download PDF. This layout presents information on Short Term Assets, Global Financial Performance, Revenue YTD 2022. It is also available for immediate download and adjustment. So, changes can be made in the color, design, graphics or any other component to create a unique layout.
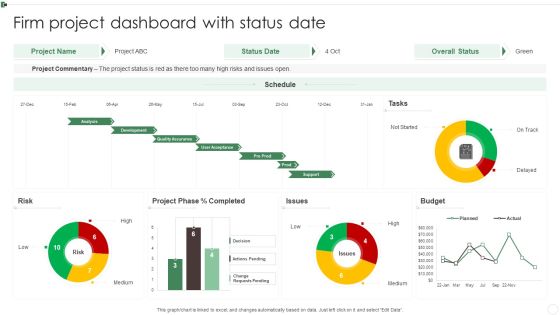
Firm Project Dashboard With Status Date Ppt Infographics Slides PDF
This graph or chart is linked to excel, and changes automatically based on data. Just left click on it and select Edit Data. Pitch your topic with ease and precision using this Firm Project Dashboard With Status Date Ppt Infographics Slides PDF. This layout presents information on Project Commentary, Budget, Project Phase, Risk. It is also available for immediate download and adjustment. So, changes can be made in the color, design, graphics or any other component to create a unique layout.
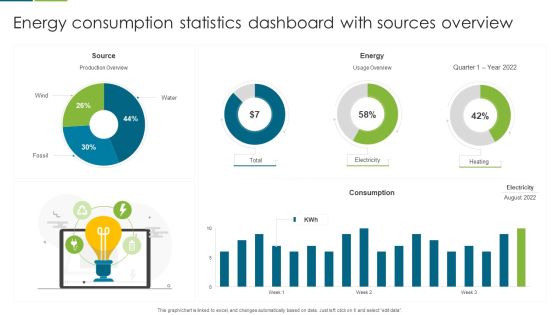
Energy Consumption Statistics Dashboard With Sources Overview Template PDF
This graph or chart is linked to excel, and changes automatically based on data. Just left click on it and select edit data. Pitch your topic with ease and precision using this Energy Consumption Statistics Dashboard With Sources Overview Template PDF. This layout presents information on Source, Energy, Consumption. It is also available for immediate download and adjustment. So, changes can be made in the color, design, graphics or any other component to create a unique layout.

Company Group Members Demographics Dashboard Overview Clipart PDF
This graph or chart is linked to excel, and changes automatically based on data. Just left click on it and select Edit Data. Pitch your topic with ease and precision using this Company Group Members Demographics Dashboard Overview Clipart PDF. This layout presents information on Headcount Office, Headcount Tenure Range, Headcount Age Range. It is also available for immediate download and adjustment. So, changes can be made in the color, design, graphics or any other component to create a unique layout.
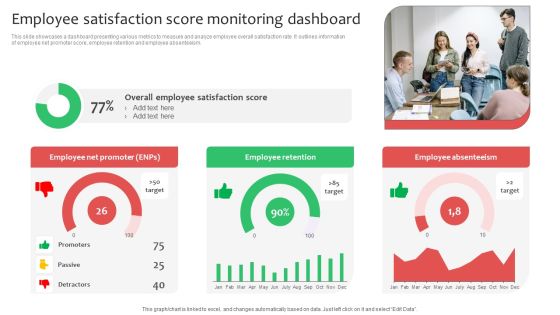
Employee Satisfaction Score Monitoring Dashboard Ppt Infographics Deck PDF
This slide showcases a dashboard presenting various metrics to measure and analyze employee overall satisfaction rate. It outlines information of employee net promoter score, employee retention and employee absenteeism. This Employee Satisfaction Score Monitoring Dashboard Ppt Infographics Deck PDF from Slidegeeks makes it easy to present information on your topic with precision. It provides customization options, so you can make changes to the colors, design, graphics, or any other component to create a unique layout. It is also available for immediate download, so you can begin using it right away. Slidegeeks has done good research to ensure that you have everything you need to make your presentation stand out. Make a name out there for a brilliant performance.

Earning Potential And Financial Forecasting Dashboard Summary PDF
This slide illustrates facts and figures related to sales figures. It includes data of monthly revenue generation FY23, yearly revenue, expected revenue generation FY23 etc. Pitch your topic with ease and precision using this Earning Potential And Financial Forecasting Dashboard Summary PDF. This layout presents information on Sales Revenue, Expected Revenue, Product. It is also available for immediate download and adjustment. So, changes can be made in the color, design, graphics or any other component to create a unique layout.
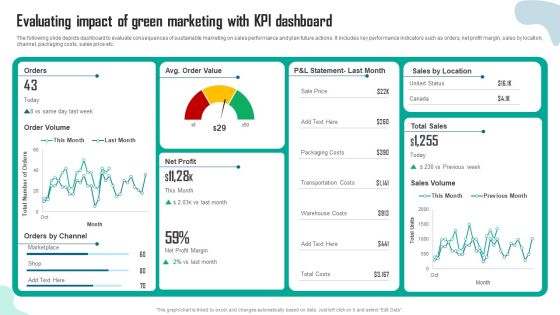
Evaluating Impact Of Green Marketing With Kpi Dashboard Inspiration PDF
The following slide depicts dashboard to evaluate consequences of sustainable marketing on sales performance and plan future actions. It includes key performance indicators such as orders, net profit margin, sales by location, channel, packaging costs, sales price etc. This Evaluating Impact Of Green Marketing With Kpi Dashboard Inspiration PDF from Slidegeeks makes it easy to present information on your topic with precision. It provides customization options, so you can make changes to the colors, design, graphics, or any other component to create a unique layout. It is also available for immediate download, so you can begin using it right away. Slidegeeks has done good research to ensure that you have everything you need to make your presentation stand out. Make a name out there for a brilliant performance.

Ecommerce KPI Dashboard With Pand L Statement Download PDF
This slide showcases ecommerce key performance indicators KPI dashboard with financial statement. It provides information about total sales, orders, net profit, net profit margin, average order value, channels, etc. This Ecommerce KPI Dashboard With Pand L Statement Download PDF from Slidegeeks makes it easy to present information on your topic with precision. It provides customization options, so you can make changes to the colors, design, graphics, or any other component to create a unique layout. It is also available for immediate download, so you can begin using it right away. Slidegeeks has done good research to ensure that you have everything you need to make your presentation stand out. Make a name out there for a brilliant performance.

Dashboard To Track Ecommerce Website Performance Summary PDF
This slide showcases dashboard that can help organization to track the performance of ecommerce website. Its key components are users by region, traffic sources, audience metrics over time, mobile users etc. Do you know about Slidesgeeks Dashboard To Track Ecommerce Website Performance Summary PDF These are perfect for delivering any kind od presentation. Using it, create PowerPoint presentations that communicate your ideas and engage audiences. Save time and effort by using our pre designed presentation templates that are perfect for a wide range of topic. Our vast selection of designs covers a range of styles, from creative to business, and are all highly customizable and easy to edit. Download as a PowerPoint template or use them as Google Slides themes.
Monthly Sales Performance Tracking And Monitoring Dashboard Inspiration PDF
This slide showcases a dashboard presenting various metrics to measure and analyze sales performance for revenue growth. It includes key components such as number of sales, revenue, profit, cost, sales revenue, sales increment, cost analysis and cross sell. Coming up with a presentation necessitates that the majority of the effort goes into the content and the message you intend to convey. The visuals of a PowerPoint presentation can only be effective if it supplements and supports the story that is being told. Keeping this in mind our experts created Monthly Sales Performance Tracking And Monitoring Dashboard Inspiration PDF to reduce the time that goes into designing the presentation. This way, you can concentrate on the message while our designers take care of providing you with the right template for the situation.
Project Management Tracking Dashboard To Review Decision Download PDF
The below slide depicts the key performing indicators in project decision making. It includes elements such as overall status, progress, progress, time, cost and work volume. Pitch your topic with ease and precision using this Project Management Tracking Dashboard To Review Decision Download PDF. This layout presents information on Progress, Activity Status, Overall Status. It is also available for immediate download and adjustment. So, changes can be made in the color, design, graphics or any other component to create a unique layout.

Dashboard For Tracking Impact Of Warehouse House Automation Background PDF
This slide covers the dashboard with after automation warehouse overview. It include KPIs such as autonomous robots status, robotic arms status, battery level, performance, time to return, etc. This Dashboard For Tracking Impact Of Warehouse House Automation Background PDF from Slidegeeks makes it easy to present information on your topic with precision. It provides customization options, so you can make changes to the colors, design, graphics, or any other component to create a unique layout. It is also available for immediate download, so you can begin using it right away. Slidegeeks has done good research to ensure that you have everything you need to make your presentation stand out. Make a name out there for a brilliant performance.
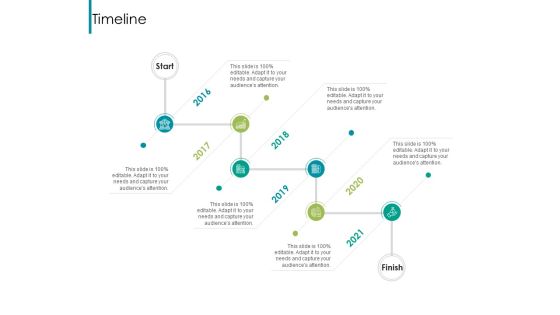
Nps Reports And Dashboard Timeline Ppt Inspiration Slideshow PDF
This is a nps reports and dashboard timeline ppt inspiration slideshow pdf template with various stages. Focus and dispense information on six stages using this creative set, that comes with editable features. It contains large content boxes to add your information on topics like timeline, 2016 to 2021. You can also showcase facts, figures, and other relevant content using this PPT layout. Grab it now.
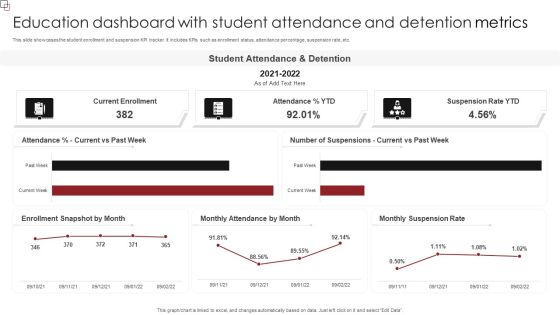
Education Dashboard With Student Attendance And Detention Metrics Inspiration PDF
This slide showcases the student enrollment and suspension KPI tracker. It includes KPIs such as enrollment status, attendance percentage, suspension rate, etc. Pitch your topic with ease and precision using this Education Dashboard With Student Attendance And Detention Metrics Inspiration PDF. This layout presents information on Student Attendance, Suspension Rate YTD, Current Enrollment. It is also available for immediate download and adjustment. So, changes can be made in the color, design, graphics or any other component to create a unique layout.
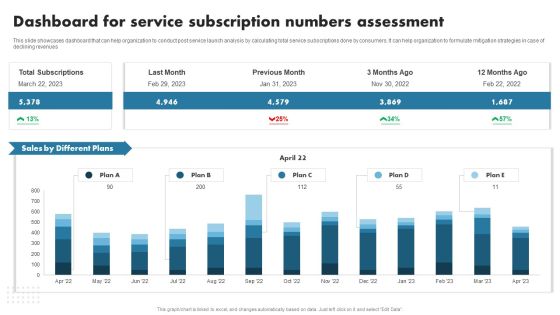
Enhancing Customer Outreach Dashboard For Service Subscription Numbers Template PDF
This slide showcases dashboard that can help organization to conduct post service launch analysis by calculating total service subscriptions done by consumers. It can help organization to formulate mitigation strategies in case of declining revenues. This Enhancing Customer Outreach Dashboard For Service Subscription Numbers Template PDF from Slidegeeks makes it easy to present information on your topic with precision. It provides customization options, so you can make changes to the colors, design, graphics, or any other component to create a unique layout. It is also available for immediate download, so you can begin using it right away. Slidegeeks has done good research to ensure that you have everything you need to make your presentation stand out. Make a name out there for a brilliant performance.

Dashboard For Tracking Brand Awareness Advertisement Campaign Results Designs PDF
This slide showcases dashboard that can help organization to track results of online advertisement campaigns. Its key components ad impressions, click through rate, cost per conversion, revenue per click, impressions, new users and sessions.Are you in need of a template that can accommodate all of your creative concepts This one is crafted professionally and can be altered to fit any style. Use it with Google Slides or PowerPoint. Include striking photographs, symbols, depictions, and other visuals. Fill, move around, or remove text boxes as desired. Test out color palettes and font mixtures. Edit and save your work, or work with colleagues. Download Dashboard For Tracking Brand Awareness Advertisement Campaign Results Designs PDF and observe how to make your presentation outstanding. Give an impeccable presentation to your group and make your presentation unforgettable.
Social Media Marketing Performance Tracking Dashboard Inspiration PDF
Following slide displays KPI dashboard that can be used to monitor the performance of social media marketing campaign. Metrics covered are related to fans number, engagement rate and page impressions.This Social Media Marketing Performance Tracking Dashboard Inspiration PDF from Slidegeeks makes it easy to present information on your topic with precision. It provides customization options, so you can make changes to the colors, design, graphics, or any other component to create a unique layout. It is also available for immediate download, so you can begin using it right away. Slidegeeks has done good research to ensure that you have everything you need to make your presentation stand out. Make a name out there for a brilliant performance.
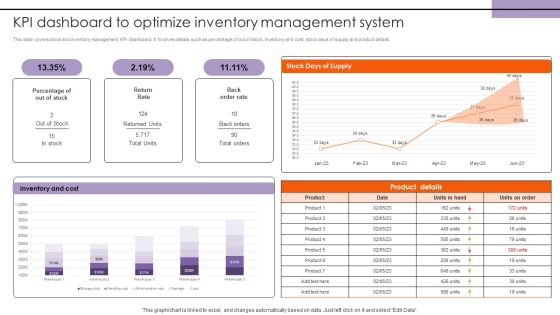
KPI Dashboard To Optimize Inventory Management System Structure PDF
This slide covers stock and inventory management KPI dashboard. It involves details such as percentage of out of stock, inventory and cost, stock days of supply and product details. This KPI Dashboard To Optimize Inventory Management System Structure PDF from Slidegeeks makes it easy to present information on your topic with precision. It provides customization options, so you can make changes to the colors, design, graphics, or any other component to create a unique layout. It is also available for immediate download, so you can begin using it right away. Slidegeeks has done good research to ensure that you have everything you need to make your presentation stand out. Make a name out there for a brilliant performance.

KPI Dashboard To Track Employee Performance In Organization Background PDF
This slide covers KPI dashboard to track employee performance at workplace. It involves details such as productivity rate, labour effectiveness rate, absentee rate and turnover ratio. This KPI Dashboard To Track Employee Performance In Organization Background PDF from Slidegeeks makes it easy to present information on your topic with precision. It provides customization options, so you can make changes to the colors, design, graphics, or any other component to create a unique layout. It is also available for immediate download, so you can begin using it right away. Slidegeeks has done good research to ensure that you have everything you need to make your presentation stand out. Make a name out there for a brilliant performance.

Corporate Training Program Dashboard For Training Program Evaluation Summary PDF
This slide showcases dashboard that can help organization to evaluate the training program implemented in organization. Its key components are training cost, number of participants, hours of training, cost per participant and occupancy rate Are you in need of a template that can accommodate all of your creative concepts This one is crafted professionally and can be altered to fit any style. Use it with Google Slides or PowerPoint. Include striking photographs, symbols, depictions, and other visuals. Fill, move around, or remove text boxes as desired. Test out color palettes and font mixtures. Edit and save your work, or work with colleagues. Download Corporate Training Program Dashboard For Training Program Evaluation Summary PDF and observe how to make your presentation outstanding. Give an impeccable presentation to your group and make your presentation unforgettable.
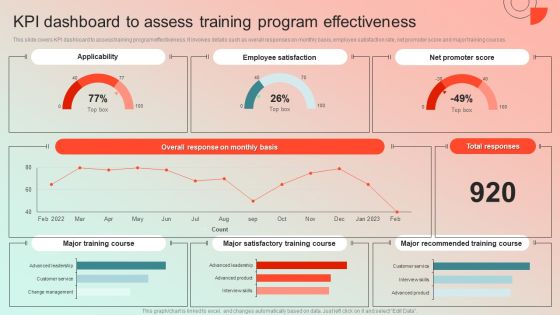
KPI Dashboard To Assess Training Program Effectiveness Background PDF
This slide covers KPI dashboard to assess training program effectiveness. It involves details such as overall responses on monthly basis, employee satisfaction rate, net promoter score and major training courses. This KPI Dashboard To Assess Training Program Effectiveness Background PDF from Slidegeeks makes it easy to present information on your topic with precision. It provides customization options, so you can make changes to the colors, design, graphics, or any other component to create a unique layout. It is also available for immediate download, so you can begin using it right away. Slidegeeks has done good research to ensure that you have everything you need to make your presentation stand out. Make a name out there for a brilliant performance.
