AI PPT Maker
Templates
PPT Bundles
Design Services
Business PPTs
Business Plan
Management
Strategy
Introduction PPT
Roadmap
Self Introduction
Timelines
Process
Marketing
Agenda
Technology
Medical
Startup Business Plan
Cyber Security
Dashboards
SWOT
Proposals
Education
Pitch Deck
Digital Marketing
KPIs
Project Management
Product Management
Artificial Intelligence
Target Market
Communication
Supply Chain
Google Slides
Research Services
 One Pagers
All Categories
-
Home
- Customer Favorites
- Comparison Dashboard
Comparison Dashboard

6 Months Company Revenue Comparison Dashboard Graphics PDF
This slide showcases the half yearly profit comparison dashboard. It also includes comparison kp is such as monthly profit, profit margin growth, branch profit percentage, top 3 profitable products, etc. Showcasing this set of slides titled 6 Months Company Revenue Comparison Dashboard Graphics PDF. The topics addressed in these templates are Growth Rate, Overall Profit Margin, Branch Profit. All the content presented in this PPT design is completely editable. Download it and make adjustments in color, background, font etc. as per your unique business setting.
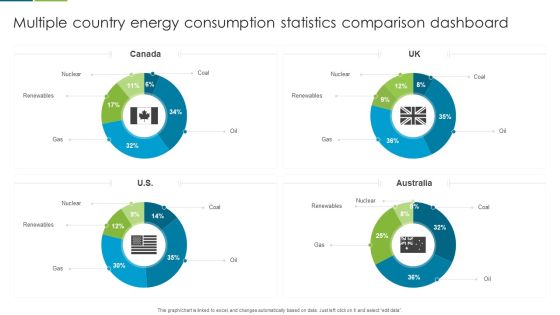
Multiple Country Energy Consumption Statistics Comparison Dashboard Formats PDF
This graph or chart is linked to excel, and changes automatically based on data. Just left click on it and select edit data. Pitch your topic with ease and precision using this Multiple Country Energy Consumption Statistics Comparison Dashboard Formats PDF. This layout presents information on Nuclear, Renewables, Gas. It is also available for immediate download and adjustment. So, changes can be made in the color, design, graphics or any other component to create a unique layout.
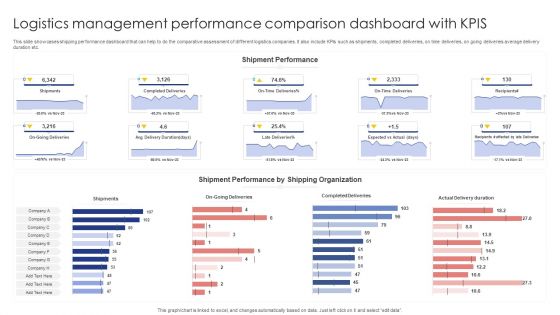
Logistics Management Performance Comparison Dashboard With Kpis Sample PDF
This slide showcases shipping performance dashboard that can help to do the comparative assessment of different logistics companies. It also include KPIs such as shipments, completed deliveries, on time deliveries, on going deliveries average delivery duration etc. Pitch your topic with ease and precision using this Logistics Management Performance Comparison Dashboard With Kpis Sample PDF. This layout presents information on Shipments, Completed Deliveries, Actual Delivery Duration. It is also available for immediate download and adjustment. So, changes can be made in the color, design, graphics or any other component to create a unique layout.
Monthly Comparison Dashboard For Lead Tracking Sample PDF
This slide showcases dashboard that can help organization to compare the leads converted in different months and make changes in sales and marketing campaigns . Its key components lead generated by country, by industry type and lead sources by month. Showcasing this set of slides titled Monthly Comparison Dashboard For Lead Tracking Sample PDF. The topics addressed in these templates are Leads Received, Industry Type, Lead Generated. All the content presented in this PPT design is completely editable. Download it and make adjustments in color, background, font etc. as per your unique business setting.

Quarterly Revenue And Loss Statement Comparison Dashboard Portrait PDF
This slide showcases a comprehensive P and L report for representing the financial outcomes. It also helps to take financial performance management decisions. It includes financial analysis KPIs such as p and l statements, p and l structure dynamics, sales or margin quality performance analysis, DUPONT ratio, etc. Showcasing this set of slides titled Quarterly Revenue And Loss Statement Comparison Dashboard Portrait PDF. The topics addressed in these templates are Profitability, Debt Coverage Ratios, Margin Quality Performa. All the content presented in this PPT design is completely editable. Download it and make adjustments in color, background, font etc. as per your unique business setting.

Customer Relationship Management Dashboard Comparison Formats PDF
Deliver an awe inspiring pitch with this creative customer relationship management dashboard comparison formats pdf bundle. Topics like comparison can be discussed with this completely editable template. It is available for immediate download depending on the needs and requirements of the user.
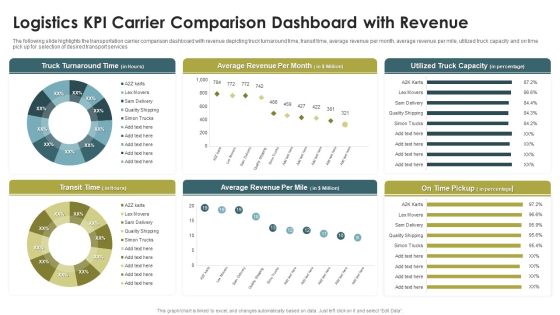
Logistics KPI Carrier Comparison Dashboard With Revenue Ppt Infographics Portfolio PDF
The following slide highlights the transportation carrier comparison dashboard with revenue depicting truck turnaround time, transit time, average revenue per month, average revenue per mile, utilized truck capacity and on time pick up for selection of desired transport services. Pitch your topic with ease and precision using this Logistics KPI Carrier Comparison Dashboard With Revenue Ppt Infographics Portfolio PDF. This layout presents information on Truck Turnaround Time, Average Revenue, Per Month, Transit Time. It is also available for immediate download and adjustment. So, changes can be made in the color, design, graphics or any other component to create a unique layout.
Target Vs Actual Sales Comparison Dashboard Ppt PowerPoint Presentation File Icons PDF
Presenting this set of slides with name target vs actual sales comparison dashboard ppt powerpoint presentation file icons pdf. The topics discussed in these slides are sales amount, avg commission rate, total commissions, total deductions, commission payable, top sales manager, top sales person. This is a completely editable PowerPoint presentation and is available for immediate download. Download now and impress your audience.

Digital And Offline Marketing Campaign Comparison Dashboard Ppt Inspiration Microsoft PDF
This slide showcases analysis of offline and online marketing in a dashboard covering key metrics. Performance indicators involved are purchases, free trial pay up rate and sign ups and monthly visitors. Pitch your topic with ease and precision using this Digital And Offline Marketing Campaign Comparison Dashboard Ppt Inspiration Microsoft PDF. This layout presents information on Online Marketing, Offline Marketing, Free Trial Sign, UPS. It is also available for immediate download and adjustment. So, changes can be made in the color, design, graphics or any other component to create a unique layout.

Budget Vs Actual Cost Comparison Dashboard Ppt PowerPoint Presentation Professional Format Ideas PDF
This slide illustrates fact and figures relating to various project budgets of a company. It includes monthly budget graph, project budget meter and budget vs. Actual costs chart.Pitch your topic with ease and precision using this Budget Vs Actual Cost Comparison Dashboard Ppt PowerPoint Presentation Professional Format Ideas PDF. This layout presents information on Milestones, Budget Graph, Manager. It is also available for immediate download and adjustment. So, changes can be made in the color, design, graphics or any other component to create a unique layout.
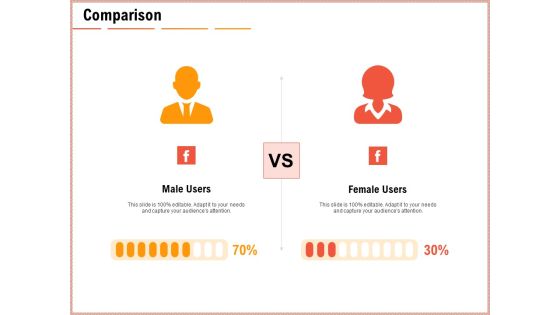
Net Promoter Score Dashboard Comparison Ppt Gallery Graphics Example PDF
This is a net promoter score dashboard comparison ppt gallery graphics example pdf template with various stages. Focus and dispense information on two stages using this creative set, that comes with editable features. It contains large content boxes to add your information on topics like comparison, male, female. You can also showcase facts, figures, and other relevant content using this PPT layout. Grab it now.

Competition Analysis Matrix Dashboard Comparison Ppt PowerPoint Presentation Complete Deck
This competition analysis matrix dashboard comparison ppt powerpoint presentation complete deck acts as backup support for your ideas, vision, thoughts, etc. Use it to present a thorough understanding of the topic. This PPT slideshow can be utilized for both in-house and outside presentations depending upon your needs and business demands. Entailing twelve slides with a consistent design and theme, this template will make a solid use case. As it is intuitively designed, it suits every business vertical and industry. All you have to do is make a few tweaks in the content or any other component to design unique presentations. The biggest advantage of this complete deck is that it can be personalized multiple times once downloaded. The color, design, shapes, and other elements are free to modify to add personal touches. You can also insert your logo design in this PPT layout. Therefore a well-thought and crafted presentation can be delivered with ease and precision by downloading this competition analysis matrix dashboard comparison ppt powerpoint presentation complete deck PPT slideshow.

Dashboards And Scorecards Comparison Diagram Ppt Slides
This is a dashboards and scorecards comparison diagram ppt slides. This is a three stage process. The stages in this process are dashboard, balanced scorecard, differences, performance management, periodically monthly, gps shows how will arrive, is used for, is update, in automobile it is, performance monitoring, in real time, automobile dashboard shows how your car is operating.
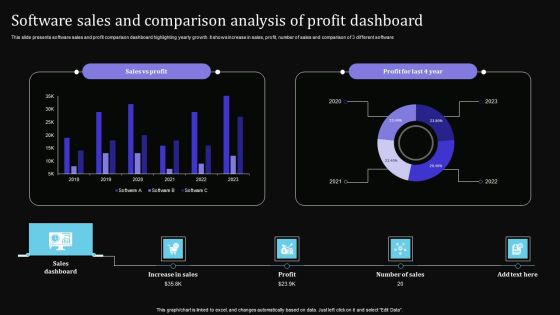
Software Sales And Comparison Analysis Of Profit Dashboard Sample PDF
This slide presents software sales and profit comparison dashboard highlighting yearly growth. It shows increase in sales, profit, number of sales and comparison of 3 different software. Showcasing this set of slides titled Software Sales And Comparison Analysis Of Profit Dashboard Sample PDF. The topics addressed in these templates are Increase Sales, Profit, Sales Dashboard. All the content presented in this PPT design is completely editable. Download it and make adjustments in color, background, font etc. as per your unique business setting.
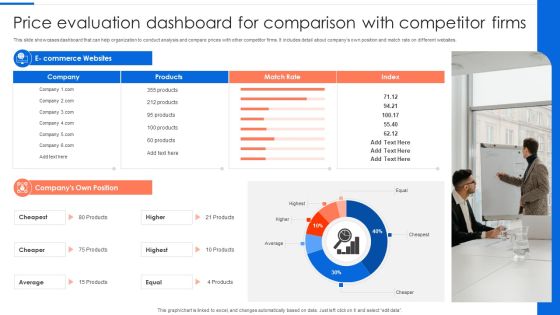
Price Evaluation Dashboard For Comparison With Competitor Firms Mockup PDF
Pitch your topic with ease and precision using this Price Evaluation Dashboard For Comparison With Competitor Firms Mockup PDF. This layout presents information on Dashboard, Comparison With Competitor. It is also available for immediate download and adjustment. So, changes can be made in the color, design, graphics or any other component to create a unique layout.

CRM Software Dashboard For Sales Comparison Mockup PDF
This slide represents the sales dashboard of CRM software. It includes KPIs such as profit, number of sales and expenses incurred. Pitch your topic with ease and precision using this CRM Software Dashboard For Sales Comparison Mockup PDF. This layout presents information on Profit, Sales Dashboard, Expenses Incurred. It is also available for immediate download and adjustment. So, changes can be made in the color, design, graphics or any other component to create a unique layout.

Communication KPI Dashboard With KPI Comparison Ideas PDF
Pitch your topic with ease and precision using this Communication KPI Dashboard With KPI Comparison Ideas PDF This layout presents information on Increase In Brand, Employees Knowledge, Vision Statement It is also available for immediate download and adjustment. So, changes can be made in the color, design, graphics or any other component to create a unique layout.
Lead Tracking Dashboard With Metric Comparison Brochure PDF
This slide showcases dashboard of lead pipeline that can help to identify total number of leads generated and expenses incurred to acquire the audience. It also showcases other key performance metrics like lead breakdown by status and number of leads per month. Pitch your topic with ease and precision using this Lead Tracking Dashboard With Metric Comparison Brochure PDF. This layout presents information on Metric Comparison, Lead Pipeline, Lead Breakdown Status. It is also available for immediate download and adjustment. So, changes can be made in the color, design, graphics or any other component to create a unique layout.

Data Dashboard For Multi Websites Performance Comparison Themes PDF
This slide showcases website statistics dashboard that can help to do the comparative assessment of visitors and traffic performance of multiple websites. Its key components are website overview, traffic sources and conversions. Showcasing this set of slides titled Data Dashboard For Multi Websites Performance Comparison Themes PDF. The topics addressed in these templates are Data Dashboard For Multi Websites Performance Comparison. All the content presented in this PPT design is completely editable. Download it and make adjustments in color, background, font etc. as per your unique business setting.

Catering Business Advertisement Plan KPI Dashboard With Revenue Comparison Icons PDF
This slide shows the KPI dashboard of the catering industry to evaluate the actual and potential targets. It includes KPIs such as expenditure, sales revenue, beverage, etc. Showcasing this set of slides titled Catering Business Advertisement Plan KPI Dashboard With Revenue Comparison Icons PDF. The topics addressed in these templates are Expenditure, Revenue Comparison, Department. All the content presented in this PPT design is completely editable. Download it and make adjustments in color, background, font etc. as per your unique business setting.

Quarterly Sales Performance Of Business Dashboard With Region And Product Wise Comparison Guidelines PDF
This slide displays sales analysis for different products and regions in each quarter. t also includes inter year comparisons. Pitch your topic with ease and precision using this Quarterly Sales Performance Of Business Dashboard With Region And Product Wise Comparison Guidelines PDF. This layout presents information on Product Wise Quarterly Sales, Comparison. It is also available for immediate download and adjustment. So, changes can be made in the color, design, graphics or any other component to create a unique layout.

Budget Analysis Dashboard With Actual And Forecasted Revenue Comparison Structure PDF
This slide displays the budget analysis report comparing the budget with the actual year to date data. It also helps in making estimations for the remaining year. It includes variance between budgeted and actual gross margin results, service revenue, profit margin, product revenue, payroll cost, etc. Pitch your topic with ease and precision using this Budget Analysis Dashboard With Actual And Forecasted Revenue Comparison Structure PDF. This layout presents information on Payroll Cost, Budget Revenue Components, Product Revenue. It is also available for immediate download and adjustment. So, changes can be made in the color, design, graphics or any other component to create a unique layout.

KPI Dashboard Of Customer And Product Sales Performance Comparison Information PDF
This slide shows the KPI dashboard of client and product sales comparison. It also includes sales by location and total sales. Pitch your topic with ease and precision using this KPI Dashboard Of Customer And Product Sales Performance Comparison Information PDF. This layout presents information on Product Sales, Client Sales, Tim Santana. It is also available for immediate download and adjustment. So, changes can be made in the color, design, graphics or any other component to create a unique layout.

Comparison Ppt File Show PDF
This is a comparison ppt file show pdf template with various stages. Focus and dispense information on two stages using this creative set, that comes with editable features. It contains large content boxes to add your information on topics like male, female. You can also showcase facts, figures, and other relevant content using this PPT layout. Grab it now.
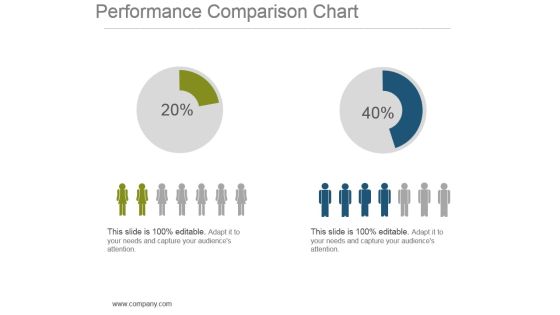
Performance Comparison Chart Powerpoint Show
This is a performance comparison chart powerpoint show. This is a two stage process. The stages in this process are finance, compare, strategy, management, planning.

Comparison Ppt PowerPoint Presentation Graphics
This is a comparison ppt powerpoint presentation graphics. This is a two stage process. The stages in this process are business, compare, marketing, management, success.

Employee Performance Comparison Ppt Infographics
This is a employee performance comparison ppt infographics. This is a two stage process. The stages in this process are customer focus, accountability, service excellence, problem solving, continuous improvement, collaborative conflict resolution.

Comparison Ppt PowerPoint Presentation Professional Slide Download
This is a comparison ppt powerpoint presentation professional slide download. This is a two stage process. The stages in this process are business, marketing, planning, comparison, percentage.

Cost Comparison Analysis Powerpoint Slide Deck
This is a cost comparison analysis powerpoint slide deck. This is a two stage process. The stages in this process are cost comparison, business, strategy, marketing.

Comparison Ppt PowerPoint Presentation Portfolio Example File
This is a comparison ppt powerpoint presentation portfolio example file. This is a two stage process. The stages in this process are business, marketing, comparison, finance, management.
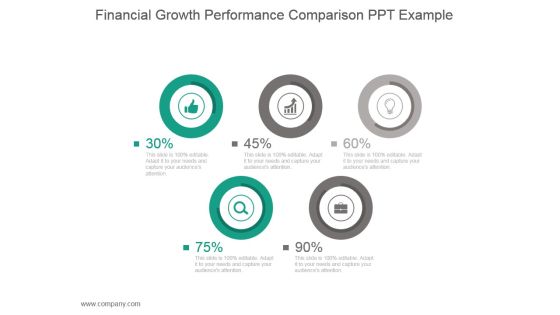
Financial Growth Performance Comparison Ppt Example
This is a financial growth performance comparison ppt example. This is a five stage process. The stages in this process are business, strategy, marketing, finance, icons.
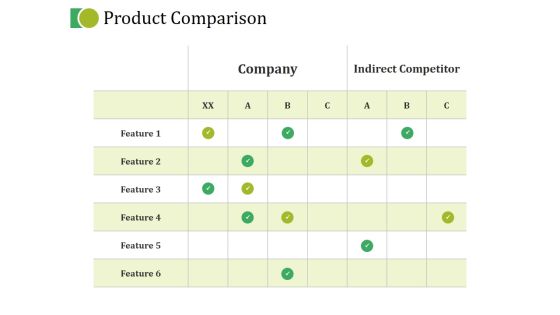
Product Comparison Ppt PowerPoint Presentation Show
This is a product comparison ppt powerpoint presentation show. This is a six stage process. The stages in this process are business, marketing, strategy, planning, tables.
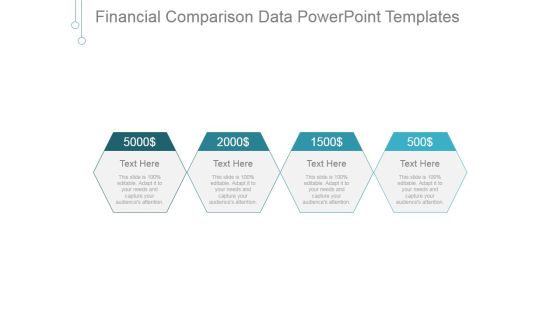
Financial Comparison Data Ppt PowerPoint Presentation Gallery
This is a financial comparison data ppt powerpoint presentation gallery. This is a four stage process. The stages in this process are business, marketing, management, dollar, finance.

Comparison Ppt PowerPoint Presentation Outline Designs Download
This is a comparison ppt powerpoint presentation outline designs download. This is a two stage process. The stages in this process are male, female, strategy, planning, finance.
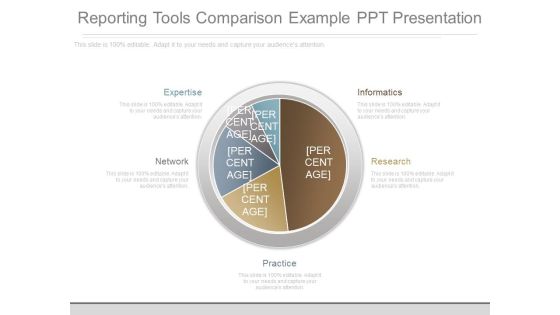
Reporting Tools Comparison Example Ppt Presentation
This is a reporting tools comparison example ppt presentation. This is a five stage process. The stages in this process are expertise, informatics, research, network, practice.

Comparison Ppt PowerPoint Presentation Infographics Information
This is a comparison ppt powerpoint presentation infographics information. This is a two stage process. The stages in this process are design, performance, ceo, editor.
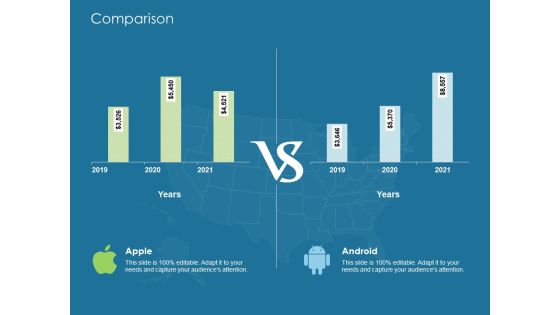
Evaluating Performance Comparison Ppt Infographics Maker PDF
Deliver an awe-inspiring pitch with this creative evaluating performance comparison ppt infographics maker pdf bundle. Topics like comparison can be discussed with this completely editable template. It is available for immediate download depending on the needs and requirements of the user.

Enterprise Staffing Data Software Comparison Professional PDF
The following slide showcases comparison of software that assists in gathering recruitment data. The table include software rating and features such as automation, recruitment marketing and analytics. Persuade your audience using this Enterprise Staffing Data Software Comparison Professional PDF. This PPT design covers five stages, thus making it a great tool to use. It also caters to a variety of topics including Automation, Recruitment Marketing, Analytics. Download this PPT design now to present a convincing pitch that not only emphasizes the topic but also showcases your presentation skills.
Three Tags For Data Comparison Powerpoint Slides
This PPT slide contains graphics of three tags. Download this PowerPoint template to depict data comparison in business presentations. Deliver amazing presentations to mesmerize your audience by using this PPT slide design.

Facility Management And Software Comparison Microsoft PDF
This slide presents a software assessment matrix of facility maintenance service management. It includes various features such as work order fulfillments, property lease management, data analytics, tracking expenses, floor plan optimization and preventative maintenance scheduling. Pitch your topic with ease and precision using this Facility Management And Software Comparison Microsoft PDF. This layout presents information on Work Order Fulfillments, Propertylease Management, Data Analytics. It is also available for immediate download and adjustment. So, changes can be made in the color, design, graphics or any other component to create a unique layout.
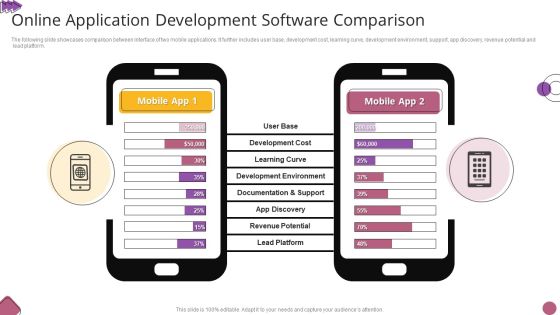
Online Application Development Software Comparison Slides PDF
This slide depicts different technological trends for development of new mobile application. It includes trends based on AI and machine learning, mobile commerce, 5G technology.Persuade your audience using this Online Application Development Software Comparison Slides PDF. This PPT design covers one stage, thus making it a great tool to use. It also caters to a variety of topics including Development Cost, Development Environment, Revenue Potential. Download this PPT design now to present a convincing pitch that not only emphasizes the topic but also showcases your presentation skills.
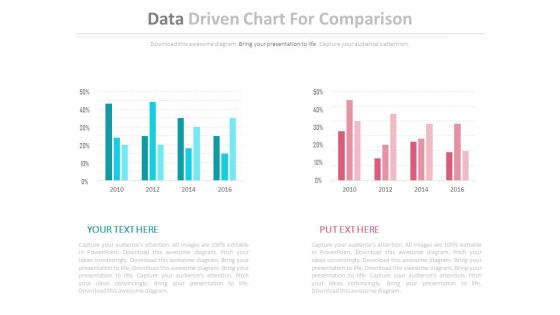
Two Data Driven Comparison Charts Powerpoint Slides
This PowerPoint template contains diagram of two data driven charts. You may use this PPT slide to depict strategic analysis for business. The color coding of this template is specifically designed to highlight you points.
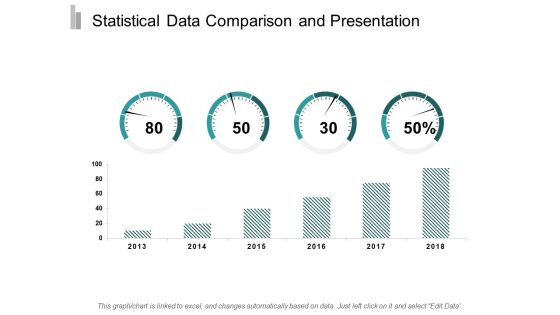
Statistical Data Comparison And Presentation Ppt Powerpoint Presentation Gallery Backgrounds
This is a statistical data comparison and presentation ppt powerpoint presentation gallery backgrounds. This is a two stage process. The stages in this process are data presentation, content presentation, information presentation.

Comparison Between Agile And Scrum IT Scrum Vs Kanban Comparison Between Agile Approaches Slides PDF
Mentioned slide shows a comparison between agile approaches namely scrum and Kanban based on parameters namely meetings, work-in-progress, KPIs and roles. This is a comparison between agile and scrum it scrum vs kanban comparison between agile approaches slides pdf template with various stages. Focus and dispense information on two stages using this creative set, that comes with editable features. It contains large content boxes to add your information on topics like scrum, kanban, meetings work progress, key performance indicators, roles. You can also showcase facts, figures, and other relevant content using this PPT layout. Grab it now.

Quality Analysis Of Github Projects Comparison Ppt Outline Rules PDF
Presenting this set of slides with name quality analysis of github projects comparison ppt outline rules pdf. This is a two stage process. The stages in this process are male users, female users. This is a completely editable PowerPoint presentation and is available for immediate download. Download now and impress your audience.
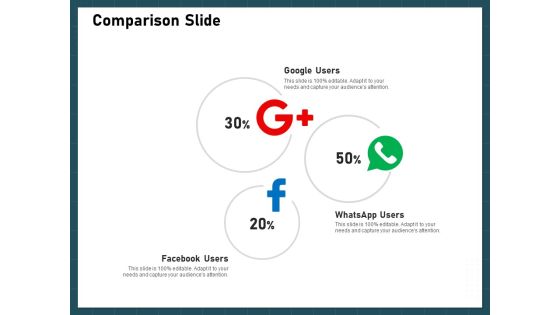
Strategies To Win Customers From Competitors Comparison Slide Brochure PDF
This is a strategies to win customers from competitors comparison slide brochure pdf template with various stages. Focus and dispense information on three stages using this creative set, that comes with editable features. It contains large content boxes to add your information on topics like google users, whatsapp users, facebook users. You can also showcase facts, figures, and other relevant content using this PPT layout. Grab it now.
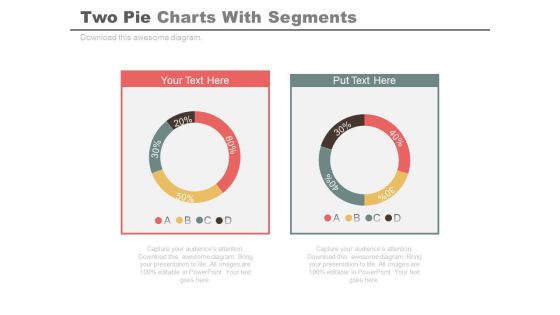
Two Pie Charts For Comparison And Analysis Powerpoint Slides
Develop competitive advantage with our above template of two pie charts. This PowerPoint diagram provides an effective way of displaying business information. You can edit text, color, shade and style as per you need.

CRM Software Comparison Based On Different Factors Demonstration PDF
This slide illustrates the costs of different CRM software. It includes various factors like better business bureau rating, support response, on going drip campaign and process, SMS drip campaigns, etc. Showcasing this set of slides titled CRM Software Comparison Based On Different Factors Demonstration PDF. The topics addressed in these templates are Dashboards, Business Bureau Rating, CRM Software Comparison. All the content presented in this PPT design is completely editable. Download it and make adjustments in color, background, font etc. as per your unique business setting.

CRM Different Software Product Comparison Chart Portrait PDF
This slide indicates product comparison of two different software. It includes variables like free trial, contact management, deal management, task management, social integration, email integration, analytics and dashboards, etc. Presenting CRM Different Software Product Comparison Chart Portrait PDF to dispense important information. This template comprises three stages. It also presents valuable insights into the topics including Deal Management, Task Management, Advertising Management. This is a completely customizable PowerPoint theme that can be put to use immediately. So, download it and address the topic impactfully.

API Ecosystem Dashboard Clipart PDF
This is a api ecosystem dashboard clipart pdf template with various stages. Focus and dispense information on three stages using this creative set, that comes with editable features. It contains large content boxes to add your information on topics like dashboard. You can also showcase facts, figures, and other relevant content using this PPT layout. Grab it now.

Construction Work Progress Report Reporting Software Comparison Professional PDF
This slide showcase comparison of various tools that is used for tracking status of construction project progress. It includes tools such as sablono, BIM 360, oracle primavera, builder trend and raken Showcasing this set of slides titled Construction Work Progress Report Reporting Software Comparison Professional PDF. The topics addressed in these templates are Tools, Dashboards, Attributes . All the content presented in this PPT design is completely editable. Download it and make adjustments in color, background, font etc. as per your unique business setting.

Risk Metrics Dashboard And Mitigation Expenditure Dashboard Ideas PDF
This slide illustrates facts and figures of expenditure incurred on different risks. It includes financial risk, operational risks and competition risks. Pitch your topic with ease and precision using this Risk Metrics Dashboard And Mitigation Expenditure Dashboard Ideas PDF. This layout presents information on Management, Expenditure, Risk. It is also available for immediate download and adjustment. So, changes can be made in the color, design, graphics or any other component to create a unique layout.
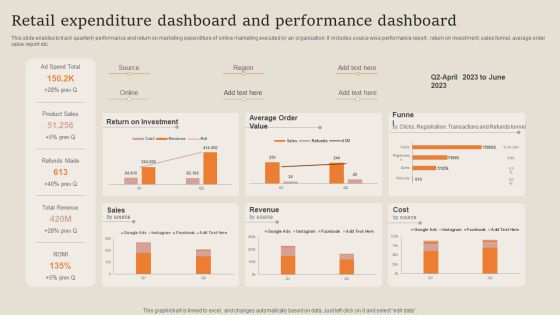
Retail Expenditure Dashboard And Performance Dashboard Formats PDF
This slide enables to track quarterly performance and return on marketing expenditure of online marketing executed by an organization. It includes source wise performance report , return on investment, sales funnel, average order value report etc. Pitch your topic with ease and precision using this Retail Expenditure Dashboard And Performance Dashboard Formats PDF. This layout presents information on Return On Investment, Product Sales, Revenue. It is also available for immediate download and adjustment. So, changes can be made in the color, design, graphics or any other component to create a unique layout.
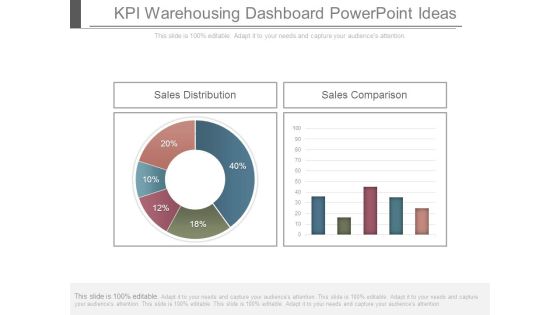
Kpi Warehousing Dashboard Powerpoint Ideas
This is a kpi warehousing dashboard powerpoint ideas. This is a two stage process. The stages in this process are sales distribution, sales comparison.

Email Marketing Document With Device Comparison Inspiration PDF
This slide illustrates a dashboard for email marketing aimed at observing performance of emails to drive marketing efforts effectively. It covers number of requests, opens, clicks, and spam reports with device and browser comparison. Showcasing this set of slides titled Email Marketing Document With Device Comparison Inspiration PDF. The topics addressed in these templates are Device Comparison, Requests, Unsubscribes. All the content presented in this PPT design is completely editable. Download it and make adjustments in color, background, font etc. as per your unique business setting.

Different CRM Software Comparison For Customer Satisfaction Brochure PDF
This slide displays CRM comparison chart based on its features. It includes features like contact management, lead management, opportunities management, dashboards and reports, etc. Pitch your topic with ease and precision using this Different CRM Software Comparison For Customer Satisfaction Brochure PDF. This layout presents information on Opportunities Management, Lead Management, Customer Communication Management. It is also available for immediate download and adjustment. So, changes can be made in the color, design, graphics or any other component to create a unique layout.

Comparison Ppt PowerPoint Presentation Infographic Template Graphics Tutorials
This is a comparison ppt powerpoint presentation infographic template graphics tutorials. This is a two stage process. The stages in this process are comparison, planning, business, management, marketing.
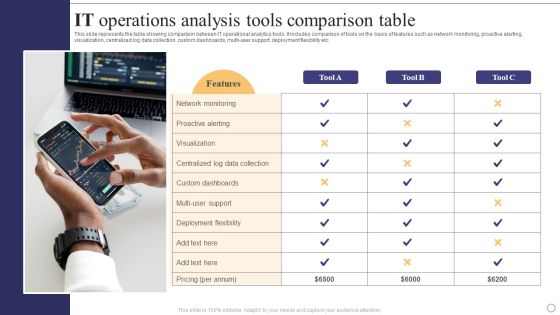
IT Operations Analysis Tools Comparison Table Professional PDF
This slide represents the table showing comparison between IT operational analytics tools. It includes comparison of tools on the basis of features such as network monitoring, proactive alerting, visualization, centralized log data collection, custom dashboards, multi-user support, deployment flexibility etc. Persuade your audience using this IT Operations Analysis Tools Comparison Table Professional PDF. This PPT design covers one stage, thus making it a great tool to use. It also caters to a variety of topics including Network monitoring, Custom dashboards, Deployment flexibility. Download this PPT design now to present a convincing pitch that not only emphasizes the topic but also showcases your presentation skills.
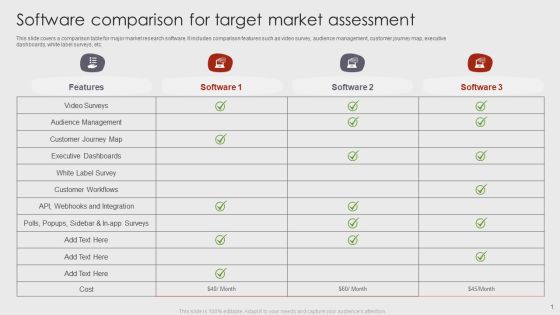
Software Comparison For Target Market Assessment Brochure PDF
This slide covers a comparison table for major market research software. It includes comparison features such as video survey, audience management, customer journey map, executive dashboards, white label surveys, etc. Showcasing this set of slides titled Software Comparison For Target Market Assessment Brochure PDF. The topics addressed in these templates are Executive Dashboards, Audience Management, Customer Workflows. All the content presented in this PPT design is completely editable. Download it and make adjustments in color, background, font etc. as per your unique business setting.

Comparison Between White Black And Grey Hat SEO Training Ppt
The following slide depicts the comparison of white, black, and grey hat SEO. The multiple parameters used for comparison are search engine guidelines, ideal for long term, time taken to deliver results, cost involved long term, and risk involved.

Online Shop Order Management Software Comparison Graphics PDF
This illustrate comparison of various online order management software to effectively and efficiently manage organizational sales. It includes elements such as bulk orders and inventory volume, centralized dashboard, returns management etc. Showcasing this set of slides titled Online Shop Order Management Software Comparison Graphics PDF. The topics addressed in these templates are Bulk Orders Inventory Volume, Centralized Dashboard, Returns Management. All the content presented in this PPT design is completely editable. Download it and make adjustments in color, background, font etc. as per your unique business setting.

Tracking Goals Key Results OKR Software Comparison Inspiration PDF
This slide showcases major objective tracking software developed to assist in establishing and tracking OKRs. It also includes key features of software comparison such as please survey, 1 to 1 meeting, status reports, action needed reminder, dashboards, department OKR, customizable check ins, etc. Pitch your topic with ease and precision using this Tracking Goals Key Results OKR Software Comparison Inspiration PDF. This layout presents information on Tracking Goals Key Results, Software Comparison. It is also available for immediate download and adjustment. So, changes can be made in the color, design, graphics or any other component to create a unique layout.
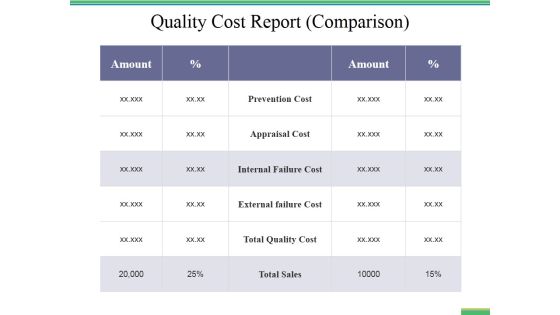
Quality Cost Report Comparison Ppt PowerPoint Presentation Infographic Template
This is a quality cost report comparison ppt powerpoint presentation infographic template. This is a two stage process. The stages in this process are business, comparison, marketing, amount, strategy.

Comparison Metrics For Business Partner Lifecycle Management Guidelines PDF
The following slide highlights the comparison metrics for partner lifecycle management illustrating key headings which includes comparison area, comparison metric, high score, low score and partner. Where comparison are depicts business size, management, growth strategy, integration and finance. Pitch your topic with ease and precision using this Comparison Metrics For Business Partner Lifecycle Management Guidelines PDF. This layout presents information on Business Size, Management, Growth Strategy. It is also available for immediate download and adjustment. So, changes can be made in the color, design, graphics or any other component to create a unique layout.

Product Comparison Ppt PowerPoint Presentation Show Slide Portrait
This is a product comparison ppt powerpoint presentation show slide portrait. This is a six stage process. The stages in this process are table, data, analysis, business, marketing.

Automated Data Handling Tools Comparison Analysis Formats PDF
This slide showcase comparison of various digital automation data management tools to choose suitable one as per requirements. It includes elements such as tool names, features, price, review and level of complexity. Showcasing this set of slides titled Automated Data Handling Tools Comparison Analysis Formats PDF. The topics addressed in these templates are High Data Security, Analysis, Interactive Dashboards. All the content presented in this PPT design is completely editable. Download it and make adjustments in color, background, font etc. as per your unique business setting.

Campaign Business Cost Per Conversion Comparison Table Graphics PDF
This slide covers comparison table based on cost per conversion for different campaign techniques. It includes elements such as campaign types, cost incurred, CTR and cost or conversion. Pitch your topic with ease and precision using this Campaign Business Cost Per Conversion Comparison Table Graphics PDF. This layout presents information on Data Analysis, Data Warehousing, Interactive Dashboards. It is also available for immediate download and adjustment. So, changes can be made in the color, design, graphics or any other component to create a unique layout.

CRM Program Comparison Sheet Ppt PowerPoint Presentation File Outline PDF
This slide covers CRM software comparison features such as email tracking and automation, activity reporting and analytics, customizable sales dashboard, centralized platform, CRM mobile apps, etc. Find a pre designed and impeccable CRM Program Comparison Sheet Ppt PowerPoint Presentation File Outline PDF. The templates can ace your presentation without additional effort. You can download these easy to edit presentation templates to make your presentation stand out from others. So, what are you waiting for Download the template from Slidegeeks today and give a unique touch to your presentation.
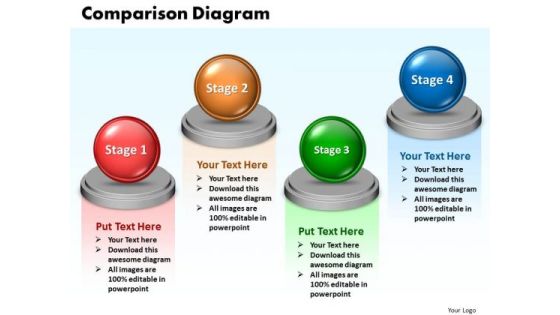
Ppt Comparison Network Diagram PowerPoint Template 4 Phase Templates
PPT comparison network diagram powerpoint template 4 phase Templates-This PowerPoint diagram slide shows four opposing views. You can use the This PowerPoint diagram slide to represent views from different functions on an issue.-PPT comparison network diagram powerpoint template 4 phase Templates-Abstract, Achievement, Business, Chart, Comparison, Concepts, Data, Descriptive, Design, Development, Diagram, Element, Figure, Finance, Financial, Graph, Graphic, Growth, Icon, Ideas, Improvement, Investment, Market, Money, Progress, Raise, Real, Report, Revenue, Sale, Shape, Sign, Silhouette, Stock, Success, Symbol, Technology

Big Data Database Comparison Ppt PowerPoint Presentation Outline
This is a big data database comparison ppt powerpoint presentation outline. This is a four stage process. The stages in this process are business, finance, management, percentage, growth.

Companys Data Safety Recognition Comparison Ppt Summary Designs Download PDF
Presenting companys data safety recognition comparison ppt summary designs download pdf to provide visual cues and insights. Share and navigate important information on two stages that need your due attention. This template can be used to pitch topic like comparison. In addition, this PPT design contains high-resolution images, graphics, etc, that are easily editable and available for immediate download.

Firm Data Collection Software Feature Comparison Background PDF
Pitch your topic with ease and precision using this firm data collection software feature comparison background pdf. This layout presents information on firm data collection software feature comparison. It is also available for immediate download and adjustment. So, changes can be made in the color, design, graphics or any other component to create a unique layout.
Marketing Diagram Comparison Table For Business Data Sales Diagram
Establish Your Dominion With Our Marketing Diagram Comparison Table For Business Data Sales Diagram Powerpoint Templates. Rule The Stage With Your Thoughts.

Quality Cost Report Comparison Ppt PowerPoint Presentation Inspiration Example
This is a quality cost report comparison ppt powerpoint presentation inspiration example. This is a two stage process. The stages in this process are marketing, business, management, compare.

Data Breach Prevention Recognition Comparison Ppt Icon Background Image PDF
This is a data breach prevention recognition comparison ppt icon background image pdf template with various stages. Focus and dispense information on two stages using this creative set, that comes with editable features. It contains large content boxes to add your information on topic like comparison. You can also showcase facts, figures, and other relevant content using this PPT layout. Grab it now.

Market Comparison Summary Of Mobile Application Portrait PDF
The following slide highlights the mobile application comparison report which includes the major features such as support android and iOS and dark mode functionality. Pitch your topic with ease and precision using this Market Comparison Summary Of Mobile Application Portrait PDF. This layout presents information on Market Comparison Summary Of Mobile Application. It is also available for immediate download and adjustment. So, changes can be made in the color, design, graphics or any other component to create a unique layout.

Product Comparison Ppt PowerPoint Presentation Visual Aids Gallery
This is a product comparison ppt powerpoint presentation visual aids gallery. This is a six stage process. The stages in this process are business, table, marketing, data analysis, feature.

Product Features Comparison Report Ppt PowerPoint Presentation File Inspiration PDF
Showcasing this set of slides titled product features comparison report ppt powerpoint presentation file inspiration pdf. The topics addressed in these templates are product features comparison report. All the content presented in this PPT design is completely editable. Download it and make ajustments in color, background, font etc. as per your unique business setting.

Comparison Based On Criteria Ppt PowerPoint Presentation Model Inspiration
This is a comparison based on criteria ppt powerpoint presentation model inspiration. This is a seven stage process. The stages in this process are revenue, profit, market share, number of employees, product quality.

Workforce Performance Comparison Icon Ppt Pictures Infographic Template PDF
Showcasing this set of slides titled Workforce Performance Comparison Icon Ppt Pictures Infographic Template PDF. The topics addressed in these templates are Workforce Performance, Comparison Icon. All the content presented in this PPT design is completely editable. Download it and make adjustments in color, background, font etc. as per your unique business setting.

Sales Performance Comparison In Multiple Locations Ppt Slides
This is a sales performance comparison in multiple locations ppt slides. This is a two stage process. The stages in this process are business, marketing, location, finance, strategy, analysis.

Product Comparison Ppt PowerPoint Presentation Styles Background Images
This is a product comparison ppt powerpoint presentation styles background images. This is a six stage process. The stages in this process are indirect competitor, company, feature, business, marketing.

Business Intelligence Report Touchpoint Performance Comparison Ppt Layouts Introduction PDF
Presenting this set of slides with name business intelligence report touchpoint performance comparison ppt layouts introduction pdf. This is a one stage process. The stages in this process are touchpoint performance comparison. This is a completely editable PowerPoint presentation and is available for immediate download. Download now and impress your audience.

Comparison Of Broad And Long Tail Keywords Training Ppt
This slide provides information regarding the comparison of board and long-tail keywords on multiple factors such as the number of words, search intent, keyword search volume, keyword competition, effort required to rank, and conversion rate.

Data Driven Comparison Charts For Analysis Powerpoint Slides
You can download this PowerPoint template to display statistical data and analysis. This PPT slide contains data driven comparison charts. Draw an innovative business idea using this professional diagram.

Comparison Based On Criteria Ppt PowerPoint Presentation Infographics Graphics Download
This is a comparison based on criteria ppt powerpoint presentation infographics graphics download. This is a six stage process. The stages in this process are high value, low value, low trust, high trust.

Website Performance Analysis Tools Comparison Ppt Show Background PDF
This slide covers comparison of tools to analyse performance of a website. It includes comparison based on features such as real time data, A or B testing, heat maps, word press plugin, email support, tool costs, etc.Pitch your topic with ease and precision using this Website Performance Analysis Tools Comparison Ppt Show Background PDF. This layout presents information on Real Time, Heatmaps, Email Support. It is also available for immediate download and adjustment. So, changes can be made in the color, design, graphics or any other component to create a unique layout.

Test Tubes With Percentage Data For Comparison Powerpoint Slides
This PowerPoint template has been designed with test tubes and percentage data. You may download this PPT slide to display data comparison and analysis. Add this slide to your presentation and impress your superiors.

Big Data Analytics Comparison Technology Ppt Summary Rules PDF
This is a big data analytics comparison technology ppt summary rules pdf template with various stages. Focus and dispense information on two stages using this creative set, that comes with editable features. It contains large content boxes to add your information on topics like people user, comparison, audiences attention. You can also showcase facts, figures, and other relevant content using this PPT layout. Grab it now.
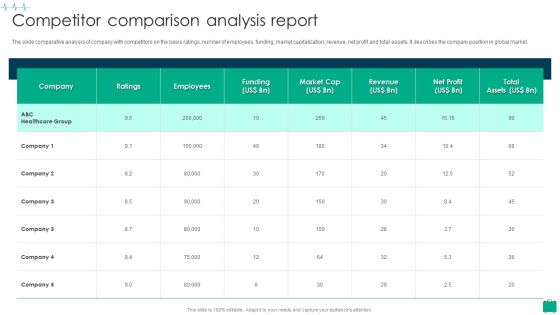
Healthcare Services Company Profile Competitor Comparison Analysis Report Summary PDF
The slide comparative analysis of company with competitors on the basis ratings, number of employees, funding, market capitalization, revenue, net profit and total assets. It describes the company position in global market.Deliver an awe inspiring pitch with this creative Healthcare Services Company Profile Competitor Comparison Analysis Report Summary PDF bundle. Topics like Competitor Comparison, Analysis Report can be discussed with this completely editable template. It is available for immediate download depending on the needs and requirements of the user.

Trend Analysis Yearly Comparison Ppt Powerpoint Presentation Professional Show
This is a trend analysis yearly comparison ppt powerpoint presentation professional show. This is a two stage process. The stages in this process are finance, marketing, management, investment, analysis.

Trend Analysis Yearly Comparison Ppt Powerpoint Presentation Layouts Slideshow
This is a trend analysis yearly comparison ppt powerpoint presentation layouts slideshow. This is a two stage process. The stages in this process are finance, marketing, management, investment, analysis.

Trend Analysis Yearly Comparison Ppt Powerpoint Presentation Professional Example
This is a trend analysis yearly comparison ppt powerpoint presentation professional example. This is a two stage process. The stages in this process are finance, marketing, management, investment, analysis.
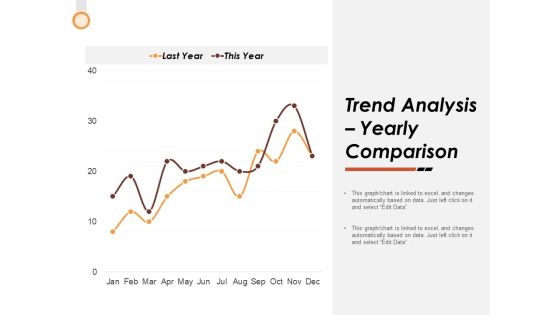
Trend Analysis Yearly Comparison Ppt PowerPoint Presentation Summary Visual Aids
This is a trend analysis yearly comparison ppt powerpoint presentation summary visual aids. This is a two stage process. The stages in this process are finance, strategy, marketing, management, business.
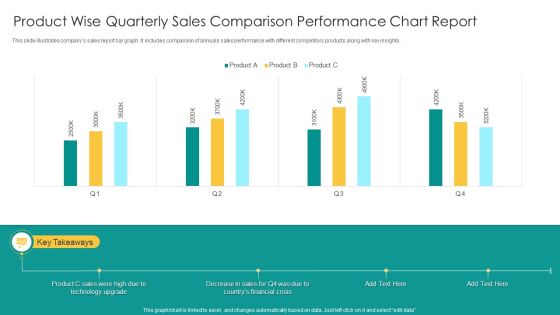
Product Wise Quarterly Sales Comparison Performance Chart Report Infographics PDF
This slide illustrates companys sales report bar graph. It includes comparison of annuals sales performance with different competitors products along with key insights. Showcasing this set of slides titled Product Wise Quarterly Sales Comparison Performance Chart Report Infographics PDF. The topics addressed in these templates are Product C Sales, Technology Upgrade, Financial Crisis. All the content presented in this PPT design is completely editable. Download it and make adjustments in color, background, font etc. as per your unique business setting.

Competitor Comparison Report IT Software Development Company Profile Background PDF
The slide highlights the competitor report for IT company. It compares companies on the basis of business segment, geographical presence, financial revenue and global market share. Deliver an awe inspiring pitch with this creative Competitor Comparison Report IT Software Development Company Profile Background PDF bundle. Topics like Competitor Comparison Report, Revenue Per Employee can be discussed with this completely editable template. It is available for immediate download depending on the needs and requirements of the user.
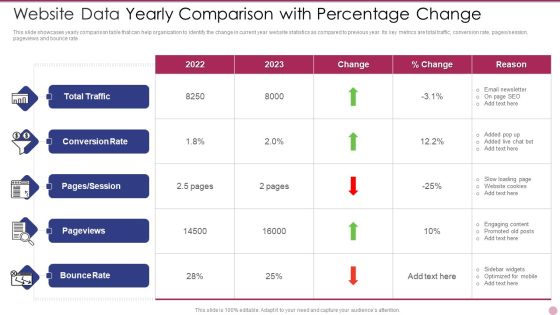
Website Data Yearly Comparison With Percentage Change Formats PDF
This slide showcases yearly comparison table that can help organization to identify the change in current year website statistics as compared to previous year. Its key metrics are total traffic, conversion rate, pages or session, pageviews and bounce rate. Pitch your topic with ease and precision using this Website Data Yearly Comparison With Percentage Change Formats PDF. This layout presents information on Website Data Yearly Comparison With Percentage Change. It is also available for immediate download and adjustment. So, changes can be made in the color, design, graphics or any other component to create a unique layout.
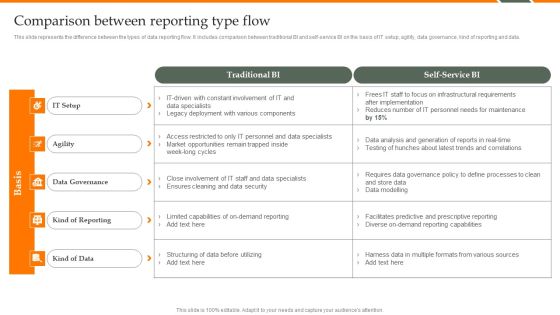
Human Resource Analytics Comparison Between Reporting Type Flow Demonstration PDF
This slide represents the difference between the types of data reporting flow. It includes comparison between traditional BI and self-service BI on the basis of IT setup, agility, data governance, kind of reporting and data. If your project calls for a presentation, then Slidegeeks is your go-to partner because we have professionally designed, easy-to-edit templates that are perfect for any presentation. After downloading, you can easily edit Human Resource Analytics Comparison Between Reporting Type Flow Demonstration PDF and make the changes accordingly. You can rearrange slides or fill them with different images. Check out all the handy templates.

Quality Cost Report Comparison Ppt PowerPoint Presentation Diagram Lists
This is a quality cost report comparison ppt powerpoint presentation diagram lists. This is a two stage process. The stages in this process are business, management, analysis, strategy, marketing.
Quality Cost Report Comparison Ppt PowerPoint Presentation Icon Background Designs
This is a quality cost report comparison ppt powerpoint presentation icon background designs. This is a two stage process. The stages in this process are compare, business, table, marketing, strategy.

Quality Cost Report Comparison Ppt PowerPoint Presentation Outline Graphics Pictures
This is a quality cost report comparison ppt powerpoint presentation outline graphics pictures. This is a two stage process. The stages in this process are compare, marketing, business, management, planning.
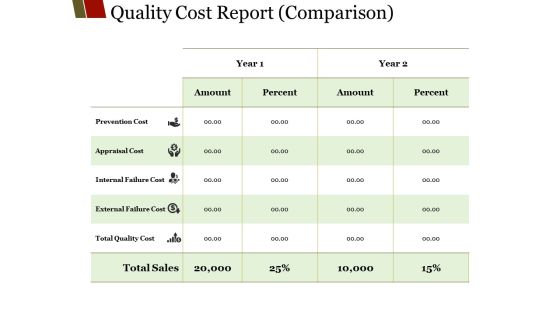
Quality Cost Report Comparison Ppt PowerPoint Presentation Visual Aids Model
This is a quality cost report comparison ppt powerpoint presentation visual aids model. This is a five stage process. The stages in this process are amount, percent, year, prevention cost, prevention cost.

Quality Cost Report Comparison Ppt PowerPoint Presentation Model Portfolio
This is a quality cost report comparison ppt powerpoint presentation model portfolio. This is a two stage process. The stages in this process are prevention cost, appraisal cost, internal failure cost, external failure cost, total quality cost.
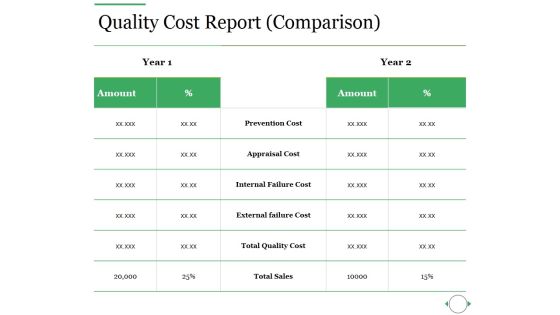
Quality Cost Report Comparison Ppt PowerPoint Presentation Ideas Slides
This is a quality cost report comparison ppt powerpoint presentation ideas slides. This is a two stage process. The stages in this process are prevention cost, appraisal cost, internal failure cost, external failure cost, total quality cost.
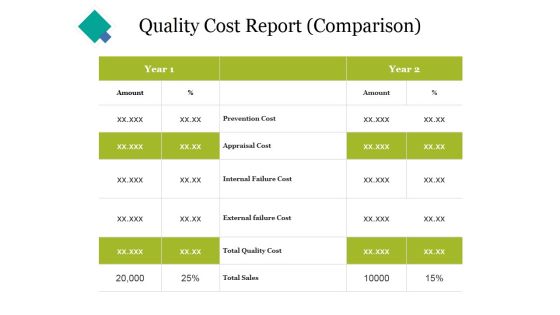
Quality Cost Report Comparison Ppt PowerPoint Presentation Portfolio Themes
This is a quality cost report comparison ppt powerpoint presentation portfolio themes. This is a two stage process. The stages in this process are prevention cost, appraisal cost, internal failure cost, external failure cost, total quality cost.

quality cost report comparison ppt powerpoint presentation portfolio information
This is a quality cost report comparison ppt powerpoint presentation portfolio information. This is a two stage process. The stages in this process are prevention cost, appraisal cost, internal failure cost, external failure cost, total quality cost.

Comparison Based On Criteria Ppt PowerPoint Presentation Infographics Elements
This is a comparison based on criteria ppt powerpoint presentation infographics elements. This is a four stage process. The stages in this process are design, price, performance, product, competitor.

Comparison Of Customer Information Software Features Infographics PDF
Mentioned slide illustrates customer data platform features. This slide provide information about comparison of CDP features such as enterprise data warehouse, customer relationship management, data management platform etc.Showcasing this set of slides titled Comparison Of Customer Information Software Features Infographics PDF. The topics addressed in these templates are Marketing Execution, Marketer Managed, Experience Platform. All the content presented in this PPT design is completely editable. Download it and make adjustments in color, background, font etc. as per your unique business setting.

Toolkit For Data Science And Analytics Transition Comparison Brochure PDF
Do you have to make sure that everyone on your team knows about any specific topic I yes, then you should give Toolkit For Data Science And Analytics Transition Comparison Brochure PDF a try. Our experts have put a lot of knowledge and effort into creating this impeccable Toolkit For Data Science And Analytics Transition Comparison Brochure PDF. You can use this template for your upcoming presentations, as the slides are perfect to represent even the tiniest detail. You can download these templates from the Slidegeeks website and these are easy to edit. So grab these today.

Comparison Between Data Governance And Data Stewardship Pictures PDF
This slide represents the comparison between data governance and data stewardship however, both are interconnected. Data governance describes the policies and regulations for data and data stewardship implements those policies in the organization. Here you can discover an assortment of the finest PowerPoint and Google Slides templates. With these templates, you can create presentations for a variety of purposes while simultaneously providing your audience with an eye catching visual experience. Download Comparison Between Data Governance And Data Stewardship Pictures PDF to deliver an impeccable presentation. These templates will make your job of preparing presentations much quicker, yet still, maintain a high level of quality. Slidegeeks has experienced researchers who prepare these templates and write high quality content for you. Later on, you can personalize the content by editing the Comparison Between Data Governance And Data Stewardship Pictures PDF.
Online Purchase Comparison For Various Countries Ppt Layouts Icons PDF
This slide shows the purchasing products online comparison with previous month in coronavirus pandemic which includes Global, COVID-19, E-commerce, growth in E-commerce market will increase, etc. Deliver an awe-inspiring pitch with this creative online purchase comparison for various countries ppt layouts icons pdf bundle. Topics like businesses, market report, growth, e commerce can be discussed with this completely editable template. It is available for immediate download depending on the needs and requirements of the user.

Fire Detection System And Control Panel Comparison Chart Information PDF
Pitch your topic with ease and precision using this Fire Detection System And Control Panel Comparison Chart Information PDF. This layout presents information on Digital Communicator, System Voltage, Remote Annunciator. It is also available for immediate download and adjustment. So, changes can be made in the color, design, graphics or any other component to create a unique layout.

3 Vendor Comparison Performance Parameters Ppt Portfolio Topics PDF
The following slide showcases comparison between suppliers on basis of KPIs. The metrics covered are compliance, defect and quality rate, on-time delivery and lead time. Pitch your topic with ease and precision using this 3 Vendor Comparison Performance Parameters Ppt Portfolio Topics PDF. This layout presents information on Supplier Compliance Rate, Defect Rate, Lead Time. It is also available for immediate download and adjustment. So, changes can be made in the color, design, graphics or any other component to create a unique layout.

Two Year Comparison Of Customer Service Metrics Information PDF
This slide showcases yearly comparison of customer service metrics that can help to identify percentage change as compared to previous year and evaluate reason behind decrease and increase. Its key KPIs are customer satisfaction score, avg call response time, customer effort score and average handle time. Pitch your topic with ease and precision using this Two Year Comparison Of Customer Service Metrics Information PDF. This layout presents information on Customer Effort Score, Customer Satisfaction Score, Average Handle Time. It is also available for immediate download and adjustment. So, changes can be made in the color, design, graphics or any other component to create a unique layout.

Business Analytics Application Comparison Between Reporting Type Flow Ideas PDF
This slide represents the difference between the types of data reporting flow. It includes comparison between traditional BI and self-service BI on the basis of IT setup, agility, data governance, kind of reporting and data. Are you in need of a template that can accommodate all of your creative concepts This one is crafted professionally and can be altered to fit any style. Use it with Google Slides or PowerPoint. Include striking photographs, symbols, depictions, and other visuals. Fill, move around, or remove text boxes as desired. Test out color palettes and font mixtures. Edit and save your work, or work with colleagues. Download Business Analytics Application Comparison Between Reporting Type Flow Ideas PDF and observe how to make your presentation outstanding. Give an impeccable presentation to your group and make your presentation unforgettable.

Financial Comparison With Competitors Movie Editing Company Outline Microsoft PDF
This slide focuses on financial comparison with competitors on the basis of annual revenue, net profit, market share, number of released movies and overall rating.The Financial Comparison With Competitors Movie Editing Company Outline Microsoft PDF is a compilation of the most recent design trends as a series of slides. It is suitable for any subject or industry presentation, containing attractive visuals and photo spots for businesses to clearly express their messages. This template contains a variety of slides for the user to input data, such as structures to contrast two elements, bullet points, and slides for written information. Slidegeeks is prepared to create an impression.

Comparison Of Multiple Customer Relationship Management Capabilities Software Introduction PDF
Mentioned slide shows comparison of different customer relationship management CRM capability software which will assist managers to select the software for improving customer relations. It contains key features of software such as integration, marketing automation, contact management, reporting, email management, mobile access etc. Presenting comparison of multiple customer relationship management capabilities software introduction pdf to dispense important information. This template comprises four stages. It also presents valuable insights into the topics including integration, marketing automation, contact management, pipeline management. This is a completely customizable PowerPoint theme that can be put to use immediately. So, download it and address the topic impactfully.
Five Projects Performance Comparison Report Ppt Infographic Template Icons PDF
Pitch your topic with ease and precision using this five projects performance comparison report ppt infographic template icons pdf. This layout presents information on construction project, business project, event project. It is also available for immediate download and adjustment. So, changes can be made in the color, design, graphics or any other component to create a unique layout.

Medical Care Company Overview Competitor Comparison Analysis Report Introduction PDF
The slide comparative analysis of company with competitors on the basis ratings, number of employees, funding, market capitalization, revenue, net profit and total assets. It describes the company position in global market. Deliver an awe inspiring pitch with this creative Medical Care Company Overview Competitor Comparison Analysis Report Introduction PDF bundle. Topics like Employees, Market, Revenue can be discussed with this completely editable template. It is available for immediate download depending on the needs and requirements of the user.

Customer Support Services Company Profile Financial Performance Comparison Infographics PDF
This slide highlights the financial performance analysis of multiple call centers on the basis of operating margin, and revenue growth. It includes Sykes, TeleTech, Convergys and ABC Pvt ltd. Deliver and pitch your topic in the best possible manner with this Customer Support Services Company Profile Financial Performance Comparison Infographics PDF. Use them to share invaluable insights on Revenue Growth, Operating Margin and impress your audience. This template can be altered and modified as per your expectations. So, grab it now.

IT Application Services Company Outline Competitor Comparison Report Elements PDF
The slide highlights the competitor report for IT company. It compares companies on the basis of business segment, geographical presence, financial revenue and global market share. Deliver an awe inspiring pitch with this creative IT Application Services Company Outline Competitor Comparison Report Elements PDF bundle. Topics like Total Employees, Revenue Per Employee, Countries Served can be discussed with this completely editable template. It is available for immediate download depending on the needs and requirements of the user.
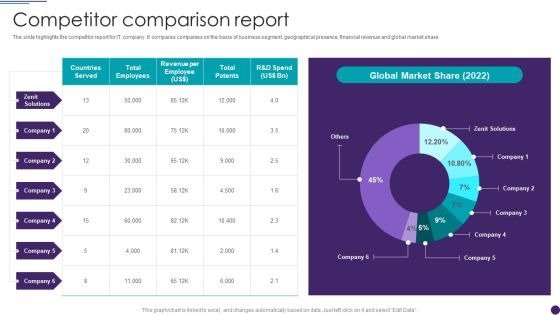
IT Services Business Profile Competit Or Comparison Report Microsoft PDF
The slide highlights the competitor report for IT company. It compares companies on the basis of business segment, geographical presence, financial revenue and global market share Deliver an awe inspiring pitch with this creative IT Services Business Profile Competit Or Comparison Report Microsoft PDF bundle. Topics like Revenue Per Employee, Global Market Share can be discussed with this completely editable template. It is available for immediate download depending on the needs and requirements of the user.

Information Systems Security And Risk Management Plan Comparison Rules PDF
This graph chart is linked to excel, and changes automatically based on data. Just left click on it and select Edit Data. Find highly impressive Information Systems Security And Risk Management Plan Comparison Rules PDF on Slidegeeks to deliver a meaningful presentation. You can save an ample amount of time using these presentation templates. No need to worry to prepare everything from scratch because Slidegeeks experts have already done a huge research and work for you. You need to download Information Systems Security And Risk Management Plan Comparison Rules PDF for your upcoming presentation. All the presentation templates are 100 percent editable and you can change the color and personalize the content accordingly. Download now.

Deployment Of Business Process Comparison Ppt Infographic Template Microsoft PDF
From laying roadmaps to briefing everything in detail, our templates are perfect for you. You can set the stage with your presentation slides. All you have to do is download these easy-to-edit and customizable templates. Deployment Of Business Process Comparison Ppt Infographic Template Microsoft PDF will help you deliver an outstanding performance that everyone would remember and praise you for. Do download this presentation today.

Software Tool Comparison Assessment Matrix Ppt Pictures Outline PDF
This slide showcases software comparison and assessment matrix of customer segmentation software solution tools. It includes key elements such as cohort analysis, lifetime value, acquisition, behavior, conversation metrics, affinity categories, in market segment, market email activity, ads interactions, etc. Present like a pro with Software Tool Comparison Assessment Matrix Ppt Pictures Outline PDF Create beautiful presentations together with your team, using our easy to use presentation slides. Share your ideas in real time and make changes on the fly by downloading our templates. So whether you are in the office, on the go, or in a remote location, you can stay in sync with your team and present your ideas with confidence. With Slidegeeks presentation got a whole lot easier. Grab these presentations today.

5 Stages Comparison Process Great Business Plan Examples PowerPoint Templates
We present our 5 stages comparison process great business plan examples PowerPoint templates .Download our Flow Charts PowerPoint Templates because Our PowerPoint Templates and Slides will give good value for money. They also have respect for the value of your time. Download and present our Arrows PowerPoint Templates because Our PowerPoint Templates and Slides ensures Effective communication. They help you put across your views with precision and clarity. Download our Business PowerPoint Templates because You can Be the puppeteer with our PowerPoint Templates and Slides as your strings. Lead your team through the steps of your script. Download our Marketing PowerPoint Templates because You will get more than you ever bargained for. Use our Shapes PowerPoint Templates because You can Channelise the thoughts of your team with our PowerPoint Templates and Slides. Urge them to focus on the goals you have set.Use these PowerPoint slides for presentations relating to Ambition, arrows, business, chart, competition, data, finance, focus, goals, grey, growth, improvement, lead, leader, leadership, marketing, opportunity, sign, standing out, strategy, success, vision. The prominent colors used in the PowerPoint template are Green, White, Gray. Customers tell us our 5 stages comparison process great business plan examples PowerPoint templates will make the presenter look like a pro even if they are not computer savvy. Customers tell us our finance PowerPoint templates and PPT Slides are readymade to fit into any presentation structure. We assure you our 5 stages comparison process great business plan examples PowerPoint templates are visually appealing. Customers tell us our goals PowerPoint templates and PPT Slides are effectively colour coded to prioritise your plans They automatically highlight the sequence of events you desire. Professionals tell us our 5 stages comparison process great business plan examples PowerPoint templates are second to none. PowerPoint presentation experts tell us our goals PowerPoint templates and PPT Slides will make the presenter successul in his career/life.

5 Stages Comparison Process Business Plan Maker PowerPoint Slides
We present our 5 stages comparison process business plan maker PowerPoint Slides .Download and present our Flow Charts PowerPoint Templates because Our PowerPoint Templates and Slides are conceived by a dedicated team. Use them and give form to your wondrous ideas. Download and present our Arrows PowerPoint Templates because Our PowerPoint Templates and Slides are created with admirable insight. Use them and give your group a sense of your logical mind. Use our Business PowerPoint Templates because You can Be the star of the show with our PowerPoint Templates and Slides. Rock the stage with your ideas. Present our Marketing PowerPoint Templates because Our PowerPoint Templates and Slides are created with admirable insight. Use them and give your group a sense of your logical mind. Download our Shapes PowerPoint Templates because Your success is our commitment. Our PowerPoint Templates and Slides will ensure you reach your goal.Use these PowerPoint slides for presentations relating to Ambition, arrows, business, chart, competition, data, finance, focus, goals, grey, growth, improvement, lead, leader, leadership, marketing, opportunity, sign, standing out, strategy, success, vision. The prominent colors used in the PowerPoint template are Blue, White, Gray. Customers tell us our 5 stages comparison process business plan maker PowerPoint Slides are visually appealing. Customers tell us our business PowerPoint templates and PPT Slides provide you with a vast range of viable options. Select the appropriate ones and just fill in your text. We assure you our 5 stages comparison process business plan maker PowerPoint Slides are designed by a team of presentation professionals. Customers tell us our goals PowerPoint templates and PPT Slides will impress their bosses and teams. Professionals tell us our 5 stages comparison process business plan maker PowerPoint Slides will make the presenter successul in his career/life. PowerPoint presentation experts tell us our finance PowerPoint templates and PPT Slides will make you look like a winner.

5 Stages Comparison Process Create Business Plan Free PowerPoint Slides
We present our 5 stages comparison process create business plan free PowerPoint Slides .Download our Flow Charts PowerPoint Templates because It will mark the footprints of your journey. Illustrate how they will lead you to your desired destination. Download and present our Arrows PowerPoint Templates because Watching this your Audience will Grab their eyeballs, they wont even blink. Present our Business PowerPoint Templates because Your audience will believe you are the cats whiskers. Use our Marketing PowerPoint Templates because You should Bet on your luck with our PowerPoint Templates and Slides. Be assured that you will hit the jackpot. Download our Shapes PowerPoint Templates because You can Be the star of the show with our PowerPoint Templates and Slides. Rock the stage with your ideas.Use these PowerPoint slides for presentations relating to Ambition, arrows, business, chart, competition, data, finance, focus, goals, grey, growth, improvement, lead, leader, leadership, marketing, opportunity, sign, standing out, strategy, success, vision. The prominent colors used in the PowerPoint template are Orange, White, Gray. Customers tell us our 5 stages comparison process create business plan free PowerPoint Slides look good visually. Customers tell us our goals PowerPoint templates and PPT Slides are effectively colour coded to prioritise your plans They automatically highlight the sequence of events you desire. We assure you our 5 stages comparison process create business plan free PowerPoint Slides will impress their bosses and teams. Customers tell us our business PowerPoint templates and PPT Slides will make the presenter successul in his career/life. Professionals tell us our 5 stages comparison process create business plan free PowerPoint Slides will help you be quick off the draw. Just enter your specific text and see your points hit home. PowerPoint presentation experts tell us our business PowerPoint templates and PPT Slides have awesome images to get your point across.

Comparison Matrix Of Corporate Financial Statement Software Download PDF
This template gives insights about the financial reporting software to be used by organizations and presents the data in the form of a comparative matrix for easy analysis and understanding of the user. The key elements are software name, features, best usage etc. Showcasing this set of slides titled Comparison Matrix Of Corporate Financial Statement Software Download PDF. The topics addressed in these templates are Provides Customized Reports, Cloud Based Reports Made, Option Tax Calculation. All the content presented in this PPT design is completely editable. Download it and make adjustments in color, background, font etc. as per your unique business setting.

Big Data Global Market Revenue Annual Comparison Structure PDF
The purpose of this slide is to showcase a comprehensive overview of the international big data market evolution serving the most valuable contribution to revenue growth along with key insights. Pitch your topic with ease and precision using this Big Data Global Market Revenue Annual Comparison Structure PDF. This layout presents information on Market Revenues, Global Market, Growing Trend. It is also available for immediate download and adjustment. So, changes can be made in the color, design, graphics or any other component to create a unique layout.

Clinical Services Company Profile Competitor Comparison Analysis Report Infographics PDF
The slide comparative analysis of company with competitors on the basis ratings, number of employees, funding, market capitalization, revenue, net profit and total assets. It describes the company position in global market. This is a Clinical Services Company Profile Competitor Comparison Analysis Report Infographics PDF template with various stages. Focus and dispense information on one stages using this creative set, that comes with editable features. It contains large content boxes to add your information on topics like Employees, Revenue, Net Profit. You can also showcase facts, figures, and other relevant content using this PPT layout. Grab it now.

Annual Growth Comparison Of B2B Marketing Automation Microsoft PDF
The purpose of this slide is to show the statistical growth trend of marketing with the adoption of a process automation system along with the estimation of future revenue growth. Showcasing this set of slides titled Annual Growth Comparison Of B2B Marketing Automation Microsoft PDF. The topics addressed in these templates are Growing Technical, Automation Systems, Grew Gradually. All the content presented in this PPT design is completely editable. Download it and make adjustments in color, background, font etc. as per your unique business setting.
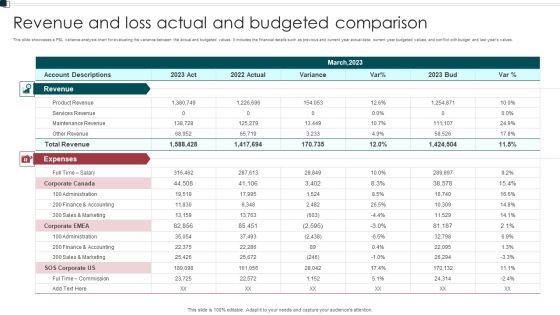
Revenue And Loss Actual And Budgeted Comparison Elements PDF
This slide showcases a P and L variance analysis chart for evaluating the variance between the actual and budgeted values. It includes the financial details such as previous and current year actual data current year budgeted values, and conflict with budget and last years values. Showcasing this set of slides titled Revenue And Loss Actual And Budgeted Comparison Elements PDF. The topics addressed in these templates are Expenses, Administration, Commission. All the content presented in this PPT design is completely editable. Download it and make adjustments in color, background, font etc. as per your unique business setting.

Annual Growth Comparison Of Digital Advertising Market Summary PDF
The purpose of this slide is to highlight the yearly growth of digital marketing due rapid increase in the e commerce industry. The growth trend period includes 2019 2023 along with key insights. Pitch your topic with ease and precision using this Annual Growth Comparison Of Digital Advertising Market Summary PDF. This layout presents information on Digital Marketing, Internet Users, Career Among Youngsters. It is also available for immediate download and adjustment. So, changes can be made in the color, design, graphics or any other component to create a unique layout.
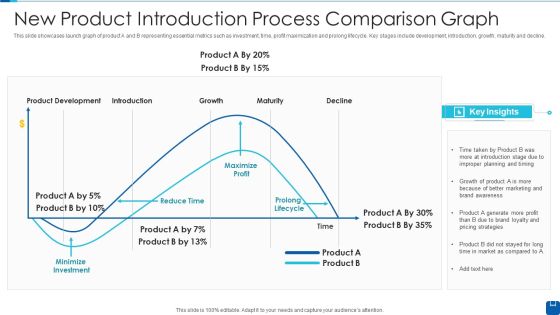
New Product Introduction Process Comparison Graph Slides PDF
This slide showcases launch graph of product A and B representing essential metrics such as investment, time, profit maximization and prolong lifecycle. Key stages include development, introduction, growth, maturity and decline.Showcasing this set of slides titled New Product Introduction Process Comparison Graph Slides PDF The topics addressed in these templates are Product Development, Improper Planning, Minimize Investment All the content presented in this PPT design is completely editable. Download it and make adjustments in color, background, font etc. as per your unique business setting.

Social Media Global Usage Year Over Year Comparison Professional PDF
The purpose of this slide is to showcase the utilization of social media marketing worldwide with an upward trend influenced by technical advancements. The years include 2013 2023 along with the key insights. Showcasing this set of slides titled Social Media Global Usage Year Over Year Comparison Professional PDF. The topics addressed in these templates are Social Media, Technological Advancement, Technical Innovations. All the content presented in this PPT design is completely editable. Download it and make adjustments in color, background, font etc. as per your unique business setting.
Advertisement Cost Comparison Of Social Media Platforms Graphics PDF
This slide showcases comparative assessment of advertisement cost on different social media. It analyze social media advertising cost on the basis of key metrics that are average cost per click and cost per mile. Make sure to capture your audiences attention in your business displays with our gratis customizable Advertisement Cost Comparison Of Social Media Platforms Graphics PDF. These are great for business strategies, office conferences, capital raising or task suggestions. If you desire to acquire more customers for your tech business and ensure they stay satisfied, create your own sales presentation with these plain slides.

Comparison Between Content Based And Collaborative Filtering Formats PDF
This slide compares the most widely used content-based and collaborative filtering techniques on the basis of various aspects. These factors are information about items, cold-start problem, domain knowledge, discover new interests and other users data. Are you in need of a template that can accommodate all of your creative concepts This one is crafted professionally and can be altered to fit any style. Use it with Google Slides or PowerPoint. Include striking photographs, symbols, depictions, and other visuals. Fill, move around, or remove text boxes as desired. Test out color palettes and font mixtures. Edit and save your work, or work with colleagues. Download Comparison Between Content Based And Collaborative Filtering Formats PDF and observe how to make your presentation outstanding. Give an impeccable presentation to your group and make your presentation unforgettable.

3 Stages Pie Chart Comparison Process Business Plans PowerPoint Templates
We present our 3 stages pie chart comparison process business plans PowerPoint templates.Use our Marketing PowerPoint Templates because you should Whip up a frenzy with our PowerPoint Templates and Slides. They will fuel the excitement of your team. Present our Finance PowerPoint Templates because Our PowerPoint Templates and Slides will let Your superior ideas hit the target always and everytime. Present our Arrows PowerPoint Templates because Our PowerPoint Templates and Slides are Clear and concise. Use them and dispel any doubts your team may have. Use our Circle Charts PowerPoint Templates because You can Zap them with our PowerPoint Templates and Slides. See them reel under the impact. Use our Business PowerPoint Templates because You can Double your output with our PowerPoint Templates and Slides. They make beating deadlines a piece of cake.Use these PowerPoint slides for presentations relating to Pie, chart, process, menu, website, network, statistics, item, junction, corporate, business, plan, presentation, template, circle, brochure, data, report, marketing, different, management, graph, modern, connection, sphere, options, strategy, catalog, world, spherical, segments, text, company, banner, information, navigation, structure, parts, globe, arrows, communication. The prominent colors used in the PowerPoint template are Green, Black, Gray.

Comparison Of On Page And Off Page SEO Training Ppt
This slide highlights the difference between on-page and off-page SEO based on multiple parameters such as optimization place, primary focus, control, role of social media, and longevity.
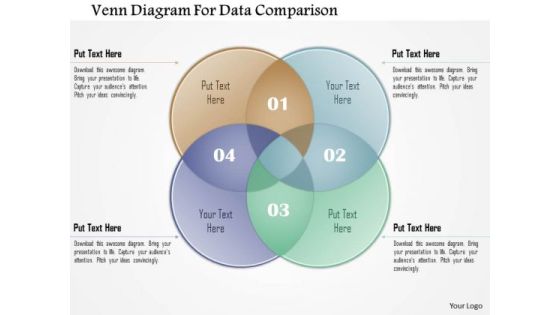
Business Diagram Venn Diagram For Data Comparison Presentation Template
Our above diagram displays venn diagrams that helps to display the interrelation of concepts by placing interrelated words in overlapping circles. This diagram helps you to communicate information visually.

Dashboard Showing Construction Project Metrics Sample PDF
This slide shows the dashboard which depicts the construction project management performance such as billing date, working profit, total cost, billed percentage, budget spent, completed projects and comparison of two companies about revenues earned from project. Showcasing this set of slides titled Dashboard Showing Construction Project Metrics Sample PDF. The topics addressed in these templates are Dashboard, Construction Project Metrics. All the content presented in this PPT design is completely editable. Download it and make adjustments in color, background, font etc. as per your unique business setting.
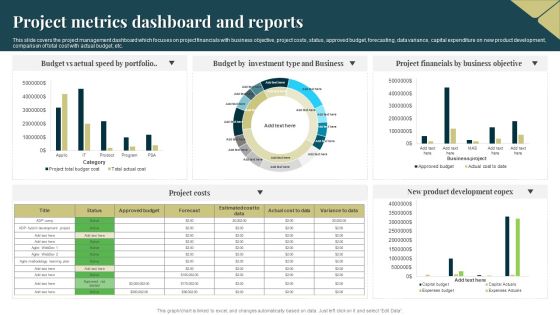
Project Metrics Dashboard And Reports Portrait PDF
This slide covers the project management dashboard which focuses on project financials with business objective, project costs, status, approved budget, forecasting, data variance, capital expenditure on new product development, comparison of total cost with actual budget, etc. Showcasing this set of slides titled Project Metrics Dashboard And Reports Portrait PDF. The topics addressed in these templates are Budget, Portfolio, Investment. All the content presented in this PPT design is completely editable. Download it and make adjustments in color, background, font etc. as per your unique business setting.
Incident Management Process Safety Dashboard Icons PDF
This is a incident management process safety dashboard icons pdf template with various stages. Focus and dispense information on three stages using this creative set, that comes with editable features. It contains large content boxes to add your information on topic like dashboard. You can also showcase facts, figures, and other relevant content using this PPT layout. Grab it now.

API Outline Dashboard Ppt Show Guidelines PDF
This is a api outline dashboard ppt show guidelines pdf template with various stages. Focus and dispense information on three stages using this creative set, that comes with editable features. It contains large content boxes to add your information on topic like dashboard. You can also showcase facts, figures, and other relevant content using this PPT layout. Grab it now.

Amalgamation Acquisitions Dashboard Ppt Styles Guidelines PDF
This is a amalgamation acquisitions dashboard ppt styles guidelines pdf template with various stages. Focus and dispense information on three stages using this creative set, that comes with editable features. It contains large content boxes to add your information on topic like dashboard. You can also showcase facts, figures, and other relevant content using this PPT layout. Grab it now.
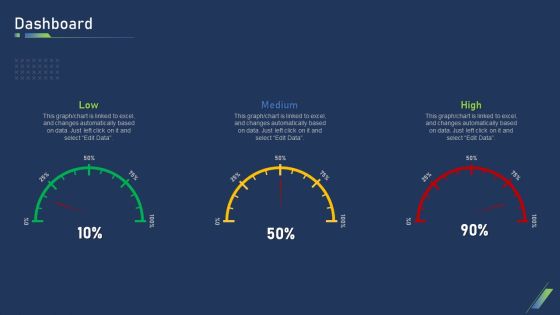
Using Bots Marketing Strategy Dashboard Infographics PDF
This is a using bots marketing strategy dashboard infographics pdf template with various stages. Focus and dispense information on three stages using this creative set, that comes with editable features. It contains large content boxes to add your information on topics like low, medium, high. You can also showcase facts, figures, and other relevant content using this PPT layout. Grab it now.

Power Plant Energy Production Dashboard For Consumption Statistics Download PDF
This graph or chart is linked to excel, and changes automatically based on data. Just left click on it and select edit data. Pitch your topic with ease and precision using this Multiple Country Energy Consumption Statistics Comparison Dashboard Formats PDF. This layout presents information on August Year 2022, Return on Investments, Power Plan Detail . It is also available for immediate download and adjustment. So, changes can be made in the color, design, graphics or any other component to create a unique layout.

Project Dashboard Ppt PowerPoint Presentation Model Layouts
This is a project dashboard ppt powerpoint presentation model layouts. This is a five stage process. The stages in this process are key discussion items, project status, issues, objective, main focus.
Sales Performance Monthly Strategy Dashboard Icons PDF
Below slide showcases the monthly dashboard of sales performance . Company can measure and evaluate their monthly sales performance using key factors that are sales comparison, monthly sales, planned vs actual sales and gross margin by Pitch your topic with ease and precision using this sales performance monthly strategy dashboard icons pdf. This layout presents information on sales performance monthly strategy dashboard. It is also available for immediate download and adjustment. So, changes can be made in the color, design, graphics or any other component to create a unique layout.
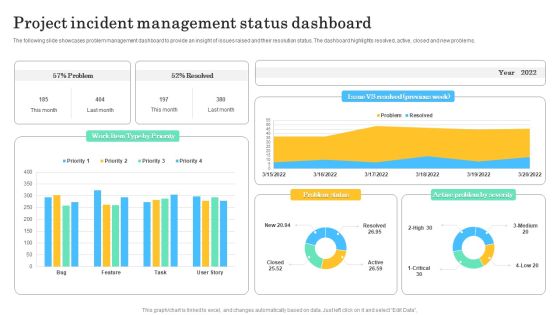
Project Incident Management Status Dashboard Sample PDF
The following slide showcases problem management dashboard to provide an insight of issues raised and their resolution status. The dashboard highlights resolved, active, closed and new problems. Pitch your topic with ease and precision using this Project Incident Management Status Dashboard Sample PDF. This layout presents information on Project Incident, Management Status Dashboard. It is also available for immediate download and adjustment. So, changes can be made in the color, design, graphics or any other component to create a unique layout.
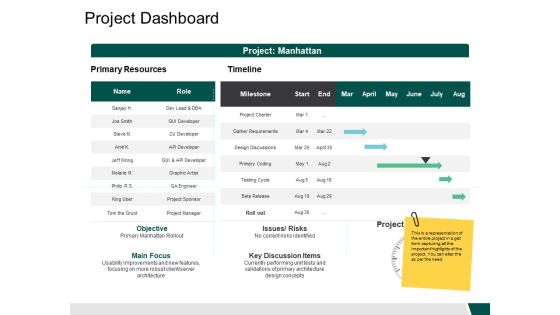
Project Dashboard Role Ppt PowerPoint Presentation Deck
This is a project dashboard role ppt powerpoint presentation deck. This is a two stage process. The stages in this process are business, management, strategy, analysis, marketing.
KPI Dashboard Of Client Support Icons PDF
This slide shows customer service delivery key performance indicators dashboard. It includes KPIs such as issues received, average time to close issues, first call resolution, top performers, etc. Pitch your topic with ease and precision using this KPI Dashboard Of Client Support Icons PDF. This layout presents information on KPI Dashboard, Client Support. It is also available for immediate download and adjustment. So, changes can be made in the color, design, graphics or any other component to create a unique layout.

Client Support Management Dashboard Designs PDF
This slide shows KPI dashboard of customer service delivery management. It includes key performance indicators such as total support requests received, support status, total solved and unsolved issues, etc. Pitch your topic with ease and precision using this Client Support Management Dashboard Designs PDF. This layout presents information on Client Support, Management Dashboard. It is also available for immediate download and adjustment. So, changes can be made in the color, design, graphics or any other component to create a unique layout.

Client Support Resolution Dashboard Graphics PDF
This slide shows dashboard which can be used by organization in customer service resolution delivery. It includes KPIs such as first call resolution, unsolved issues, average response time, etc. Pitch your topic with ease and precision using this Client Support Resolution Dashboard Graphics PDF. This layout presents information on Client Support, Resolution Dashboard. It is also available for immediate download and adjustment. So, changes can be made in the color, design, graphics or any other component to create a unique layout.
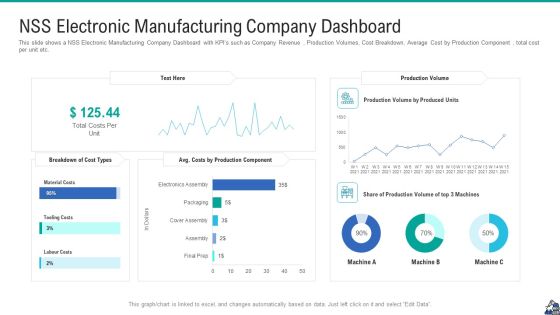
NSS Electronic Manufacturing Company Dashboard Portrait PDF
This slide shows a NSS Electronic Manufacturing Company Dashboard with KPI s such as Company Revenue , Production Volumes, Cost Breakdown, Average Cost by Production Component , total cost per unit etc. Deliver an awe inspiring pitch with this creative nss electronic manufacturing company dashboard portrait pdf bundle. Topics like nss electronic manufacturing company dashboard can be discussed with this completely editable template. It is available for immediate download depending on the needs and requirements of the user.

Dashboard Indicating Hr Advisory Services Team Performance
This slide illustrates HR consultancy team performance dashboard. It provides information about hours of consultation, satisfaction rate, per consultant rate, popular counselors, etc. Pitch your topic with ease and precision using this dashboard indicating hr advisory services team performance download pdf. This layout presents information on dashboard indicating hr advisory services team performance. It is also available for immediate download and adjustment. So, changes can be made in the color, design, graphics or any other component to create a unique layout.
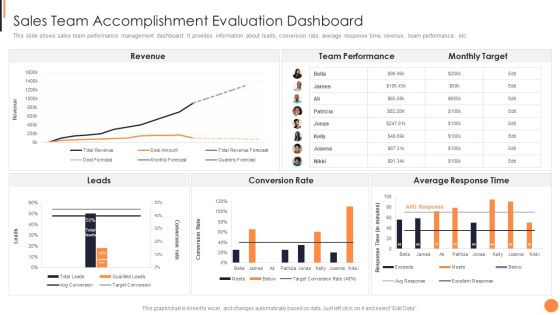
Sales Team Accomplishment Evaluation Dashboard Portrait PDF
This slide shows sales team performance management dashboard. It provides information about leads, conversion rate, average response time, revenue, team performance, etc. Pitch your topic with ease and precision using this sales team accomplishment evaluation dashboard portrait pdf This layout presents information on sales team accomplishment evaluation dashboard It is also available for immediate download and adjustment. So, changes can be made in the color, design, graphics or any other component to create a unique layout.

Workforce Task Schedule Overview Dashboard Microsoft PDF
The slide showcases a dashboard giving a summary of monthly shift details of an employee. It shows shift board, time off, credentials, posted shifts, message board, etc.Pitch your topic with ease and precision using this Workforce Task Schedule Overview Dashboard Microsoft PDF. This layout presents information on Expiring Credentials, Dashboard, Credentials. It is also available for immediate download and adjustment. So, changes can be made in the color, design, graphics or any other component to create a unique layout.

Scrum Task Project Management Dashboard Information PDF
The following slide demonstrates scrum project task management dashboard. It includes information about sprint velocity, scope changes, tasks category, tasks progress, planned, finished, added, removed, bug, story, etc. Pitch your topic with ease and precision using this Scrum Task Project Management Dashboard Information PDF. This layout presents information on Scrum Task Project, Management Dashboard. It is also available for immediate download and adjustment. So, changes can be made in the color, design, graphics or any other component to create a unique layout.

Salary Management Dashboard For Origination Graphics PDF
The following slide highlights the payroll management dashboard for organization illustrating key headings which includes home, task to do, messages, last payroll and trends Pitch your topic with ease and precision using this Salary Management Dashboard For Origination Graphics PDF. This layout presents information on Salary Management Dashboard, Origination. It is also available for immediate download and adjustment. So, changes can be made in the color, design, graphics or any other component to create a unique layout.
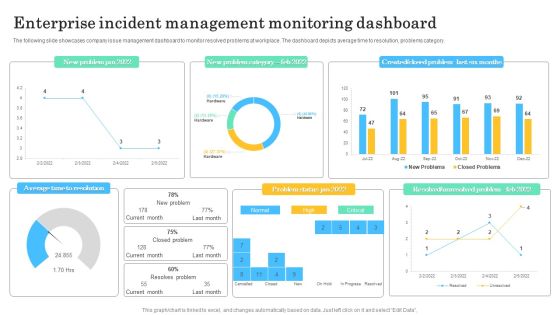
Enterprise Incident Management Monitoring Dashboard Graphics PDF
The following slide showcases company issue management dashboard to monitor resolved problems at workplace. The dashboard depicts average time to resolution, problems category. Pitch your topic with ease and precision using this Enterprise Incident Management Monitoring Dashboard Graphics PDF. This layout presents information on Average Time Resolution, New Problem Category. It is also available for immediate download and adjustment. So, changes can be made in the color, design, graphics or any other component to create a unique layout.

Defect Management Activity Monitoring Dashboard Information PDF
This slide illustrates summary dashboard for defect planning for project management. It includes defect management, defects by project, defects by type, defects by status, defects by reporter, etc. Pitch your topic with ease and precision using this Defect Management Activity Monitoring Dashboard Information PDF. This layout presents information on Defect Management, Activity Monitoring Dashboard. It is also available for immediate download and adjustment. So, changes can be made in the color, design, graphics or any other component to create a unique layout.
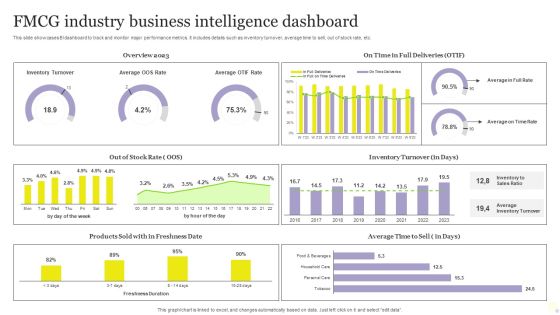
FMCG Industry Business Intelligence Dashboard Mockup PDF
This slide showcases BI dashboard to track and monitor major performance metrics. It includes details such as inventory turnover, average time to sell, out of stock rate, etc. Pitch your topic with ease and precision using this FMCG Industry Business Intelligence Dashboard Mockup PDF. This layout presents information on Average, Inventory Turnover, Business Intelligence Dashboard. It is also available for immediate download and adjustment. So, changes can be made in the color, design, graphics or any other component to create a unique layout.

Workforce Compensation And Salary Dashboard Brochure PDF
The following slide showcases compensation dashboard that highlights regular payroll tasks. The dashboard includes number of workforce, departments, average performance and sick days, headcount, salary breakdown and number of employees by salary. Pitch your topic with ease and precision using this Workforce Compensation And Salary Dashboard Brochure PDF. This layout presents information on Workforce Compensation, Salary Dashboard. It is also available for immediate download and adjustment. So, changes can be made in the color, design, graphics or any other component to create a unique layout.

Product Sales Performance Evaluation Dashboard Graphics PDF
Pitch your topic with ease and precision using this product sales performance evaluation dashboard graphics pdf. This layout presents information on product sales performance evaluation dashboard. It is also available for immediate download and adjustment. So, changes can be made in the color, design, graphics or any other component to create a unique layout.
Acquisition Integration Performance Dashboard Icon Clipart PDF
Pitch your topic with ease and precision using this Acquisition Integration Performance Dashboard Icon Clipart PDF This layout presents information on Acquisition Integration, Performance, Dashboard Icon It is also available for immediate download and adjustment. So, changes can be made in the color, design, graphics or any other component to create a unique layout.
Project Tracking Tracker Dashboard Icon Elements PDF
Pitch your topic with ease and precision using this Project Tracking Tracker Dashboard Icon Elements PDF. This layout presents information on Tracker Dashboard Icon, Project Tracking. It is also available for immediate download and adjustment. So, changes can be made in the color, design, graphics or any other component to create a unique layout.
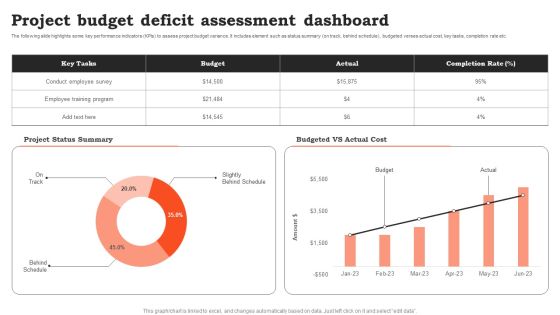
Project Budget Deficit Assessment Dashboard Brochure PDF
Pitch your topic with ease and precision using this Project Budget Deficit Assessment Dashboard Brochure PDF. This layout presents information on Project Budget, Deficit Assessment Dashboard. It is also available for immediate download and adjustment. So, changes can be made in the color, design, graphics or any other component to create a unique layout.
Market Research Steps Dashboard Icon Brochure PDF
Pitch your topic with ease and precision using this Market Research Steps Dashboard Icon Brochure PDF. This layout presents information on Market Research, Steps, Dashboard. It is also available for immediate download and adjustment. So, changes can be made in the color, design, graphics or any other component to create a unique layout.

Determine B2B Sales Management Dashboard Elements PDF
This slide provides information regarding B2B sales management activities dashboard. The key elements of dashboard highlights total contacts, goal identification, bounce rate, etc. Presenting this PowerPoint presentation, titled Determine B2B Sales Management Dashboard Elements PDF, with topics curated by our researchers after extensive research. This editable presentation is available for immediate download and provides attractive features when used. Download now and captivate your audience. Presenting this Determine B2B Sales Management Dashboard Elements PDF. Our researchers have carefully researched and created these slides with all aspects taken into consideration. This is a completely customizable Determine B2B Sales Management Dashboard Elements PDF that is available for immediate downloading. Download now and make an impact on your audience. Highlight the attractive features available with our PPTs.
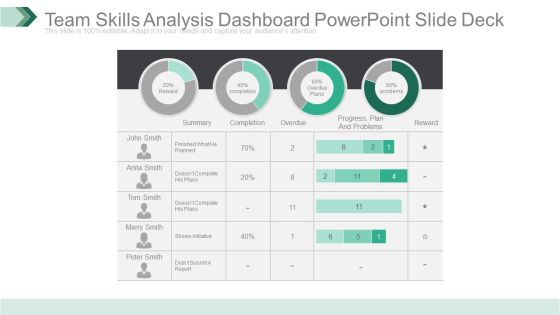
Team Skills Analysis Dashboard Powerpoint Slide Deck
This is a team skills analysis dashboard powerpoint slide deck. This is a four stage process. The stages in this process are reward, summary, completion, overdue, progress plan and problems, problems, reward.

Customer Support And Service Dashboard Ppt Slides
This is a customer support and service dashboard ppt slides. This is a six stage process. The stages in this process are total customer experience, physical benefits, rational benefits, emotional benefits, sensing benefits, people, product.

Project Metrics Dashboard With Responsibilities Graphics PDF
This slide focuses on project management dashboard which shows the number of projects, types of objects, key performance indicators, viewpoints, overall project status with actions and progress, responsibilities with linked object types and actions, etc. Pitch your topic with ease and precision using this Project Metrics Dashboard With Responsibilities Graphics PDF. This layout presents information on Project Metrics, Dashboard With Responsibilities. It is also available for immediate download and adjustment. So, changes can be made in the color, design, graphics or any other component to create a unique layout.

Vehicle Management System KPI Dashboard Introduction PDF
This slide represents the dashboard showing real time data of fleet management to cut down operational costs and improve efficiency. It includes key metrics such as vehicles with errors, warnings, deviation from route, total vehicles, vehicles condition etc. Pitch your topic with ease and precision using this Vehicle Management System KPI Dashboard Introduction PDF. This layout presents information on Vehicle Management System, KPI Dashboard. It is also available for immediate download and adjustment. So, changes can be made in the color, design, graphics or any other component to create a unique layout.

Buyer Marketing Campaign Performance Dashboard Download PDF
Following dashboard depicts shopper marketing dashboard which can be used by managers to assess the performance of their campaigns. The key performance indicators are total customers, countries, website views, total campaigns, email sent, website traffic source etc. Pitch your topic with ease and precision using this Buyer Marketing Campaign Performance Dashboard Download PDF. This layout presents information on Total Customers, Countries, Website Views. It is also available for immediate download and adjustment. So, changes can be made in the color, design, graphics or any other component to create a unique layout.
Email Advertising Report Growth Dashboard Formats PDF
This slide dashboard is helpful for managers, executives, and stakeholders to display the effectiveness of an email marketing strategy. It includes active accounts, deleted accounts, and unsubscribed accounts in a month and a year. Pitch your topic with ease and precision using this Email Advertising Report Growth Dashboard Formats PDF. This layout presents information on Email Advertising, Report Growth Dashboard . It is also available for immediate download and adjustment. So, changes can be made in the color, design, graphics or any other component to create a unique layout.

KPI Dashboard Highlighting Business Problems Microsoft PDF
This slide depicts a dashboard which highlights the problems faced by organizations to easily track the issues and offer solutions for the same. The various key performance indicators in this dashboard are pain points by status, unresolved pain points for march 2023 etc. Showcasing this set of slides titled KPI Dashboard Highlighting Business Problems Microsoft PDF. The topics addressed in these templates are Unresolved Pain Points, Resolved Pain Points, Project Components. All the content presented in this PPT design is completely editable. Download it and make adjustments in color, background, font etc. as per your unique business setting.

Retail Outlet Annual Sales Dashboard Elements PDF
This slide shows the retail store annual dashboard which includes sales revenue, total customers average transaction value, average units per customer, sales by division top five articles by sold items bar chart, total customer and visitors line chart, sales by city, average price and unit per transaction line chart etc.Pitch your topic with ease and precision using this retail outlet annual sales dashboard elements pdf This layout presents information on Retail outlet annual sales dashboard It is also available for immediate download and adjustment. So, changes can be made in the color, design, graphics or any other component to create a unique layout.
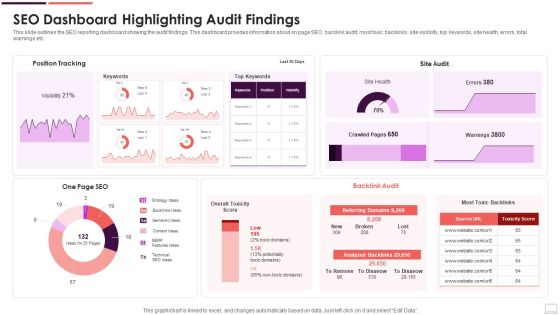
SEO Dashboard Highlighting Audit Findings Mockup PDF
This slide outlines the SEO reporting dashboard showing the audit findings. This dashboard provides information about on page SEO, backlink audit, most toxic backlinks, site visibility, top keywords, site health, errors, total warnings etc. Pitch your topic with ease and precision using this SEO Dashboard Highlighting Audit Findings Mockup PDF. This layout presents information on Strategy Ideas, Backlinks Ideas, Semantic Ideas. It is also available for immediate download and adjustment. So, changes can be made in the color, design, graphics or any other component to create a unique layout.
