Comparison Dashboard

Retail Global Trends Comparing Online Ppt PowerPoint Presentation Infographics Guide
This is a retail global trends comparing online ppt powerpoint presentation infographics guide. This is a two stage process. The stages in this process are finance, analysis, business, investment, marketing.
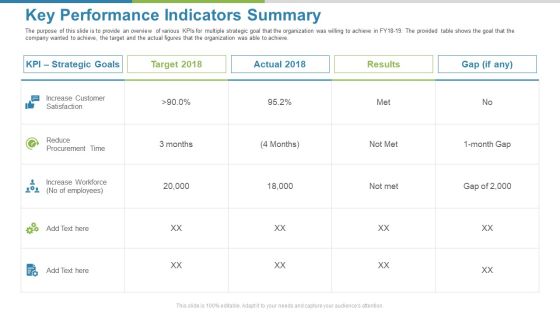
Work Execution Liability Key Performance Indicators Summary Ppt Show Slides PDF
The purpose of this slide is to provide an overview of various KPIs for multiple strategic goal that the organization was willing to achieve in FY18-19. The provided table shows the goal that the company wanted to achieve, the target and the actual figures that the organization was able to achieve. Deliver and pitch your topic in the best possible manner with this work execution liability key performance indicators summary ppt show slides pdf. Use them to share invaluable insights on strategic goals, target, actual, results, gap and impress your audience. This template can be altered and modified as per your expectations. So, grab it now.

Comparative Analysis Of Major Sales Performance Monitoring Tools Ppt File Infographics PDF
This slide illustrates comparative assessment of major tools for sales tracking. It provides information about automated workflows, sales trend analysis, integrated web tracking, downloadable charts, conversion rates, etc. Pitch your topic with ease and precision using this Comparative Analysis Of Major Sales Performance Monitoring Tools Ppt File Infographics PDF. This layout presents information on Features And Services, Automated Workflows, Sales Trend Analysis. It is also available for immediate download and adjustment. So, changes can be made in the color, design, graphics or any other component to create a unique layout.

5G And 4G Networks Comparative Analysis 5G Technology Can Connect More Devices Than 4G Rules PDF
This slide represents how 5G technology can connect more devices than 4G. 5G can provide high precision data to each device and handle 1 million devices per square kilometer. This is a 5G And 4G Networks Comparative Analysis 5G Technology Can Connect More Devices Than 4G Rules PDF template with various stages. Focus and dispense information on five stages using this creative set, that comes with editable features. It contains large content boxes to add your information on topics like 5G Technology, Devices. You can also showcase facts, figures, and other relevant content using this PPT layout. Grab it now.

5G And 4G Networks Comparative Analysis 5G Technology Means More Speed And Capacity Mockup PDF
This slide shows how 5G provides more speed and capacity. 5G provides more bandwidth and space than 4G to accommodate more users and delivers data at the fastest speeds. This is a 5G And 4G Networks Comparative Analysis 5G Technology Means More Speed And Capacity Mockup PDF template with various stages. Focus and dispense information on six stages using this creative set, that comes with editable features. It contains large content boxes to add your information on topics like Information Radio, Consumers, Services. You can also showcase facts, figures, and other relevant content using this PPT layout. Grab it now.

5G Technology Means More Speed And Capacity Comparative Analysis Of 4G And 5G Technologies Download PDF
This slide shows how 5G provides more speed and capacity. 5G provides more bandwidth and space than 4G to accommodate more users and delivers data at the fastest speeds.This is a 5G Technology Means More Speed And Capacity Comparative Analysis Of 4G And 5G Technologies Download PDF template with various stages. Focus and dispense information on six stages using this creative set, that comes with editable features. It contains large content boxes to add your information on topics like Connected Services, Information Radio, Reduced Increase. You can also showcase facts, figures, and other relevant content using this PPT layout. Grab it now.

Engineering Team Goals Ppt PowerPoint Presentation Templates
This is a engineering team goals ppt powerpoint presentation templates. This is a three stage process. The stages in this process are areas of focus, tables, analysis, business, performance.

Benchmarking Own Csr Potential Vs Competitors Ppt PowerPoint Presentation Guide
This is a benchmarking own csr potential vs competitors ppt powerpoint presentation guide. This is a three stage process. The stages in this process are competitor name, competitive analysis, csr activities, achievements.

Competitive Cost Advantage Ppt PowerPoint Presentation Infographic Template Guidelines
This is a competitive cost advantage ppt powerpoint presentation infographic template guidelines. This is a four stage process. The stages in this process are net cost advantage, parameter, tables, analysis, competition.
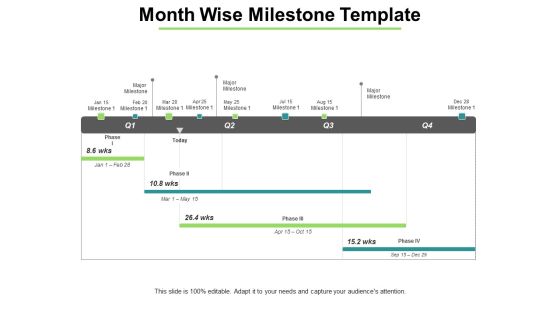
Month Wise Milestone Template Ppt PowerPoint Presentation Gallery Styles
This is a month wise milestone template ppt powerpoint presentation gallery styles. This is a four stage process. The stages in this process are table, milestone, planning, strategy, analysis.

Essential Business Requirements For Data Analytics In Venn Diagram Introduction PDF
In this slide, we are showing the basic key components including people, process and technology that are required for data analytics strategy management process. Here you can discover an assortment of the finest PowerPoint and Google Slides templates. With these templates, you can create presentations for a variety of purposes while simultaneously providing your audience with an eye catching visual experience. Download Essential Business Requirements For Data Analytics In Venn Diagram Introduction PDF to deliver an impeccable presentation. These templates will make your job of preparing presentations much quicker, yet still, maintain a high level of quality. Slidegeeks has experienced researchers who prepare these templates and write high quality content for you. Later on, you can personalize the content by editing the Essential Business Requirements For Data Analytics In Venn Diagram Introduction PDF.
Safety And Health Kpis For Tracking Performance Graph Mockup PDF
This slide represents graph showing key performance indicators tracked by companies for assessment of safety and health performance of their workplace. It includes key metrics such as workforce awareness, safety meetings held, recordable injuries, lost work days, compliance, severity rates etc. Pitch your topic with ease and precision using this Safety And Health Kpis For Tracking Performance Graph Mockup PDF. This layout presents information on Safety And Health, Kpis For Tracking, Performance Graph. It is also available for immediate download and adjustment. So, changes can be made in the color, design, graphics or any other component to create a unique layout.
Project Timeline Ppt PowerPoint Presentation Icon Designs
This is a project timeline ppt powerpoint presentation icon designs. This is a six stage process. The stages in this process are project name, table, cost, data, management.

Project Progress Summary Ppt PowerPoint Presentation Portfolio Backgrounds
This is a project progress summary ppt powerpoint presentation portfolio backgrounds. This is a three stage process. The stages in this process are project name, table, cost, data, management.

KPI To Track Physical Fitness Program Sponsorship Success Infographics PDF
Mentioned slide provides insights about various key performance metrics which can be evaluated by business to determine . It includes KPIs such as tickets sold, television viewers, social media mentions, website traffic, generated leads, email open rate and click through rate. Pitch your topic with ease and precision using this KPI To Track Physical Fitness Program Sponsorship Success Infographics PDF. This layout presents information on Social Media Mentions, Sponsorship Advertisements, Determine Potential Customer. It is also available for immediate download and adjustment. So, changes can be made in the color, design, graphics or any other component to create a unique layout.
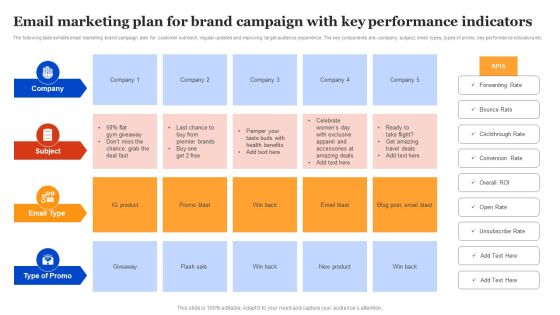
Email Marketing Plan For Brand Campaign With Key Performance Indicators Rules PDF
The following slide exhibits email marketing brand campaign plan for customer outreach, regular updates and improving target audience experience. The key components are- company, subject, email types, types of promo, key performance indicators etc. Showcasing this set of slides titled Email Marketing Plan For Brand Campaign With Key Performance Indicators Rules PDF. The topics addressed in these templates are Company, Subject, Indicators. All the content presented in this PPT design is completely editable. Download it and make adjustments in color, background, font etc. as per your unique business setting.

Customer Behavioral Data And Analytics Ways Customer Behavior Can Be Studied Elements PDF
There are 2 ways to measure customer behavior Customer Personas and Customer Journey Analytics. Customer Personas are a semi fictional representation of your target customers while customer journey analytics measures customer behavior at each stage of the journey.This is a customer behavioral data and analytics ways customer behavior can be studied elements pdf template with various stages. Focus and dispense information on two stages using this creative set, that comes with editable features. It contains large content boxes to add your information on topics like customers, demographics, customers industry, acquisition, purchase. You can also showcase facts, figures, and other relevant content using this PPT layout. Grab it now.

Executing Advance Data Analytics At Workspace Determine Role Of Security Centre In Firm Sample PDF
This slide covers information regarding the role of security center in in order to protect sensitive data and how firm behave before, after and towards security centre implementation. This is a executing advance data analytics at workspace determine role of security centre in firm sample pdf template with various stages. Focus and dispense information on four stages using this creative set, that comes with editable features. It contains large content boxes to add your information on topics like determine role of security centre in firm. You can also showcase facts, figures, and other relevant content using this PPT layout. Grab it now.

Checklist For Effective Data Analytics Integration In Business Ppt Inspiration Maker PDF
This slide defines the checklist for effective data science integration in business, and it includes an understanding of business requirements, compelling communication, and so on. This is a checklist for effective data analytics integration in business ppt inspiration maker pdf template with various stages. Focus and dispense information on five stages using this creative set, that comes with editable features. It contains large content boxes to add your information on topics like communicate effectively, requirements, business teams, required. You can also showcase facts, figures, and other relevant content using this PPT layout. Grab it now.
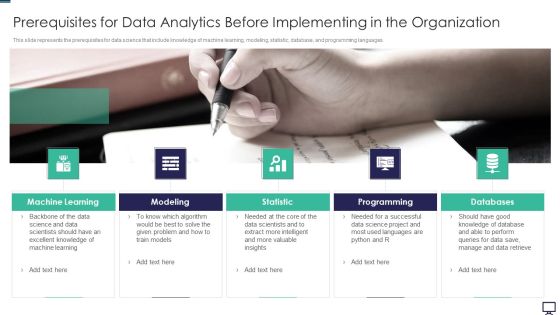
Prerequisites For Data Analytics Before Implementing In The Organization Ppt Professional Design Templates PDF
This slide represents the prerequisites for data science that include knowledge of machine learning, modeling, statistic, database, and programming languages. This is a prerequisites for data analytics before implementing in the organization ppt professional design templates pdf template with various stages. Focus and dispense information on five stages using this creative set, that comes with editable features. It contains large content boxes to add your information on topics like programming, databases, statistic, modeling, machine learning. You can also showcase facts, figures, and other relevant content using this PPT layout. Grab it now.

Classified Data Memo Record With Strategic Goals Product And Concept Development Designs PDF
The slide provides information about the suggestions for additional services that is provided by Barwash 99 in terms of product and concept development. This is a classified data memo record with strategic goals product and concept development designs pdf template with various stages. Focus and dispense information on four stages using this creative set, that comes with editable features. It contains large content boxes to add your information on topics like product and concept development. You can also showcase facts, figures, and other relevant content using this PPT layout. Grab it now.
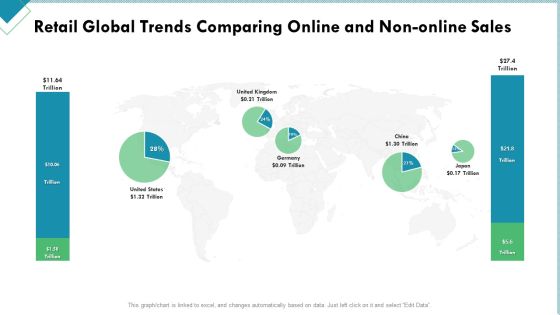
Market Analysis Of Retail Sector Retail Global Trends Comparing Online And Non Online Sales Diagrams PDF
Deliver and pitch your topic in the best possible manner with this market analysis of retail sector retail global trends comparing online and non online sales diagrams pdf. Use them to share invaluable insights on retail global trends comparing online and non online sales and impress your audience. This template can be altered and modified as per your expectations. So, grab it now.

Business Data Analysis Activity Generated Data Guidelines PDF
This is a business data analysis activity generated data guidelines pdf template with various stages. Focus and dispense information on three stages using this creative set, that comes with editable features. It contains large content boxes to add your information on topics like the data generated by the processors found within vehicles, video games, cable boxes or, soon, household appliances, the data generated by the processors found within vehicles, video games, cable boxes or, soon, household appliances. You can also showcase facts, figures, and other relevant content using this PPT layout. Grab it now.

Data Assimilation Business Intelligence KPI Metrics Days Ppt Infographic Template Designs PDF
This is a data assimilation business intelligence kpi metrics days ppt infographic template designs pdf template with various stages. Focus and dispense information on four stages using this creative set, that comes with editable features. It contains large content boxes to add your information on topics like days since last accident, net profit margin, remaining inventory, response time. You can also showcase facts, figures, and other relevant content using this PPT layout. Grab it now.

Oracle Cloud Data Analytics Administration IT Stages Of Implementation Planning Demonstration PDF
This slide describes the planning phase of the OAC implementation process, and it also showcases the steps and tasks that would be performed in the planning phase, such as defining goals and so on. This is a oracle cloud data analytics administration it stages of implementation planning demonstration pdf template with various stages. Focus and dispense information on eight stages using this creative set, that comes with editable features. It contains large content boxes to add your information on topics like business, opportunities, implementing, resources, recognize. You can also showcase facts, figures, and other relevant content using this PPT layout. Grab it now.

Market Survey Process And Budget Evaluation Inspiration PDF
This slide showcases various steps for conducting a market research to gain insights for better decision making. It also includes timeline, task categories, budget, number of questions, distribution channel, responses received, average time taken to fill questionnaire, etc. Showcasing this set of slides titled Market Survey Process And Budget Evaluation Inspiration PDF. The topics addressed in these templates are Database, Report Publishing, Data Collection, Data Analysis. All the content presented in this PPT design is completely editable. Download it and make adjustments in color, background, font etc. as per your unique business setting.
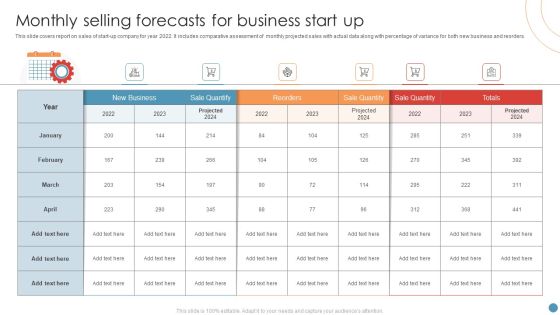
Monthly Selling Forecasts For Business Start Up Pictures PDF
This slide covers report on sales of start up company for year 2022. It includes comparative assessment of monthly projected sales with actual data along with percentage of variance for both new business and reorders. Showcasing this set of slides titled Monthly Selling Forecasts For Business Start Up Pictures PDF. The topics addressed in these templates are Sale Quantify, Business. All the content presented in this PPT design is completely editable. Download it and make adjustments in color, background, font etc. as per your unique business setting.

Components Of Cost Analysis Process For E Commerce Portrait PDF
This slide showcases various elements of pricing analysis process to determine economic price for a product or service in an e-commerce industry. It includes key components like calculate price index, utilize historical price data and use pricing software. Persuade your audience using this Components Of Cost Analysis Process For E Commerce Portrait PDF. This PPT design covers three stages, thus making it a great tool to use. It also caters to a variety of topics including Calculate Price Index, Utilize Historical Price Data, Pricing Software. Download this PPT design now to present a convincing pitch that not only emphasizes the topic but also showcases your presentation skills.

Business Operating Strategy Process Powerpoint Templates
This is a business operating strategy process powerpoint templates. This is a six stage process. The stages in this process are priority actions, what system support resource, who responsible, when done, how to measure, annual status.

Customer Lifetime Value Profit Calculations Ppt Presentation
This is a customer lifetime value profit calculations ppt presentation. This is a five stage process. The stages in this process are complete clv year, average acquisition cost, average customer revenue, average customer costs, average customer profit, customer retention rate, cumulative retention rate, likely customer profit, discount rate.
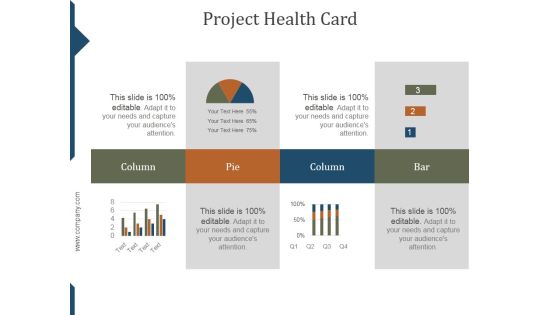
Project Health Card Template Ppt PowerPoint Presentation Backgrounds
This is a project health card template ppt powerpoint presentation backgrounds. This is a six stage process. The stages in this process are schedule, resourcing, budget, risks, issues, benefits.
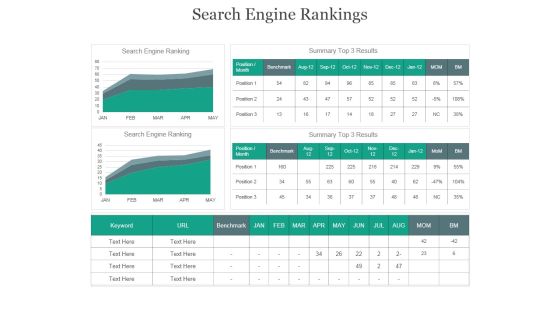
Search Engine Rankings Ppt PowerPoint Presentation Rules
This is a search engine rankings ppt powerpoint presentation rules. This is a three stage process. The stages in this process are Search engine ranking, summary top 3 results, benchmark, keyword.

Calculating Customer Lifetime Value Clv Ppt PowerPoint Presentation Summary
This is a calculating customer lifetime value clv ppt powerpoint presentation summary. This is a five stage process. The stages in this process are complete clv, average acquisition cost, average customer revenue, average customer costs, average customer profit, customer retention rate, likely customer profit.

Cash Position By Quarter Ppt PowerPoint Presentation Outline
This is a cash position by quarter ppt powerpoint presentation outline. This is a four stage process. The stages in this process are cash position, cash in, initial funding, sales, total cash in.

Financials Base Plan Ppt PowerPoint Presentation Portfolio
This is a financials base plan ppt powerpoint presentation portfolio. This is a five stage process. The stages in this process are revenue, cost of sales, gross profit, customer acquisition cost, other operating cost expense.
Financials Stretch Plan Ppt PowerPoint Presentation Designs
This is a financials stretch plan ppt powerpoint presentation designs. This is a five stage process. The stages in this process are revenue, cost of sales, gross profit, customer acquisition cost, other operating cost expense.
Financials Summary Base Plan VS Stretch Plan Ppt PowerPoint Presentation Design Ideas
This is a financials summary base plan vs stretch plan ppt powerpoint presentation design ideas. This is a three stage process. The stages in this process are ending cash, change in cash, operating profit, other operating expense.

Operating Plan Ppt PowerPoint Presentation Show
This is a operating plan ppt powerpoint presentation show. This is a five stage process. The stages in this process are what system support resources, who responsible, when done, how to measure, how to measure.

Operation Cost Ppt PowerPoint Presentation Background Designs
This is a operation cost ppt powerpoint presentation background designs. This is a three stage process. The stages in this process are operational equipment, raw material, salary, food beverage, other equipments.

Our Offering Vs The Competition Ppt PowerPoint Presentation Images
This is a our offering vs the competition ppt powerpoint presentation images. This is a five stage process. The stages in this process are icon, tick, right, wrong, table.
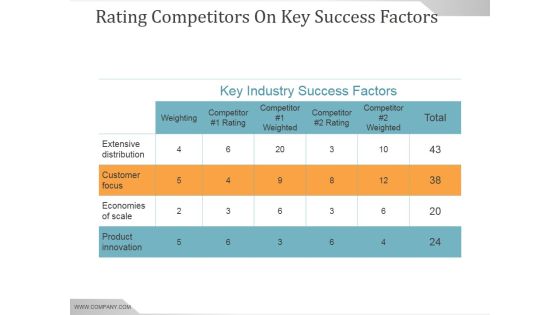
Rating Competitors On Key Success Factors Ppt PowerPoint Presentation Professional
This is a rating competitors on key success factors ppt powerpoint presentation professional. This is a four stage process. The stages in this process are extensive distribution, customer focus, economies of scale, product innovation.

Csr Maturation Process Ppt PowerPoint Presentation Tips
This is a csr maturation process ppt powerpoint presentation tips. This is a four stage process. The stages in this process are growth stage, philanthropic, transactional, integrative, level of engagement.

Competency Mapping Ppt PowerPoint Presentation Picture
This is a competency mapping ppt powerpoint presentation picture. This is a five stage process. The stages in this process are organisation development, performance management, compensation and benefits, international hr management, training and development.

Competency Rating Template Ppt PowerPoint Presentation Slides
This is a competency rating template ppt powerpoint presentation slides. This is a five stage process. The stages in this process are competency, achieving results, building strategic working relationships, business acumen, customer focus.

Contingency Model Ppt PowerPoint Presentation Layouts
This is a contingency model ppt powerpoint presentation layouts. This is a five stage process. The stages in this process are good, poor, high structure, low structure, strong power.
Work Plan With Timetable Template 1 Ppt PowerPoint Presentation Icon Show
This is a work plan with timetable template 1 ppt powerpoint presentation icon show. This is a two stage process. The stages in this process are acceptance of the research proposal, talks with local representatives in study area, development of research tools, sample selection and talks with community, training of enumerators.
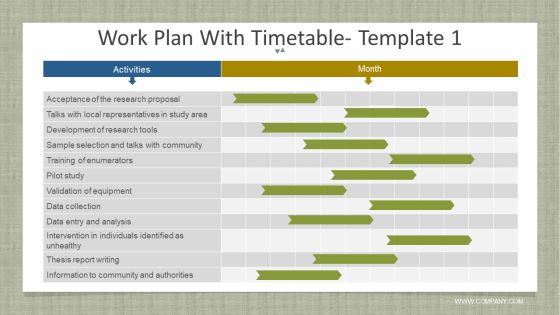
Work Plan With Timetable Template 1 Ppt PowerPoint Presentation Infographics Graphics
This is a work plan with timetable template 1 ppt powerpoint presentation infographics graphics. This is a twelve stage process. The stages in this process are acceptance of the research proposal, talks with local representatives in study area, development of research tools, sample selection and talks with community, training of enumerators.
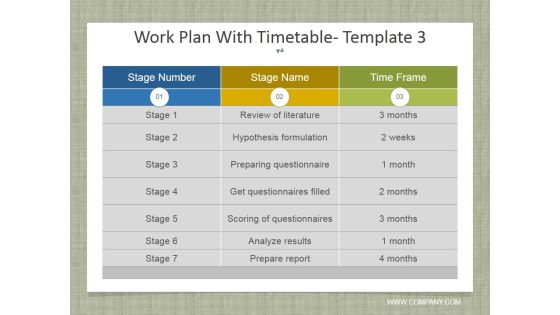
Work Plan With Timetable Template 3 Ppt PowerPoint Presentation Inspiration Styles
This is a work plan with timetable template 3 ppt powerpoint presentation inspiration styles. This is a seven stage process. The stages in this process are review of literature, hypothesis formulation, preparing questionnaire, get questionnaires filled, scoring of questionnaires.

Calculating Customer Lifetime Value Clv Ppt PowerPoint Presentation Show Icon
This is a calculating customer lifetime value clv ppt powerpoint presentation show icon. This is a five stage process. The stages in this process are average acquisition cost, average customer revenue, average customer costs, average customer profit, customer retention rate.

Financials Base Plan Ppt PowerPoint Presentation Portfolio Background Designs
This is a financials base plan ppt powerpoint presentation portfolio background designs. This is a four stage process. The stages in this process are revenue, cost of sales, gross profit, customer acquisition cost, other operating cost expense.
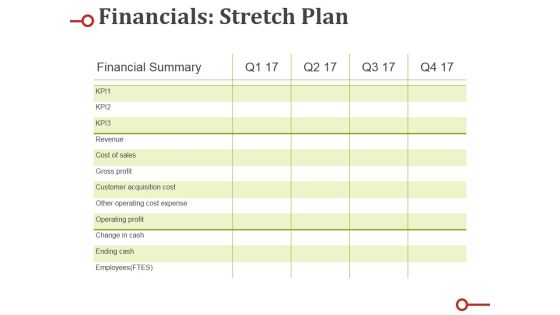
Financials Stretch Plan Ppt PowerPoint Presentation Show Designs Download
This is a financials stretch plan ppt powerpoint presentation show designs download. This is a four stage process. The stages in this process are revenue, cost of sales, gross profit, customer acquisition cost, other operating cost expense.

Financials Summary Base Plan Vs Stretch Plan Ppt PowerPoint Presentation Microsoft
This is a financials summary base plan vs stretch plan ppt powerpoint presentation microsoft. This is a three stage process. The stages in this process are revenue, cost of sales, gross profit, customer acquisition cost, other operating cost expense.

Operating Plan Ppt PowerPoint Presentation Ideas Outline
This is a operating plan ppt powerpoint presentation ideas outline. This is a three stage process. The stages in this process are priority actions, what system support resources, who responsible, when done, how to measure.
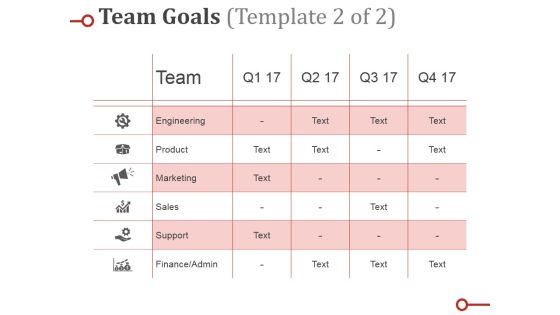
Team Goals Template Ppt PowerPoint Presentation Summary Slideshow
This is a team goals template ppt powerpoint presentation summary slideshow. This is a five stage process. The stages in this process are objectives, employees, jack hill, rose albert, anita smith.

Project Updates Ppt PowerPoint Presentation Gallery Templates
This is a project updates ppt powerpoint presentation gallery templates. This is a four stage process. The stages in this process are Major projects bagged, major orders in hand, major projects lost, pipeline orders.
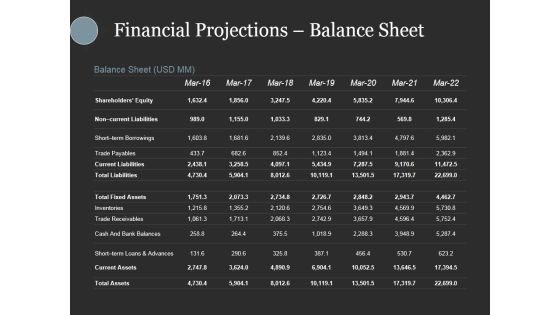
Financial Projections Balance Sheet Ppt PowerPoint Presentation Gallery Design Inspiration
This is a financial projections balance sheet ppt powerpoint presentation gallery design inspiration. This is a seven stage process. The stages in this process are shareholders equity, non current liabilities, short term borrowings, trade payables, current liabilities.
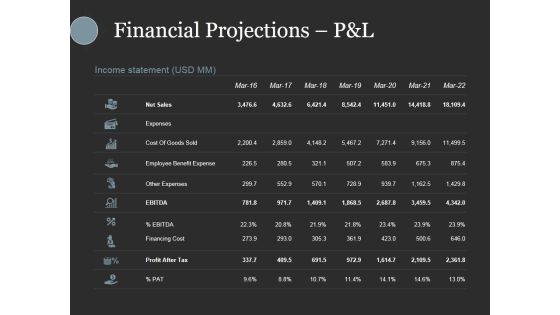
Financial Projections Pandl Ppt PowerPoint Presentation Slides Show
This is a financial projections pandl ppt powerpoint presentation slides show. This is a seven stage process. The stages in this process are net sales, expenses, cost of goods sold, employee benefit expense, other expenses.
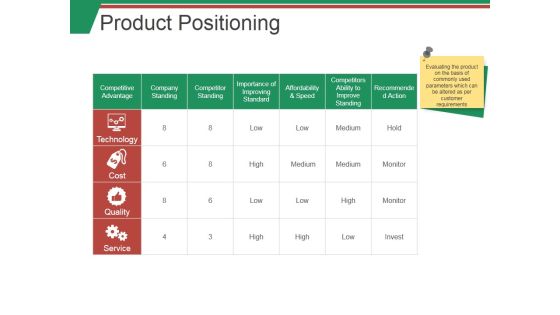
Product Positioning Ppt PowerPoint Presentation Infographics Examples
This is a product positioning ppt powerpoint presentation infographics examples. This is a four stage process. The stages in this process are competitive, advantage, technology, cost, quality.
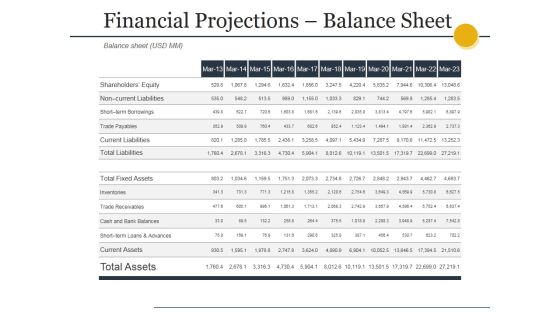
Financial Projections Balance Sheet Ppt PowerPoint Presentation Model Template
This is a financial projections balance sheet ppt powerpoint presentation model template. This is a eleven stage process. The stages in this process are current assets, cash and bank balances, trade receivables, inventories, total fixed assets.
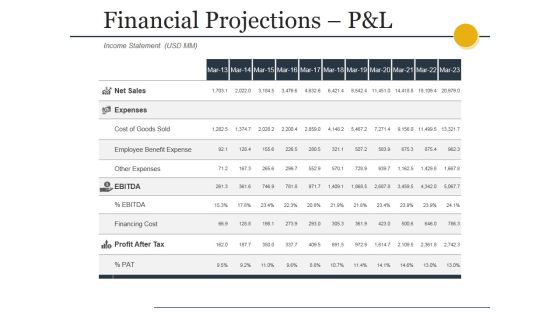
Financial Projections Pandl Ppt PowerPoint Presentation Styles Gallery
This is a financial projections pandl ppt powerpoint presentation styles gallery. This is a eleven stage process. The stages in this process are net sales, expenses, cost of goods sold, employee benefit expense, other expenses.

 Home
Home