AI PPT Maker
Templates
PPT Bundles
Design Services
Business PPTs
Business Plan
Management
Strategy
Introduction PPT
Roadmap
Self Introduction
Timelines
Process
Marketing
Agenda
Technology
Medical
Startup Business Plan
Cyber Security
Dashboards
SWOT
Proposals
Education
Pitch Deck
Digital Marketing
KPIs
Project Management
Product Management
Artificial Intelligence
Target Market
Communication
Supply Chain
Google Slides
Research Services
 One Pagers
All Categories
-
Home
- Customer Favorites
- Comparison Dashboard
Comparison Dashboard

Customer Relationship Management Dashboard Timeline Introduction PDF
This is a customer relationship management dashboard timeline introduction pdf template with various stages. Focus and dispense information on four stages using this creative set, that comes with editable features. It contains large content boxes to add your information on topics like timeline 2017 to 2020. You can also showcase facts, figures, and other relevant content using this PPT layout. Grab it now.

Customer Relationship Management Dashboard Revenue Background PDF
This slide covers the competitive analysis of different partner relationship management software which are compared based on features ratings and software prices. Deliver and pitch your topic in the best possible manner with this customer relationship management dashboard revenue background pdf. Use them to share invaluable insights on supply chain planning, fulfillment management, transportation management, inventory management and impress your audience. This template can be altered and modified as per your expectations. So, grab it now.
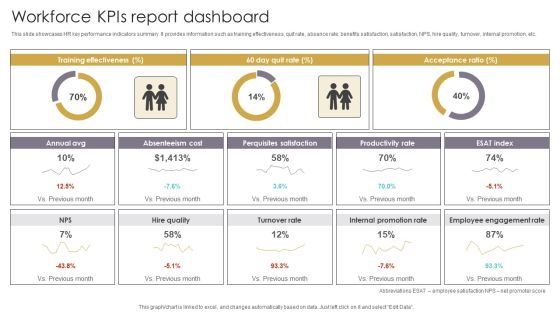
Workforce Kpis Report Dashboard Slides PDF
This slide showcases HR key performance indicators summary. It provides information such as training effectiveness, quit rate, absence rate, benefits satisfaction, satisfaction, NPS, hire quality, turnover, internal promotion, etc. Pitch your topic with ease and precision using this Workforce Kpis Report Dashboard Slides PDF. This layout presents information on Acceptance Ratio, Absenteeism Cost, Perquisites Satisfaction. It is also available for immediate download and adjustment. So, changes can be made in the color, design, graphics or any other component to create a unique layout.
Project Tracking And Evaluation Dashboard Portrait PDF
This slide illustrates graphical representation and facts and figures relating to project management data. It includes budget by employee, overdue tasks, workload charts etc. Pitch your topic with ease and precision using this Project Tracking And Evaluation Dashboard Portrait PDF. This layout presents information on Employee Budget, Target, Design, Development. It is also available for immediate download and adjustment. So, changes can be made in the color, design, graphics or any other component to create a unique layout.

Client Support KPI Dashboard Rules PDF
This slide shows key performance indicators of customer service delivery. It includes service level, request volume, cost of revenue, customer satisfaction, customer retention, etc. Pitch your topic with ease and precision using this Client Support KPI Dashboard Rules PDF. This layout presents information on Customer Retention, Cost Per Support, Average Issue Solving Time. It is also available for immediate download and adjustment. So, changes can be made in the color, design, graphics or any other component to create a unique layout.

Healthcare Big Data Assessment Dashboard Portrait PDF
This slide displays the data of healthcare sector showing the total number of patients in the hospital, average treatment cost and waiting time. It also shows the outpatient and impatient trends. Pitch your topic with ease and precision using this Healthcare Big Data Assessment Dashboard Portrait PDF. This layout presents information on Patient Status, Treatment Costs. It is also available for immediate download and adjustment. So, changes can be made in the color, design, graphics or any other component to create a unique layout.
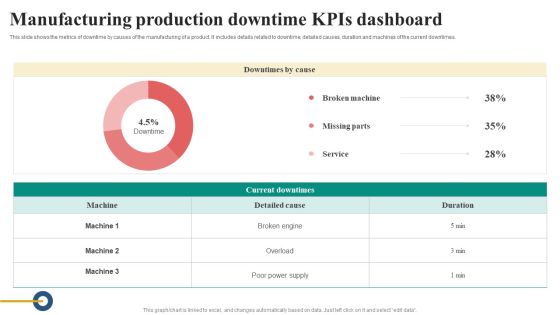
Manufacturing Production Downtime Kpis Dashboard Diagrams PDF
This slide shows the metrics of downtime by causes of the manufacturing of a product. It includes details related to downtime, detailed causes, duration and machines of the current downtimes. Pitch your topic with ease and precision using this Manufacturing Production Downtime Kpis Dashboard Diagrams PDF. This layout presents information on Details Related To Downtime, Detailed Causes, Duration And Machines, Current Downtimes. It is also available for immediate download and adjustment. So, changes can be made in the color, design, graphics or any other component to create a unique layout.

Multi Channel Marketing Strategy Dashboard Slides PDF
This slide showcases marketing channels instrument board. The purpose of this template is evaluate progress and improve decision making. It includes elements such as marketing channel type digital marketing, free marketing, paid marketing and traditional marketing, main KPIS, click revenue. Pitch your topic with ease and precision using this Multi Channel Marketing Strategy Dashboard Slides PDF. This layout presents information on Bounce Rate, Conversion Rate, Marketing Channel Type. It is also available for immediate download and adjustment. So, changes can be made in the color, design, graphics or any other component to create a unique layout.

Organization Demand Administration KPI Dashboard Designs PDF
The following slide represents some kpis to plan further sales and manufacturing processes. It includes elements such as total inventory cost, anticipated surplus stock, out of stock value, slow moving inventory value etc. Pitch your topic with ease and precision using this Organization Demand Administration KPI Dashboard Designs PDF. This layout presents information on Anticipated Surplus Stock, Out Of Stock, Slow Moving Inventory. It is also available for immediate download and adjustment. So, changes can be made in the color, design, graphics or any other component to create a unique layout.

SEO Content Review KPI Dashboard Summary PDF
The following slide highlights the KPAs of content strategy to determine keyword gaps and get quality traffic. It includes KPIs such as no. of pages crawled, content health status, basic web requirements, site user experience, major concerns etc. Pitch your topic with ease and precision using this SEO Content Review KPI Dashboard Summary PDF. This layout presents information on Fundamental Web Requirements, Needs Improvement. It is also available for immediate download and adjustment. So, changes can be made in the color, design, graphics or any other component to create a unique layout.

Application Performance Dashboard Ppt Icon Template PDF
This slide covers application performance in market KPIs and metrics such as impressions, clicks, searches for app, conversion rate etc. This Application Performance Dashboard Ppt Icon Template PDF from Slidegeeks makes it easy to present information on your topic with precision. It provides customization options, so you can make changes to the colors, design, graphics, or any other component to create a unique layout. It is also available for immediate download, so you can begin using it right away. Slidegeeks has done good research to ensure that you have everything you need to make your presentation stand out. Make a name out there for a brilliant performance.
Tracking Goals Achievement Status Dashboard Themes PDF
This slide showcases the objective status report, which helps track current the percentage of the targets achieved and left. It also includes the number of overdue targets and unachieved departmental goals. Pitch your topic with ease and precision using this Tracking Goals Achievement Status Dashboard Themes PDF. This layout presents information on Achieved Objectives, Unachieved Objectives, Overdue. It is also available for immediate download and adjustment. So, changes can be made in the color, design, graphics or any other component to create a unique layout.

Agile Sprint Management Report Dashboard Pictures PDF
This slide illustrates facts and figures related to sprint summary on agile project management. It includes total worked hours, story points, tasks, sprint velocity, scope charges, tasks by types, etc. Pitch your topic with ease and precision using this Agile Sprint Management Report Dashboard Pictures PDF. This layout presents information on Tasks By Status, Sprint Velocity, Scope Changes. It is also available for immediate download and adjustment. So, changes can be made in the color, design, graphics or any other component to create a unique layout.
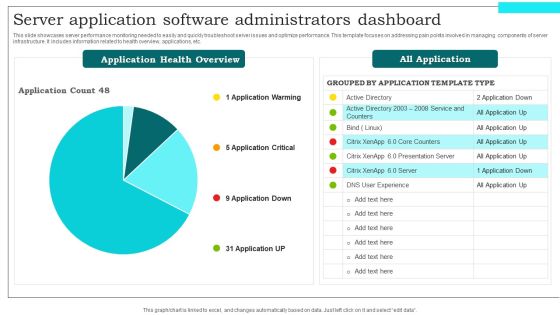
Server Application Software Administrators Dashboard Slides PDF
This slide showcases server performance monitoring needed to easily and quickly troubleshoot server issues and optimize performance. This template focuses on addressing pain points involved in managing components of server infrastructure. It includes information related to health overview, applications, etc. Showcasing this set of slides titled Server Application Software Administrators Dashboard Slides PDF. The topics addressed in these templates are Application Warming, Application Critical, Application Down. All the content presented in this PPT design is completely editable. Download it and make adjustments in color, background, font etc. as per your unique business setting.
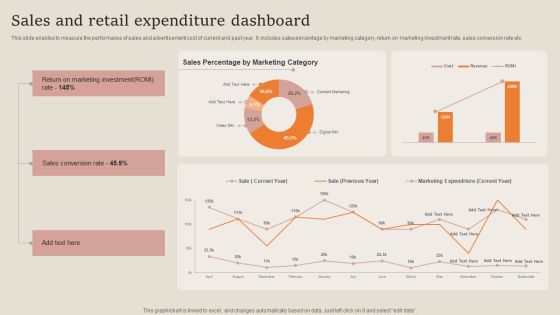
Sales And Retail Expenditure Dashboard Guidelines PDF
This slide enables to measure the performance of sales and advertisement cost of current and past year. It includes sales percentage by marketing category, return on marketing investment rate, sales conversion rate etc. Pitch your topic with ease and precision using this Sales And Retail Expenditure Dashboard Guidelines PDF. This layout presents information on Sales Conversion Rate, Marketing Investment. It is also available for immediate download and adjustment. So, changes can be made in the color, design, graphics or any other component to create a unique layout.
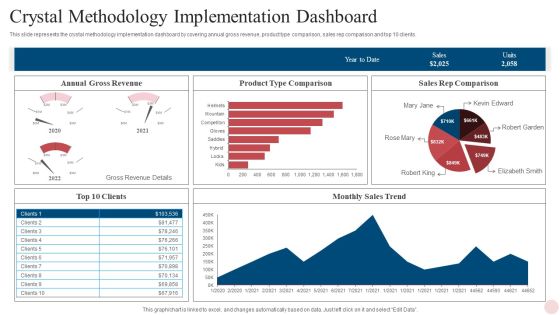
Agile Crystal Techniques Crystal Methodology Implementation Dashboard Themes PDF
This slide represents the crystal methodology implementation dashboard by covering annual gross revenue, product type comparison, sales rep comparison and top 10 clients. Deliver an awe inspiring pitch with this creative Agile Crystal Techniques Crystal Methodology Implementation Dashboard Themes PDF bundle. Topics like Monthly Sales Trend, Sales Rep Comparison, Product Type Comparison can be discussed with this completely editable template. It is available for immediate download depending on the needs and requirements of the user.

KPI Dashboard Of Projected Vs Actual Business Budget Pictures PDF
This slide shows the comparison between actual and Projected Budget dashboard of different departments. It includes sales, HR, marketing, research and development budget. Showcasing this set of slides titled KPI Dashboard Of Projected Vs Actual Business Budget Pictures PDF. The topics addressed in these templates are Marketing Budget, Development Budget, Sales Budget. All the content presented in this PPT design is completely editable. Download it and make adjustments in color, background, font etc. as per your unique business setting.

Agile Crystal Method Crystal Methodology Implementation Dashboard Pictures PDF
This slide represents the crystal methodology implementation dashboard by covering annual gross revenue, product type comparison, sales rep comparison and top 10 clients.Deliver an awe inspiring pitch with this creative Agile Crystal Method Crystal Methodology Implementation Dashboard Pictures PDF bundle. Topics like Crystal Methodology Implementation Dashboard can be discussed with this completely editable template. It is available for immediate download depending on the needs and requirements of the user.

Actual Vs Budgeted Gross And Net Revenue Comparison Report Sample PDF
This slide covers a profitability dashboard for analyzing gross margin and net profit metrics. It includes evaluation charts such as actual vs budgeted gross profit, net profit, trends, variance analysis table for the selected month and year. Pitch your topic with ease and precision using this Actual Vs Budgeted Gross And Net Revenue Comparison Report Sample PDF. This layout presents information on Gross Profit, Net Profit, Budget. It is also available for immediate download and adjustment. So, changes can be made in the color, design, graphics or any other component to create a unique layout.

Actual And Forecasted Income And Expenses Analysis Dashboard Portrait PDF
This slide shows the dashboard representing the comparison between the actual and forecasted monthly income and expenses of an organization. It also shows the report overview of monthly income and expenses of organization. Showcasing this set of slides titled Actual And Forecasted Income And Expenses Analysis Dashboard Portrait PDF. The topics addressed in these templates are Expenses, Income, Expenses. All the content presented in this PPT design is completely editable. Download it and make adjustments in color, background, font etc. as per your unique business setting.
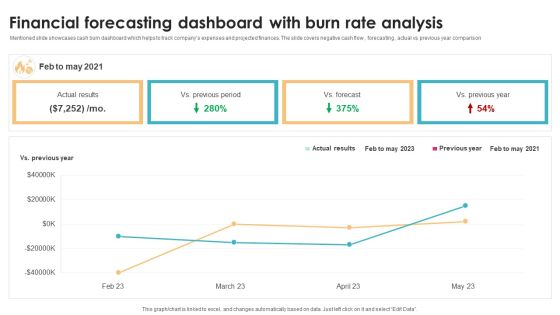
Financial Forecasting Dashboard With Burn Rate Analysis Brochure PDF
Mentioned slide showcases cash burn dashboard which helps to track companys expenses and projected finances. The slide covers negative cash flow , forecasting , actual vs previous year comparison Showcasing this set of slides titled Financial Forecasting Dashboard With Burn Rate Analysis Brochure PDF. The topics addressed in these templates are Previous Year, Analysis, Forecast. All the content presented in this PPT design is completely editable. Download it and make adjustments in color, background, font etc. as per your unique business setting.
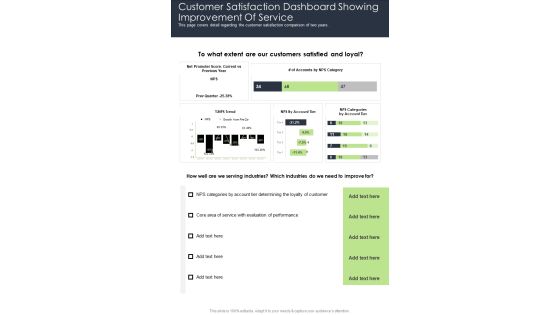
Customer Satisfaction Dashboard Showing Improvement Of Service One Pager Documents
This page covers detail regarding the customer satisfaction comparison of two years. Presenting you a fantastic Customer Satisfaction Dashboard Showing Improvement Of Service One Pager Documents. This piece is crafted on hours of research and professional design efforts to ensure you have the best resource. It is completely editable and its design allow you to rehash its elements to suit your needs. Get this Customer Satisfaction Dashboard Showing Improvement Of Service One Pager Documents A4 One-pager now.
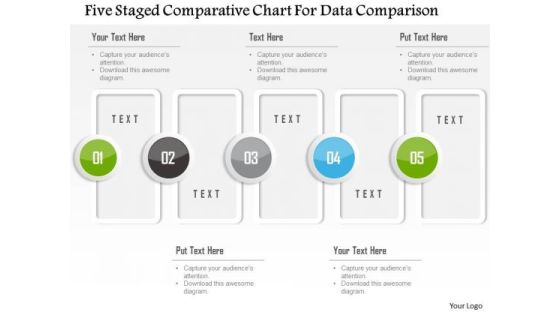
Business Diagram Five Staged Comparative Chart For Data Comparison Presentation Template
Five staged comparative chart has been used to design this power point template. This PPT contains the concept of data comparison. Use this PPT for your business and finance based data comparison in any financial presentation.

Two Products Performance Usability And Features Comparison Ppt Powerpoint Presentation Infographic Template Portrait
This is a two products performance usability and features comparison ppt powerpoint presentation infographic template portrait. This is a two stage process. The stages in this process are product differentiation, product comparison, brand differentiation.
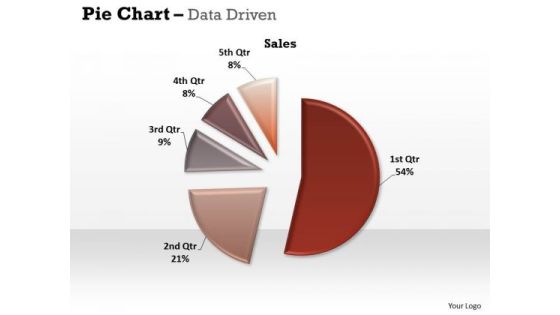
Data Analysis Excel Driven Pie Chart For Easy Comparison PowerPoint Slides Templates
Our data analysis excel driven pie chart for easy comparison powerpoint slides Templates Abhor Doodling. They Never Let The Interest Flag.

Data Analysis In Excel 3d Bar Chart For Comparison Of Time Series PowerPoint Templates
Double Your Chances With Our data analysis in excel 3d bar chart for comparison of time series Powerpoint Templates . The Value Of Your Thoughts Will Increase Two-Fold.
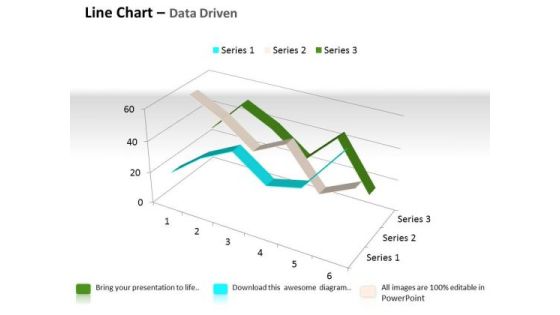
Quantitative Data Analysis 3d Line Chart For Comparison Of PowerPoint Templates
Touch Base With Our quantitative data analysis 3d line chart for comparison of Powerpoint Templates . Review Your Growth With Your Audience.

3D Pie Chart For Data Comparison Ppt Infographic Template Vector PDF
Presenting 3d pie chart for data comparison ppt infographic template vector pdf. to dispense important information. This template comprises three stages. It also presents valuable insights into the topics including data analysis solution, 3d pie chart for data comparison. This is a completely customizable PowerPoint theme that can be put to use immediately. So, download it and address the topic impactfully.
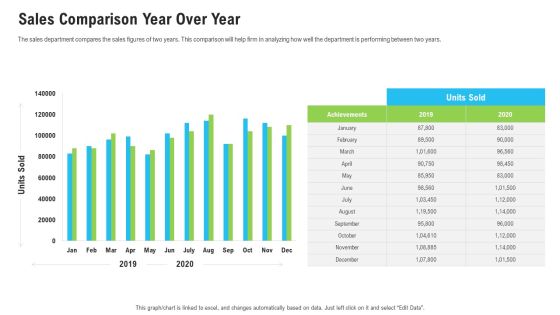
Sales Department Strategies Increase Revenues Sales Comparison Year Over Year Infographics PDF
The sales department compares the sales figures of two years. This comparison will help firm in analyzing how well the department is performing between two years. Deliver an awe-inspiring pitch with this creative sales department strategies increase revenues sales comparison year over year infographics pdf bundle. Topics like sales comparison year over year can be discussed with this completely editable template. It is available for immediate download depending on the needs and requirements of the user.

BI Technique For Data Informed Decisions Sap Analytics Cloud Comparison With Other BI Tools Structure PDF
The purpose of this slide is to showcase the comparison of SAP Analytics Cloud comparison with other available tools in the market. The comparison is done on multiple parameters such as pricing, core functionalities, and training available. Formulating a presentation can take up a lot of effort and time, so the content and message should always be the primary focus. The visuals of the PowerPoint can enhance the presenters message, so our BI Technique For Data Informed Decisions Sap Analytics Cloud Comparison With Other BI Tools Structure PDF was created to help save time. Instead of worrying about the design, the presenter can concentrate on the message while our designers work on creating the ideal templates for whatever situation is needed. Slidegeeks has experts for everything from amazing designs to valuable content, we have put everything into BI Technique For Data Informed Decisions Sap Analytics Cloud Comparison With Other BI Tools Structure PDF.

Data Lake Architecture Future Of Data Analysis Comparison Between Data Warehouse Diagrams PDF
This slide represents the comparison between data warehouse, data lake and data lakehouse based on the period and components of both, along with information insights carried out.Deliver and pitch your topic in the best possible manner with this Data Lake Architecture Future Of Data Analysis Comparison Between Data Warehouse Diagrams PDF. Use them to share invaluable insights on Data Warehouse, Unstructured Data, Streaming Analytics and impress your audience. This template can be altered and modified as per your expectations. So, grab it now.
Product Performance Comparison Report Vector Icon Ppt PowerPoint Presentation Infographics Graphic Images PDF
Presenting this set of slides with name product performance comparison report vector icon ppt powerpoint presentation infographics graphic images pdf. The topics discussed in these slide is product performance comparison report vector icon. This is a completely editable PowerPoint presentation and is available for immediate download. Download now and impress your audience.

Product Kpis Showing Feature Based Comparison Ppt PowerPoint Presentation Gallery Layouts PDF
Pitch your topic with ease and precision using this product kpis showing feature based comparison ppt powerpoint presentation gallery layouts pdf. This layout presents information on product kpis showing feature based comparison. It is also available for immediate download and adjustment. So, changes can be made in the color, design, graphics or any other component to create a unique layout.

Quality Cost Report Comparison Template 2 Ppt PowerPoint Presentation Outline Maker
This is a quality cost report comparison template 2 ppt powerpoint presentation outline maker. This is a nine stage process. The stages in this process are defect type event occurrence, data collection date, location, name of data recorder, dates.
Two Products Comparison Report Vector Icon Ppt PowerPoint Presentation Professional Graphics Template PDF
Pitch your topic with ease and precision using this two products comparison report vector icon ppt powerpoint presentation professional graphics template pdf. This layout presents information on two products, comparison report vector icon. It is also available for immediate download and adjustment. So, changes can be made in the color, design, graphics or any other component to create a unique layout.

Comparison Report With Text Holders Ppt PowerPoint Presentation Summary Themes PDF
Showcasing this set of slides titled comparison report with text holders ppt powerpoint presentation summary themes pdf. The topics addressed in these templates are comparison report with text holders. All the content presented in this PPT design is completely editable. Download it and make adjustments in color, background, font etc. as per your unique business setting.
Two Services Comparison Report With Free And Premium Version Ppt PowerPoint Presentation Icon Outline PDF
Showcasing this set of slides titled two services comparison report with free and premium version ppt powerpoint presentation icon outline pdf. The topics addressed in these templates are two services comparison report with free and premium version. All the content presented in this PPT design is completely editable. Download it and make adjustments in color, background, font etc. as per your unique business setting.

Pie Chat For Data Comparison And Management Ppt PowerPoint Presentation Gallery Outline PDF
Presenting pie chat for data comparison and management ppt powerpoint presentation gallery outline pdf to dispense important information. This template comprises three stages. It also presents valuable insights into the topics including pie chat for data comparison and management. This is a completely customizable PowerPoint theme that can be put to use immediately. So, download it and address the topic impactfully.

MIS Comparison Between Data Warehouse And Operational Database System ODS Ppt PowerPoint Presentation Show Images PDF
This slide depicts the comparison between data warehouse and operational database systems based on design, purpose, data storage orientation, performance, and so on.Deliver an awe inspiring pitch with this creative MIS Comparison Between Data Warehouse And Operational Database System ODS Ppt PowerPoint Presentation Show Images PDF bundle. Topics like Concerned With Information, Performance Is Excellent, Analytical Processing can be discussed with this completely editable template. It is available for immediate download depending on the needs and requirements of the user.

Comparison Between Data Warehouse Data Lake And Data Lakehouse Brochure PDF
This slide represents the comparison between data warehouse, data lake and data lakehouse based on the period and components of both, along with information insights carried out. Deliver an awe inspiring pitch with this creative Comparison Between Data Warehouse Data Lake And Data Lakehouse Brochure PDF bundle. Topics like Data Warehouse, Operational Data, External Data can be discussed with this completely editable template. It is available for immediate download depending on the needs and requirements of the user.

Data Warehouse Implementation Comparison Between Database And Data Warehouse Template PDF
This slide depicts a comparison between database and data warehouse based on the design, type of information both stores, data sources, data availability, and so on.Deliver and pitch your topic in the best possible manner with this Data Warehouse Implementation Comparison Between Database And Data Warehouse Template PDF. Use them to share invaluable insights on Extensive Informationtransaction Processing, Data Collecting and impress your audience. This template can be altered and modified as per your expectations. So, grab it now.

7 Sections Pie Chart For Data Comparison Ppt PowerPoint Presentation File Graphics Template
This is a 7 sections pie chart for data comparison ppt powerpoint presentation file graphics template. This is a seven stage process. The stages in this process are 6 piece pie chart, 6 segment pie chart, 6 parts pie chart.

Supplier Scorecard Supplier Comparison Scorecard With Key Performance Indicator Chart Formats PDF
This is a supplier scorecard supplier comparison scorecard with key performance indicator chart formats pdf template with various stages. Focus and dispense information on one stages using this creative set, that comes with editable features. It contains large content boxes to add your information on topics like supplier comparison scorecard, key performance, indicator chart. You can also showcase facts, figures, and other relevant content using this PPT layout. Grab it now.
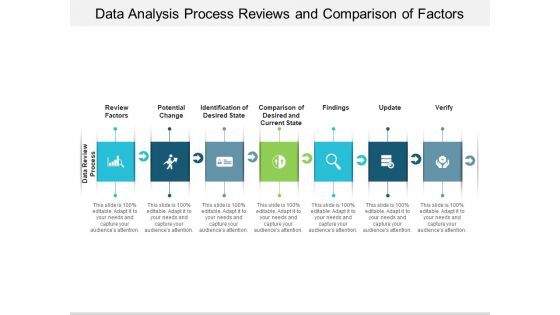
Data Analysis Process Reviews And Comparison Of Factors Ppt PowerPoint Presentation Infographic Template Graphics Template
This is a data analysis process reviews and comparison of factors ppt powerpoint presentation infographic template graphics template. This is a seven stage process. The stages in this process are data analysis, data review, data evaluation.

8 Sections Pie Chart For Data Comparison Ppt PowerPoint Presentation Show Slideshow
This is a 8 sections pie chart for data comparison ppt powerpoint presentation show slideshow. This is a eight stage process. The stages in this process are 6 piece pie chart, 6 segment pie chart, 6 parts pie chart.

Six Sections Pie Chart For Data Comparison Ppt PowerPoint Presentation Styles Graphics Example
This is a six sections pie chart for data comparison ppt powerpoint presentation styles graphics example. This is a six stage process. The stages in this process are 6 piece pie chart, 6 segment pie chart, 6 parts pie chart.

Data Comparison And Analysis Chart Ppt Powerpoint Presentation File Background Images
This is a data comparison and analysis chart ppt powerpoint presentation file background images. This is a four stage process. The stages in this process are data presentation, content presentation, information presentation.

Executive Information Database System Comparison Between Database And Data Warehouse Guidelines PDF
This slide depicts a comparison between database and data warehouse based on the design, type of information both stores, data sources, data availability, and so on.Deliver and pitch your topic in the best possible manner with this Executive Information Database System Comparison Between Database And Data Warehouse Guidelines PDF. Use them to share invaluable insights on Extensive Information, Internet Transaction, Commercial Processes and impress your audience. This template can be altered and modified as per your expectations. So, grab it now.

Comparison Between Data Warehouse And Operational Database System ODS Infographics PDF
This slide depicts the comparison between data warehouse and operational database systems based on design, purpose, data storage orientation, performance, and so on.Deliver and pitch your topic in the best possible manner with this Comparison Between Data Warehouse And Operational Database System ODS Infographics PDF. Use them to share invaluable insights on Concerned Information, Analytical Processing, Poor Performance and impress your audience. This template can be altered and modified as per your expectations. So, grab it now.

Comparison Between 4G And 5G Technology Comparative Analysis Of 4G And 5G Technologies Ideas PDF
This slide represents the comparison between 4G and 5G technology based on uploading and downloading speed, latency, data access and transmission, device identification, and efficiency.Deliver an awe inspiring pitch with this creative Comparison Between 4G And 5G Technology Comparative Analysis Of 4G And 5G Technologies Ideas PDF bundle. Topics like Unable Distinguish, Distribution Channel, Less Efficient can be discussed with this completely editable template. It is available for immediate download depending on the needs and requirements of the user.

Employee Headcount Analysis Turnover Comparison Of Two Companies Ppt PowerPoint Presentation Infographics Smartart PDF
This slide shows the comparison of two organizations on the basis of headcount turnover. It includes turnover data of last six years. Showcasing this set of slides titled Employee Headcount Analysis Turnover Comparison Of Two Companies Ppt PowerPoint Presentation Infographics Smartart PDF. The topics addressed in these templates are Highest Turnover, Flexible Working, Lowest. All the content presented in this PPT design is completely editable. Download it and make adjustments in color, background, font etc. as per your unique business setting.

Big Data And Analytics Market Share And Earnings Comparison Matrix Elements PDF
This slide covers big data revenue comparison for two years. It also includes growth rate and market share of leading vendors to analyse its market position. Persuade your audience using this Big Data And Analytics Market Share And Earnings Comparison Matrix Elements PDF. This PPT design covers five stages, thus making it a great tool to use. It also caters to a variety of topics including Revenue, Growth Rate, Market Share. Download this PPT design now to present a convincing pitch that not only emphasizes the topic but also showcases your presentation skills.

Data Warehousing IT Comparison Between Data Warehouse And Operational Ppt Show Designs PDF
This slide depicts the comparison between data warehouse and operational database systems based on design, purpose, data storage orientation, performance, and so on. Deliver and pitch your topic in the best possible manner with this data warehousing it comparison between data warehouse and operational ppt show designs pdf. Use them to share invaluable insights on data warehouse, analytical, processing, extraction and impress your audience. This template can be altered and modified as per your expectations. So, grab it now.

Data Lake Implementation Comparison Between Data Warehouse Data Lake And Data Infographics PDF
This slide represents the comparison between data warehouse, data lake and data lakehouse based on the period and components of both, along with information insights carried out. From laying roadmaps to briefing everything in detail, our templates are perfect for you. You can set the stage with your presentation slides. All you have to do is download these easy-to-edit and customizable templates. Data Lake Implementation Comparison Between Data Warehouse Data Lake And Data Infographics PDF will help you deliver an outstanding performance that everyone would remember and praise you for. Do download this presentation today.

Engineering Services Company Report Competitor Comparison Ppt PowerPoint Presentation File Professional PDF
The slide highlights the competitor comparison for top competitors. It compares companies on the basis of global market share, revenue, employee count, location served and services offered. There are so many reasons you need a Engineering Services Company Report Competitor Comparison Ppt PowerPoint Presentation File Professional PDF. The first reason is you cant spend time making everything from scratch, Thus, Slidegeeks has made presentation templates for you too. You can easily download these templates from our website easily.

Quality Cost Report Comparison Template 1 Ppt PowerPoint Presentation Pictures Infographics
This is a quality cost report comparison template 1 ppt powerpoint presentation pictures infographics. This is a five stage process. The stages in this process are amount, percent, year, appraisal cost, prevention cost.

Chart Illustrating Two Year Comparison Of Business Data Icon Ppt Outline Example Topics PDF
Persuade your audience using this Chart Illustrating Two Year Comparison Of Business Data Icon Ppt Outline Example Topics PDF. This PPT design covers three stages, thus making it a great tool to use. It also caters to a variety of topics including chart illustrating two year comparison of business data icon. Download this PPT design now to present a convincing pitch that not only emphasizes the topic but also showcases your presentation skills.

Companys Financial Comparison Before And After Implementation Of Promotional Strategies Infographics PDF
This slide shows the comparison of companys performance before and after the product marketing strategy implementation. It shows the comparison based on parameters such as product demand, number of product sold, total sale, lead conversion rate, customer retention rate, per customer acquisition cost etc. If you are looking for a format to display your unique thoughts, then the professionally designed Companys Financial Comparison Before And After Implementation Of Promotional Strategies Infographics PDF is the one for you. You can use it as a Google Slides template or a PowerPoint template. Incorporate impressive visuals, symbols, images, and other charts. Modify or reorganize the text boxes as you desire. Experiment with shade schemes and font pairings. Alter, share or cooperate with other people on your work. Download Companys Financial Comparison Before And After Implementation Of Promotional Strategies Infographics PDF and find out how to give a successful presentation. Present a perfect display to your team and make your presentation unforgettable.

Auto Sales Scorecard Bar Graph For Regional Performance Comparison Infographics PDF
This graph or chart is linked to excel, and changes automatically based on data. Just left click on it and select Edit Data. Deliver an awe inspiring pitch with this creative Auto Sales Scorecard Bar Graph For Regional Performance Comparison Infographics PDF bundle. Topics like Auto Sales Scorecard, Bar Graph Regional, Performance Comparison Product can be discussed with this completely editable template. It is available for immediate download depending on the needs and requirements of the user.

Two Product Comparison Report With Price And Hardware Ppt PowerPoint Presentation Gallery Graphics Pictures PDF
Pitch your topic with ease and precision using this two product comparison report with price and hardware ppt powerpoint presentation gallery graphics pictures pdf. This layout presents information on two product comparison report with price and hardware. It is also available for immediate download and adjustment. So, changes can be made in the color, design, graphics or any other component to create a unique layout.
