Comparison Chart

Four Hexagons Layout For Comparison Of Actual Performance And Set Goals Ppt PowerPoint Presentation Gallery Format Ideas PDF
Persuade your audience using this four hexagons layout for comparison of actual performance and set goals ppt powerpoint presentation gallery format ideas pdf. This PPT design covers four stages, thus making it a great tool to use. It also caters to a variety of topics including performance, goals, customers. Download this PPT design now to present a convincing pitch that not only emphasizes the topic but also showcases your presentation skills.

Financial Planning And Examination Plan For Small And Large Enterprises Comparison Of Various Financial Analysis Courses Clipart PDF
Slidegeeks is here to make your presentations a breeze with Financial Planning And Examination Plan For Small And Large Enterprises Comparison Of Various Financial Analysis Courses Clipart PDF With our easy to use and customizable templates, you can focus on delivering your ideas rather than worrying about formatting. With a variety of designs to choose from, you are sure to find one that suits your needs. And with animations and unique photos, illustrations, and fonts, you can make your presentation pop. So whether you are giving a sales pitch or presenting to the board, make sure to check out Slidegeeks first.
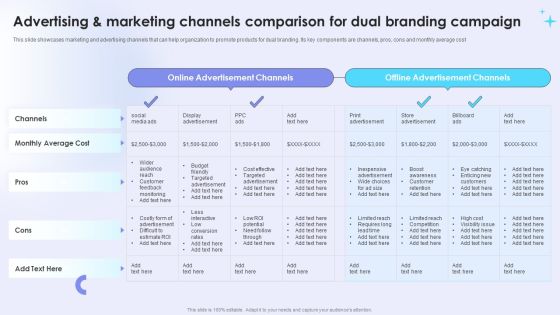
Dual Branding Campaign To Boost Sales Of Product Or Services Advertising And Marketing Channels Comparison Summary PDF
This slide showcases marketing and advertising channels that can help organization to promote products for dual branding. Its key components are channels, pros, cons and monthly average cost. Make sure to capture your audiences attention in your business displays with our gratis customizable Dual Branding Campaign To Boost Sales Of Product Or Services Advertising And Marketing Channels Comparison Summary PDF. These are great for business strategies, office conferences, capital raising or task suggestions. If you desire to acquire more customers for your tech business and ensure they stay satisfied, create your own sales presentation with these plain slides.

Analysis Plan For E Commerce Promotion Tactics Social Media Competitor Analysis For Digital Footprint Comparison Demonstration PDF
The purpose of the following slide is to showcase the findings of the social media competitor analysis. It includes information regarding the multiple social media channels followers, audience growth, published posts and engagement rate. The Analysis Plan For E Commerce Promotion Tactics Social Media Competitor Analysis For Digital Footprint Comparison Demonstration PDF is a compilation of the most recent design trends as a series of slides. It is suitable for any subject or industry presentation, containing attractive visuals and photo spots for businesses to clearly express their messages. This template contains a variety of slides for the user to input data, such as structures to contrast two elements, bullet points, and slides for written information. Slidegeeks is prepared to create an impression.
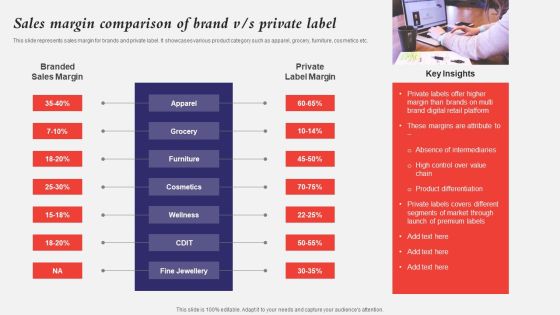
Developing A Strategic Private Label Branding Approach Sales Margin Comparison Of Brand V S Private Label Formats PDF
This slide represents sales margin for brands and private label. It showcases various product category such as apparel, grocery, furniture, cosmetics etc. Welcome to our selection of the Developing A Strategic Private Label Branding Approach Sales Margin Comparison Of Brand V S Private Label Formats PDF. These are designed to help you showcase your creativity and bring your sphere to life. Planning and Innovation are essential for any business that is just starting out. This collection contains the designs that you need for your everyday presentations. All of our PowerPoints are 100 percent editable, so you can customize them to suit your needs. This multi purpose template can be used in various situations. Grab these presentation templates today.
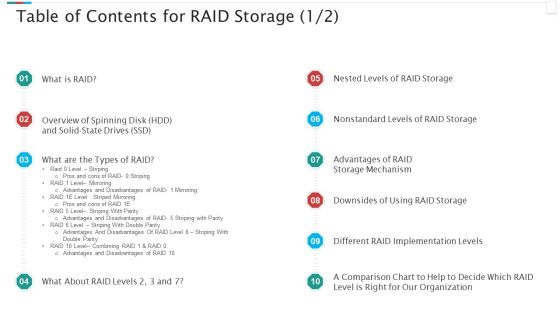
Redundant Array Of Independent Disks Storage IT Table Of Contents For RAID Storage Chart Download PDF
Deliver and pitch your topic in the best possible manner with this redundant array of independent disks storage it table of contents for raid storage chart download pdf. Use them to share invaluable insights on implementation, storage mechanism, organization, comparison chart and impress your audience. This template can be altered and modified as per your expectations. So, grab it now.

Project Administration Bundle Project Gantt Chart With Duration Topics PDF
Design a highly optimized project management report using this well researched Project Administration Bundle Project Gantt Chart With Duration Topics PDF. This layout can be used to present the professional details of a task or activity. Showcase the activities allocated to the business executives with this Gantt Chart PowerPoint theme. List down the column tasks in various timeframes and allocate time for each. In addition, also monitor the actual time and make comparisons to interpret the final progress using this innovative Gantt Chart Template. Showcase the work breakdown structure to attract your audience. Download and share it using Google Slides, if it suits your requirement.

Gantt Chart For Business Promotion Activities Sample PDF
Design a highly optimized project management report using this well-researched gantt chart for business promotion activities sample pdf. This layout can be used to present the professional details of a task or activity. Showcase the activities allocated to the business executives with this Gantt Chart PowerPoint theme. List down the column tasks in various timeframes and allocate time for each. In addition, also monitor the actual time and make comparisons to interpret the final progress using this innovative Gantt Chart Template. Showcase the work breakdown structure to attract your audience. Download and share it using Google Slides, if it suits your requirement.

Project Gantt Chart Showing Design Blueprint Rules PDF
Design a highly optimized project management report using this well-researched project gantt chart showing design blueprint rules pdf. This layout can be used to present the professional details of a task or activity. Showcase the activities allocated to the business executives with this Gantt Chart PowerPoint theme. List down the column tasks in various timeframes and allocate time for each. In addition, also monitor the actual time and make comparisons to interpret the final progress using this innovative Gantt Chart Template. Showcase the work breakdown structure to attract your audience. Download and share it using Google Slides, if it suits your requirement.
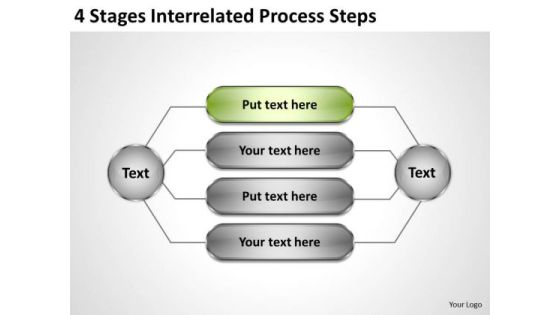
Business Flow Chart 4 Stages Interrelated Process Steps PowerPoint Slides
We present our business flow chart 4 stages interrelated process steps PowerPoint Slides.Download and present our Technology PowerPoint Templates because You can Hit a home run with our PowerPoint Templates and Slides. See your ideas sail into the minds of your audience. Use our Business PowerPoint Templates because Our PowerPoint Templates and Slides are aesthetically designed to attract attention. We gaurantee that they will grab all the eyeballs you need. Download and present our Circle Charts PowerPoint Templates because Our PowerPoint Templates and Slides are created with admirable insight. Use them and give your group a sense of your logical mind. Use our Shapes PowerPoint Templates because Our PowerPoint Templates and Slides will let your team Walk through your plans. See their energy levels rise as you show them the way. Present our Process and Flows PowerPoint Templates because Our PowerPoint Templates and Slides are conceived by a dedicated team. Use them and give form to your wondrous ideas.Use these PowerPoint slides for presentations relating to Arrangement, Attached, Business, Chart, Comparison, Computer, Connect, Connection, Construction, Coordinates, Device, Diagram, Function, Graph, Graphic, Interconnected, Network, Organization, Organize, Plan, Project, Puzzle, Science, Scientific, Segments, Solution, Solve, Structure, Technology. The prominent colors used in the PowerPoint template are Green, Gray, Black.

Venn Business Chart With Percentage Value Powerpoint Template
This PPT slide contains Venn business chart with percentage values. This PPT diagram is suitable to present data comparison and analysis. Enlighten others on the process with this innovative PowerPoint template.
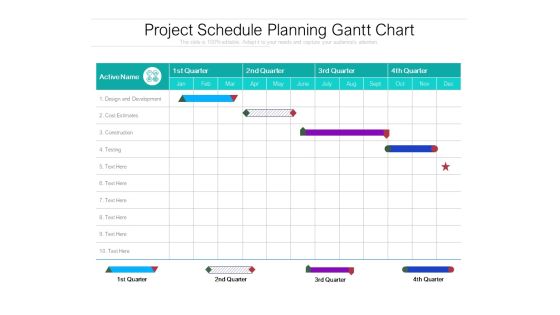
Project Schedule Planning Gantt Chart Ppt PowerPoint Presentation Pictures Guide
Make a highly optimized project management report using this content-ready Gantt Chart PPT Diagram. Effortless yet very clear, this layout proves a useful tool to present the professional details of a task or activity. Showcase the activities and allotted time to the business executives with this Gantt Chart PowerPoint theme. List down the column tasks in various timeframes and the activities associated with each of them here. Further, plot time allocation for various tasks, monitor their actual time and make comparisons to interpret the final progress with this well-structured Gantt Chart Excel Template. You can add all the significant details of a particular project in this chart and showcase it to all the project members so that they can participate in the overall development. Not only this but also our PPT template can help you showcase the work breakdown structure of your project.

Gantt Chart Ppt PowerPoint Presentation Infographic Template Influencers
Make a highly optimized project management report using this content-ready Gantt Chart PPT Diagram. Effortless yet very clear, this layout proves a useful tool to present the professional details of a task or activity. Showcase the activities and allotted time to the business executives with this Gantt Chart PowerPoint theme. List down the column tasks in various timeframes and the activities associated with each of them here. Further, plot time allocation for various tasks, monitor their actual time and make comparisons to interpret the final progress with this well-structured Gantt Chart Excel Template. You can add all the significant details of a particular project in this chart and showcase it to all the project members so that they can participate in the overall development. Not only this but also our PPT template can help you showcase the work breakdown structure of your project.

Gantt Chart Events Ppt PowerPoint Presentation Portfolio Graphics
Make a highly optimized project management report using this content-ready Gantt Chart PPT Diagram. Effortless yet very clear, this layout proves a useful tool to present the professional details of a task or activity. Showcase the activities and allotted time to the business executives with this Gantt Chart PowerPoint theme. List down the column tasks in various timeframes and the activities associated with each of them here. Further, plot time allocation for various tasks, monitor their actual time and make comparisons to interpret the final progress with this well-structured Gantt Chart Excel Template. You can add all the significant details of a particular project in this chart and showcase it to all the project members so that they can participate in the overall development. Not only this but also our PPT template can help you showcase the work breakdown structure of your project.
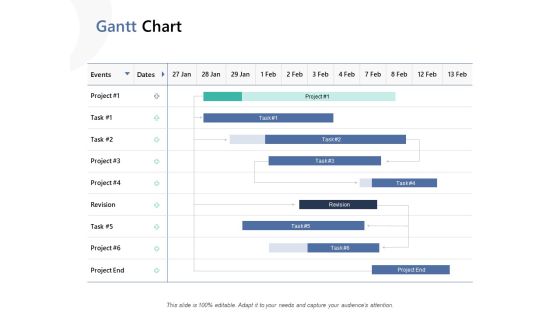
Gantt Chart Ppt PowerPoint Presentation Model Design Inspiration
Make a highly optimized project management report using this content-ready Gantt Chart PPT Diagram. Effortless yet very clear, this layout proves a useful tool to present the professional details of a task or activity. Showcase the activities and allotted time to the business executives with this Gantt Chart PowerPoint theme. List down the column tasks in various timeframes and the activities associated with each of them here. Further, plot time allocation for various tasks, monitor their actual time and make comparisons to interpret the final progress with this well-structured Gantt Chart Excel Template. You can add all the significant details of a particular project in this chart and showcase it to all the project members so that they can participate in the overall development. Not only this but also our PPT template can help you showcase the work breakdown structure of your project.

Business Coaching Gantt Chart Ppt PowerPoint Presentation Layouts Files PDF
Make a highly optimized project management report using this content-ready Gantt Chart PPT Diagram. Effortless yet very clear, this layout proves a useful tool to present the professional details of a task or activity. Showcase the activities and allotted time to the business executives with this Gantt Chart PowerPoint theme. List down the column tasks in various timeframes and the activities associated with each of them here. Further, plot time allocation for various tasks, monitor their actual time and make comparisons to interpret the final progress with this well-structured Gantt Chart Excel Template. You can add all the significant details of a particular project in this chart and showcase it to all the project members so that they can participate in the overall development. Not only this but also our PPT template can help you showcase the work breakdown structure of your project.

Comparative Medical Services Trend Linear Chart Mockup PDF
This slide depicts the comparison of medical services across the globe based on the revenue generated. It includes Asia, North America, South America, Europe and Middle east Showcasing this set of slides titled Comparative Medical Services Trend Linear Chart Mockup PDF. The topics addressed in these templates are Observations, Comparative Medical Services, Linear Chart. All the content presented in this PPT design is completely editable. Download it and make adjustments in color, background, font etc. as per your unique business setting.

Strategic Business Chart To Identify Best Monetary Sources Microsoft PDF
This slide shows the comparison of various business funding sources. These sources are loans, renting, listed bonds, stock market, etc. Showcasing this set of slides titled Strategic Business Chart To Identify Best Monetary Sources Microsoft PDF. The topics addressed in these templates are Loan From Bank, Renting, Listed Bonds. All the content presented in this PPT design is completely editable. Download it and make adjustments in color, background, font etc. as per your unique business setting.

Coverage Financial Ratios Chart For 5 Financial Years Themes PDF
This slide illustrates graph for coverage ratios that are interest coverage ratio, debt service coverage ratio and asset coverage ratio. It showcases comparison for a period of 5 years that can help company to measure ability to service its debt and meet its financial obligations Showcasing this set of slides titled coverage financial ratios chart for 5 financial years themes pdf. The topics addressed in these templates are coverage financial ratios chart for 5 financial years. All the content presented in this PPT design is completely editable. Download it and make adjustments in color, background, font etc. as per your unique business setting.

Inventory Turnover Financial Ratios Chart Conversion Portrait PDF
This slide illustrates graph for inventory turnover ratio that can help company to analyze efficiency of inventory management. It showcases ratio graph comparison of 4 companies for a period of last 6 years Pitch your topic with ease and precision using this inventory turnover financial ratios chart conversion portrait pdf. This layout presents information on inventory turnover financial ratios chart conversion. It is also available for immediate download and adjustment. So, changes can be made in the color, design, graphics or any other component to create a unique layout.
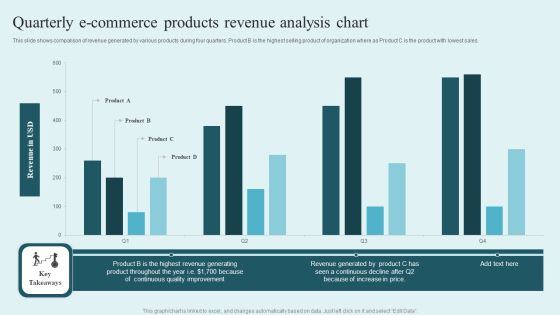
Quarterly E Commerce Products Revenue Analysis Chart Guidelines PDF
This slide shows comparison of revenue generated by various products during four quarters. Product B is the highest selling product of organization where as Product C is the product with lowest sales. Showcasing this set of slides titled Quarterly E Commerce Products Revenue Analysis Chart Guidelines PDF. The topics addressed in these templates are Revenue USD, Product, Continuous Quality Improvement. All the content presented in this PPT design is completely editable. Download it and make adjustments in color, background, font etc. as per your unique business setting.
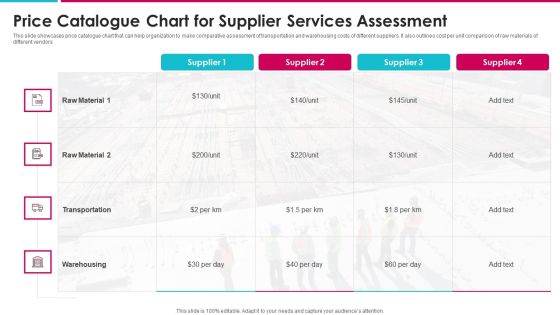
Price Catalogue Chart For Supplier Services Assessment Inspiration PDF
This slide showcases price catalogue chart that can help organization to make comparative assessment of transportation and warehousing costs of different suppliers. It also outlines cost per unit comparison of raw materials of Showcasing this set of slides titled price catalogue chart for supplier services assessment inspiration pdf. The topics addressed in these templates are price catalogue chart for supplier services assessment. All the content presented in this PPT design is completely editable. Download it and make adjustments in color, background, font etc. as per your unique business setting.

Donut Pie Chart Ppt PowerPoint Presentation Infographic Template Diagrams
This is a donut pie chart ppt powerpoint presentation infographic template diagrams. This is a three stage process. The stages in this process are business, strategy, analysis, pretention, comparison.
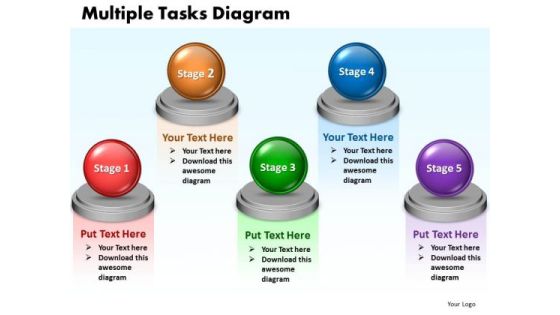
Ppt Multiple Tasks Chart 5 Stages PowerPoint Templates 2003
PPT multiple tasks chart 5 stages powerpoint templates 2003 0812-This diagram will help you to organize information, organize and run effective meetings, and generate useful member contributions.-PPT multiple tasks chart 5 stages powerpoint templates 2003 0812-3d, Abstract, Backgrounds, Ball, Business, Choice, Comparison, Concept, Descriptive, Equilibrium, Grow, Illustrations, Instrument, Measurement, Metallic, Part, Partnership, Pattern, Progress, Reflections, Scales, Several, Sphere, Strategy, Success
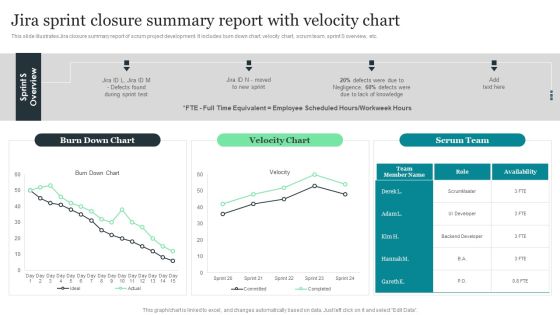
Jira Sprint Closure Summary Report With Velocity Chart Designs PDF
This slide illustrates Jira closure summary report of scrum project development. It includes burn down chart, velocity chart, scrum team, sprint S overview, etc. Pitch your topic with ease and precision using this Jira Sprint Closure Summary Report With Velocity Chart Designs PDF. This layout presents information on Jira Sprint Closure, Summary Report, Velocity Chart. It is also available for immediate download and adjustment. So, changes can be made in the color, design, graphics or any other component to create a unique layout.
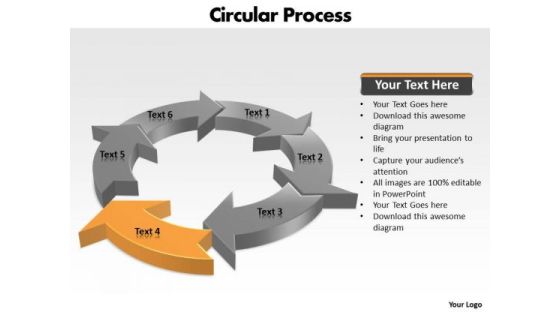
Ppt Components Of Circular PowerPoint Menu Template Process Chart Templates
PPT components of circular powerpoint menu template process chart Templates-This circular flow diagram can helps to illustrate the economic exchange that takes place in the building of wealth. Clarity of thought has been the key to your growth. Use our template to illustrate your ability.-PPT components of circular powerpoint menu template process chart Templates-Arrow, Chart, Circular, Color, Colorful, Connect, Connection, Design, Diagram, Finance, Graphic, Group, Growth, Icon, Illustration, Marketing, Pieces, Process, Recycle, Recycling, Round, Set, Strategy, Symbol, Wheel

4 Interrelated Components Displaying Concepts Circular Flow Chart PowerPoint Slides
We present our 4 interrelated components displaying concepts Circular Flow Chart PowerPoint Slides.Download our Circle Charts PowerPoint Templates because your brain is always churning out ideas like cogs in a wheel. Download and present our Abstract PowerPoint Templates because you have what it takes to grow. Download and present our Arrows PowerPoint Templates because this slide illuminates the spiritual brilliance of Jesus and showers the love for mankind he showed even while being crucified. Present our Business PowerPoint Templates because the great Bald headed Eagle embodies your personality. the eagle eye to seize upon the smallest of opportunities. Present our Flow Charts PowerPoint Templates because your quicksilver ideas are the arrows in your quiver.Use these PowerPoint slides for presentations relating to 3d, architecture, blue, business, chat, chatting, communication, community, component, computer, concept, connection, contact, digital, display, equipment, global, globalization, group, information, internet, interrelation, isolated, link, media, medium, network,organization, scope, social, society, sphere, spherical, structure, symbol, technology, telecommunication, television, union, unity, virtual, web, white, www. The prominent colors used in the PowerPoint template are Red, Yellow, Green. Presenters tell us our 4 interrelated components displaying concepts Circular Flow Chart PowerPoint Slides are Charming. You can be sure our component PowerPoint templates and PPT Slides are Detailed. Professionals tell us our 4 interrelated components displaying concepts Circular Flow Chart PowerPoint Slides are Quaint. People tell us our business PowerPoint templates and PPT Slides are Spiffy. People tell us our 4 interrelated components displaying concepts Circular Flow Chart PowerPoint Slides are Elevated. Professionals tell us our blue PowerPoint templates and PPT Slides are Cheerful.
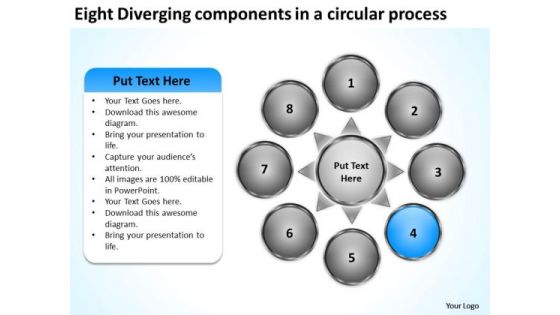
Eight Diverging Components A Circular Process Pie Chart PowerPoint Slides
We present our eight diverging components a circular process Pie Chart PowerPoint Slides.Download our Business PowerPoint Templates because this is the unerring accuracy in reaching the target. the effortless ability to launch into flight. Present our Circle Charts PowerPoint Templates because you have the entire picture in mind. Use our Arrows PowerPoint Templates because this template helps you to put your finger on the pulse of your business and sense the need to re-align a bit. Use our Shapes PowerPoint Templates because this can explain the various related aspects of these varied tracks and how they will, on hitting their own targets, cumulatively contribute to hitting GOLD. Download our Flow charts PowerPoint Templates because this is an appropriate layout to convince your team that they have the ability to score a tEN every time.Use these PowerPoint slides for presentations relating to Arrows, blank, business, central, centralized, chart, circle, circular, circulation concept, conceptual, converging, design, diagram, empty, executive, icon, idea illustration, management, map, mapping, moa, model, numbers, organization outwards, pointing, procedure, process, radial, radiating, relationship, resource sequence, sequential, seven, square, strategy, template. The prominent colors used in the PowerPoint template are Blue, Gray, White. Presenters tell us our eight diverging components a circular process Pie Chart PowerPoint Slides will save the presenter time. Presenters tell us our business PowerPoint templates and PPT Slides are Zippy. PowerPoint presentation experts tell us our eight diverging components a circular process Pie Chart PowerPoint Slides are Appealing. We assure you our chart PowerPoint templates and PPT Slides are Pleasant. Customers tell us our eight diverging components a circular process Pie Chart PowerPoint Slides are Gorgeous. People tell us our business PowerPoint templates and PPT Slides are the best it can get when it comes to presenting.
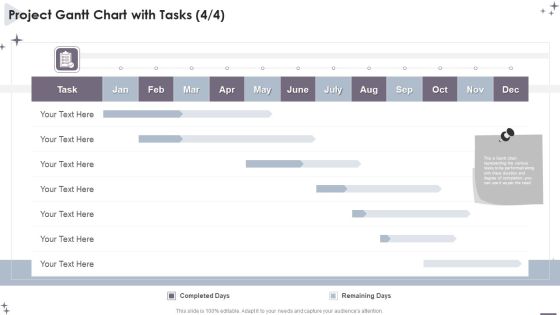
Project Administration Bundle Project Gantt Chart With Tasks Structure PDF
Plan, track and synchronize the most important tasks of any project with this exemplary Project Administration Bundle Project Gantt Chart With Tasks Structure PDF. This lucrative template can be used to manage the project efficiently. You can enter all the vital components of the project like the start date, duration, and status of each task to keep the owners accountability in check. Create a highly proficient scheduling plan and measure its progress with this elaborative layout. In addition, you can add your activities in the taskbar included in this template and edit it to handle your project effectively. This template is ideal for project management, business plans, student projects, and assignments. So download and captivate your audience.
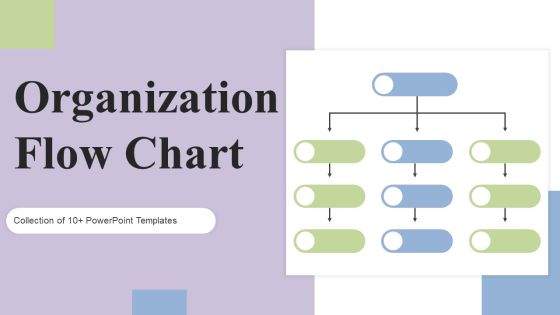
Organization Flow Chart Ppt PowerPoint Presentation Complete Deck With Slides
Boost your confidence and team morale with this well structured Organization Flow Chart Ppt PowerPoint Presentation Complete Deck With Slides. This prefabricated set gives a voice to your presentation because of its well researched content and graphics. Our experts have added all the components very carefully, thus helping you deliver great presentations with a single click. Not only that, it contains a set of seventeen slides that are designed using the right visuals, graphics, etc. Various topics can be discussed, and effective brainstorming sessions can be conducted using the wide variety of slides added in this complete deck. Apart from this, our PPT design contains clear instructions to help you restructure your presentations and create multiple variations. The color, format, design anything can be modified as deemed fit by the user. Not only this, it is available for immediate download. So, grab it now.
Scrum Kpis With Sprint Burndown Chart Ppt Icon Elements PDF
This slide illustrates scrum key performance indicators for individual sprints. It includes tasks, story points, bugs, burndown charts, statistics etc. Pitch your topic with ease and precision using this Scrum Kpis With Sprint Burndown Chart Ppt Icon Elements PDF. This layout presents information on Burndown Chart, Story Points, Cost, Bugs. It is also available for immediate download and adjustment. So, changes can be made in the color, design, graphics or any other component to create a unique layout.

Countries Information Technology Export Share Circle Chart Inspiration PDF
This slide depicts IT export share chart of countries to determine global market share. It includes export market share percentage of different countries. Pitch your topic with ease and precision using this Countries Information Technology Export Share Circle Chart Inspiration PDF. This layout presents information on Countries Information Technology, Export Share Circle Chart. It is also available for immediate download and adjustment. So, changes can be made in the color, design, graphics or any other component to create a unique layout.

USA Phone Market Share Circle Chart Sample PDF
This slide depicts phone market share chart of USA to determine market leader in United States of America. It includes market share of phone companies in USA. Pitch your topic with ease and precision using this USA Phone Market Share Circle Chart Sample PDF. This layout presents information on USA Phone Market, Share Circle Chart. It is also available for immediate download and adjustment. So, changes can be made in the color, design, graphics or any other component to create a unique layout.
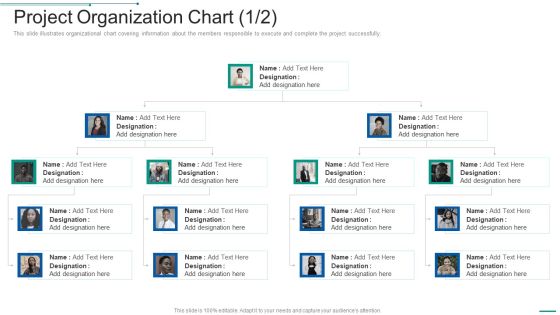
PMP Toolkit Project Organization Chart Ppt Portfolio Layout Ideas PDF
Following slide portrays organizational chart covering information about the members responsible to execute and complete the project successfully. This is a pmp toolkit project organization chart ppt portfolio layout ideas pdf template with various stages. Focus and dispense information on two stages using this creative set, that comes with editable features. It contains large content boxes to add your information on topics like project organization chart. You can also showcase facts, figures, and other relevant content using this PPT layout. Grab it now.
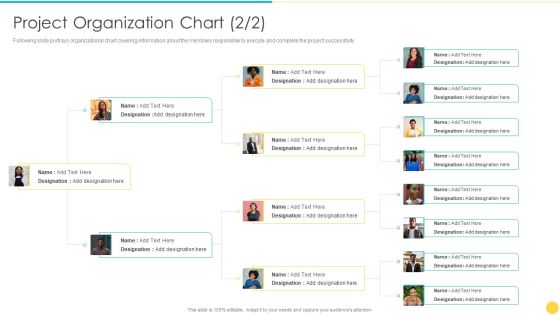
Project Management Professional Toolset IT Project Organization Chart Clipart PDF
This slide illustrates organizational chart covering information about the members responsible to execute and complete the project successfully. This is a project management professional toolset it project organization chart clipart pdf template with various stages. Focus and dispense information on two stages using this creative set, that comes with editable features. It contains large content boxes to add your information on topics like project organization chart. You can also showcase facts, figures, and other relevant content using this PPT layout. Grab it now.

Multiphase Monthly Gantt Bar Chart With Budget Clipart PDF
Pitch your topic with ease and precision using this Multiphase Monthly Gantt Bar Chart With Budget Clipart PDF. This layout presents information on Gantt Bar Chart, Budget. It is also available for immediate download and adjustment. So, changes can be made in the color, design, graphics or any other component to create a unique layout.

Project Monthly Gantt Bar Chart With Completion Status Infographics PDF
Pitch your topic with ease and precision using this Project Monthly Gantt Bar Chart With Completion Status Infographics PDF. This layout presents information on Project, Monthly Gantt Bar Chart. It is also available for immediate download and adjustment. So, changes can be made in the color, design, graphics or any other component to create a unique layout.
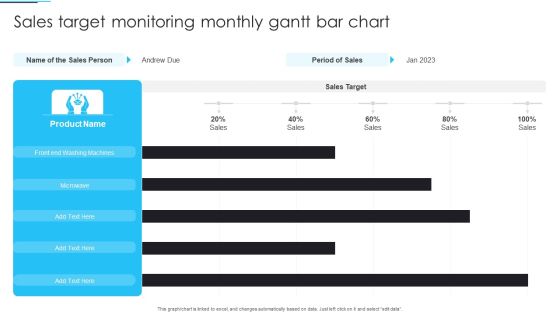
Sales Target Monitoring Monthly Gantt Bar Chart Ideas PDF
Pitch your topic with ease and precision using this Sales Target Monitoring Monthly Gantt Bar Chart Ideas PDF. This layout presents information on Sales Target Monitoring, Monthly Gantt Bar Chart. It is also available for immediate download and adjustment. So, changes can be made in the color, design, graphics or any other component to create a unique layout.
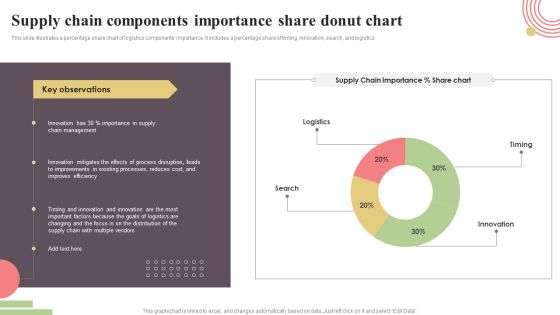
Supply Chain Components Importance Share Donut Chart Rules PDF
This slide illustrates a percentage share chart of logistics components importance. It includes a percentage share of timing, innovation, search, and logistics. Showcasing this set of slides titled Supply Chain Components Importance Share Donut Chart Rules PDF. The topics addressed in these templates are Timing, Innovation, Search, Logistics. All the content presented in this PPT design is completely editable. Download it and make adjustments in color, background, font etc. as per your unique business setting.
Unsatisfactory Performance Chart Icon With Downward Arrow Infographics PDF
Pitch your topic with ease and precision using this Unsatisfactory Performance Chart Icon With Downward Arrow Infographics PDF. This layout presents information on Unsatisfactory Performance, Chart Icon, Downward Arrow. It is also available for immediate download and adjustment. So, changes can be made in the color, design, graphics or any other component to create a unique layout.

Business Process Chart With Key Takeaways Ppt Summary Files PDF
Pitch your topic with ease and precision using this business process chart with key takeaways ppt summary files pdf. This layout presents information on business process chart with key takeaways. It is also available for immediate download and adjustment. So, changes can be made in the color, design, graphics or any other component to create a unique layout.

Environmental Problems Chart Showing Contribution Towards Global Pollution Elements PDF
Pitch your topic with ease and precision using this environmental problems chart showing contribution towards global pollution elements pdf. This layout presents information on environmental problems chart showing contribution towards global pollution. It is also available for immediate download and adjustment. So, changes can be made in the color, design, graphics or any other component to create a unique layout.
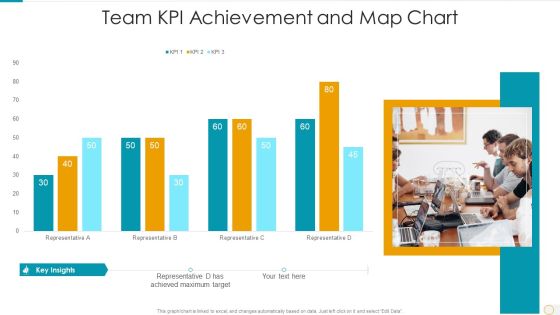
Team Kpi Achievement And Map Chart Portrait PDF
Pitch your topic with ease and precision using this team kpi achievement and map chart portrait pdf. This layout presents information on team kpi achievement and map chart. It is also available for immediate download and adjustment. So, changes can be made in the color, design, graphics or any other component to create a unique layout.

Use Pareto Chart Graph Software For Quality Administration Structure PDF
Pitch your topic with ease and precision using this use pareto chart graph software for quality administration structure pdf. This layout presents information on use pareto chart graph software for quality administration. It is also available for immediate download and adjustment. So, changes can be made in the color, design, graphics or any other component to create a unique layout.

Several Project Work Status With Pie Chart Microsoft PDF
Pitch your topic with ease and precision using this several project work status with pie chart microsoft pdf . This layout presents information on several project work status with pie chart . It is also available for immediate download and adjustment. So, changes can be made in the color, design, graphics or any other component to create a unique layout.
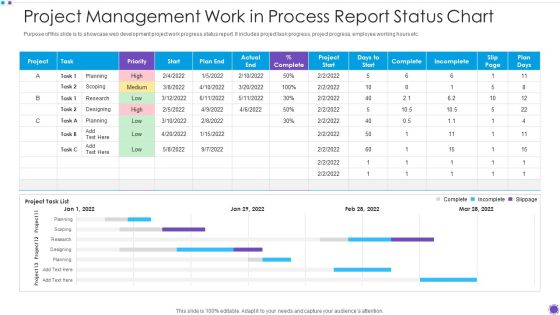
Project Management Work In Process Report Status Chart Microsoft PDF
Pitch your topic with ease and precision using this project management work in process report status chart microsoft pdf. This layout presents information on project management work in process report status chart. It is also available for immediate download and adjustment. So, changes can be made in the color, design, graphics or any other component to create a unique layout.

Work In Process Report Chart For Logistics Management Slides PDF
Pitch your topic with ease and precision using this work in process report chart for logistics management slides pdf. This layout presents information on work in process report chart for logistics management. It is also available for immediate download and adjustment. So, changes can be made in the color, design, graphics or any other component to create a unique layout.

Biyearly Gantt Chart For Multiple Task Project Structure PDF
Pitch your topic with ease and precision using this Biyearly Gantt Chart For Multiple Task Project Structure PDF. This layout presents information on Biyearly Gantt Chart, Multiple Task Project. It is also available for immediate download and adjustment. So, changes can be made in the color, design, graphics or any other component to create a unique layout.
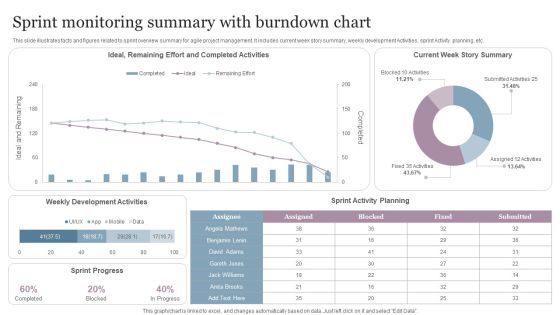
Sprint Monitoring Summary With Burndown Chart Portrait PDF
Pitch your topic with ease and precision using this Sprint Monitoring Summary With Burndown Chart Portrait PDF. This layout presents information on Sprint Monitoring Summary, Burndown Chart . It is also available for immediate download and adjustment. So, changes can be made in the color, design, graphics or any other component to create a unique layout.

Business Data Analysis Chart Comparing Multiple Entities PowerPoint Templates
Analyze Ailments On Our business data analysis chart comparing multiple entities Powerpoint Templates. Bring Out The Thinking Doctor In You. Dock Your Thoughts With Our Financial Analysis . They Will Launch Them Into Orbit.

PowerPoint Template Global Business Process Chart Ppt Template
PowerPoint Template Global Business Process Chart PPT Template-Highlight the key components of your entire manufacturing/ business process. Illustrate how each element flows seamlessly onto the next stage. Emphasise on any critical or key factors within them. Demonstrate how they all combine to form the final product.-PowerPoint Template Global Business Process Chart PPT Template
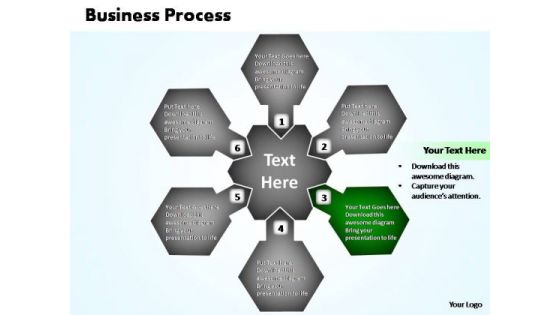
PowerPoint Design Slides Growth Business Process Chart Ppt Theme
PowerPoint Design Slides Growth Business Process Chart PPT Theme-Highlight the key components of your entire manufacturing/ business process. Illustrate how each element flows seamlessly onto the next stage. Emphasise on any critical or key factors within them. Demonstrate how they all combine to form the final product.-PowerPoint Design Slides Growth Business Process Chart PPT Theme
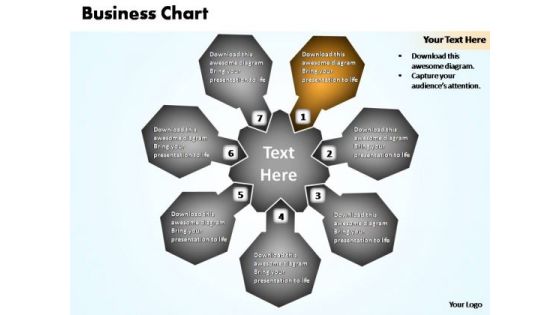
PowerPoint Design Slides Image Business Process Chart Ppt Themes
PowerPoint Design Slides Image Business Process Chart PPT Themes-Highlight the key components of your entire manufacturing/ business process. Illustrate how each element flows seamlessly onto the next stage. Emphasise on any critical or key factors within them. Demonstrate how they all combine to form the final product.-PowerPoint Design Slides Image Business Process Chart PPT Themes
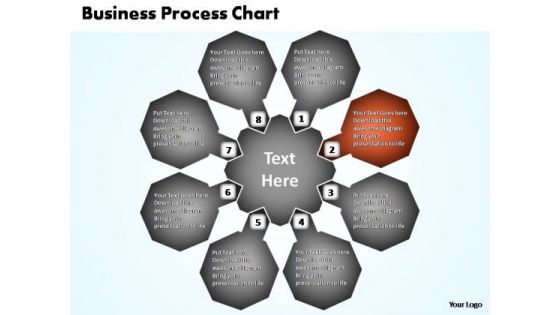
PowerPoint Process Diagram Business Process Chart Ppt Backgrounds
PowerPoint Process Diagram Business Process Chart PPT Backgrounds-Highlight the key components of your entire manufacturing/ business process. Illustrate how each element flows seamlessly onto the next stage. Emphasise on any critical or key factors within them. Demonstrate how they all combine to form the final product.-PowerPoint Process Diagram Business Process Chart PPT Backgrounds
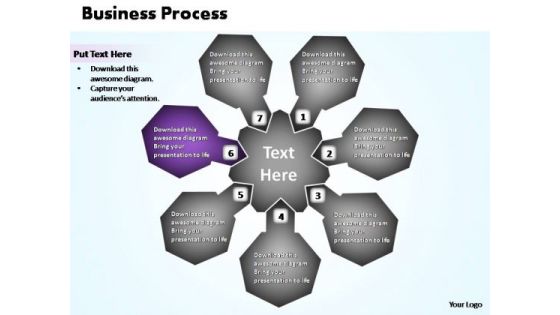
PowerPoint Backgrounds Leadership Business Process Chart Ppt Presentation
PowerPoint Backgrounds Leadership Business Process Chart PPT Presentation-Highlight the key components of your entire manufacturing/ business process. Illustrate how each element flows seamlessly onto the next stage. Emphasise on any critical or key factors within them. Demonstrate how they all combine to form the final product.-PowerPoint Backgrounds Leadership Business Process Chart PPT Presentation
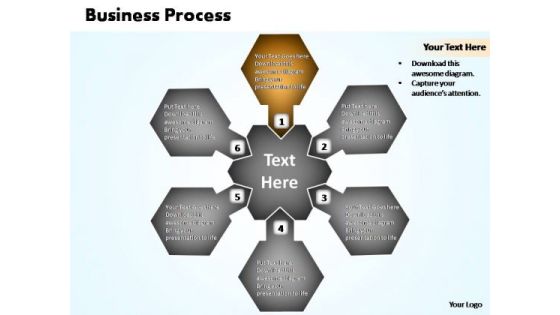
PowerPoint Backgrounds Sales Business Process Chart Ppt Slide Designs
PowerPoint Backgrounds Sales Business Process Chart PPT Slide Designs-Highlight the key components of your entire manufacturing/ business process. Illustrate how each element flows seamlessly onto the next stage. Emphasise on any critical or key factors within them. Demonstrate how they all combine to form the final product.-PowerPoint Backgrounds Sales Business Process Chart PPT Slide Designs

PowerPoint Design Download Business Process Chart Ppt Designs
PowerPoint Design Download Business Process Chart PPT Designs-Highlight the key components of your entire manufacturing/ business process. Illustrate how each element flows seamlessly onto the next stage. Emphasise on any critical or key factors within them. Demonstrate how they all combine to form the final product.-PowerPoint Design Download Business Process Chart PPT Designs

PowerPoint Design Graphic Business Process Chart Ppt Designs
PowerPoint Design Graphic Business Process Chart PPT Designs-Highlight the key components of your entire manufacturing/ business process. Illustrate how each element flows seamlessly onto the next stage. Emphasise on any critical or key factors within them. Demonstrate how they all combine to form the final product.-PowerPoint Design Graphic Business Process Chart PPT Designs
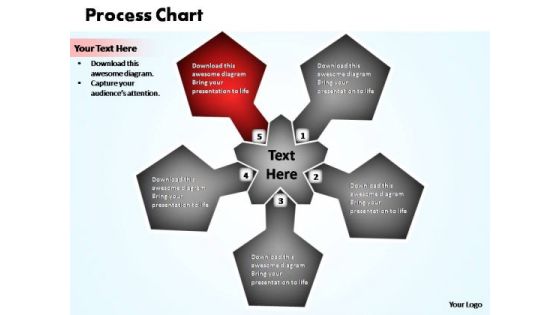
PowerPoint Presentation Leadership Business Process Chart Ppt Designs
PowerPoint Presentation Leadership Business Process Chart PPT Designs-Highlight the key components of your entire manufacturing/ business process. Illustrate how each element flows seamlessly onto the next stage. Emphasise on any critical or key factors within them. Demonstrate how they all combine to form the final product.-PowerPoint Presentation Leadership Business Process Chart PPT Designs

PowerPoint Presentation Success Business Process Chart Ppt Backgrounds
PowerPoint Presentation Success Business Process Chart PPT Backgrounds-Highlight the key components of your entire manufacturing/ business process. Illustrate how each element flows seamlessly onto the next stage. Emphasise on any critical or key factors within them. Demonstrate how they all combine to form the final product.-PowerPoint Presentation Success Business Process Chart PPT Backgrounds

 Home
Home