Comparison Chart
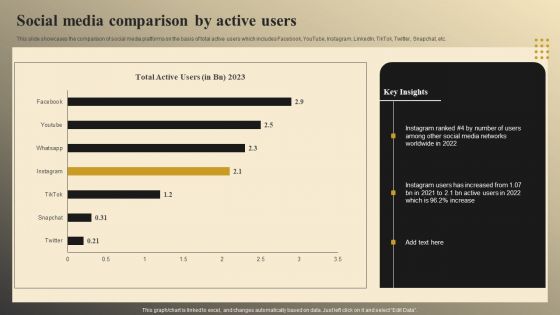
Online Video Model Company Profile Social Media Comparison By Active Users Summary PDF
This slide showcases the comparison of social media platforms on the basis of total active users which includes Facebook, YouTube, Instagram, LinkedIn, TikTok, Twitter, Snapchat, etc. Make sure to capture your audiences attention in your business displays with our gratis customizable Online Video Model Company Profile Social Media Comparison By Active Users Summary PDF. These are great for business strategies, office conferences, capital raising or task suggestions. If you desire to acquire more customers for your tech business and ensure they stay satisfied, create your own sales presentation with these plain slides.
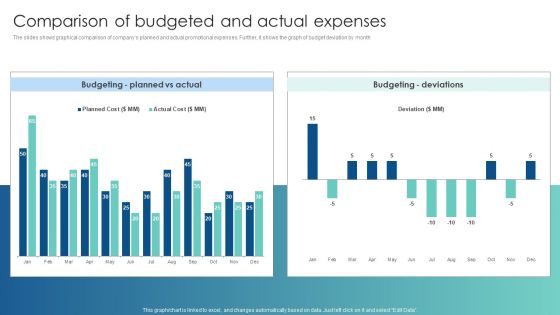
Comparison Of Budgeted And Actual Expenses Customer Acquisition Through Advertising Clipart PDF
The slides shows graphical comparison of companys planned and actual promotional expenses. Further, it shows the graph of budget deviation by month. Take your projects to the next level with our ultimate collection of Comparison Of Budgeted And Actual Expenses Customer Acquisition Through Advertising Clipart PDF. Slidegeeks has designed a range of layouts that are perfect for representing task or activity duration, keeping track of all your deadlines at a glance. Tailor these designs to your exact needs and give them a truly corporate look with your own brand colors they well make your projects stand out from the rest.

Price Comparison Between Crude Oil And Natural Gas Ppt Summary Smartart PDF
The slide provides the price comparison graph of crude oil and natural gas from the year 1995 to 2021. Additionally, it provides the key facts such as reason behind the increase or decrease in price, factors that affect the price etc.Deliver an awe-inspiring pitch with this creative price comparison between crude oil and natural gas ppt summary smartart pdf. bundle. Topics like global crude oil vs. usgc natural gas, 1995 to 2021 can be discussed with this completely editable template. It is available for immediate download depending on the needs and requirements of the user.

Sales Assistance Boost Overall Efficiency Sales Comparison Year Over Year Brochure PDF
This slide provides information regarding the brand sales report of last month in terms of the best selling as well as worst selling products of various brands. It will help in recognizing the winners and losers of the month. Deliver an awe-inspiring pitch with this creative sales assistance boost overall efficiency sales comparison year over year brochure pdf bundle. Topics like sales comparison year over year can be discussed with this completely editable template. It is available for immediate download depending on the needs and requirements of the user.
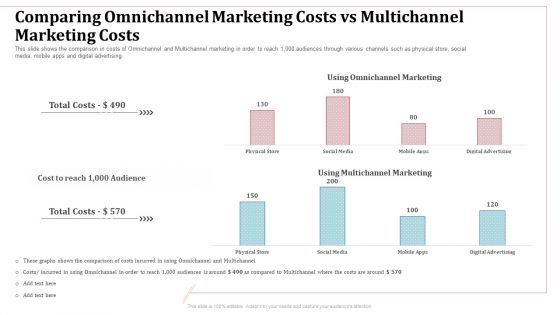
Comparing Omnichannel Marketing Costs Vs Multichannel Marketing Costs Comparison Ppt Model Picture PDF
This slide shows the comparison in costs of Omnichannel and Multichannel marketing in order to reach 1,000 audiences through various channels such as physical store, social media, mobile apps and digital advertising. Deliver an awe inspiring pitch with this creative comparing omnichannel marketing costs vs multichannel marketing costs comparison ppt model picture pdf bundle. Topics like using omnichannel marketing, multichannel marketing, social media, digital advertising, marketing costs can be discussed with this completely editable template. It is available for immediate download depending on the needs and requirements of the user.

Ukraine Russia Conflict Effect On Petroleum Industry Comparison Of Russian Oil Rules PDF
This slide focuses on Russia crude oil imports by China in comparison to other countries which shows China is largest importer of Russian oil as compared to Netherlands, Germany, Korea, Poland, Italy, Belarus, Japan, etc.Deliver and pitch your topic in the best possible manner with this Ukraine Russia Conflict Effect On Petroleum Industry Comparison Of Russian Oil Rules PDF Use them to share invaluable insights on Sanctions Against Russia, Russia Exported, Seaborne Crude To China and impress your audience. This template can be altered and modified as per your expectations. So, grab it now.

Ukraine Vs Russia Examining Russia Vs Ukraine Comparison Based On Economic Indicators Sample PDF
This slide provides information regarding comparison of Russia and Ukraine based on economic indicators. Both nations are compared on parameters such as inflation, petrol prices, GDP per capita, USD exchange rate. Deliver an awe inspiring pitch with this creative Ukraine Vs Russia Examining Russia Vs Ukraine Comparison Based On Economic Indicators Sample PDF bundle. Topics like Inflation, Petrol Prices, USD Exchange Rate, GDP Per Capita can be discussed with this completely editable template. It is available for immediate download depending on the needs and requirements of the user.

Quarterly Sales Performance Of Business Comparison With Key Insight Guidelines PDF
This slide gives statistics of period-on-period sales analysis to review the current performance of organization and gradual progress. It includes data across two years with key insights. Showcasing this set of slides titled Quarterly Sales Performance Of Business Comparison With Key Insight Guidelines PDF. The topics addressed in these templates are Quarterly Sales Performance, Business Comparison, Key Insight. All the content presented in this PPT design is completely editable. Download it and make adjustments in color, background, font etc. as per your unique business setting.
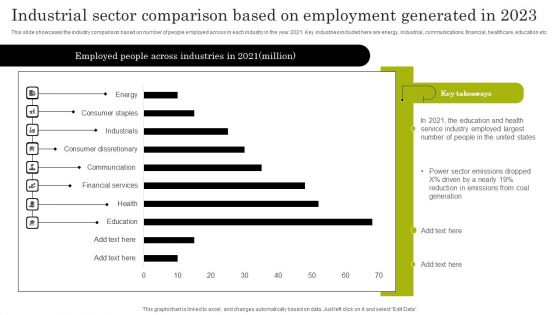
Industrial Sector Comparison Based On Employment Generated In 2023 Portrait PDF
This slide showcases the industry comparison based on number of people employed across in each industry in the year 2021. Key industries included here are energy, industrial, communications, financial, healthcare, education etc. Showcasing this set of slides titled Industrial Sector Comparison Based On Employment Generated In 2023 Portrait PDF. The topics addressed in these templates are Employed People, Across Industries, Power Sector Emissions. All the content presented in this PPT design is completely editable. Download it and make adjustments in color, background, font etc. as per your unique business setting.
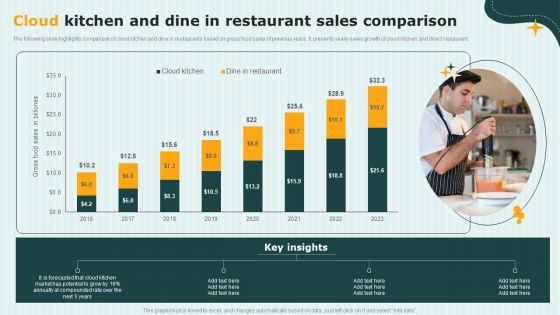
International Cloud Kitchen Industry Analysis Cloud Kitchen And Dine In Restaurant Sales Comparison Rules PDF
The following slide highlights comparison of cloud kitchen and dine in restaurants based on gross food sales of previous years. It presents yearly sales growth of cloud kitchen and direct restaurant. Want to ace your presentation in front of a live audience Our International Cloud Kitchen Industry Analysis Cloud Kitchen And Dine In Restaurant Sales Comparison Rules PDF can help you do that by engaging all the users towards you.. Slidegeeks experts have put their efforts and expertise into creating these impeccable powerpoint presentations so that you can communicate your ideas clearly. Moreover, all the templates are customizable, and easy-to-edit and downloadable. Use these for both personal and commercial use.
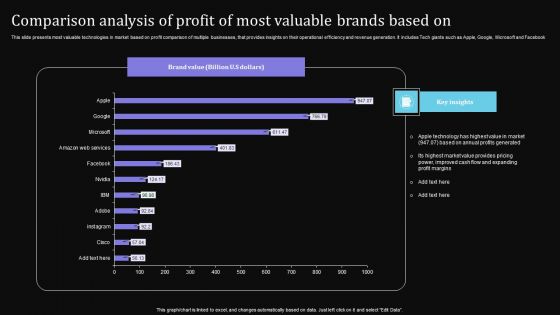
Comparison Analysis Of Profit Of Most Valuable Brands Based On Pictures PDF
This slide presents most valuable technologies in market based on profit comparison of multiple businesses, that provides insights on their operational efficiency and revenue generation. It includes Tech giants such as Apple, Google, Microsoft and Facebook. Showcasing this set of slides titled Comparison Analysis Of Profit Of Most Valuable Brands Based On Pictures PDF. The topics addressed in these templates are Apple Technology, Annual Profits Generated, Improved Cash Flow. All the content presented in this PPT design is completely editable. Download it and make adjustments in color, background, font etc. as per your unique business setting.
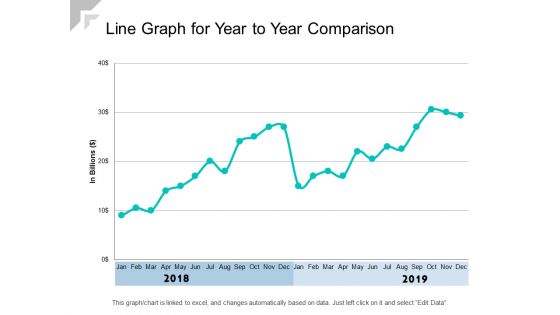
Line Graph For Year To Year Comparison Ppt PowerPoint Presentation Show Graphics Example
Presenting this set of slides with name line graph for year to year comparison ppt powerpoint presentation show graphics example. The topics discussed in these slides are revenue trend, bar chart, financial. This is a completely editable PowerPoint presentation and is available for immediate download. Download now and impress your audience.
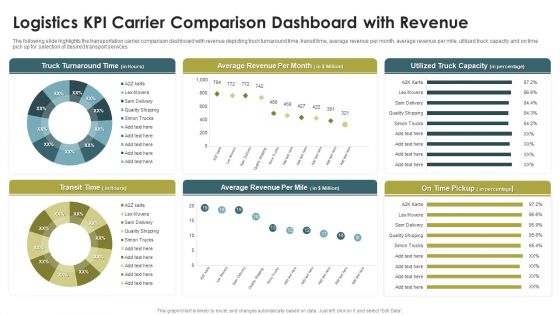
Logistics KPI Carrier Comparison Dashboard With Revenue Ppt Infographics Portfolio PDF
The following slide highlights the transportation carrier comparison dashboard with revenue depicting truck turnaround time, transit time, average revenue per month, average revenue per mile, utilized truck capacity and on time pick up for selection of desired transport services. Pitch your topic with ease and precision using this Logistics KPI Carrier Comparison Dashboard With Revenue Ppt Infographics Portfolio PDF. This layout presents information on Truck Turnaround Time, Average Revenue, Per Month, Transit Time. It is also available for immediate download and adjustment. So, changes can be made in the color, design, graphics or any other component to create a unique layout.
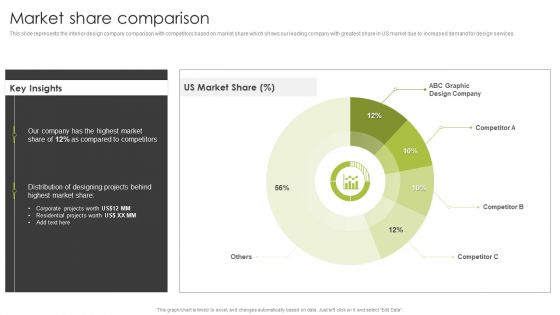
Home Interior Styling Services Company Profile Market Share Comparison Sample PDF
Deliver an awe inspiring pitch with this creative Home Interior Styling Services Company Profile Market Share Comparison Sample PDF bundle. Topics like Compared Competitors, Distribution Of Designing, Residential Projects can be discussed with this completely editable template. It is available for immediate download depending on the needs and requirements of the user.

How Make Impactful Product Marketing Message Build Product Differentiation Product Feature Comparison Background PDF
Deliver an awe inspiring pitch with this creative how make impactful product marketing message build product differentiation product feature comparison background pdf bundle. Topics like our product, competitors product can be discussed with this completely editable template. It is available for immediate download depending on the needs and requirements of the user.
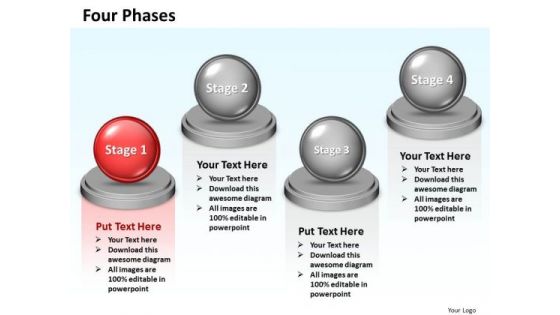
Ppt Comparison Swim Lane Diagram PowerPoint Template Of 4 Phases Templates
PPT comparison swim lane diagram powerpoint template of 4 phases Templates-This image has been professionally designed to displays the relationship between a business process and the functional units (such as departments) responsible for that process. It is a powerful tool conceived to enable you to define your message in your presentations. This Professional looking template of Swim lane diagram which help you create organizational presentations rapidly.-PPT comparison swim lane diagram powerpoint template of 4 phases Templates-3d, Balance, Ball, Best, Board, Business, Clipart, Color, Compare, Comparison, Concept, Graphic, Heavy, Illustration, Isolated, Level, Nobody, Opposite, Orange, Parity, Render, Rendered, Reverse, Scale, Simple, Sphere
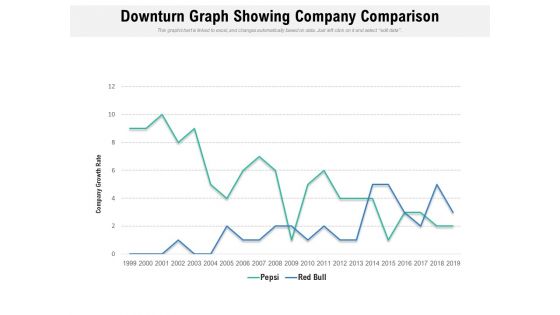
Downturn Graph Showing Company Comparison Ppt PowerPoint Presentation Professional Graphics Design PDF
Pitch your topic with ease and precision using this downturn graph showing company comparison ppt powerpoint presentation professional graphics design pdf. This layout presents information on company growth rate, red bull, pepsi. It is also available for immediate download and adjustment. So, changes can be made in the color, design, graphics or any other component to create a unique layout.

Ppt Comparison Swim Lane Diagram PowerPoint Template Of 4 State Templates
PPT comparison swim lane diagram powerpoint template of 4 state Templates-This image has been professionally designed to emphasize the concept of business strategy. Use this Swim Lane Diagram to map and improve the processes between departments and teams in your organization. This template is carefully considered and implemented with objectives of beauty, consistency, clarity, and most important, audience impact. Our template will make your presentation look impressive and stunning.-PPT comparison swim lane diagram powerpoint template of 4 state Templates-3d, Balance, Ball, Best, Board, Business, Clipart, Color, Compare, Comparison, Concept, Graphic, Heavy, Illustration, Isolated, Level, Nobody, Opposite, Orange, Parity, Render, Rendered, Reverse, Scale, Simple, Sphere
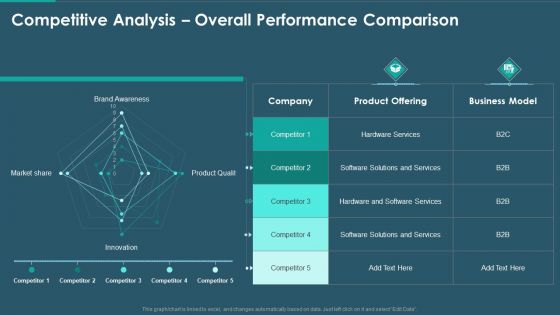
Sales And Promotion Playbook Competitive Analysis Overall Performance Comparison Infographics PDF
Deliver and pitch your topic in the best possible manner with this sales and promotion playbook competitive analysis overall performance comparison infographics pdf. Use them to share invaluable insights on product offering, business model, services and impress your audience. This template can be altered and modified as per your expectations. So, grab it now.
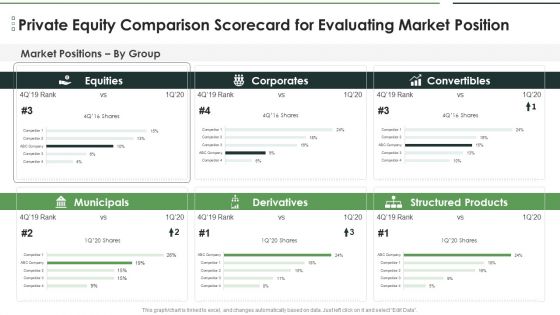
Private Capital Scorecard Private Equity Comparison Scorecard For Evaluating Background PDF
Deliver an awe inspiring pitch with this creative Private Capital Scorecard Private Equity Comparison Scorecard For Evaluating Background PDF bundle. Topics like Equities, Corporates, Convertibles can be discussed with this completely editable template. It is available for immediate download depending on the needs and requirements of the user.
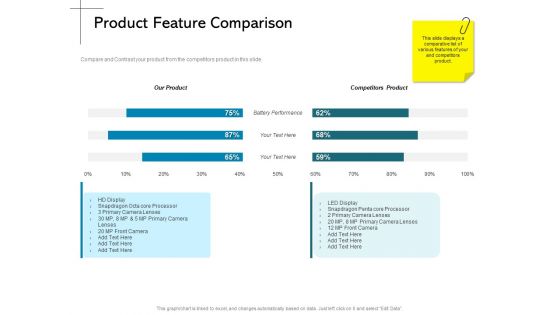
New Product Introduction In The Market Product Feature Comparison Ppt PowerPoint Presentation Summary Background Image PDF
Presenting this set of slides with name new product introduction in the market product feature comparison ppt powerpoint presentation summary background image pdf. The topics discussed in these slides are our product, competitors product, battery performance. This is a completely editable PowerPoint presentation and is available for immediate download. Download now and impress your audience.

Social Media Marketing Budget Social Media Advertising Comparison Vs Other Advertising Ppt Show Diagrams PDF
Presenting this set of slides with name social media marketing budget social media advertising comparison vs other advertising ppt show diagrams pdf. The topics discussed in these slides are very satisfied, somewhat satisfied. This is a completely editable PowerPoint presentation and is available for immediate download. Download now and impress your audience.

Four Cities Sales Comparison Report Ppt PowerPoint Presentation Pictures Mockup PDF
Pitch your topic with ease and precision using this four cities sales comparison report ppt powerpoint presentation pictures mockup pdf. This layout presents information on sales, year 2020. It is also available for immediate download and adjustment. So, changes can be made in the color, design, graphics or any other component to create a unique layout.
Gross And Net Revenue Comparison Shown By Graph Ppt PowerPoint Presentation File Icons PDF
Presenting this set of slides with name gross and net revenue comparison shown by graph ppt powerpoint presentation file icons pdf. The topics discussed in these slides are gross profit, net profit. This is a completely editable PowerPoint presentation and is available for immediate download. Download now and impress your audience.
Target Vs Actual Sales Comparison Dashboard Ppt PowerPoint Presentation File Icons PDF
Presenting this set of slides with name target vs actual sales comparison dashboard ppt powerpoint presentation file icons pdf. The topics discussed in these slides are sales amount, avg commission rate, total commissions, total deductions, commission payable, top sales manager, top sales person. This is a completely editable PowerPoint presentation and is available for immediate download. Download now and impress your audience.

COVID 19 Pandemic Disease Covid 19 Contagiousness In Comparison To Other Pandemics Introduction PDF
Presenting this set of slides with name covid 19 pandemic disease covid 19 contagiousness in comparison to other pandemics introduction pdf. The topics discussed in these slides are norovirus, pneumonia, rotavirus, seasonal flu, cholera, meningitis, swine flu h1n1, covid 19 coronavirus, sars, mers, measles, chickenpox. This is a completely editable PowerPoint presentation and is available for immediate download. Download now and impress your audience.
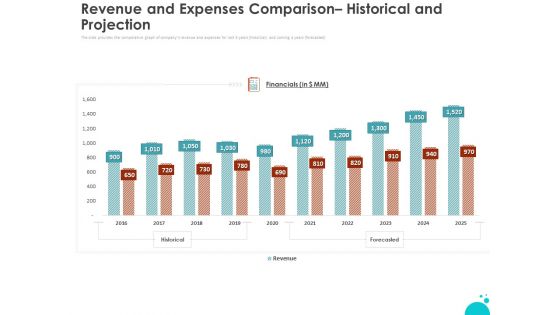
Investment Pitch For Aftermarket Revenue And Expenses Comparison Historical And Projection Portrait
Presenting this set of slides with name investment pitch for aftermarket revenue and expenses comparison historical and projection portrait. The topics discussed in these slides are financials, historical, forecasted, revenue, operating expenses. This is a completely editable PowerPoint presentation and is available for immediate download. Download now and impress your audience.
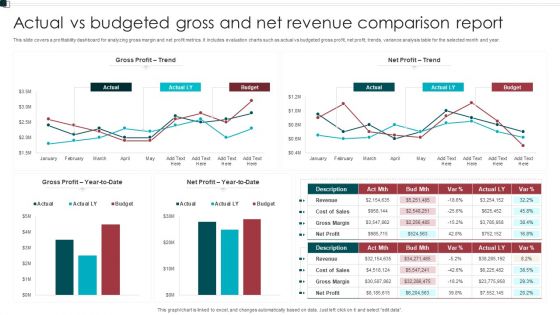
Actual Vs Budgeted Gross And Net Revenue Comparison Report Sample PDF
This slide covers a profitability dashboard for analyzing gross margin and net profit metrics. It includes evaluation charts such as actual vs budgeted gross profit, net profit, trends, variance analysis table for the selected month and year. Pitch your topic with ease and precision using this Actual Vs Budgeted Gross And Net Revenue Comparison Report Sample PDF. This layout presents information on Gross Profit, Net Profit, Budget. It is also available for immediate download and adjustment. So, changes can be made in the color, design, graphics or any other component to create a unique layout.

Building Innovation Capabilities And USP Detection Product Feature Comparison Ppt Infographic Template Template PDF
Compare and Contrast your product from the competitors product in this slide. Deliver an awe-inspiring pitch with this creative building innovation capabilities and usp detection product feature comparison ppt infographic template template pdf bundle. Topics like our product, competitors product, battery performance can be discussed with this completely editable template. It is available for immediate download depending on the needs and requirements of the user.

Disney Plus OTT Platform Company Summary Annual Downloads And Subscription Comparison Summary PDF
The following slide highlights the comparative analysis of annual downloads and annual subscribers for Disney streaming services. It shows the relative change in subscription growth against the annual download. Deliver an awe inspiring pitch with this creative Disney Plus OTT Platform Company Summary Annual Downloads And Subscription Comparison Summary PDF bundle. Topics like Download and Subscribers, Annual Subscribers, Annual Download can be discussed with this completely editable template. It is available for immediate download depending on the needs and requirements of the user.

Infotech Solutions Research And Development Company Summary Competitor Comparison Report Slides PDF
The slide highlights the competitor report for IT company. It compares companies on the basis of business segment, geographical presence, financial revenue and global market share. Deliver an awe inspiring pitch with this creative Infotech Solutions Research And Development Company Summary Competitor Comparison Report Slides PDF bundle. Topics like Revenue Per Employee, Global Market Share, Countries Served can be discussed with this completely editable template. It is available for immediate download depending on the needs and requirements of the user.

Promotion Techniques Used By B2B Firms Comparison Of Budgeted And Actual Expenses Infographics PDF
The slides shows graphical comparison of companys planned and actual promotional expenses. Further, it shows the graph of budget deviation by month. Do you know about Slidesgeeks Promotion Techniques Used By B2B Firms Comparison Of Budgeted And Actual Expenses Infographics PDF These are perfect for delivering any kind od presentation. Using it, create PowerPoint presentations that communicate your ideas and engage audiences. Save time and effort by using our pre designed presentation templates that are perfect for a wide range of topic. Our vast selection of designs covers a range of styles, from creative to business, and are all highly customizable and easy to edit. Download as a PowerPoint template or use them as Google Slides themes.
Revenue And Expenses Comparison Historical And Projection Ppt Icon Files PDF
The slide provides the comparative graph of companys revenue and expenses for last 5 years historical and coming 4 years forecasted.Deliver and pitch your topic in the best possible manner with this revenue and expenses comparison historical and projection ppt icon files pdf. Use them to share invaluable insights on financials, 2016 to 2025, revenue, operating expenses and impress your audience. This template can be altered and modified as per your expectations. So, grab it now.

Bidding Cost Comparison Bidder Company Financials Ppt Infographic Template Information PDF
Following slide provides financial details of company including revenue, operating profit and cash flow from operating activities. Deliver an awe inspiring pitch with this creative Bidding Cost Comparison Bidder Company Financials Ppt Infographic Template Information PDF bundle. Topics like revenue, operating profit, cash flow from operating activities can be discussed with this completely editable template. It is available for immediate download depending on the needs and requirements of the user.
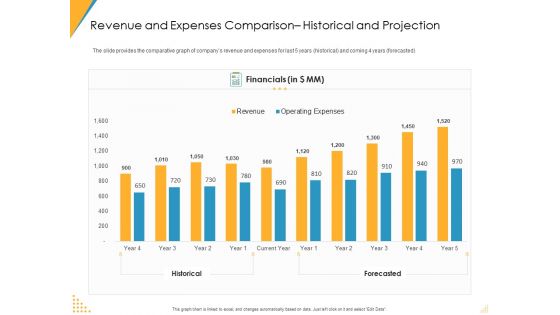
Revenue And Expenses Comparison Historical And Projection Ppt Ideas Slide Download PDF
The slide provides the comparative graph of companys revenue and expenses for last 5 years historical and coming 4 years forecasted. Deliver an awe-inspiring pitch with this creative revenue and expenses comparison historical and projection ppt ideas slide download pdf bundle. Topics like revenue, operating expenses, historical, forecasted can be discussed with this completely editable template. It is available for immediate download depending on the needs and requirements of the user.

Revenue And Expenses Comparison Historical And Projection Ppt Show Format PDF
The slide provides the comparative graph of companys revenue and expenses for last 5 years historical and coming 4 years forecasted. Deliver an awe-inspiring pitch with this creative revenue and expenses comparison historical and projection ppt show format pdf bundle. Topics like historical, forecasted, financials can be discussed with this completely editable template. It is available for immediate download depending on the needs and requirements of the user.

Post Initial Pubic Offering Market Pitch Deck Revenue And Expenses Comparison Historical And Projection Sample PDF
The slide provides the comparative graph of companys revenue and expenses for last 5 years historical and coming 4 years forecasted.Deliver an awe-inspiring pitch with this creative post initial pubic offering market pitch deck revenue and expenses comparison historical and projection sample pdf. bundle. Topics like financials, 2017 to 2026 can be discussed with this completely editable template. It is available for immediate download depending on the needs and requirements of the user.
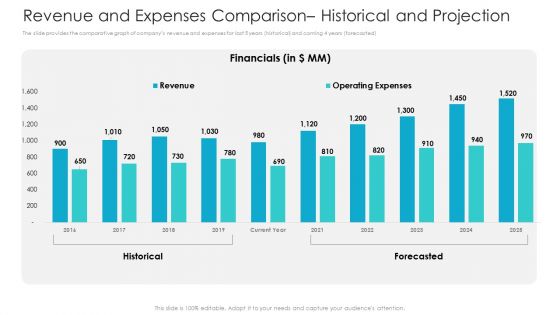
Private Equity Fundraising Pitch Deck Revenue And Expenses Comparison Historical And Projection Clipart PDF
The slide provides the comparative graph of companys revenue and expenses for last 5 years historical and coming 4 years forecasted. Deliver and pitch your topic in the best possible manner with this private equity fundraising pitch deck revenue and expenses comparison historical and projection clipart pdf. Use them to share invaluable insights on financials, revenue, operating expenses, 2016 to 2025 and impress your audience. This template can be altered and modified as per your expectations. So, grab it now.

Revenue And Expenses Comparison Historical And Projection Ppt Summary Example Introduction PDF
The slide provides the comparative graph of companys revenue and expenses for last 5 years historical and coming 4 years forecasted.Deliver and pitch your topic in the best possible manner with this revenue and expenses comparison historical and projection ppt summary example introduction pdf. Use them to share invaluable insights on financials, 2016 to 2025, revenue, operating expenses and impress your audience. This template can be altered and modified as per your expectations. So, grab it now.

Revenue And Expenses Comparison Historical And Projection Ppt Styles Graphics Design PDF
The slide provides the comparative graph of companys revenue and expenses for last 5 years historical and coming 4 years forecasted.Deliver an awe-inspiring pitch with this creative revenue and expenses comparison historical and projection ppt styles graphics design pdf. bundle. Topics like financials, 2016 to 2025, revenue, operating expenses can be discussed with this completely editable template. It is available for immediate download depending on the needs and requirements of the user.
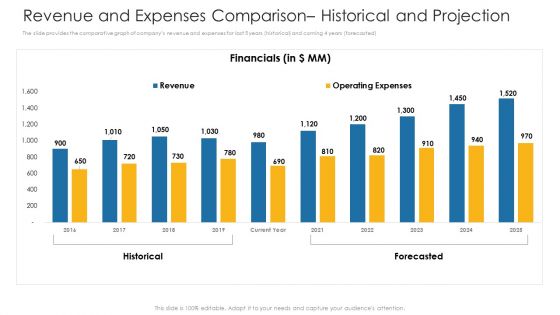
Revenue And Expenses Comparison Historical And Projection Ppt Show Slide Download PDF
The slide provides the comparative graph of companys revenue and expenses for last 5 years historical and coming 4 years forecasted.Deliver and pitch your topic in the best possible manner with this revenue and expenses comparison historical and projection ppt show slide download pdf. Use them to share invaluable insights on financials, 2016 to 2025, revenue, operating expenses and impress your audience. This template can be altered and modified as per your expectations. So, grab it now.
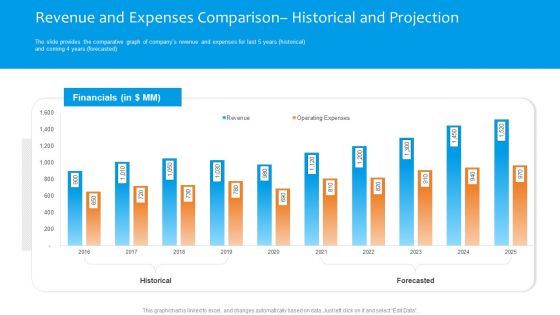
Funding Pitch To Raise Funds From PE Revenue And Expenses Comparison Historical And Projection Summary PDF
The slide provides the comparative graph of companys revenue and expenses for last 5 years historical and coming 4 years forecasted. Deliver an awe inspiring pitch with this creative funding pitch to raise funds from pe revenue and expenses comparison historical and projection summary pdf bundle. Topics like financials, historical, forecasted, revenue, expenses can be discussed with this completely editable template. It is available for immediate download depending on the needs and requirements of the user.
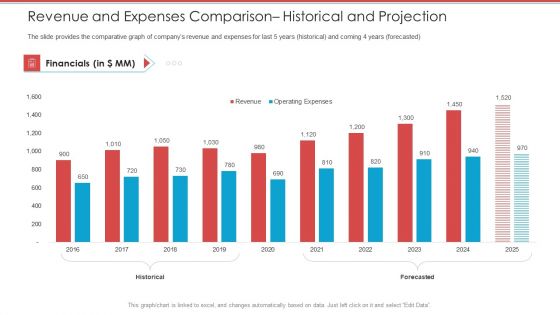
Cash Market Investor Deck Revenue And Expenses Comparison Historical And Projection Ppt Professional Information PDF
The slide provides the comparative graph of companys revenue and expenses for last 5 years historical and coming 4 years forecasted. Deliver and pitch your topic in the best possible manner with this cash market investor deck revenue and expenses comparison historical and projection ppt professional information pdf. Use them to share invaluable insights on financials, revenue, operating expenses, 2016 to 2025 and impress your audience. This template can be altered and modified as per your expectations. So, grab it now.
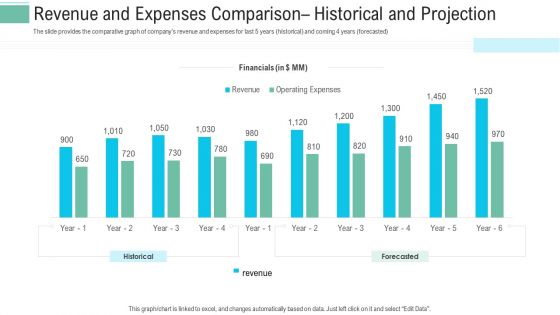
Revenue And Expenses Comparison Historical And Projection Ppt Layouts Grid PDF
The slide provides the comparative graph of companys revenue and expenses for last 5 years historical and coming 4 years forecasted. Deliver and pitch your topic in the best possible manner with this revenue and expenses comparison historical and projection ppt layouts grid pdf. Use them to share invaluable insights on financials, operating expenses, revenue and impress your audience. This template can be altered and modified as per your expectations. So, grab it now.
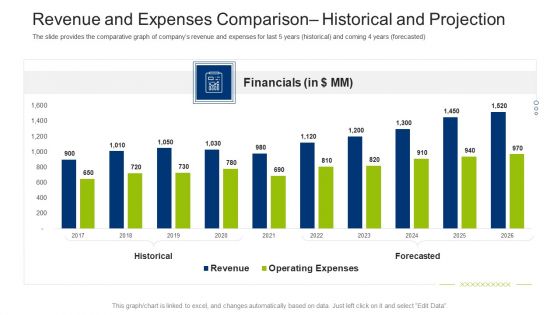
Investment Fundraising Pitch Deck From Stock Market Revenue And Expenses Comparison Historical And Projection Infographics PDF
The slide provides the comparative graph of companys revenue and expenses for last 5 years historical and coming 4 years forecasted. Deliver an awe inspiring pitch with this creative investment fundraising pitch deck from stock market revenue and expenses comparison historical and projection infographics pdf bundle. Topics like financials, historical, forecasted, revenue, expenses can be discussed with this completely editable template. It is available for immediate download depending on the needs and requirements of the user.

Budget Comparison With Actual Costs Table Ppt PowerPoint Presentation Infographic Template Graphics Pictures PDF
This slide illustrates tabular representation of budget costs and actual costs of a company. It includes account title, actual costs, budget and remaining sum.Showcasing this set of slides titled Budget Comparison With Actual Costs Table Ppt PowerPoint Presentation Infographic Template Graphics Pictures PDF. The topics addressed in these templates are Office Equipment, Client Expenses, Server Costs. All the content presented in this PPT design is completely editable. Download it and make adjustments in color, background, font etc. as per your unique business setting.
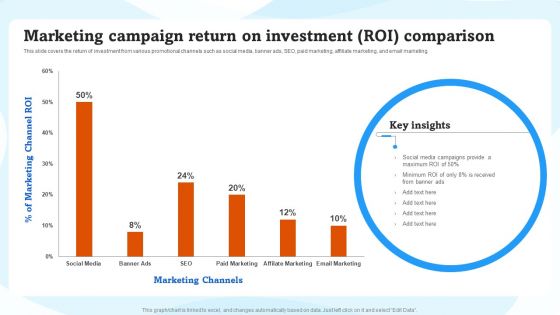
Marketing Campaign Return On Investment ROI Comparison Ppt Inspiration Background PDF
This slide covers the return of investment from various promotional channels such as social media, banner ads, SEO, paid marketing, affiliate marketing, and email marketing. This Marketing Campaign Return On Investment ROI Comparison Ppt Inspiration Background PDF is perfect for any presentation, be it in front of clients or colleagues. It is a versatile and stylish solution for organizing your meetings. The Marketing Campaign Return On Investment ROI Comparison Ppt Inspiration Background PDF features a modern design for your presentation meetings. The adjustable and customizable slides provide unlimited possibilities for acing up your presentation. Slidegeeks has done all the homework before launching the product for you. So, do not wait, grab the presentation templates today

Product Awareness Strategies To Raise Demand Comparison Of Budgeted And Actual Expenses Slides PDF
The slides shows graphical comparison of companys planned and actual promotional expenses. Further, it shows the graph of budget deviation by month. This Product Awareness Strategies To Raise Demand Comparison Of Budgeted And Actual Expenses Slides PDF from Slidegeeks makes it easy to present information on your topic with precision. It provides customization options, so you can make changes to the colors, design, graphics, or any other component to create a unique layout. It is also available for immediate download, so you can begin using it right away. Slidegeeks has done good research to ensure that you have everything you need to make your presentation stand out. Make a name out there for a brilliant performance.
Corporate Budget Comparison Of FY21 And FY22 Ppt PowerPoint Presentation Icon Graphic Images PDF
This slide illustrates graphical representation of budget of two years. It includes administration budget, production budget, research budget, client expenses etc.Showcasing this set of slides titled Corporate Budget Comparison Of FY21 And FY22 Ppt PowerPoint Presentation Icon Graphic Images PDF. The topics addressed in these templates are Support Services, Administration, Maintenance Cost. All the content presented in this PPT design is completely editable. Download it and make adjustments in color, background, font etc. as per your unique business setting.
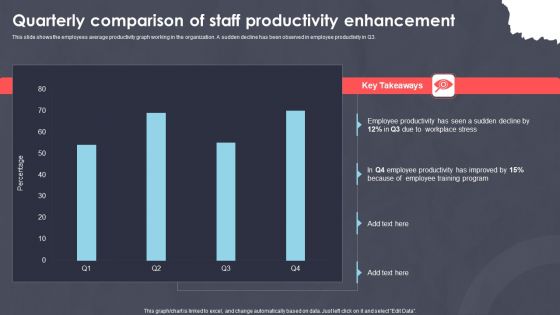
Quarterly Comparison Of Staff Productivity Enhancement Ppt PowerPoint Presentation Ideas Aids PDF
This slide shows the employees average productivity graph working in the organization. A sudden decline has been observed in employee productivity in Q3. Showcasing this set of slides titled Quarterly Comparison Of Staff Productivity Enhancement Ppt PowerPoint Presentation Ideas Aids PDF. The topics addressed in these templates are Employee Productivity, Sudden Decline, Workplace Stress. All the content presented in this PPT design is completely editable. Download it and make adjustments in color, background, font etc. as per your unique business setting.
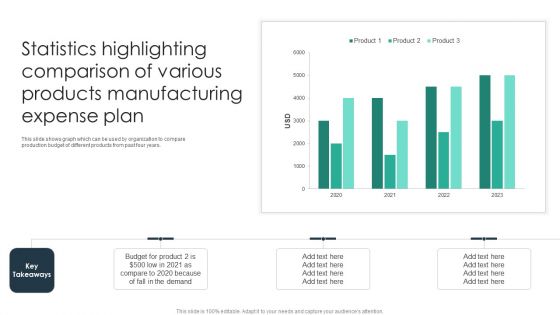
Statistics Highlighting Comparison Of Various Products Manufacturing Expense Plan Formats PDF
This slide shows graph which can be used by organization to compare production budget of different products from past four years. Pitch your topic with ease and precision using this Statistics Highlighting Comparison Of Various Products Manufacturing Expense Plan Formats PDF. This layout presents information on Budget For Product, Demand, Organization. It is also available for immediate download and adjustment. So, changes can be made in the color, design, graphics or any other component to create a unique layout.

Budget Vs Actual Cost Comparison Dashboard Ppt PowerPoint Presentation Professional Format Ideas PDF
This slide illustrates fact and figures relating to various project budgets of a company. It includes monthly budget graph, project budget meter and budget vs. Actual costs chart.Pitch your topic with ease and precision using this Budget Vs Actual Cost Comparison Dashboard Ppt PowerPoint Presentation Professional Format Ideas PDF. This layout presents information on Milestones, Budget Graph, Manager. It is also available for immediate download and adjustment. So, changes can be made in the color, design, graphics or any other component to create a unique layout.
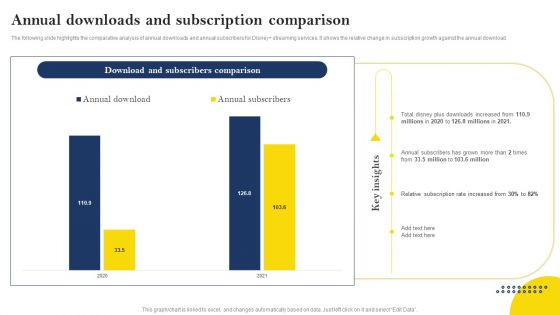
Over The Top Platform Company Profile Annual Downloads And Subscription Comparison Infographics PDF
The following slide highlights the comparative analysis of annual downloads and annual subscribers for Disney streaming services. It shows the relative change in subscription growth against the annual download. Find a pre designed and impeccable Over The Top Platform Company Profile Annual Downloads And Subscription Comparison Infographics PDF. The templates can ace your presentation without additional effort. You can download these easy to edit presentation templates to make your presentation stand out from others. So, what are you waiting for Download the template from Slidegeeks today and give a unique touch to your presentation.
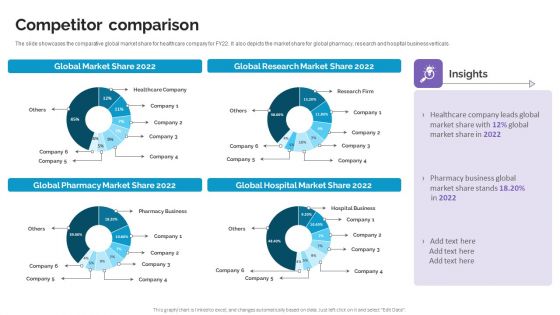
Competitor Comparison Life Science And Healthcare Solutions Company Profile Guidelines PDF
The slide showcases the comparative global market share for healthcare company for FY22. It also depicts the market share for global pharmacy, research and hospital business verticals. The best PPT templates are a great way to save time, energy, and resources. Slidegeeks have 100 percent editable powerpoint slides making them incredibly versatile. With these quality presentation templates, you can create a captivating and memorable presentation by combining visually appealing slides and effectively communicating your message. Download Competitor Comparison Life Science And Healthcare Solutions Company Profile Guidelines PDF from Slidegeeks and deliver a wonderful presentation.

Stock Ratio Comparison Of Four Brands Ppt Model Layout Ideas PDF
This slide shows a comparative analysis of Stock ratio of four brands in last five year. Continuous increase has seen in Stock ratio of brand D. Showcasing this set of slides titled Stock Ratio Comparison Of Four Brands Ppt Model Layout Ideas PDF. The topics addressed in these templates are 2018 To 2022, Stock Ratio, Stock Management System. All the content presented in this PPT design is completely editable. Download it and make adjustments in color, background, font etc. as per your unique business setting.

Five Year Comparison Of Registered Mobile Money Customers Spread By Region Introduction PDF
This slide shows the information statistics about region wise registered mobile money customers spread during last 5 years. It indicates that customers spread in south asia recorded highest that is 28.4persent over the last five years.Deliver and pitch your topic in the best possible manner with this Five Year Comparison Of Registered Mobile Money Customers Spread By Region Introduction PDF. Use them to share invaluable insights on Region Recorded, Mobile Money, Customers Spread and impress your audience. This template can be altered and modified as per your expectations. So, grab it now.
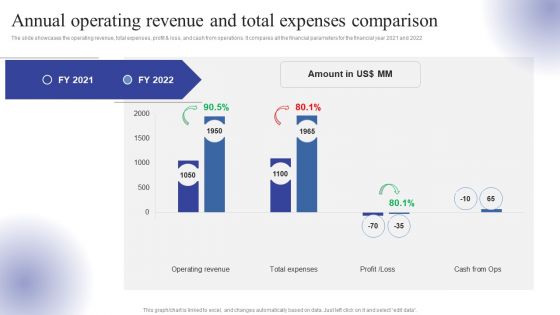
Annual Operating Revenue And Total Expenses Comparison Ppt Infographic Template Rules PDF
The slide showcases the operating revenue, total expenses, profit and loss, and cash from operations. It compares all the financial parameters for the financial year 2021 and 2022. Want to ace your presentation in front of a live audience Our Annual Operating Revenue And Total Expenses Comparison Ppt Infographic Template Rules PDF can help you do that by engaging all the users towards you.. Slidegeeks experts have put their efforts and expertise into creating these impeccable powerpoint presentations so that you can communicate your ideas clearly. Moreover, all the templates are customizable, and easy-to-edit and downloadable. Use these for both personal and commercial use.
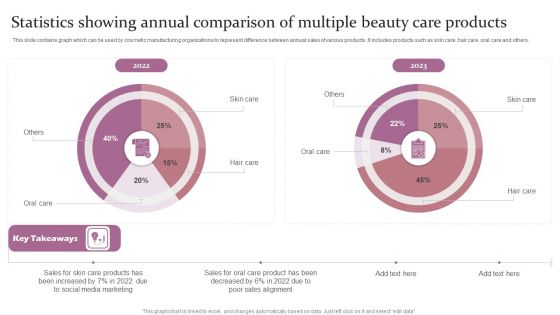
Statistics Showing Annual Comparison Of Multiple Beauty Care Products Ppt Infographics Objects PDF
This slide contains graph which can be used by cosmetic manufacturing organizations to represent difference between annual sales of various products. It includes products such as skin care, hair care, oral care and others. Showcasing this set of slides titled Statistics Showing Annual Comparison Of Multiple Beauty Care Products Ppt Infographics Objects PDF. The topics addressed in these templates are Skin Care, Hair Care, 2022 To 2023. All the content presented in this PPT design is completely editable. Download it and make adjustments in color, background, font etc. as per your unique business setting.
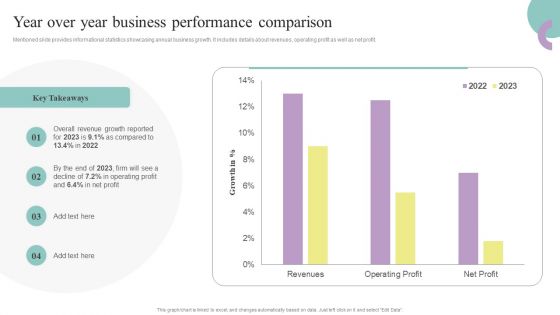
Comprehensive Guide To Enhance Year Over Year Business Performance Comparison Professional PDF
Mentioned slide provides informational statistics showcasing annual business growth. It includes details about revenues, operating profit as well as net profit. From laying roadmaps to briefing everything in detail, our templates are perfect for you. You can set the stage with your presentation slides. All you have to do is download these easy-to-edit and customizable templates. Comprehensive Guide To Enhance Year Over Year Business Performance Comparison Professional PDF will help you deliver an outstanding performance that everyone would remember and praise you for. Do download this presentation today.
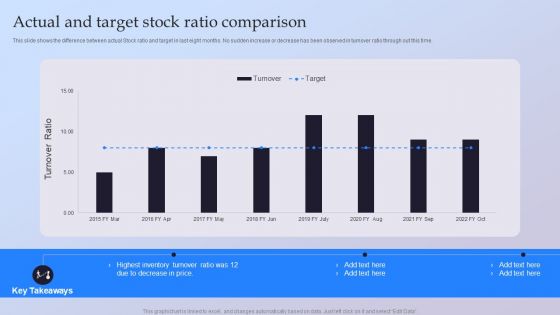
Actual And Target Stock Ratio Comparison Ppt Visual Aids Ideas PDF
This slide shows the difference between actual Stock ratio and target in last eight months. No sudden increase or decrease has been observed in turnover ratio through out this time. Showcasing this set of slides titled Actual And Target Stock Ratio Comparison Ppt Visual Aids Ideas PDF. The topics addressed in these templates are Turnover Ratio, Price, 2015 To 2022. All the content presented in this PPT design is completely editable. Download it and make adjustments in color, background, font etc. as per your unique business setting.

 Home
Home