Comparison Chart

Standard And Premium Product Comparison Chart Ppt PowerPoint Presentation File Clipart Images PDF
Showcasing this set of slides titled standard and premium product comparison chart ppt powerpoint presentation file clipart images pdf. The topics addressed in these templates are standard item, premium item, product. All the content presented in this PPT design is completely editable. Download it and make ajustments in color, background, font etc. as per your unique business setting.
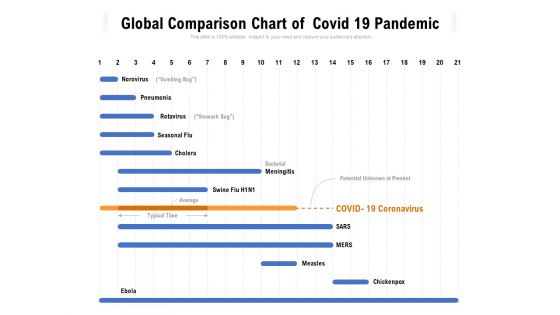
Global Comparison Chart Of Covid 19 Pandemic Ppt PowerPoint Presentation Ideas Graphics Pictures PDF
Showcasing this set of slides titled global comparison chart of covid 19 pandemic ppt powerpoint presentation ideas graphics pictures pdf. The topics addressed in these templates are norovirus, pneumonia, rotavirus, seasonal flu, meningitis. All the content presented in this PPT design is completely editable. Download it and make adjustments in color, background, font etc. as per your unique business setting.
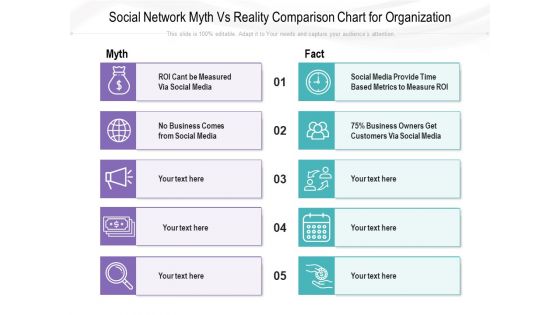
Social Network Myth Vs Reality Comparison Chart For Organization Ppt PowerPoint Presentation File Clipart PDF
Presenting this set of slides with name social network myth vs reality comparison chart for organization ppt powerpoint presentation file clipart pdf. This is a two stage process. The stages in this process are myth, fact. This is a completely editable PowerPoint presentation and is available for immediate download. Download now and impress your audience.
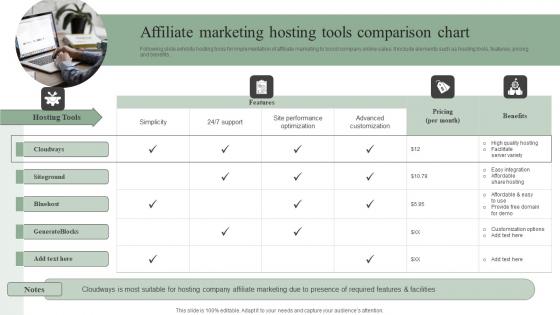
Affiliate Marketing Hosting Tools Comparison Chart Efficient Marketing Tactics Sample Pdf
Following slide exhibits hosting tools for implementation of affiliate marketing to boost company online sales. It include elements such as hosting tools, features, pricing and benefits. Boost your pitch with our creative Affiliate Marketing Hosting Tools Comparison Chart Efficient Marketing Tactics Sample Pdf. Deliver an awe-inspiring pitch that will mesmerize everyone. Using these presentation templates you will surely catch everyones attention. You can browse the ppts collection on our website. We have researchers who are experts at creating the right content for the templates. So you do not have to invest time in any additional work. Just grab the template now and use them.

Various Billing Software Comparison Chart Ppt PowerPoint Presentation File Diagrams PDF
Following slide represents comparative analysis of various software for company billing system. It includes various parameters such as prices, installation, time tracking, individual invoices, expense tracking etc. Do you have an important presentation coming up Are you looking for something that will make your presentation stand out from the rest Look no further than Various Billing Software Comparison Chart Ppt PowerPoint Presentation File Diagrams PDF With our professional designs, you can trust that your presentation will pop and make delivering it a smooth process. And with Slidegeeks, you can trust that your presentation will be unique and memorable. So why wait Grab Various Billing Software Comparison Chart Ppt PowerPoint Presentation File Diagrams PDF today and make your presentation stand out from the rest.

Banking Features Comparison Chart With 24 Hours Customer Service Ppt PowerPoint Presentation Summary Smartart PDF
Presenting banking features comparison chart with 24 hours customer service ppt powerpoint presentation summary smartart pdf to dispense important information. This template comprises one stages. It also presents valuable insights into the topics including instant issue debit card, monthly service fee, export data option, customer service, free online banking . This is a completely customizable PowerPoint theme that can be put to use immediately. So, download it and address the topic impactfully.
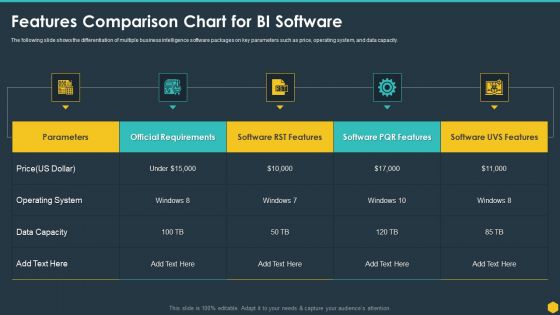
Features Comparison Chart For BI Software BI Transformation Toolset Graphics PDF
The following slide shows the differentiation of multiple business intelligence software packages on key parameters such as price, operating system, and data capacity. Deliver and pitch your topic in the best possible manner with this Features Comparison Chart For BI Software BI Transformation Toolset Graphics PDF. Use them to share invaluable insights on Operating System, Data Capacity, Price, Official Requirements and impress your audience. This template can be altered and modified as per your expectations. So, grab it now.
Two Mobile Phones Features And Price Comparison Chart Ppt PowerPoint Presentation Icon Show PDF
Persuade your audience using this two mobile phones features and price comparison chart ppt powerpoint presentation icon show pdf. This PPT design covers one stages, thus making it a great tool to use. It also caters to a variety of topics including price, resolution, screen size, storage, battery. Download this PPT design now to present a convincing pitch that not only emphasizes the topic but also showcases your presentation skills.
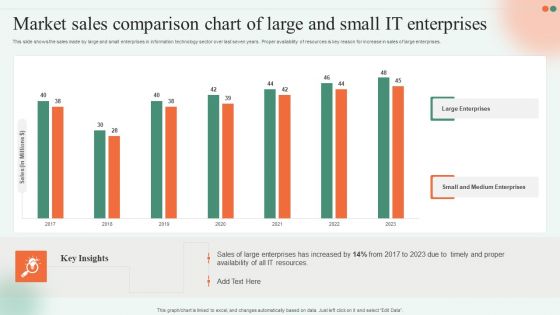
Market Sales Comparison Chart Of Large And Small IT Enterprises Ppt Infographic Template Background Image PDF
This slide shows the sales made by large and small enterprises in information technology sector over last seven years . Proper availability of resources is key reason for increase in sales of large enterprises. Showcasing this set of slides titled Market Sales Comparison Chart Of Large And Small IT Enterprises Ppt Infographic Template Background Image PDF. The topics addressed in these templates are Large Enterprises, Small And Medium, IT Resources. All the content presented in this PPT design is completely editable. Download it and make adjustments in color, background, font etc. as per your unique business setting.

Advisory Company Pitch Deck Competitive Analysis Comparison Chart Ppt Layouts Brochure PDF
This slide provides the glimpse about the problem faced by the users since email is used for personal use which leads to problems such as no collaboration, poor productivity, and regular errors. Deliver an awe inspiring pitch with this creative advisory company pitch deck competitive analysis comparison chart ppt layouts brochure pdf bundle. Topics like e commerce, devices, email, pricing, average can be discussed with this completely editable template. It is available for immediate download depending on the needs and requirements of the user.

Multiple Social Media Platform Tools Comparison Chart Ppt Show Layouts PDF
The following slide depict the various tools to manage customer relationships and online engagement. It includes key elements such as budget, basis of pricing number of keywords, campaigns, demographics, competitive, sentiments etc. Showcasing this set of slides titled Multiple Social Media Platform Tools Comparison Chart Ppt Show Layouts PDF. The topics addressed in these templates are Topic Research, Translation, Sentiment. All the content presented in this PPT design is completely editable. Download it and make adjustments in color, background, font etc. as per your unique business setting.

Competitor Analysis Comparison Chart Ppt PowerPoint Presentation Complete Deck With Slides
Share a great deal of information on the topic by deploying this Competitor Analysis Comparison Chart Ppt PowerPoint Presentation Complete Deck With Slides. Support your ideas and thought process with this prefabricated set. It includes a set of twelve slides, all fully modifiable and editable. Each slide can be restructured and induced with the information and content of your choice. You can add or remove large content boxes as well, to make this PPT slideshow more personalized. Its high-quality graphics and visuals help in presenting a well-coordinated pitch. This PPT template is also a resourceful tool to take visual cues from and implement the best ideas to help your business grow and expand. The main attraction of this well-formulated deck is that everything is editable, giving you the freedom to adjust it to your liking and choice. Changes can be made in the background and theme as well to deliver an outstanding pitch. Therefore, click on the download button now to gain full access to this multifunctional set.

Business Framework Model Product Comparison Business Chart Marketing Diagram
Doll Up Your Thoughts With Our Business Framework Model Product Comparison Business Chart Marketing Diagram Powerpoint Templates. They Will Make A Pretty Picture.
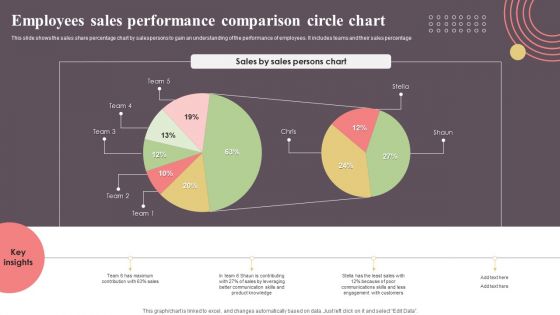
Employees Sales Performance Comparison Circle Chart Topics PDF
This slide shows the sales share percentage chart by salespersons to gain an understanding of the performance of employees. It includes teams and their sales percentage. Pitch your topic with ease and precision using this Employees Sales Performance Comparison Circle Chart Topics PDF. This layout presents information on Employees Sales Performance, Comparison Circle Chart. It is also available for immediate download and adjustment. So, changes can be made in the color, design, graphics or any other component to create a unique layout.
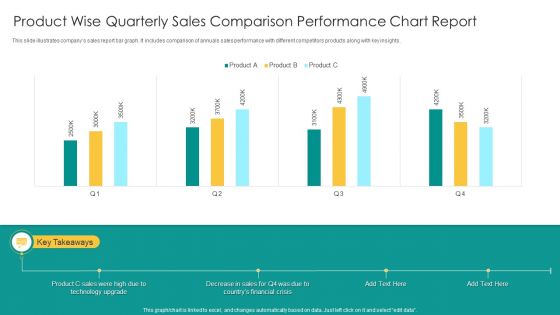
Product Wise Quarterly Sales Comparison Performance Chart Report Infographics PDF
This slide illustrates companys sales report bar graph. It includes comparison of annuals sales performance with different competitors products along with key insights. Showcasing this set of slides titled Product Wise Quarterly Sales Comparison Performance Chart Report Infographics PDF. The topics addressed in these templates are Product C Sales, Technology Upgrade, Financial Crisis. All the content presented in this PPT design is completely editable. Download it and make adjustments in color, background, font etc. as per your unique business setting.

Store Revenue Comparison Column Chart With Key Insights Themes PDF
This slide shows revenue generated by electronic and furniture products in various stores to examine differences in purchases at different store locations. It includes parts such as revenue generated and cities. Showcasing this set of slides titled Store Revenue Comparison Column Chart With Key Insights Themes PDF. The topics addressed in these templates are Revenue Generated, Furniture Sales, Increased Trend. All the content presented in this PPT design is completely editable. Download it and make adjustments in color, background, font etc. as per your unique business setting.
Comparison Map Chart With Social Media Icons Powerpoint Slides
This PowerPoint template has been designed with map diagram and social media icons. Each and every property of any region - color, size, shading etc can be modified to help you build an effective PowerPoint presentation. You may use this map slide to display sales territories, business and new office locations, travel planning etc in your presentations.

Comparison Seesaw Charts Currency PowerPoint Slides And Ppt Diagram Templates
Comparison Seesaw Charts Currency PowerPoint Slides And PPT Diagram Templates-These high quality powerpoint pre-designed slides and powerpoint templates have been carefully created by our professional team to help you impress your audience. All slides have been created and are 100% editable in powerpoint. Each and every property of any graphic - color, size, orientation, shading, outline etc. can be modified to help you build an effective powerpoint presentation. Any text can be entered at any point in the powerpoint template or slide. Simply DOWNLOAD, TYPE and PRESENT!
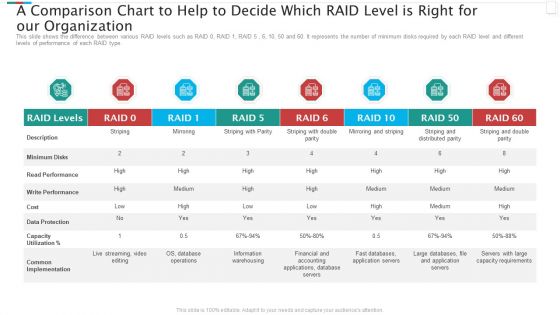
A Comparison Chart To Help To Decide Which RAID Level Is Right For Our Organization Mockup PDF
This slide shows the difference between various RAID levels such as RAID 0, RAID 1, RAID 5 , 6, 10, 50 and 60. It represents the number of minimum disks required by each RAID level and different levels of performance of each RAID type. Deliver an awe inspiring pitch with this creative a comparison chart to help to decide which raid level is right for our organization mockup pdf bundle. Topics like read performance, common implementation, data protection, financial and accounting can be discussed with this completely editable template. It is available for immediate download depending on the needs and requirements of the user.
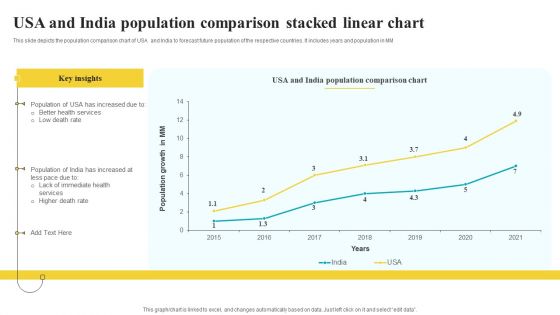
Usa And India Population Comparison Stacked Linear Chart Guidelines PDF
This slide depicts the population comparison chart of USA and India to forecast future population of the respective countries. It includes years and population in MM Pitch your topic with ease and precision using this Usa And India Population Comparison Stacked Linear Chart Guidelines PDF. This layout presents information on Key Insights, Population Growth, Comparison Chart. It is also available for immediate download and adjustment. So, changes can be made in the color, design, graphics or any other component to create a unique layout.
Chart Comparison Icon For Financial Ratios Template PDF
Persuade your audience using this chart comparison icon for financial ratios template pdf. This PPT design covers three stages, thus making it a great tool to use. It also caters to a variety of topics including chart comparison icon for financial ratios. Download this PPT design now to present a convincing pitch that not only emphasizes the topic but also showcases your presentation skills.

Dividend Payout Financial Ratios Chart Comparison Themes PDF
This slide showcases dividend payout ratio graph that can help organization to determine the percentage of the companys earnings that is paid out to shareholders by way of dividend. It showcases comparison for a period of 8 years Showcasing this set of slides titled dividend payout financial ratios chart comparison themes pdf. The topics addressed in these templates are dividend payout financial ratios chart comparison. All the content presented in this PPT design is completely editable. Download it and make adjustments in color, background, font etc. as per your unique business setting.
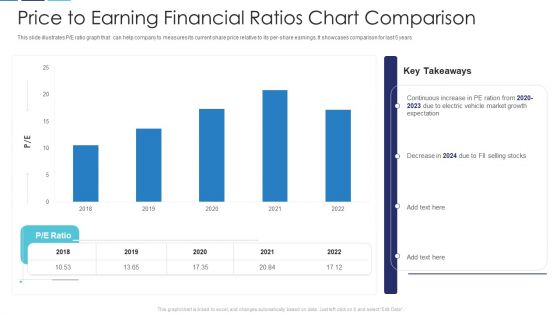
Price To Earning Financial Ratios Chart Comparison Slides PDF
This slide illustrates P or E ratio graph that can help company to measures its current share price relative to its per-share earnings. It showcases comparison for last 5 years Showcasing this set of slides titled price to earning financial ratios chart comparison slides pdf. The topics addressed in these templates are price to earning financial ratios chart comparison. All the content presented in this PPT design is completely editable. Download it and make adjustments in color, background, font etc. as per your unique business setting.
Company Turnover Financial Ratios Chart Comparison Icons PDF
This slide illustrates graph for turnover ratios that are accounts receivable, inventory turnover, accounts payable turnover, fixed asset turnover and total assets turnover ratio. It showcases comparison of three companies. Pitch your topic with ease and precision using this company turnover financial ratios chart comparison icons pdf. This layout presents information on company turnover financial ratios chart comparison. It is also available for immediate download and adjustment. So, changes can be made in the color, design, graphics or any other component to create a unique layout.
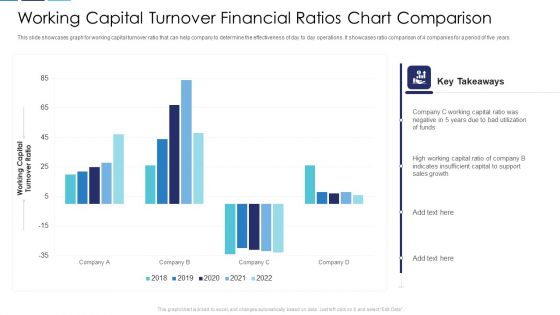
Working Capital Turnover Financial Ratios Chart Comparison Clipart PDF
This slide showcases graph for working capital turnover ratio that can help company to determine the effectiveness of day to day operations. It showcases ratio comparison of 4 companies for a period of five years Pitch your topic with ease and precision using this working capital turnover financial ratios chart comparison clipart pdf. This layout presents information on working capital turnover financial ratios chart comparison. It is also available for immediate download and adjustment. So, changes can be made in the color, design, graphics or any other component to create a unique layout.
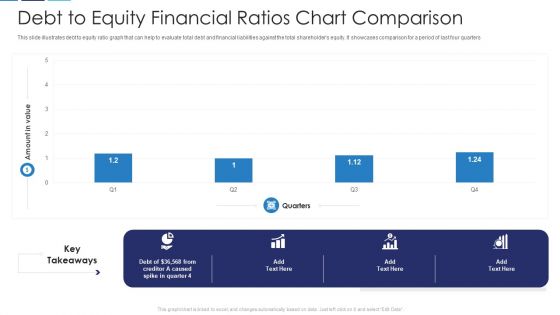
Debt To Equity Financial Ratios Chart Comparison Download PDF
This slide illustrates debt to equity ratio graph that can help to evaluate total debt and financial liabilities against the total shareholders equity. It showcases comparison for a period of last four quarters Pitch your topic with ease and precision using this debt to equity financial ratios chart comparison download pdf. This layout presents information on debt to equity financial ratios chart comparison. It is also available for immediate download and adjustment. So, changes can be made in the color, design, graphics or any other component to create a unique layout.

Product Price Catalogue Chart Comparison Of 2 Companies Elements PDF
This slide showcases price catalogue chart that can help customer to identify the cost of product charged by different organizations in marketplace. Its key components are product and cost per unit Showcasing this set of slides titled product price catalogue chart comparison of 2 companies elements pdf. The topics addressed in these templates are product, cost per unit, company. All the content presented in this PPT design is completely editable. Download it and make adjustments in color, background, font etc. as per your unique business setting.
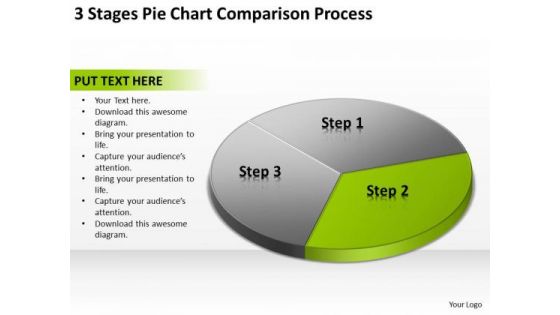
3 Stages Pie Chart Comparison Process Business Plans PowerPoint Templates
We present our 3 stages pie chart comparison process business plans PowerPoint templates.Use our Marketing PowerPoint Templates because you should Whip up a frenzy with our PowerPoint Templates and Slides. They will fuel the excitement of your team. Present our Finance PowerPoint Templates because Our PowerPoint Templates and Slides will let Your superior ideas hit the target always and everytime. Present our Arrows PowerPoint Templates because Our PowerPoint Templates and Slides are Clear and concise. Use them and dispel any doubts your team may have. Use our Circle Charts PowerPoint Templates because You can Zap them with our PowerPoint Templates and Slides. See them reel under the impact. Use our Business PowerPoint Templates because You can Double your output with our PowerPoint Templates and Slides. They make beating deadlines a piece of cake.Use these PowerPoint slides for presentations relating to Pie, chart, process, menu, website, network, statistics, item, junction, corporate, business, plan, presentation, template, circle, brochure, data, report, marketing, different, management, graph, modern, connection, sphere, options, strategy, catalog, world, spherical, segments, text, company, banner, information, navigation, structure, parts, globe, arrows, communication. The prominent colors used in the PowerPoint template are Green, Black, Gray.

Percentage Charts For Statistical Comparison Powerpoint Slides
This PowerPoint template has been chart of percentage values. You may download this diagram for statistical comparison and analysis. Add this PPT slide to your presentation and impress your superiors.

Business Team With Pie Chart For Comparison Powerpoint Template
This business slide contains graphics of pie chart with team members. This PowerPoint template is suitable to present comparison of teams performances. Use this business diagram to present your work in a more smart and precise manner.

Sales Rep Scorecard Sales Scorecard Annual Comparison Bubble Chart For Three Teams Designs PDF
Deliver and pitch your topic in the best possible manner with this sales rep scorecard sales scorecard annual comparison bubble chart for three teams designs pdf. Use them to share invaluable insights on sales scorecard annual comparison bubble chart for three teams and impress your audience. This template can be altered and modified as per your expectations. So, grab it now.
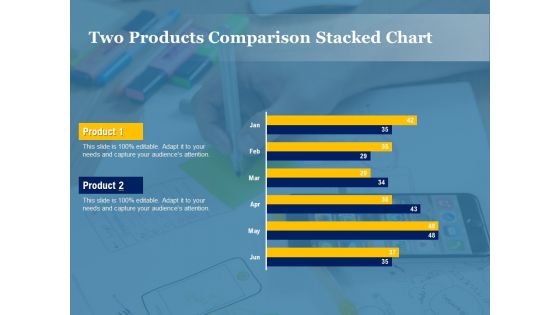
Two Products Comparison Stacked Chart Ppt PowerPoint Presentation Gallery Structure PDF
Pitch your topic with ease and precision using this two products comparison stacked chart ppt powerpoint presentation gallery structure pdf. This layout presents information on two products comparison stacked chart. It is also available for immediate download and adjustment. So, changes can be made in the color, design, graphics or any other component to create a unique layout.
Percentage Value Comparison Pie Chart Icon Ppt PowerPoint Presentation Model Clipart Images
This is a percentage value comparison pie chart icon ppt powerpoint presentation model clipart images. This is a three stage process. The stages in this process are percentage icon, dividend icon, portion icon.
Vector Showing Statistics Comparison Bar Chart Ppt Visual Aids Styles PDF
Persuade your audience using this Vector Showing Statistics Comparison Bar Chart Ppt Visual Aids Styles PDF. This PPT design covers three stages, thus making it a great tool to use. It also caters to a variety of topics including vector showing statistics comparison bar chart. Download this PPT design now to present a convincing pitch that not only emphasizes the topic but also showcases your presentation skills.
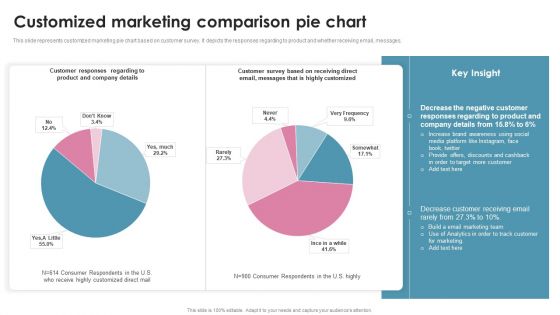
Customized Marketing Comparison Pie Chart Ppt PowerPoint Presentation Gallery Smartart PDF
This slide represents customized marketing pie chart based on customer survey. It depicts the responses regarding to product and whether receiving email, messages. Showcasing this set of slides titled Customized Marketing Comparison Pie Chart Ppt PowerPoint Presentation Gallery Smartart PDF. The topics addressed in these templates are Customer Responses, Provide Offers, Target More Customer. All the content presented in this PPT design is completely editable. Download it and make adjustments in color, background, font etc. as per your unique business setting.

Concentric Sphere Chart Slide For Comparison Ppt Portfolio Inspiration PDF
Presenting concentric sphere chart slide for comparison ppt portfolio inspiration pdf to dispense important information. This template comprises four stages. It also presents valuable insights into the topics including concentric sphere chart slide for comparison. This is a completely customizable PowerPoint theme that can be put to use immediately. So, download it and address the topic impactfully.

Percentage Column Chart For Performance Comparison Ppt PowerPoint Presentation Good
This is a percentage column chart for performance comparison ppt powerpoint presentation good. This is a four stage process. The stages in this process are business, marketing, technology, presentation, management.
Pie Chart For Data Comparison Ppt PowerPoint Presentation Portfolio Layouts
This is a pie chart for data comparison ppt powerpoint presentation portfolio layouts. This is a four stage process. The stages in this process are sectioned circle, segmented circle, partitioned circle.
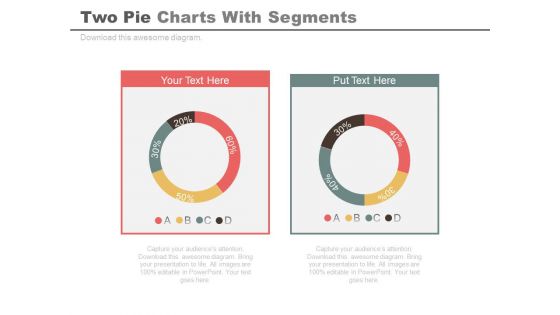
Two Pie Charts For Comparison And Analysis Powerpoint Slides
Develop competitive advantage with our above template of two pie charts. This PowerPoint diagram provides an effective way of displaying business information. You can edit text, color, shade and style as per you need.
Price Catalogue Chart Icon Of Product Comparison Slides PDF
Presenting price catalogue chart icon of product comparison slides pdf to dispense important information. This template comprises three stages. It also presents valuable insights into the topics including price catalogue chart icon of product comparison. This is a completely customizable PowerPoint theme that can be put to use immediately. So, download it and address the topic impactfully.
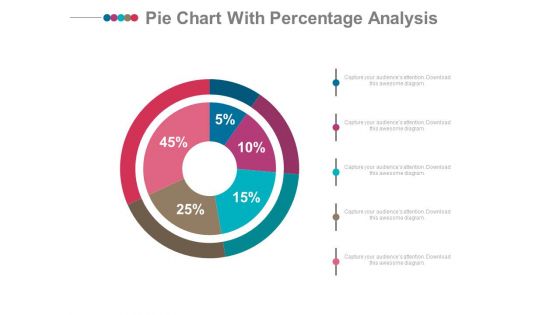
Pie Chart With Financial Data Comparison Powerpoint Slides
Emphatically define your message with our above template which contains graphics of pie chart. This PowerPoint template may be used to display financial data comparison. Grab the attention of your listeners with this slide.
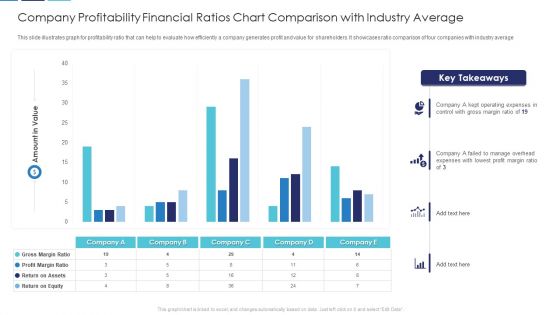
Company Profitability Financial Ratios Chart Comparison With Industry Average Download PDF
This slide illustrates graph for profitability ratio that can help to evaluate how efficiently a company generates profit and value for shareholders. It showcases ratio comparison of four companies with industry average Showcasing this set of slides titled company profitability financial ratios chart comparison with industry average download pdf. The topics addressed in these templates are company profitability financial ratios chart comparison with industry average. All the content presented in this PPT design is completely editable. Download it and make adjustments in color, background, font etc. as per your unique business setting.

Data Comparison And Analysis Chart Ppt Powerpoint Presentation File Background Images
This is a data comparison and analysis chart ppt powerpoint presentation file background images. This is a four stage process. The stages in this process are data presentation, content presentation, information presentation.

Customized Vs Mass Marketing Comparison With Line Chart Ppt PowerPoint Presentation File Ideas PDF
This slide signifies the customized vs mass marketing with line chart. It includes comparison based on strategies that are being implemented for growth in customer engagement. Pitch your topic with ease and precision using this Customized Vs Mass Marketing Comparison With Line Chart Ppt PowerPoint Presentation File Ideas PDF. This layout presents information on Customized Marketing, Mass Marketing, 2016 To 2022. It is also available for immediate download and adjustment. So, changes can be made in the color, design, graphics or any other component to create a unique layout.
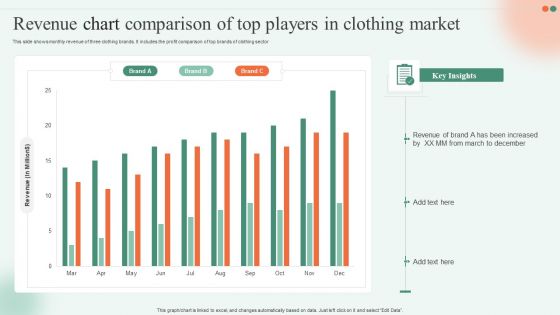
Revenue Chart Comparison Of Top Players In Clothing Market Ppt Infographics Skills PDF
This slide shows monthly revenue of three clothing brands. It includes the profit comparison of top brands of clothing sector Showcasing this set of slides titled Revenue Chart Comparison Of Top Players In Clothing Market Ppt Infographics Skills PDF. The topics addressed in these templates are Revenue, Brand, Key Insights. All the content presented in this PPT design is completely editable. Download it and make adjustments in color, background, font etc. as per your unique business setting.
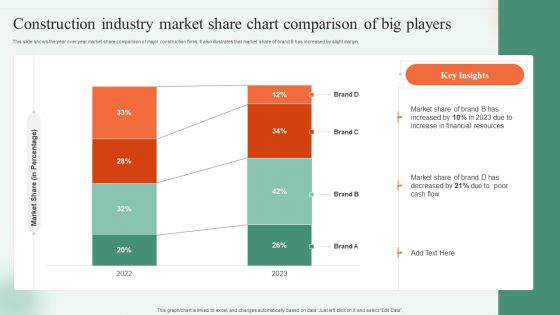
Construction Industry Market Share Chart Comparison Of Big Players Ppt Portfolio Shapes PDF
This slide shows the year over year market share comparison of major construction firms. It also illustrates that market share of brand B has increased by slight margin. Pitch your topic with ease and precision using this Construction Industry Market Share Chart Comparison Of Big Players Ppt Portfolio Shapes PDF. This layout presents information on Market Share Percentage, 2022 To 2023, Market Share. It is also available for immediate download and adjustment. So, changes can be made in the color, design, graphics or any other component to create a unique layout.

Pie Chart Data Comparisons 5 Stages Business Plan PowerPoint Templates
We present our pie chart data comparisons 5 stages business plan PowerPoint templates.Download and present our Marketing PowerPoint Templates because Our PowerPoint Templates and Slides offer you the widest possible range of options. Use our Finance PowerPoint Templates because You should Ascend the ladder of success with ease. Our PowerPoint Templates and Slides will provide strong and sturdy steps. Download and present our Business PowerPoint Templates because You should Throw the gauntlet with our PowerPoint Templates and Slides. They are created to take up any challenge. Present our Sales PowerPoint Templates because Our PowerPoint Templates and Slides help you pinpoint your timelines. Highlight the reasons for your deadlines with their use. Present our Success PowerPoint Templates because It will Raise the bar of your Thoughts. They are programmed to take you to the next level.Use these PowerPoint slides for presentations relating to Analysis, Analyzing, Brands, Business, Chart, Colorful, Commerce, Compare, Comparison, Data, Economical, Finance, Financial, Grow, Growth, Market, Market Share, Marketing, Measure, Pen, Pie, Pie Chart, Presentation, Profit, Revenue, Sales, Sales Chat, Sales Increase, Share, Statistical, Success, Successful. The prominent colors used in the PowerPoint template are Green, Gray, White.
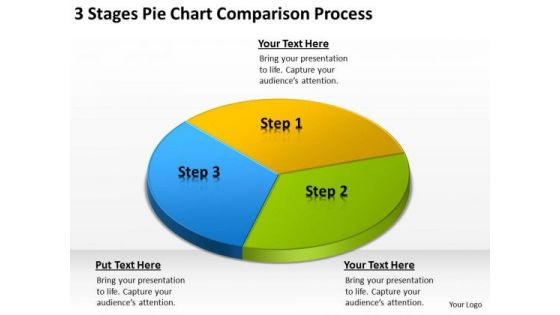
3 Stages Pie Chart Comparison Process Examples Of Business Plan PowerPoint Templates
We present our 3 stages pie chart comparison process examples of business plan PowerPoint templates.Download and present our Circle Charts PowerPoint Templates because It is Aesthetically crafted by artistic young minds. Our PowerPoint Templates and Slides are designed to display your dexterity. Present our Flow Charts PowerPoint Templates because Our PowerPoint Templates and Slides will provide weight to your words. They will bring out the depth of your thought process. Use our Process and Flows PowerPoint Templates because you can Add colour to your speech with our PowerPoint Templates and Slides. Your presentation will leave your audience speechless. Present our Business PowerPoint Templates because our PowerPoint Templates and Slides will give your ideas the shape. Download our Marketing PowerPoint Templates because Our PowerPoint Templates and Slides will let you Hit the right notes. Watch your audience start singing to your tune.Use these PowerPoint slides for presentations relating to Abstract, banking, blank, business, chart, circle, company, concept, control, corporate, data, diagram, display, element, environment,finance, financial, graph, graphic, icon, illustration, information, isolated, isometric, management, market, marketing, modern, motion, movement,organization, perspective, pie, presentation, report, ring, sales, sheet, sign, slice, stock, symbol, three, text. The prominent colors used in the PowerPoint template are Yellow, Blue light, Green lime.
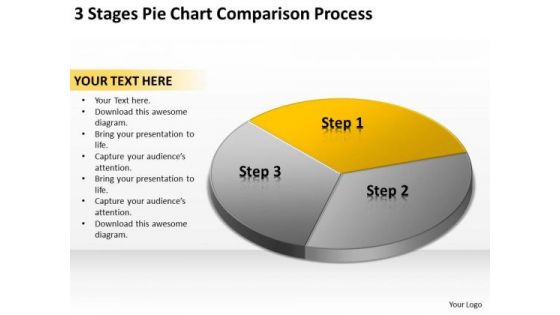
3 Stages Pie Chart Comparison Process Example Of Business Plans PowerPoint Slides
We present our 3 stages pie chart comparison process example of business plans PowerPoint Slides.Download our Marketing PowerPoint Templates because You have gained great respect for your brilliant ideas. Use our PowerPoint Templates and Slides to strengthen and enhance your reputation. Use our Finance PowerPoint Templates because You are working at that stage with an air of royalty. Let our PowerPoint Templates and Slides be the jewels in your crown. Present our Arrows PowerPoint Templates because Our PowerPoint Templates and Slides offer you the widest possible range of options. Download our Circle Charts PowerPoint Templates because You can Create a matrix with our PowerPoint Templates and Slides. Feel the strength of your ideas click into place. Download and present our Business PowerPoint Templates because You can Zap them with our PowerPoint Templates and Slides. See them reel under the impact.Use these PowerPoint slides for presentations relating to Pie, chart, process, menu, website, network, statistics, item, junction, corporate, business, plan, presentation, template, circle, brochure, data, report, marketing, different, management, graph, modern, connection, sphere, options, strategy, catalog, world, spherical, segments, text, company, banner, information, navigation, structure, parts, globe, arrows, communication. The prominent colors used in the PowerPoint template are Yellow, Black, Gray.

Comparison Advancement Antivirus Chart Ppt PowerPoint Presentation Complete Deck With Slides
Improve your presentation delivery using this comparison advancement antivirus chart ppt powerpoint presentation complete deck with slides. Support your business vision and objectives using this well-structured PPT deck. This template offers a great starting point for delivering beautifully designed presentations on the topic of your choice. Comprising eleven this professionally designed template is all you need to host discussion and meetings with collaborators. Each slide is self-explanatory and equipped with high-quality graphics that can be adjusted to your needs. Therefore, you will face no difficulty in portraying your desired content using this PPT slideshow. This PowerPoint slideshow contains every important element that you need for a great pitch. It is not only editable but also available for immediate download and utilization. The color, font size, background, shapes everything can be modified to create your unique presentation layout. Therefore, download it now.
Bar Chart Icon For Financial Ratios Comparison Elements PDF
Presenting bar chart icon for financial ratios comparison elements pdf to dispense important information. This template comprises four stages. It also presents valuable insights into the topics including bar chart icon for financial ratios comparison. This is a completely customizable PowerPoint theme that can be put to use immediately. So, download it and address the topic impactfully.

Pie Charts For Relative Comparison Study Powerpoint Slides
This power point template illustrates diagram of three pie charts with percentage values. This business slide can be used for relative comparison study. Present your views and ideas with this impressive slide.

Battery Chart With Percentage Values For Comparison PowerPoint Slides
This year?s sales has matched up with your expectations. Now match this slide with your presentation to show the same. Show your company?s performance or business growth with this four staged battery chart PowerPoint template. With this slide, you can easily convince your colleagues how your company gave a tremendous growth over the years or months. Perfect illustration to show that the targets are achieved. This PPT template is easy to edit. You can choose the color of your choice. Your colleagues are already impressed with the sales growth. Now impress others and choose this PPT innovative designed template.

Circle Chart With Man And Woman Ratio Comparison Powerpoint Slides
This PowerPoint template has been designed with graphics of circle chart. You may download this PPT slide to depict man and woman ratio analysis. Add this slide to your presentation and impress your superiors.
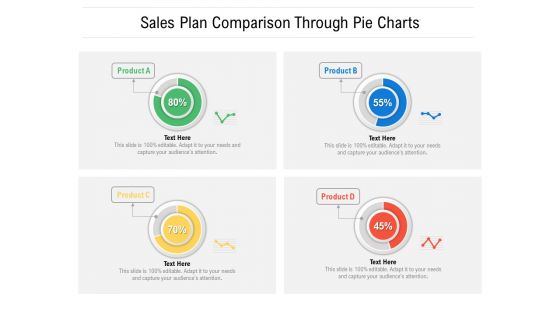
Sales Plan Comparison Through Pie Charts Ppt PowerPoint Presentation File Format Ideas PDF
Showcasing this set of slides titled sales plan comparison through pie charts ppt powerpoint presentation file format ideas pdf. The topics addressed in these templates are sales plan comparison through pie charts. All the content presented in this PPT design is completely editable. Download it and make adjustments in color, background, font etc. as per your unique business setting.
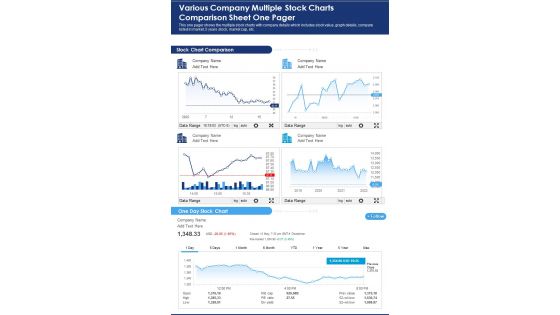
Various Company Multiple Stock Charts Comparison Sheet One Pager PDF Document PPT Template
Presenting you a fantastic Various Company Multiple Stock Charts Comparison Sheet One Pager PDF Document PPT Template. This one-pager document is crafted on hours of research and professional design efforts to ensure you have the best resource. It is completely editable and its design allow you to rehash its elements to suit your needs. Get this Various Company Multiple Stock Charts Comparison Sheet One Pager PDF Document PPT Template Download now.

Data Analysis In Excel 3d Bar Chart For Comparison Of Time Series PowerPoint Templates
Double Your Chances With Our data analysis in excel 3d bar chart for comparison of time series Powerpoint Templates . The Value Of Your Thoughts Will Increase Two-Fold.

Quantitative Data Analysis 3d Line Chart For Comparison Of PowerPoint Templates
Touch Base With Our quantitative data analysis 3d line chart for comparison of Powerpoint Templates . Review Your Growth With Your Audience.
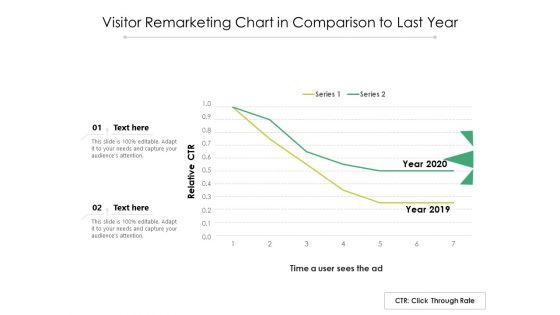
Visitor Remarketing Chart In Comparison To Last Year Ppt PowerPoint Presentation File Themes PDF
Showcasing this set of slides titled visitor remarketing chart in comparison to last year ppt powerpoint presentation file themes pdf. The topics addressed in these templates are visitor remarketing chart in comparison to last year. All the content presented in this PPT design is completely editable. Download it and make adjustments in color, background, font etc. as per your unique business setting.
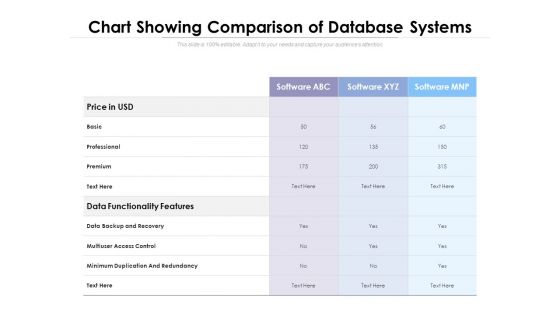
Chart Showing Comparison Of Database Systems Ppt PowerPoint Presentation Portfolio Styles
Presenting this set of slides with name chart showing comparison of database systems ppt powerpoint presentation portfolio styles. The topics discussed in these slides are price in usd, basic, professional, premium, data functionality features, data backup and recovery, multiuser access control, minimum duplication and redundancy. This is a completely editable PowerPoint presentation and is available for immediate download. Download now and impress your audience.

Chart Data Comparison 7 Stages Examples Of Business Plans For PowerPoint Slides
We present our chart data comparison 7 stages examples of business plans for PowerPoint Slides.Download and present our Circle Charts PowerPoint Templates because You are well armed with penetrative ideas. Our PowerPoint Templates and Slides will provide the gunpowder you need. Use our Business PowerPoint Templates because It can be used to Set your controls for the heart of the sun. Our PowerPoint Templates and Slides will be the propellant to get you there. Present our Shapes PowerPoint Templates because You will get more than you ever bargained for. Download and present our Signs PowerPoint Templates because Our PowerPoint Templates and Slides are truly out of this world. Even the MIB duo has been keeping tabs on our team. Present our Metaphors-Visual Concepts PowerPoint Templates because Our PowerPoint Templates and Slides will bullet point your ideas. See them fall into place one by one.Use these PowerPoint slides for presentations relating to business, chart, circle, circular, diagram, economy, finance, framework, graph, isolated, percentage, pie chart, results, scheme, statistics, stats, strategy, success. The prominent colors used in the PowerPoint template are Red, Pink, Green.

Data Analysis Excel Driven Pie Chart For Easy Comparison PowerPoint Slides Templates
Our data analysis excel driven pie chart for easy comparison powerpoint slides Templates Abhor Doodling. They Never Let The Interest Flag.

7 Sections Pie Chart For Data Comparison Ppt PowerPoint Presentation File Graphics Template
This is a 7 sections pie chart for data comparison ppt powerpoint presentation file graphics template. This is a seven stage process. The stages in this process are 6 piece pie chart, 6 segment pie chart, 6 parts pie chart.

7 Segments Pie Chart For Statistical Comparison Ppt PowerPoint Presentation Gallery Visual Aids
This is a 7 segments pie chart for statistical comparison ppt powerpoint presentation gallery visual aids. This is a seven stage process. The stages in this process are 6 piece pie chart, 6 segment pie chart, 6 parts pie chart.

8 Sections Pie Chart For Data Comparison Ppt PowerPoint Presentation Show Slideshow
This is a 8 sections pie chart for data comparison ppt powerpoint presentation show slideshow. This is a eight stage process. The stages in this process are 6 piece pie chart, 6 segment pie chart, 6 parts pie chart.
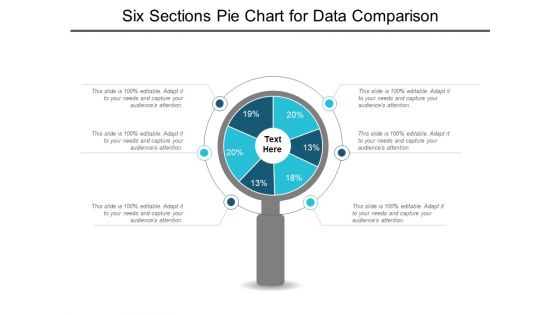
Six Sections Pie Chart For Data Comparison Ppt PowerPoint Presentation Styles Graphics Example
This is a six sections pie chart for data comparison ppt powerpoint presentation styles graphics example. This is a six stage process. The stages in this process are 6 piece pie chart, 6 segment pie chart, 6 parts pie chart.
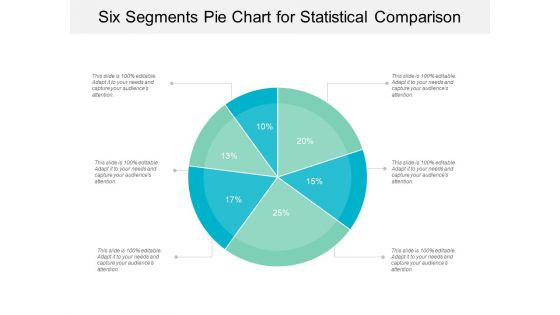
Six Segments Pie Chart For Statistical Comparison Ppt PowerPoint Presentation Gallery Background
This is a six segments pie chart for statistical comparison ppt powerpoint presentation gallery background. This is a six stage process. The stages in this process are 6 piece pie chart, 6 segment pie chart, 6 parts pie chart.
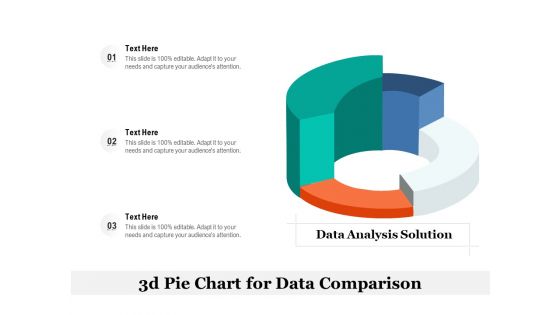
3D Pie Chart For Data Comparison Ppt Infographic Template Vector PDF
Presenting 3d pie chart for data comparison ppt infographic template vector pdf. to dispense important information. This template comprises three stages. It also presents valuable insights into the topics including data analysis solution, 3d pie chart for data comparison. This is a completely customizable PowerPoint theme that can be put to use immediately. So, download it and address the topic impactfully.
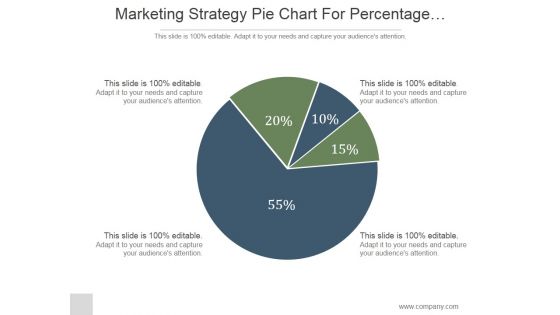
Marketing Strategy Pie Chart For Percentage Comparison Ppt PowerPoint Presentation Ideas
This is a marketing strategy pie chart for percentage comparison ppt powerpoint presentation ideas. This is a four stage process. The stages in this process are marketing, pie, strategy, finance, percentage.

3D Pie Chart For Data Comparison Ppt PowerPoint Presentation Model Design Ideas
This is a 3d pie chart for data comparison ppt powerpoint presentation model design ideas. This is a six stage process. The stages in this process are art, colouring, paint brush.

Bar Chart Showing Income Comparison Of Different Years Ppt PowerPoint Presentation Gallery Ideas PDF
Presenting this set of slides with name bar chart showing income comparison of different years ppt powerpoint presentation gallery ideas pdf. The topics discussed in these slides are revenue of first 6 months, revenue of last 6 months. This is a completely editable PowerPoint presentation and is available for immediate download. Download now and impress your audience.
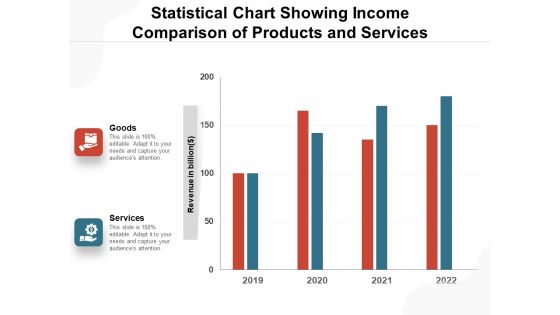
Statistical Chart Showing Income Comparison Of Products And Services Ppt PowerPoint Presentation File Files PDF
Presenting this set of slides with name statistical chart showing income comparison of products and services ppt powerpoint presentation file files pdf. The topics discussed in these slides are goods, services. This is a completely editable PowerPoint presentation and is available for immediate download. Download now and impress your audience.

Figure Chart Illustrating Data Comparison Of Different Years Ppt PowerPoint Presentation File Inspiration PDF
Pitch your topic with ease and precision using this figure chart illustrating data comparison of different years ppt powerpoint presentation file inspiration pdf. This layout presents information on gross profit, total revenue, operating income. It is also available for immediate download and adjustment. So, changes can be made in the color, design, graphics or any other component to create a unique layout.

Business Diagram Five Staged Comparative Chart For Data Comparison Presentation Template
Five staged comparative chart has been used to design this power point template. This PPT contains the concept of data comparison. Use this PPT for your business and finance based data comparison in any financial presentation.

Monthly Line Chart Indicating Monthly Data Comparison Ppt PowerPoint Presentation Model Slide Portrait
Showcasing this set of slides titled monthly line chart indicating monthly data comparison ppt powerpoint presentation model slide portrait. The topics addressed in these templates are monthly line chart indicating monthly data comparison. All the content presented in this PPT design is completely editable. Download it and make adjustments in color, background, font etc. as per your unique business setting.
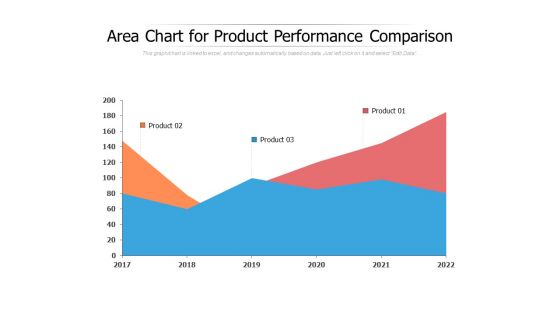
Area Chart For Product Performance Comparison Ppt PowerPoint Presentation Outline Slide Portrait
Presenting this set of slides with name area chart for product performance comparison ppt powerpoint presentation outline slide portrait. The topics discussed in these slide is area chart for product performance comparison. This is a completely editable PowerPoint presentation and is available for immediate download. Download now and impress your audience.
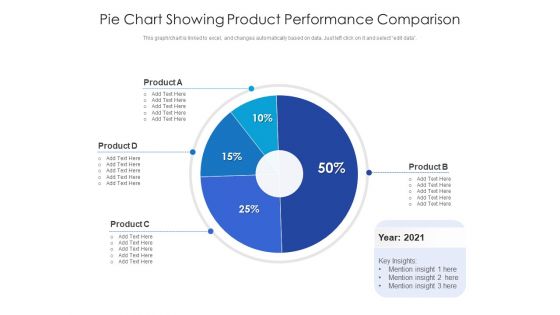
Pie Chart Showing Product Performance Comparison Ppt PowerPoint Presentation Professional Background Designs PDF
Showcasing this set of slides titled pie chart showing product performance comparison ppt powerpoint presentation professional background designs pdf. The topics addressed in these templates are pie chart showing product performance comparison. All the content presented in this PPT design is completely editable. Download it and make adjustments in color, background, font etc. as per your unique business setting.
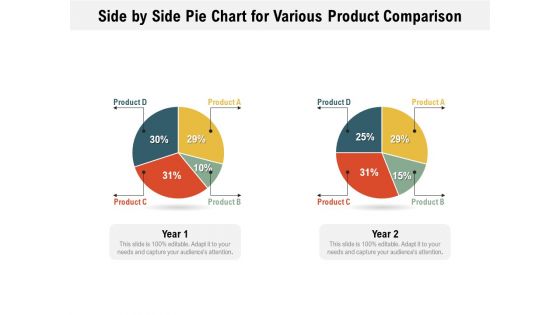
Side By Side Pie Chart For Various Product Comparison Ppt PowerPoint Presentation File Infographics PDF
Pitch your topic with ease and precision using this side by side pie chart for various product comparison ppt powerpoint presentation file infographics pdf. This layout presents information on side by side pie chart for various product comparison. It is also available for immediate download and adjustment. So, changes can be made in the color, design, graphics or any other component to create a unique layout.

Supplier Scorecard Supplier Comparison Scorecard With Key Performance Indicator Chart Formats PDF
This is a supplier scorecard supplier comparison scorecard with key performance indicator chart formats pdf template with various stages. Focus and dispense information on one stages using this creative set, that comes with editable features. It contains large content boxes to add your information on topics like supplier comparison scorecard, key performance, indicator chart. You can also showcase facts, figures, and other relevant content using this PPT layout. Grab it now.

3D Bar Chart For Percentage Values Comparison Ppt PowerPoint Presentation Professional Visual Aids
This is a 3d bar chart for percentage values comparison ppt powerpoint presentation professional visual aids. This is a five stage process. The stages in this process are art, colouring, paint brush.

Three Column Chart With Product Feature Comparison Ppt PowerPoint Presentation Gallery Layouts PDF
Persuade your audience using this three column chart with product feature comparison ppt powerpoint presentation gallery layouts pdf. This PPT design covers three stages, thus making it a great tool to use. It also caters to a variety of topics including three column chart with product feature comparison. Download this PPT design now to present a convincing pitch that not only emphasizes the topic but also showcases your presentation skills.
Chart Illustrating Two Year Comparison Of Business Data Icon Ppt Outline Example Topics PDF
Persuade your audience using this Chart Illustrating Two Year Comparison Of Business Data Icon Ppt Outline Example Topics PDF. This PPT design covers three stages, thus making it a great tool to use. It also caters to a variety of topics including chart illustrating two year comparison of business data icon. Download this PPT design now to present a convincing pitch that not only emphasizes the topic but also showcases your presentation skills.
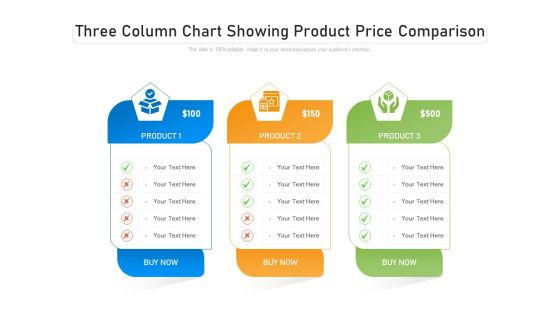
Three Column Chart Showing Product Price Comparison Ppt PowerPoint Presentation Ideas Deck PDF
Persuade your audience using this three column chart showing product price comparison ppt powerpoint presentation ideas deck pdf. This PPT design covers three stages, thus making it a great tool to use. It also caters to a variety of topics including three column chart showing product price comparison. Download this PPT design now to present a convincing pitch that not only emphasizes the topic but also showcases your presentation skills.

Line Chart For Quarterly Performance Comparison Ppt PowerPoint Presentation Layouts Slide Download
Presenting this set of slides with name line chart for quarterly performance comparison ppt powerpoint presentation layouts slide download. The topics discussed in these slides are met, missed, exceeded. This is a completely editable PowerPoint presentation and is available for immediate download. Download now and impress your audience.
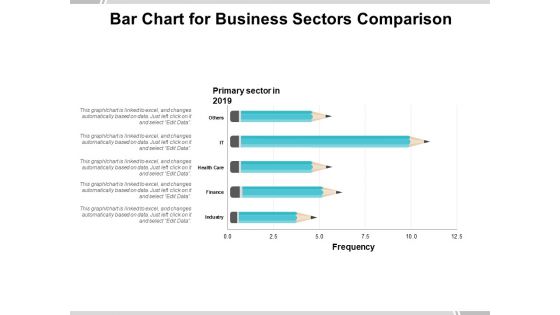
Bar Chart For Business Sectors Comparison Ppt PowerPoint Presentation Professional Guide
Presenting this set of slides with name bar chart for business sectors comparison ppt powerpoint presentation professional guide. The topics discussed in these slides are education, growth, pencil bar graph. This is a completely editable PowerPoint presentation and is available for immediate download. Download now and impress your audience.
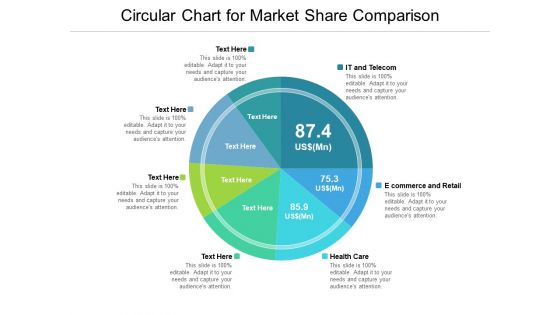
Circular Chart For Market Share Comparison Ppt Powerpoint Presentation Outline Skills
Presenting this set of slides with name circular chart for market share comparison ppt powerpoint presentation outline skills. The topics discussed in these slides are customer communication, customer service, customer satisfaction. This is a completely editable PowerPoint presentation and is available for immediate download. Download now and impress your audience.

Figure Chart Illustrating Product Features Comparison Ppt PowerPoint Presentation Gallery Guidelines PDF
Pitch your topic with ease and precision using this figure chart illustrating monthly customer retention data ppt powerpoint presentation icon model pdf. This layout presents information on figure chart illustrating product features comparison. It is also available for immediate download and adjustment. So, changes can be made in the color, design, graphics or any other component to create a unique layout.

Pie Chart Data Comparisons 5 Stages How To Develop Business Plan PowerPoint Templates
We present our pie chart data comparisons 5 stages how to develop business plan PowerPoint templates.Present our Marketing PowerPoint Templates because You can Be the star of the show with our PowerPoint Templates and Slides. Rock the stage with your ideas. Download and present our Finance PowerPoint Templates because Timeline crunches are a fact of life. Meet all deadlines using our PowerPoint Templates and Slides. Use our Business PowerPoint Templates because You can Be the puppeteer with our PowerPoint Templates and Slides as your strings. Lead your team through the steps of your script. Download and present our Sales PowerPoint Templates because Our PowerPoint Templates and Slides are a sure bet. Gauranteed to win against all odds. Download our Success PowerPoint Templates because Our PowerPoint Templates and Slides will provide weight to your words. They will bring out the depth of your thought process.Use these PowerPoint slides for presentations relating to Analysis, Analyzing, Brands, Business, Chart, Colorful, Commerce, Compare, Comparison, Data, Economical, Finance, Financial, Grow, Growth, Market, Market Share, Marketing, Measure, Pen, Pie, Pie Chart, Presentation, Profit, Revenue, Sales, Sales Chat, Sales Increase, Share, Statistical, Success, Successful. The prominent colors used in the PowerPoint template are Blue, Gray, White.

Pie Chart Data Comparisons 5 Stages Business Plan Templates PowerPoint Slides
We present our pie chart data comparisons 5 stages business plan templates PowerPoint Slides.Present our Marketing PowerPoint Templates because Our PowerPoint Templates and Slides are Clear and concise. Use them and dispel any doubts your team may have. Present our Finance PowerPoint Templates because You can Create a matrix with our PowerPoint Templates and Slides. Feel the strength of your ideas click into place. Download our Business PowerPoint Templates because You can Inspire your team with our PowerPoint Templates and Slides. Let the force of your ideas flow into their minds. Present our Sales PowerPoint Templates because Our PowerPoint Templates and Slides are aesthetically designed to attract attention. We gaurantee that they will grab all the eyeballs you need. Present our Success PowerPoint Templates because Our PowerPoint Templates and Slides are specially created by a professional team with vast experience. They diligently strive to come up with the right vehicle for your brilliant Ideas. Use these PowerPoint slides for presentations relating to Analysis, Analyzing, Brands, Business, Chart, Colorful, Commerce, Compare, Comparison, Data, Economical, Finance, Financial, Grow, Growth, Market, Market Share, Marketing, Measure, Pen, Pie, Pie Chart, Presentation, Profit, Revenue, Sales, Sales Chat, Sales Increase, Share, Statistical, Success, Successful. The prominent colors used in the PowerPoint template are Blue, Gray, White.
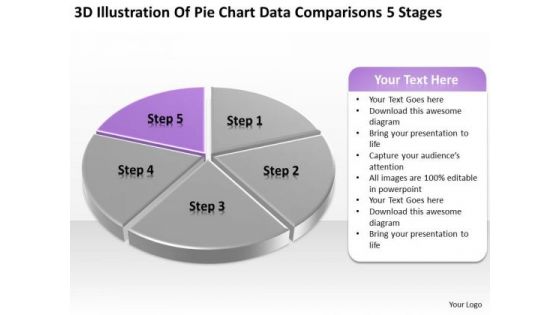
Pie Chart Data Comparisons 5 Stages Ppt Designing Business Plan PowerPoint Templates
We present our pie chart data comparisons 5 stages ppt designing business plan PowerPoint templates.Use our Marketing PowerPoint Templates because Our PowerPoint Templates and Slides are innately eco-friendly. Their high recall value negate the need for paper handouts. Download our Finance PowerPoint Templates because Our PowerPoint Templates and Slides are truly out of this world. Even the MIB duo has been keeping tabs on our team. Use our Business PowerPoint Templates because You should Bet on your luck with our PowerPoint Templates and Slides. Be assured that you will hit the jackpot. Present our Sales PowerPoint Templates because Our PowerPoint Templates and Slides are created with admirable insight. Use them and give your group a sense of your logical mind. Present our Success PowerPoint Templates because Our PowerPoint Templates and Slides are focused like a searchlight beam. They highlight your ideas for your target audience.Use these PowerPoint slides for presentations relating to Analysis, Analyzing, Brands, Business, Chart, Colorful, Commerce, Compare, Comparison, Data, Economical, Finance, Financial, Grow, Growth, Market, Market Share, Marketing, Measure, Pen, Pie, Pie Chart, Presentation, Profit, Revenue, Sales, Sales Chat, Sales Increase, Share, Statistical, Success, Successful. The prominent colors used in the PowerPoint template are Purple, Gray, White.

Pie Chart Data Comparisons 5 Stages Examples Small Business Plans PowerPoint Slides
We present our pie chart data comparisons 5 stages examples small business plans PowerPoint Slides.Download our Marketing PowerPoint Templates because you can Set pulses racing with our PowerPoint Templates and Slides. They will raise the expectations of your team. Present our Finance PowerPoint Templates because Our PowerPoint Templates and Slides are the chords of your song. String them along and provide the lilt to your views. Download and present our Business PowerPoint Templates because It will Raise the bar of your Thoughts. They are programmed to take you to the next level. Download our Sales PowerPoint Templates because Our PowerPoint Templates and Slides will fulfill your every need. Use them and effectively satisfy the desires of your audience. Present our Success PowerPoint Templates because You can Be the puppeteer with our PowerPoint Templates and Slides as your strings. Lead your team through the steps of your script.Use these PowerPoint slides for presentations relating to Analysis, Analyzing, Brands, Business, Chart, Colorful, Commerce, Compare, Comparison, Data, Economical, Finance, Financial, Grow, Growth, Market, Market Share, Marketing, Measure, Pen, Pie, Pie Chart, Presentation, Profit, Revenue, Sales, Sales Chat, Sales Increase, Share, Statistical, Success, Successful. The prominent colors used in the PowerPoint template are Yellow, Gray, White.

Bubble Chart For Marketing Team Performance Comparison Ppt PowerPoint Presentation File Outline PDF
Presenting this set of slides with name bubble chart for marketing team performance comparison ppt powerpoint presentation file outline pdf. The topics discussed in these slide is bubble chart for marketing team performance comparison. This is a completely editable PowerPoint presentation and is available for immediate download. Download now and impress your audience.

One Page Price Chart For Health Insurance Plans Comparison And Assessment PDF Document PPT Template
Presenting you an exemplary One Page Price Chart For Health Insurance Plans Comparison And Assessment PDF Document PPT Template. Our one-pager template comprises all the must-have essentials of an inclusive document. You can edit it with ease, as its layout is completely editable. With such freedom, you can tweak its design and other elements to your requirements. Download this One Page Price Chart For Health Insurance Plans Comparison And Assessment PDF Document PPT Template Download now.

Chart Indicating Vendors Product Price Comparison Ppt PowerPoint Presentation Portfolio Infographics PDF
Showcasing this set of slides titled chart indicating vendors product price comparison ppt powerpoint presentation portfolio infographics pdf. The topics addressed in these templates are product, fgh product, units in usd, price, supplier. All the content presented in this PPT design is completely editable. Download it and make adjustments in color, background, font etc. as per your unique business setting.

Company Multiple Stock Charts With Price Comparison One Pager PDF Document PPT Template
Here we present the Company Multiple Stock Charts With Price Comparison One Pager PDF Document PPT Template. This One-pager template includes everything you require. You can edit this document and make changes according to your needs it offers complete freedom of customization. Grab this Company Multiple Stock Charts With Price Comparison One Pager PDF Document PPT Template Download now.

Budget Chart With Income And Expenditure Comparison Ppt PowerPoint Presentation Infographics Designs PDF
This slide illustrates graphical representation of income and expenditure of a company. It includes cashflow table with total income and total expense etc.Pitch your topic with ease and precision using this Budget Chart With Income And Expenditure Comparison Ppt PowerPoint Presentation Infographics Designs PDF. This layout presents information on Total Expense, Total Income, Total Cash. It is also available for immediate download and adjustment. So, changes can be made in the color, design, graphics or any other component to create a unique layout.

Evaluation Chart For Various System Tool Comparison Ppt PowerPoint Presentation Layouts Images PDF
Showcasing this set of slides titled evaluation chart for various system tool comparison ppt powerpoint presentation layouts images pdf. The topics addressed in these templates are project definition, resource definition, work management, task scheduling, expense recording. All the content presented in this PPT design is completely editable. Download it and make adjustments in color, background, font etc. as per your unique business setting.
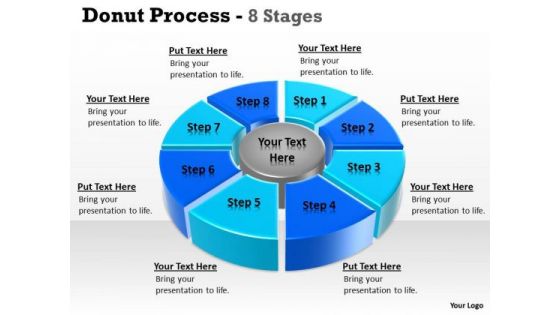
Strategic Management Donut Pie Chart For Data Comparisons 8 Stages Sales Diagram
Be The Doer With Our Strategic Management Donut Pie Chart For Data Comparisons 8 Stages Sales Diagram Powerpoint Templates. Put Your Thoughts Into Practice.

One Page Multiple Company Stock Charts With Share Price Comparison PDF Document PPT Template
Presenting you an exemplary One Page Multiple Company Stock Charts With Share Price Comparison PDF Document PPT Template. Our one-pager template comprises all the must-have essentials of an inclusive document. You can edit it with ease, as its layout is completely editable. With such freedom, you can tweak its design and other elements to your requirements. Download this One Page Multiple Company Stock Charts With Share Price Comparison PDF Document PPT Template Download now.

Chart For Data Comparisons 3 Stages How To Complete Business Plan PowerPoint Templates
We present our chart for data comparisons 3 stages how to complete business plan PowerPoint templates.Download and present our Business PowerPoint Templates because You canTake a leap off the starting blocks with our PowerPoint Templates and Slides. They will put you ahead of the competition in quick time. Download our Ring Charts PowerPoint Templates because You canTake a leap off the starting blocks with our PowerPoint Templates and Slides. They will put you ahead of the competition in quick time. Use our Process and Flows PowerPoint Templates because Our PowerPoint Templates and Slides are created with admirable insight. Use them and give your group a sense of your logical mind. Download our Shapes PowerPoint Templates because Our PowerPoint Templates and Slides will give you great value for your money. Be assured of finding the best projection to highlight your words. Present our Flow Charts PowerPoint Templates because Our PowerPoint Templates and Slides are designed to help you succeed. They have all the ingredients you need.Use these PowerPoint slides for presentations relating to Chart, flow, diagram, around, numbers, model, perspective, green, white, red, business, rotation, presentation, shadow, representation, circle, ring,flowchart, rotate, marketing, repeat, abstract, management, cycle, illustration, icon, three, guidance, connection, strategy, direction, recurrent, motion, connect,variation, contrast, background, commerce, repetitive. The prominent colors used in the PowerPoint template are Green, Gray, White.
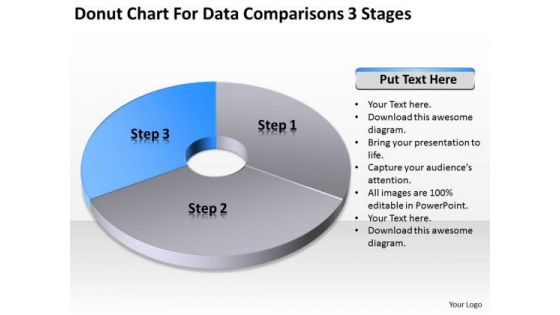
Chart For Data Comparisons 3 Stages Ppt Business Plan PowerPoint Templates
We present our chart for data comparisons 3 stages ppt business plan PowerPoint templates.Use our Business PowerPoint Templates because Our PowerPoint Templates and Slides are innately eco-friendly. Their high recall value negate the need for paper handouts. Present our Ring Charts PowerPoint Templates because Our PowerPoint Templates and Slides will Embellish your thoughts. They will help you illustrate the brilliance of your ideas. Present our Process and Flows PowerPoint Templates because You aspire to touch the sky with glory. Let our PowerPoint Templates and Slides provide the fuel for your ascent. Use our Shapes PowerPoint Templates because It can be used to Set your controls for the heart of the sun. Our PowerPoint Templates and Slides will be the propellant to get you there. Use our Flow Charts PowerPoint Templates because Our PowerPoint Templates and Slides ensures Effective communication. They help you put across your views with precision and clarity.Use these PowerPoint slides for presentations relating to Chart, flow, diagram, around, numbers, model, perspective, green, white, red, business, rotation, presentation, shadow, representation, circle, ring,flowchart, rotate, marketing, repeat, abstract, management, cycle, illustration, icon, three, guidance, connection, strategy, direction, recurrent, motion, connect,variation, contrast, background, commerce, repetitive. The prominent colors used in the PowerPoint template are Blue, White, Gray.
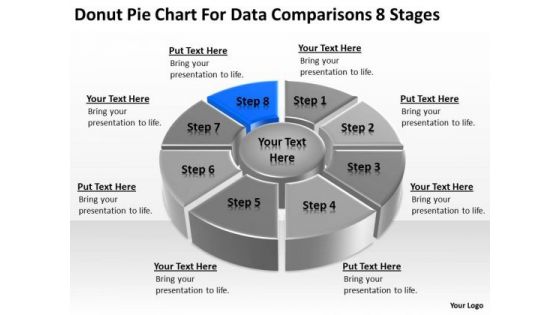
Chart For Data Comparisons 8 Stages Ppt Sample Business Plan Restaurant PowerPoint Templates
We present our chart for data comparisons 8 stages ppt sample business plan restaurant PowerPoint templates.Use our Competition PowerPoint Templates because Our PowerPoint Templates and Slides will let you Clearly mark the path for others to follow. Use our Marketing PowerPoint Templates because Our PowerPoint Templates and Slides have the Brilliant backdrops. Guaranteed to illuminate the minds of your audience. Download and present our Business PowerPoint Templates because Our PowerPoint Templates and Slides will help you be quick off the draw. Just enter your specific text and see your points hit home. Download our Circle Charts PowerPoint Templates because Our PowerPoint Templates and Slides will provide the perfect balance. Your weighty ideas will get the ideal impetus. Download and present our Shapes PowerPoint Templates because You can Give birth to your ideas with our PowerPoint Templates and Slides. See them grow big and strong in record time.Use these PowerPoint slides for presentations relating to Chart, wheel, pie, graph, vector, process, marketing, diagram, business, catalog, website, network, statistics, model, document, junction, plan, presentation, template, circle, brochure, data, stock, management, box, options, direction, design, company, navigation, financial, structure, button, goals, results. The prominent colors used in the PowerPoint template are Blue, Black, Gray.
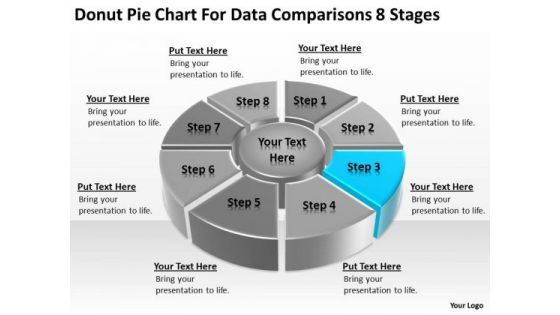
Donut Pie Chart For Data Comparisons 8 Stages Business Action Plan PowerPoint Templates
We present our donut pie chart for data comparisons 8 stages business action plan PowerPoint templates.Download our Success PowerPoint Templates because Our PowerPoint Templates and Slides are effectively colour coded to prioritise your plans They automatically highlight the sequence of events you desire. Present our Finance PowerPoint Templates because you should once Tap the ingenuity of our PowerPoint Templates and Slides. They are programmed to succeed. Present our Arrows PowerPoint Templates because Your audience will believe you are the cats whiskers. Present our Circle Charts PowerPoint Templates because You can Zap them with our PowerPoint Templates and Slides. See them reel under the impact. Download our Business PowerPoint Templates because It can Leverage your style with our PowerPoint Templates and Slides. Charm your audience with your ability.Use these PowerPoint slides for presentations relating to Chart, wheel, pie, graph, vector, process, marketing, diagram, business, catalog, website, network, statistics, model, document, junction, plan, presentation, template, circle, brochure, data, stock, management, box, options, direction, design, company, navigation, financial, structure, button, goals, results. The prominent colors used in the PowerPoint template are Blue, Gray, Black.
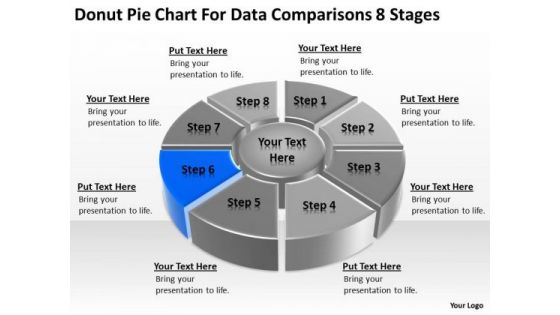
Donut Pie Chart For Data Comparisons 8 Stages Business Plan Examples PowerPoint Templates
We present our donut pie chart for data comparisons 8 stages business plan examples PowerPoint templates.Download and present our Success PowerPoint Templates because You can Stir your ideas in the cauldron of our PowerPoint Templates and Slides. Cast a magic spell on your audience. Download and present our Finance PowerPoint Templates because You should Kick up a storm with our PowerPoint Templates and Slides. The heads of your listeners will swirl with your ideas. Use our Arrows PowerPoint Templates because You should Ascend the ladder of success with ease. Our PowerPoint Templates and Slides will provide strong and sturdy steps. Download and present our Circle Charts PowerPoint Templates because Your ideas provide food for thought. Our PowerPoint Templates and Slides will help you create a dish to tickle the most discerning palate. Use our Business PowerPoint Templates because Our PowerPoint Templates and Slides are conceived by a dedicated team. Use them and give form to your wondrous ideas.Use these PowerPoint slides for presentations relating to Chart, wheel, pie, graph, vector, process, marketing, diagram, business, catalog, website, network, statistics, model, document, junction, plan, presentation, template, circle, brochure, data, stock, management, box, options, direction, design, company, navigation, financial, structure, button, goals, results. The prominent colors used in the PowerPoint template are Blue, Gray, Black.
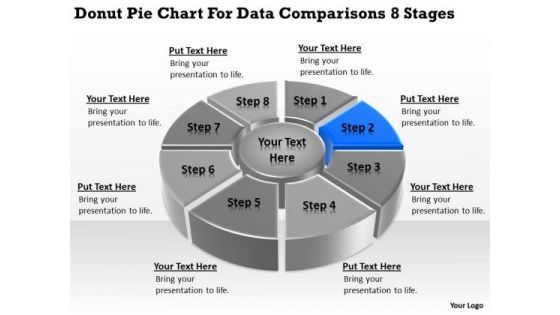
Donut Pie Chart For Data Comparisons 8 Stages Business Plans PowerPoint Templates
We present our donut pie chart for data comparisons 8 stages business plans PowerPoint templates.Download our Success PowerPoint Templates because Our PowerPoint Templates and Slides will embellish your thoughts. See them provide the desired motivation to your team. Download and present our Finance PowerPoint Templates because Our PowerPoint Templates and Slides offer you the widest possible range of options. Use our Arrows PowerPoint Templates because Our PowerPoint Templates and Slides are specially created by a professional team with vast experience. They diligently strive to come up with the right vehicle for your brilliant Ideas. Download our Circle Charts PowerPoint Templates because Our PowerPoint Templates and Slides will bullet point your ideas. See them fall into place one by one. Present our Business PowerPoint Templates because It will Give impetus to the hopes of your colleagues. Our PowerPoint Templates and Slides will aid you in winning their trust.Use these PowerPoint slides for presentations relating to Chart, wheel, pie, graph, vector, process, marketing, diagram, business, catalog, website, network, statistics, model, document, junction, plan, presentation, template, circle, brochure, data, stock, management, box, options, direction, design, company, navigation, financial, structure, button, goals, results. The prominent colors used in the PowerPoint template are Blue, Gray, Black.
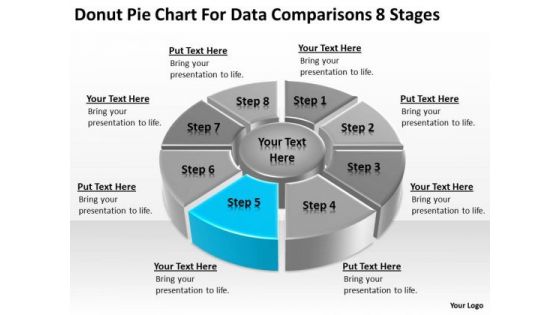
Pie Chart For Data Comparisons 8 Stages Business Plan Downloads PowerPoint Templates
We present our pie chart for data comparisons 8 stages business plan downloads PowerPoint templates.Download and present our Communication PowerPoint Templates because You can Inspire your team with our PowerPoint Templates and Slides. Let the force of your ideas flow into their minds. Download and present our Marketing PowerPoint Templates because Our PowerPoint Templates and Slides are a sure bet. Gauranteed to win against all odds. Present our Business PowerPoint Templates because You can Channelise the thoughts of your team with our PowerPoint Templates and Slides. Urge them to focus on the goals you have set. Present our Process and Flows PowerPoint Templates because Our PowerPoint Templates and Slides offer you the widest possible range of options. Use our Circle Charts PowerPoint Templates because Our PowerPoint Templates and Slides are created with admirable insight. Use them and give your group a sense of your logical mind.Use these PowerPoint slides for presentations relating to Diagram, Pie, Chart, Process, Network, Statistics, Item, Junction, Corporate, Business, Plan, Vector, Presentation, Template, Circle, Brochure, Data, Report, Marketing, Different, Abstract, Management, Graph, Multicolored, Modern, Four, Illustration, Connection, Options, Strategy, Catalog, Company, Banner, Information, Navigation, Structure, Arrows, Communication. The prominent colors used in the PowerPoint template are Blue, Gray, White.

Pie Chart For Data Comparisons 8 Stages Sample Business Plans Free PowerPoint Templates
We present our pie chart for data comparisons 8 stages sample business plans free PowerPoint templates.Present our Communication PowerPoint Templates because Our PowerPoint Templates and Slides ensures Effective communication. They help you put across your views with precision and clarity. Use our Marketing PowerPoint Templates because Our PowerPoint Templates and Slides help you pinpoint your timelines. Highlight the reasons for your deadlines with their use. Download our Business PowerPoint Templates because Our PowerPoint Templates and Slides will effectively help you save your valuable time. They are readymade to fit into any presentation structure. Present our Process and Flows PowerPoint Templates because Timeline crunches are a fact of life. Meet all deadlines using our PowerPoint Templates and Slides. Download and present our Circle Charts PowerPoint Templates because You have gained great respect for your brilliant ideas. Use our PowerPoint Templates and Slides to strengthen and enhance your reputation.Use these PowerPoint slides for presentations relating to Diagram, Pie, Chart, Process, Network, Statistics, Item, Junction, Corporate, Business, Plan, Vector, Presentation, Template, Circle, Brochure, Data, Report, Marketing, Different, Abstract, Management, Graph, Multicolored, Modern, Four, Illustration, Connection, Options, Strategy, Catalog, Company, Banner, Information, Navigation, Structure, Arrows, Communication. The prominent colors used in the PowerPoint template are Blue, Gray, White.
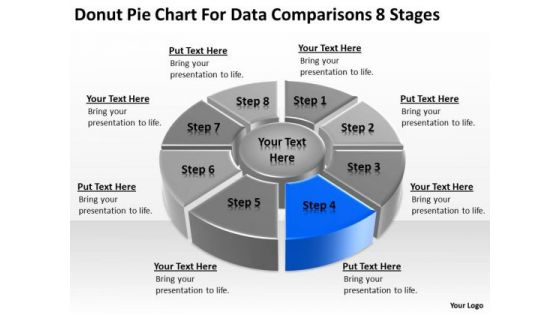
Donut Pie Chart For Data Comparisons 8 Stages Example Business Plan PowerPoint Slides
We present our donut pie chart for data comparisons 8 stages example business plan PowerPoint Slides.Download and present our Success PowerPoint Templates because You are an avid believer in ethical practices. Highlight the benefits that accrue with our PowerPoint Templates and Slides. Download our Finance PowerPoint Templates because You can Channelise the thoughts of your team with our PowerPoint Templates and Slides. Urge them to focus on the goals you have set. Use our Arrows PowerPoint Templates because You should Bet on your luck with our PowerPoint Templates and Slides. Be assured that you will hit the jackpot. Download and present our Circle Charts PowerPoint Templates because You are working at that stage with an air of royalty. Let our PowerPoint Templates and Slides be the jewels in your crown. Download and present our Business PowerPoint Templates because They will Put the wind in your sails. Skim smoothly over the choppy waters of the market.Use these PowerPoint slides for presentations relating to Chart, wheel, pie, graph, vector, process, marketing, diagram, business, catalog, website, network, statistics, model, document, junction, plan, presentation, template, circle, brochure, data, stock, management, box, options, direction, design, company, navigation, financial, structure, button, goals, results. The prominent colors used in the PowerPoint template are Blue, Gray, Black.

Pie Chart For Data Comparisons 8 Stages People Who Write Business Plans PowerPoint Slides
We present our pie chart for data comparisons 8 stages people who write business plans PowerPoint Slides.Present our Communication PowerPoint Templates because Our PowerPoint Templates and Slides will let Your superior ideas hit the target always and everytime. Download and present our Marketing PowerPoint Templates because Our PowerPoint Templates and Slides team portray an attitude of elegance. Personify this quality by using them regularly. Download and present our Business PowerPoint Templates because It will mark the footprints of your journey. Illustrate how they will lead you to your desired destination. Present our Process and Flows PowerPoint Templates because Our PowerPoint Templates and Slides will fulfill your every need. Use them and effectively satisfy the desires of your audience. Download our Circle Charts PowerPoint Templates because Our PowerPoint Templates and Slides offer you the widest possible range of options.Use these PowerPoint slides for presentations relating to Diagram, Pie, Chart, Process, Network, Statistics, Item, Junction, Corporate, Business, Plan, Vector, Presentation, Template, Circle, Brochure, Data, Report, Marketing, Different, Abstract, Management, Graph, Multicolored, Modern, Four, Illustration, Connection, Options, Strategy, Catalog, Company, Banner, Information, Navigation, Structure, Arrows, Communication. The prominent colors used in the PowerPoint template are Blue, Gray, White.

Donut Chart For Data Comparisons 3 Stages Ppt Business Plan PowerPoint Templates
We present our donut chart for data comparisons 3 stages ppt business plan PowerPoint templates.Use our Process and Flows PowerPoint Templates because Our PowerPoint Templates and Slides provide you with a vast range of viable options. Select the appropriate ones and just fill in your text. Download our Circle Charts PowerPoint Templates because Our PowerPoint Templates and Slides will let you Hit the right notes. Watch your audience start singing to your tune. Download our Business PowerPoint Templates because It can Bubble and burst with your ideas. Use our Marketing PowerPoint Templates because Our PowerPoint Templates and Slides will provide you a launch platform. Give a lift off to your ideas and send them into orbit. Use our Shapes PowerPoint Templates because Our PowerPoint Templates and Slides will weave a web of your great ideas. They are gauranteed to attract even the most critical of your colleagues.Use these PowerPoint slides for presentations relating to Diagram, wheel, graphic, graph, chart, vector, round, fuel, wiper, change, circle, brakes, vehicle, illustration, circular, system, surfaces, tune-up, clipart, care, reflection, upkeep, clip, text, maintenance, blades , art, filter, routine. The prominent colors used in the PowerPoint template are Blue light, Gray, Black.
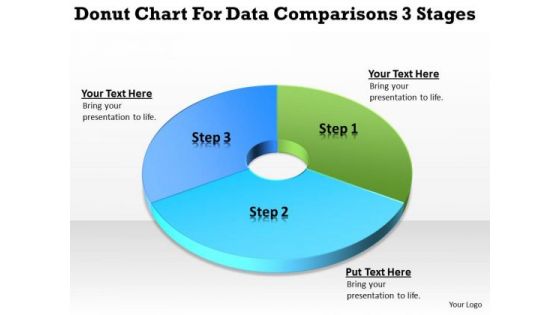
Donut Chart For Data Comparisons 3 Stages Business Planning PowerPoint Slides
We present our donut chart for data comparisons 3 stages business planning PowerPoint Slides.Present our Business PowerPoint Templates because It will Strengthen your hand with your thoughts. They have all the aces you need to win the day. Use our Finance PowerPoint Templates because You will get more than you ever bargained for. Use our Circle Charts PowerPoint Templates because It will Give impetus to the hopes of your colleagues. Our PowerPoint Templates and Slides will aid you in winning their trust. Present our Shapes PowerPoint Templates because You can Raise a toast with our PowerPoint Templates and Slides. Spread good cheer amongst your audience. Download our Process and Flows PowerPoint Templates because Our PowerPoint Templates and Slides help you meet the demand of the Market. Just browse and pick the slides that appeal to your intuitive senses.Use these PowerPoint slides for presentations relating to chart, donut, market, isolated, diminishing, rate, downtrend, business, three-dimensional, success, presentation, diagram, circle, uptrend, percentage, graphic, finance, data, stock, holdings, report, marketing, analyzing, trading, graph, illustration, pie, sale, up, money, design, currency, growth, descriptive, representing, painting, moving, progress, part, increases, background, investment, index, financial, multi, counter, portion, exchange. The prominent colors used in the PowerPoint template are Blue , Blue light, Green.

Financial Chart For Current And Quick Financial Ratios Comparison Brochure PDF
This slide showcases current and quick ratio graph that can help to evaluate companys liquidity and and assess the company abilities to pay off debt. It also showcases comparison of ratio with previous financial year Pitch your topic with ease and precision using this financial chart for current and quick financial ratios comparison brochure pdf. This layout presents information on financial chart for current and quick financial ratios comparison. It is also available for immediate download and adjustment. So, changes can be made in the color, design, graphics or any other component to create a unique layout.

Pie Charts Showing Revenue And Expenses Comparison Ppt PowerPoint Presentation File Objects PDF
Pitch your topic with ease and precision using this pie charts showing revenue and expenses comparison ppt powerpoint presentation file objects pdf. This layout presents information on revenue, expenses. It is also available for immediate download and adjustment. So, changes can be made in the color, design, graphics or any other component to create a unique layout.

Comparison Template PDF
Deliver an awe inspiring pitch with this creative comparison template pdf bundle. Topics like comparison can be discussed with this completely editable template. It is available for immediate download depending on the needs and requirements of the user.

Comparison Brochure PDF
Deliver an awe inspiring pitch with this creative comparison brochure pdf bundle. Topics like comparison can be discussed with this completely editable template. It is available for immediate download depending on the needs and requirements of the user.

Comparison Information PDF
Deliver and pitch your topic in the best possible manner with this comparison information pdf. Use them to share invaluable insights on comparison and impress your audience. This template can be altered and modified as per your expectations. So, grab it now.
Comparison Icons PDF
Deliver and pitch your topic in the best possible manner with this comparison icons pdf. Use them to share invaluable insights on male population, female population and impress your audience. This template can be altered and modified as per your expectations. So, grab it now.
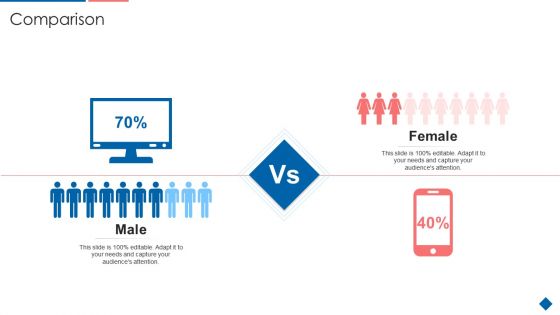
Comparison Clipart PDF
This is a comparison clipart pdf template with various stages. Focus and dispense information on two stages using this creative set, that comes with editable features. It contains large content boxes to add your information on topics like comparison. You can also showcase facts, figures, and other relevant content using this PPT layout. Grab it now.

Comparison Formats PDF
This is a comparison formats pdf template with various stages. Focus and dispense information on two stages using this creative set, that comes with editable features. It contains large content boxes to add your information on topics like comparison. You can also showcase facts, figures, and other relevant content using this PPT layout. Grab it now.
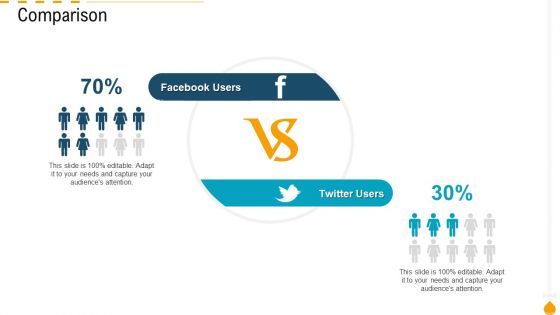
Comparison Portrait PDF
This is a comparison portrait pdf template with various stages. Focus and dispense information on two stages using this creative set, that comes with editable features. It contains large content boxes to add your information on topics like comparison. You can also showcase facts, figures, and other relevant content using this PPT layout. Grab it now.

 Home
Home