Comparison Bar Graph

Product Comparison Data Bar Graph Ppt Powerpoint Presentation Slides Show
This is a product comparison data bar graph ppt powerpoint presentation slides show. This is a four stage process. The stages in this process are data presentation, content presentation, information presentation.

Sales Revenue Comparison Stacked Bar Graph Mockup PDF
This slide shows revenue comparison chart of product sales in various companies to understand profitability of business. It includes companies and revenues. Showcasing this set of slides titled Sales Revenue Comparison Stacked Bar Graph Mockup PDF. The topics addressed in these templates are Sales Revenue Comparison, Revenue From Clothing, Revenue From Equipment. All the content presented in this PPT design is completely editable. Download it and make adjustments in color, background, font etc. as per your unique business setting.
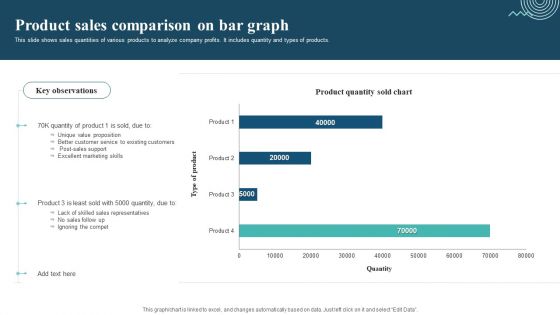
Product Sales Comparison On Bar Graph Sample PDF
This slide shows sales quantities of various products to analyze company profits. It includes quantity and types of products. Pitch your topic with ease and precision using this Product Sales Comparison On Bar Graph Sample PDF. This layout presents information on Unique Value Proposition, Excellent Marketing Skills, Ignoring The Compet. It is also available for immediate download and adjustment. So, changes can be made in the color, design, graphics or any other component to create a unique layout.

Bar Graph Showing Income Comparison Of Cars Ppt PowerPoint Presentation Gallery Brochure PDF
Presenting this set of slides with name bar graph showing income comparison of cars ppt powerpoint presentation gallery brochure pdf. The topics discussed in these slide is bar graph showing income comparison of cars. This is a completely editable PowerPoint presentation and is available for immediate download. Download now and impress your audience.

Sales Rep Scorecard Sales Representatives Scorecard Bar Graph For Sku Performance Comparison Clipart PDF
Deliver an awe inspiring pitch with this creative sales rep scorecard sales representatives scorecard bar graph for sku performance comparison clipart pdf bundle. Topics like sales representatives scorecard bar graph for sku performance comparison can be discussed with this completely editable template. It is available for immediate download depending on the needs and requirements of the user.
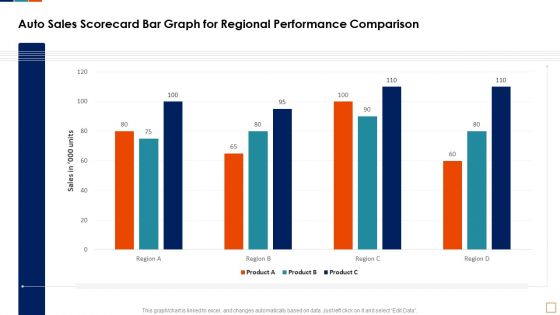
Auto Sales Scorecard Bar Graph For Regional Performance Comparison Infographics PDF
This graph or chart is linked to excel, and changes automatically based on data. Just left click on it and select Edit Data. Deliver an awe inspiring pitch with this creative Auto Sales Scorecard Bar Graph For Regional Performance Comparison Infographics PDF bundle. Topics like Auto Sales Scorecard, Bar Graph Regional, Performance Comparison Product can be discussed with this completely editable template. It is available for immediate download depending on the needs and requirements of the user.

Manufacturing Productivity Analysis Bar Graph Introduction PDF
This slide illustrates the productivity chart of manufacturing of a company. It includes quantity produced in million units against the time period. Pitch your topic with ease and precision using this Manufacturing Productivity Analysis Bar Graph Introduction PDF. This layout presents information on Manufacturing Productivity, Production Decreased, Closure Of Companies. It is also available for immediate download and adjustment. So, changes can be made in the color, design, graphics or any other component to create a unique layout.
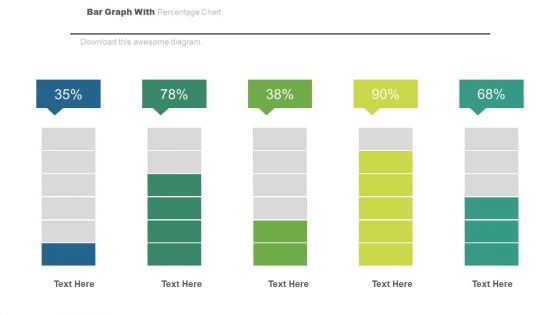
Bar Graph For Statistical Analysis Powerpoint Slides
This PowerPoint template has been designed with bar chart and percentage values. You may download this PPT slide to depict statistical analysis. Add this slide to your presentation and impress your superiors.
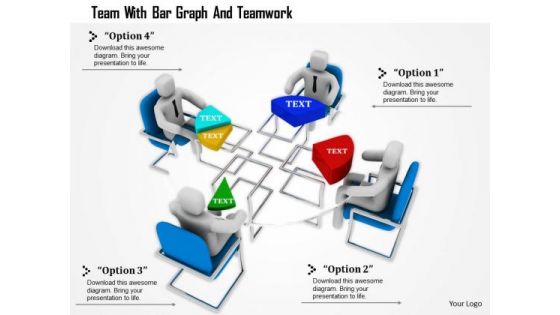
Team With Bar Graph And Teamwork
This Power Point template has been designed with graphic of 3d team forming a pie chart. In this slide team is displaying data analysis and comparison. Use this editable slide to build innovative presentation for your viewers.
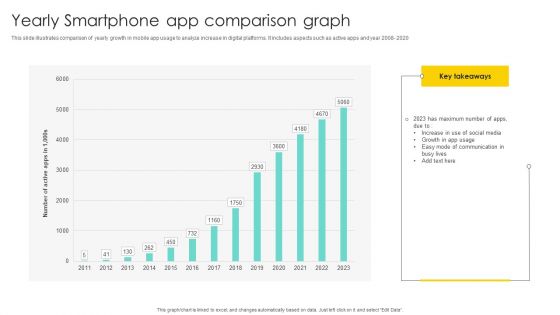
Yearly Smartphone App Comparison Graph Diagrams PDF
Showcasing this set of slides titled Yearly Smartphone App Comparison Graph Diagrams PDF. The topics addressed in these templates are Comparison Graph, Comparison Of Yearly, Growth In App . All the content presented in this PPT design is completely editable. Download it and make adjustments in color, background, font etc. as per your unique business setting.
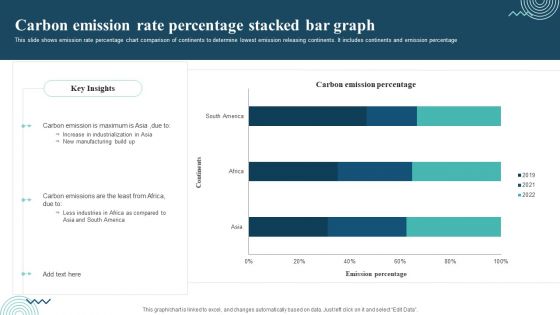
Carbon Emission Rate Percentage Stacked Bar Graph Rules PDF
This slide shows emission rate percentage chart comparison of continents to determine lowest emission releasing continents. It includes continents and emission percentage Showcasing this set of slides titled Carbon Emission Rate Percentage Stacked Bar Graph Rules PDF. The topics addressed in these templates are Carbon Emission, Increase In Industrialization, New Manufacturing. All the content presented in this PPT design is completely editable. Download it and make adjustments in color, background, font etc. as per your unique business setting.
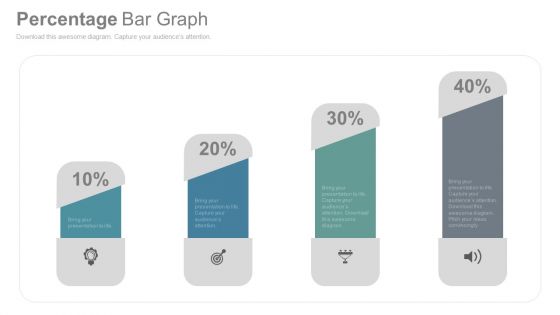
Bar Graph To Compare Business Data PowerPoint Slides
This is the slide which can solve many purposes of yours. Be it growth in your company, need to show your company?s status in the market as compared to others, or how your business has improved so far. An ideal PowerPoint template to display all of these. You can easily use this graph to show the growth of your company using the percentage icons. You can use this visual to show the status of your company in the market in comparison with others. You can edit the icons and replace them with the logo of your company and the others. You can also show it to your colleagues how your company has built its image in the market or how it has improved over the time. A perfect bar graph image which needs to be included in your business PPT presentations.

Data Analysis Excel Bar Graph To Compare PowerPoint Templates
Get The Domestics Right With Our data analysis excel bar graph to compare Powerpoint Templates. Create The Base For Thoughts To Grow.

Horizontal Bar Graph Depicting Employee Job Satisfaction Level Summary PDF
Pitch your topic with ease and precision using this horizontal bar graph depicting employee job satisfaction level summary pdf. This layout presents information on horizontal bar graph depicting employee job satisfaction level. It is also available for immediate download and adjustment. So, changes can be made in the color, design, graphics or any other component to create a unique layout.

Horizontal Bar Graph Depicting Monthly Organizational Profit Graphics PDF
Pitch your topic with ease and precision using this horizontal bar graph depicting monthly organizational profit graphics pdf. This layout presents information on horizontal bar graph depicting monthly organizational profit. It is also available for immediate download and adjustment. So, changes can be made in the color, design, graphics or any other component to create a unique layout.
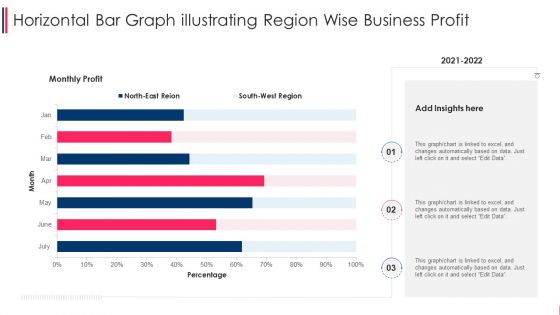
Horizontal Bar Graph Illustrating Region Wise Business Profit Microsoft PDF
Pitch your topic with ease and precision using this horizontal bar graph illustrating region wise business profit microsoft pdf. This layout presents information on horizontal bar graph illustrating region wise business profit. It is also available for immediate download and adjustment. So, changes can be made in the color, design, graphics or any other component to create a unique layout.
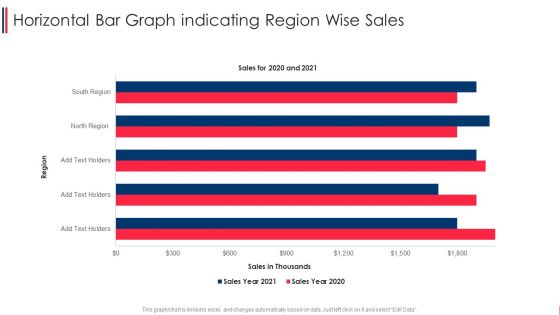
Horizontal Bar Graph Indicating Region Wise Sales Formats PDF
Pitch your topic with ease and precision using this horizontal bar graph indicating region wise sales formats pdf. This layout presents information on horizontal bar graph indicating region wise sales. It is also available for immediate download and adjustment. So, changes can be made in the color, design, graphics or any other component to create a unique layout.

Stacked Horizontal Bar Graph Indicating Organization Quarterly Sales Graphics PDF
Pitch your topic with ease and precision using this stacked horizontal bar graph indicating organization quarterly sales graphics pdf. This layout presents information on stacked horizontal bar graph indicating organization quarterly sales. It is also available for immediate download and adjustment. So, changes can be made in the color, design, graphics or any other component to create a unique layout.
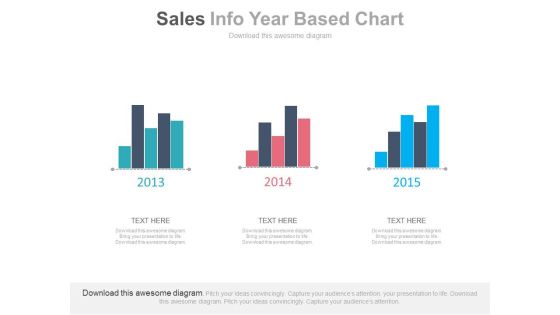
Three Years Sales Data Bar Graph Powerpoint Slides
This PowerPoint template has been designed with bar charts. This business slide may be used to display three years sales data for comparison. Present your views and ideas with this impressive design.
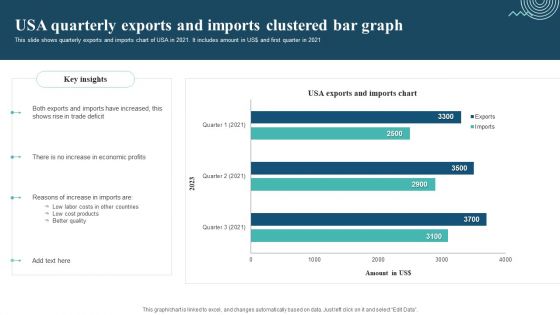
Usa Quarterly Exports And Imports Clustered Bar Graph Designs PDF
This slide shows quarterly exports and imports chart of USA in 2021. It includes amount in US dollar and first quarter in 2021. Pitch your topic with ease and precision using this Usa Quarterly Exports And Imports Clustered Bar Graph Designs PDF. This layout presents information on Exports And Imports, Trade Deficit, Economic Profits. It is also available for immediate download and adjustment. So, changes can be made in the color, design, graphics or any other component to create a unique layout.
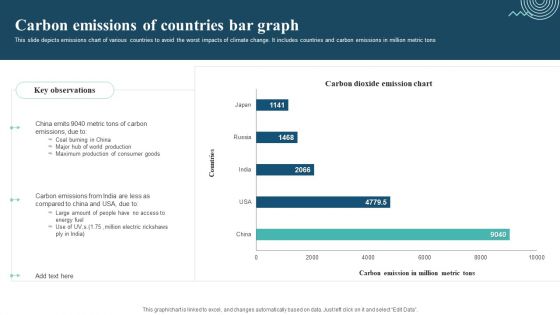
Carbon Emissions Of Countries Bar Graph Professional PDF
This slide depicts emissions chart of various countries to avoid the worst impacts of climate change. It includes countries and carbon emissions in million metric tons. Pitch your topic with ease and precision using this Carbon Emissions Of Countries Bar Graph Professional PDF. This layout presents information on Maximum Production, Consumer Goods, Carbon Emissions. It is also available for immediate download and adjustment. So, changes can be made in the color, design, graphics or any other component to create a unique layout.

Bar Graph For Sales Inflow And Goals Graph Ppt PowerPoint Presentation Infographics Visual Aids PDF
Pitch your topic with ease and precision using this bar graph for sales inflow and goals graph ppt powerpoint presentation infographics visual aids pdf. This layout presents information on sales revenue vs target, new customer, congrats target is met. It is also available for immediate download and adjustment. So, changes can be made in the color, design, graphics or any other component to create a unique layout.
Bar Chart Icon For Financial Ratios Comparison Elements PDF
Presenting bar chart icon for financial ratios comparison elements pdf to dispense important information. This template comprises four stages. It also presents valuable insights into the topics including bar chart icon for financial ratios comparison. This is a completely customizable PowerPoint theme that can be put to use immediately. So, download it and address the topic impactfully.
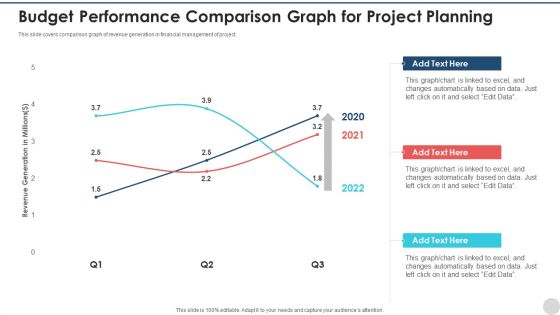
Budget Performance Comparison Graph For Project Planning Pictures PDF
This slide covers comparison graph of revenue generation in financial management of project. Showcasing this set of slides titled budget performance comparison graph for project planning pictures pdf. The topics addressed in these templates are budget performance comparison graph for project planning. All the content presented in this PPT design is completely editable. Download it and make adjustments in color, background, font etc. as per your unique business setting.
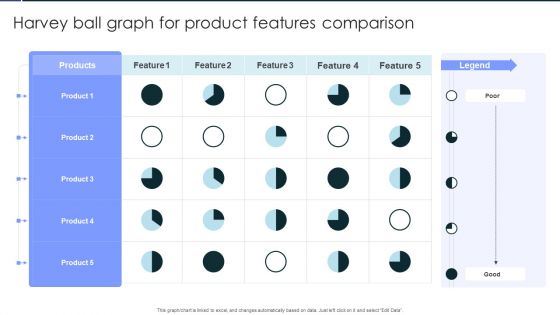
Harvey Ball Graph For Product Features Comparison Rules PDF
Pitch your topic with ease and precision using this Harvey Ball Graph For Product Features Comparison Rules PDF. This layout presents information onHarvey Ball Graph, For Product, Features Comparison. It is also available for immediate download and adjustment. So, changes can be made in the color, design, graphics or any other component to create a unique layout.
Sales Performance Comparison Graph Of Top Customer Icons PDF
This slide shows the customer sales comparison graph along with the units of product purchased by the clients. Showcasing this set of slides titled Sales Performance Comparison Graph Of Top Customer Icons PDF. The topics addressed in these templates are Highest Units, Customer, Product. All the content presented in this PPT design is completely editable. Download it and make adjustments in color, background, font etc. as per your unique business setting.
Graph Comparison Icon For Liquidity Financial Ratios Analysis Summary PDF
Presenting Graph Comparison Icon For Liquidity Financial Ratios Analysis Summary PDF to dispense important information. This template comprises Three stages. It also presents valuable insights into the topics including Graph Comparison, Icon For Liquidity, Financial Ratios Analysis. This is a completely customizable PowerPoint theme that can be put to use immediately. So, download it and address the topic impactfully.

State Wise Customer Sales Performance Comparison Graph Introduction PDF
This slide shows the sales graph of 3 products of a company in various states. It includes five states which are New York, Texas, California, Washington and New Jersey. Showcasing this set of slides titled State Wise Customer Sales Performance Comparison Graph Introduction PDF. The topics addressed in these templates are Lowest Sales, Decrease Demand. All the content presented in this PPT design is completely editable. Download it and make adjustments in color, background, font etc. as per your unique business setting.
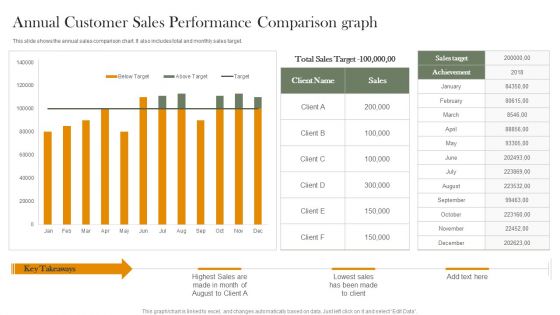
Annual Customer Sales Performance Comparison Graph Portrait PDF
This slide shows the annual sales comparison chart. It also includes total and monthly sales target. Pitch your topic with ease and precision using this Annual Customer Sales Performance Comparison Graph Portrait PDF. This layout presents information on Total Sales Target, Sales Target, Achievement. It is also available for immediate download and adjustment. So, changes can be made in the color, design, graphics or any other component to create a unique layout.
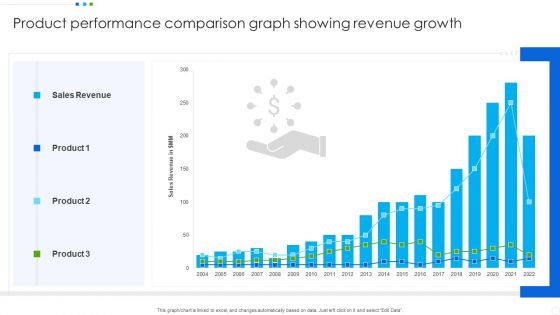
Product Performance Comparison Graph Showing Revenue Growth Portrait PDF
Showcasing this set of slides titled Product Performance Comparison Graph Showing Revenue Growth Portrait PDF. The topics addressed in these templates are Sales Revenue, Product. All the content presented in this PPT design is completely editable. Download it and make adjustments in color, background, font etc. as per your unique business setting.

Sales Growth Comparison Graph Ppt PowerPoint Presentation Outline Demonstration
Presenting this set of slides with name sales growth comparison graph ppt powerpoint presentation outline demonstration. The topics discussed in these slides are sales, business development rep, inside sales rep, field sales rep. This is a completely editable PowerPoint presentation and is available for immediate download. Download now and impress your audience.
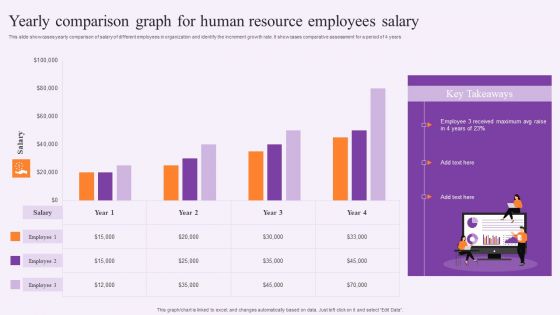
Yearly Comparison Graph For Human Resource Employees Salary Template PDF
This slide showcases yearly comparison of salary of different employees in organization and identify the increment growth rate. It showcases comparative assessment for a period of 4 years. Pitch your topic with ease and precision using this Yearly Comparison Graph For Human Resource Employees Salary Template PDF. This layout presents information on Human Resource, Employees Salary. It is also available for immediate download and adjustment. So, changes can be made in the color, design, graphics or any other component to create a unique layout.
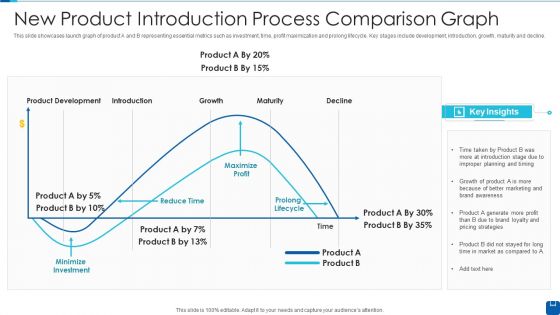
New Product Introduction Process Comparison Graph Slides PDF
This slide showcases launch graph of product A and B representing essential metrics such as investment, time, profit maximization and prolong lifecycle. Key stages include development, introduction, growth, maturity and decline.Showcasing this set of slides titled New Product Introduction Process Comparison Graph Slides PDF The topics addressed in these templates are Product Development, Improper Planning, Minimize Investment All the content presented in this PPT design is completely editable. Download it and make adjustments in color, background, font etc. as per your unique business setting.

Line Comparison Graph For Yearly Liquidity Ratio Analysis Comparison Topics PDF
This slide showcases liquidity ratios graph that can help in identifying cash richness and financial position of organization. It showcases comparison for last 6 years and it key components are current ratio, quick ratio and cash ratio. Showcasing this set of slides titled Line Comparison Graph For Yearly Liquidity Ratio Analysis Comparison Topics PDF. The topics addressed in these templates are Term Financing, Cash Shortage, Cash Ratio. All the content presented in this PPT design is completely editable. Download it and make adjustments in color, background, font etc. as per your unique business setting.
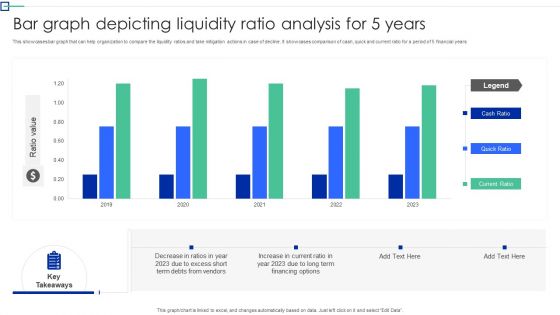
Bar Graph Depicting Liquidity Ratio Analysis For 5 Years Graphics PDF
This showcases bar graph that can help organization to compare the liquidity ratios and take mitigation actions in case of decline. It showcases comparison of cash, quick and current ratio for a period of 5 financial years. Showcasing this set of slides titled Bar Graph Depicting Liquidity Ratio Analysis For 5 Years Graphics PDF. The topics addressed in these templates are Organization To Compare, The Liquidity Ratios, Mitigation Action Decline. All the content presented in this PPT design is completely editable. Download it and make adjustments in color, background, font etc. as per your unique business setting.

Comparison Ppt PowerPoint Presentation Ideas Show
This is a comparison ppt powerpoint presentation ideas show. This is a two stage process. The stages in this process are comparison, bar graph, growth, management, business.
Bar Graph And Line Chart For Comparative Analysis Icon Ppt PowerPoint Presentation Gallery Infographics PDF
Showcasing this set of slides titled bar graph and line chart for comparative analysis icon ppt powerpoint presentation gallery infographics pdf. The topics addressed in these templates are bar graph and line chart for comparative analysis icon. All the content presented in this PPT design is completely editable. Download it and make adjustments in color, background, font etc. as per your unique business setting.
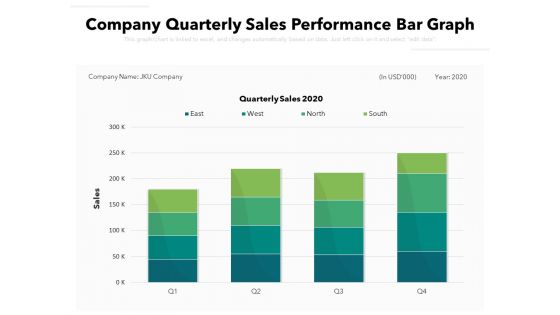
Company Quarterly Sales Performance Bar Graph Ppt PowerPoint Presentation File Templates PDF
Pitch your topic with ease and precision using this company quarterly sales performance bar graph ppt powerpoint presentation file templates pdf. This layout presents information on company quarterly sales performance bar graph. It is also available for immediate download and adjustment. So, changes can be made in the color, design, graphics or any other component to create a unique layout.
Bar Graph Showing Income Of Business Segments Ppt PowerPoint Presentation Icon Example PDF
Pitch your topic with ease and precision using this bar graph showing income of business segments ppt powerpoint presentation icon example pdf. This layout presents information on bar graph showing income of business segments. It is also available for immediate download and adjustment. So, changes can be made in the color, design, graphics or any other component to create a unique layout.
Bar Graph For Data Representation With Detailed Legends Ppt PowerPoint Presentation Icon Example PDF
Pitch your topic with ease and precision using this bar graph for data representation with detailed legends ppt powerpoint presentation icon example pdf. This layout presents information on bar graph for data representation with detailed legends. It is also available for immediate download and adjustment. So, changes can be made in the color, design, graphics or any other component to create a unique layout.

Business Revenue Bar Graph With Business Operational Expenditure Details Summary PDF
This slide represents business revenue bar graph with OPEX details which can be referred by companies to earn more revenue by controlling expenditures. It also provides information about marketing and sales, research and development, administration, total revenue, etc. Pitch your topic with ease and precision using this Business Revenue Bar Graph With Business Operational Expenditure Details Summary PDF. This layout presents information on Cost Of Marketing, Sales, Highest Amount. It is also available for immediate download and adjustment. So, changes can be made in the color, design, graphics or any other component to create a unique layout.
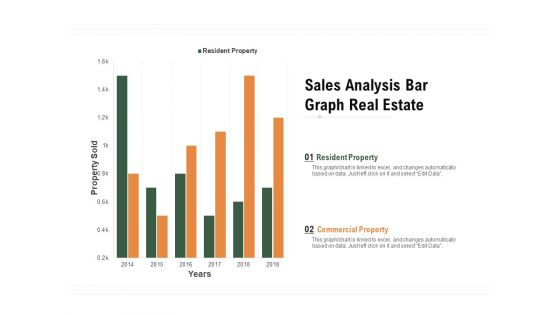
Sales Analysis Bar Graph Real Estate Ppt PowerPoint Presentation Infographic Template Show PDF
Pitch your topic with ease and precision using this sales analysis bar graph real estate ppt powerpoint presentation infographic template show pdf. This layout presents information on resident property, commercial property, property sold, 2014 to 2018. It is also available for immediate download and adjustment. So, changes can be made in the color, design, graphics or any other component to create a unique layout.
Downturn Graph Icon With Bar Chart And Arrow Ppt PowerPoint Presentation Slides Design Templates PDF
Pitch your topic with ease and precision using this downturn graph icon with bar chart and arrow ppt powerpoint presentation slides design templates pdf. This layout presents information on downturn graph icon with bar chart and arrow. It is also available for immediate download and adjustment. So, changes can be made in the color, design, graphics or any other component to create a unique layout.

Cost Reduction Bar Graph For Organization Optimization Ppt Inspiration Vector PDF
This slide represent cost saving with benefits in an organization and areas where more efficiencies are utilized. It includes travel, administrative and hiring. Pitch your topic with ease and precision using this Cost Reduction Bar Graph For Organization Optimization Ppt Inspiration Vector PDF. This layout presents information on Total Cost Benefits, Promoting Employees, Providing Perks. It is also available for immediate download and adjustment. So, changes can be made in the color, design, graphics or any other component to create a unique layout.

Success Bar Graph With Growth Arrow New Year PowerPoint Templates Ppt Backgrounds For Slides 1112
We present our Success Bar Graph With Growth Arrow New Year PowerPoint Templates PPT Backgrounds For Slides 1112.Present our New Year PowerPoint Templates because this is a time to reflect and retrospect on successes and failures. Present our Arrows PowerPoint Templates because you have to coordinate and motivate your team. Download and present our Business PowerPoint Templates because this layout helps you to bring some important aspects of your business process to the notice of all concerned. Streamline the flow of information across the board. Download our Finance PowerPoint Templates because you can Highlight the key components of your entire manufacturing/ business process. Download our Success PowerPoint Templates because you can Ring them out loud with your brilliant ideas.Use these PowerPoint slides for presentations relating to Bar graph with growth arrow, new year, success, business, finance, arrows. The prominent colors used in the PowerPoint template are Yellow, Black, Gray. Professionals tell us our Success Bar Graph With Growth Arrow New Year PowerPoint Templates PPT Backgrounds For Slides 1112 are Energetic. Presenters tell us our success PowerPoint templates and PPT Slides are Spectacular. We assure you our Success Bar Graph With Growth Arrow New Year PowerPoint Templates PPT Backgrounds For Slides 1112 are Liberated. You can be sure our success PowerPoint templates and PPT Slides are Youthful. PowerPoint presentation experts tell us our Success Bar Graph With Growth Arrow New Year PowerPoint Templates PPT Backgrounds For Slides 1112 are Breathtaking. Use our business PowerPoint templates and PPT Slides are Romantic.

Bar Graph Representing Macroeconomic Analysis Employment Change By Industry Background PDF
This slide focuses on the graphical presentation of macroeconomic indicator such as employment rate of different industries which includes service providing and goods producing industries which includes healthcare and social assistance, construction, manufacturing industry, etc. Pitch your topic with ease and precision using this Bar Graph Representing Macroeconomic Analysis Employment Change By Industry Background PDF. This layout presents information on Goods Producing, Service Providing, Financial, Business. It is also available for immediate download and adjustment. So, changes can be made in the color, design, graphics or any other component to create a unique layout.
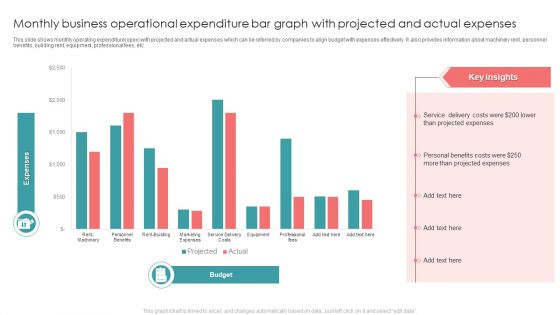
Monthly Business Operational Expenditure Bar Graph With Projected And Actual Expenses Introduction PDF
This slide shows monthly operating expenditure opex with projected and actual expenses which can be referred by companies to align budget with expenses effectively. It also provides information about machinery rent, personnel benefits, building rent, equipment, professional fees, etc. Pitch your topic with ease and precision using this Monthly Business Operational Expenditure Bar Graph With Projected And Actual Expenses Introduction PDF. This layout presents information on Projected Expenses, Costs, Service. It is also available for immediate download and adjustment. So, changes can be made in the color, design, graphics or any other component to create a unique layout.
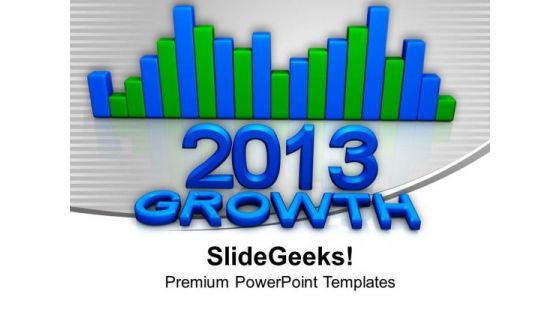
2013 Bar Graph Growth Concept Marketing PowerPoint Templates Ppt Backgrounds For Slides 1112
We present our 2013 Bar graph Growth Concept Marketing PowerPoint Templates PPT Backgrounds For Slides 1112.Download and present our Finance PowerPoint Templates because you can Churn the wheels of the brains of your colleagues. Present our Business PowerPoint Templates because it will demonstrate the strength of character under severe stress. Shine the torch ahead and bring the light to shine on all. Present our Success PowerPoint Templates because you have come up with a brilliant breakthrough idea. you can also visualise the interest it will generate. Present our Marketing PowerPoint Templates because you are the Champion of your team shall anoint. Download our Money PowerPoint Templates because you can Highlight the key components of your entire manufacturing/ business process.Use these PowerPoint slides for presentations relating to Business growth per year 2013, business, finance, marketing, money, success. The prominent colors used in the PowerPoint template are Green, Blue, Black. People tell us our 2013 Bar graph Growth Concept Marketing PowerPoint Templates PPT Backgrounds For Slides 1112 are Colorful. Presenters tell us our per PowerPoint templates and PPT Slides are Wistful. PowerPoint presentation experts tell us our 2013 Bar graph Growth Concept Marketing PowerPoint Templates PPT Backgrounds For Slides 1112 are Awesome. Customers tell us our marketing PowerPoint templates and PPT Slides are Bold. Customers tell us our 2013 Bar graph Growth Concept Marketing PowerPoint Templates PPT Backgrounds For Slides 1112 are Stylish. Customers tell us our marketing PowerPoint templates and PPT Slides will help them to explain complicated concepts.
Business Performance Gap Assessment With Bar Graph Representation Ppt PowerPoint Presentation Icon Deck PDF
Pitch your topic with ease and precision using this business performance gap assessment with bar graph representation ppt powerpoint presentation icon deck pdf. This layout presents information on initiatives, standardization, industry. It is also available for immediate download and adjustment. So, changes can be made in the color, design, graphics or any other component to create a unique layout.
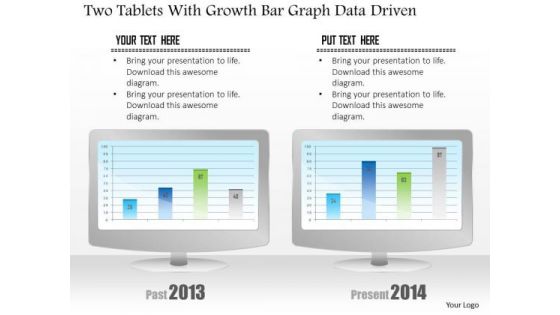
Business Diagram Two Tablets With Growth Bar Graph Data Driven PowerPoint Slide
This business diagram has been designed with comparative charts on tablets. This slide suitable for data representation. You can also use this slide to present business reports and information. Use this diagram to present your views in a wonderful manner.

Bar Chart Showing Income Comparison Of Different Years Ppt PowerPoint Presentation Gallery Ideas PDF
Presenting this set of slides with name bar chart showing income comparison of different years ppt powerpoint presentation gallery ideas pdf. The topics discussed in these slides are revenue of first 6 months, revenue of last 6 months. This is a completely editable PowerPoint presentation and is available for immediate download. Download now and impress your audience.

Data Analysis In Excel 3d Bar Chart For Comparison Of Time Series PowerPoint Templates
Double Your Chances With Our data analysis in excel 3d bar chart for comparison of time series Powerpoint Templates . The Value Of Your Thoughts Will Increase Two-Fold.
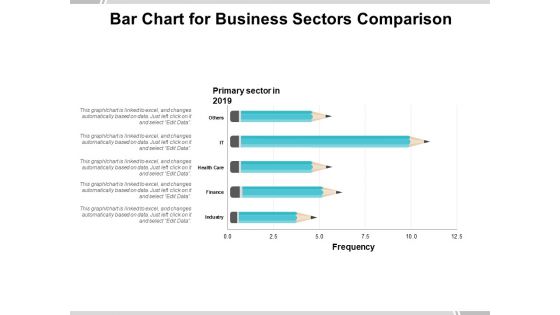
Bar Chart For Business Sectors Comparison Ppt PowerPoint Presentation Professional Guide
Presenting this set of slides with name bar chart for business sectors comparison ppt powerpoint presentation professional guide. The topics discussed in these slides are education, growth, pencil bar graph. This is a completely editable PowerPoint presentation and is available for immediate download. Download now and impress your audience.

3D Bar Chart For Percentage Values Comparison Ppt PowerPoint Presentation Professional Visual Aids
This is a 3d bar chart for percentage values comparison ppt powerpoint presentation professional visual aids. This is a five stage process. The stages in this process are art, colouring, paint brush.
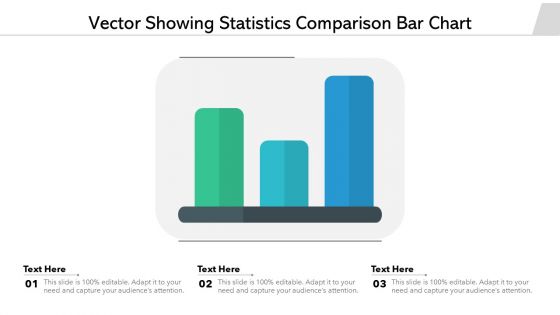
Vector Showing Statistics Comparison Bar Chart Ppt Visual Aids Styles PDF
Persuade your audience using this Vector Showing Statistics Comparison Bar Chart Ppt Visual Aids Styles PDF. This PPT design covers three stages, thus making it a great tool to use. It also caters to a variety of topics including vector showing statistics comparison bar chart. Download this PPT design now to present a convincing pitch that not only emphasizes the topic but also showcases your presentation skills.
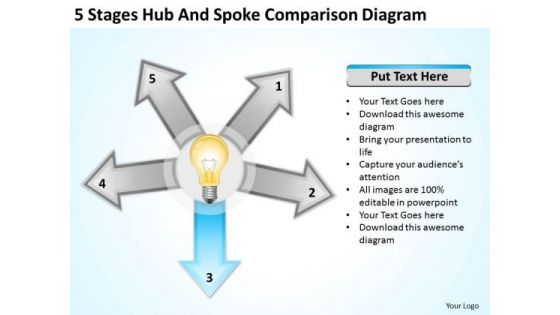
5 Stages Hub And Spoke Comparison Diagram Business Plan For Bar PowerPoint Templates
We present our 5 stages hub and spoke comparison diagram business plan for bar PowerPoint templates.Download our Technology PowerPoint Templates because Our PowerPoint Templates and Slides are created by a hardworking bunch of busybees. Always flitting around with solutions gauranteed to please. Present our Business PowerPoint Templates because Your audience will believe you are the cats whiskers. Download our Process and Flows PowerPoint Templates because You can Create a matrix with our PowerPoint Templates and Slides. Feel the strength of your ideas click into place. Download and present our Marketing PowerPoint Templates because You can Zap them with our PowerPoint Templates and Slides. See them reel under the impact. Use our Arrows PowerPoint Templates because It is Aesthetically crafted by artistic young minds. Our PowerPoint Templates and Slides are designed to display your dexterity.Use these PowerPoint slides for presentations relating to Experiment, spreadsheet, sociology, line chart, conclusion, pie chart, mathematics, innovation, sociological, business, bulb, concept, arrow, presentation, symbol, diagram, social, discovery, process, analysis, report, marketing, intelligent, creative, visualization, mathematical formula, trends, thinking, summary, infographic, exploration, information, conceptual, quantified, exploratory, business. The prominent colors used in the PowerPoint template are Blue, Yellow, White.
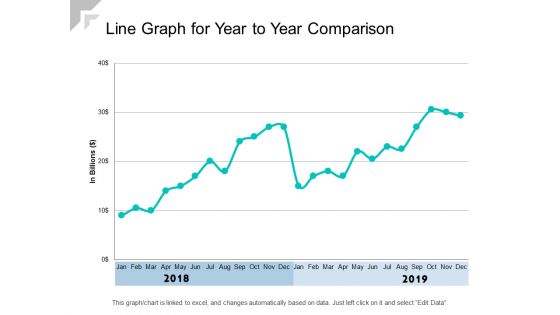
Line Graph For Year To Year Comparison Ppt PowerPoint Presentation Show Graphics Example
Presenting this set of slides with name line graph for year to year comparison ppt powerpoint presentation show graphics example. The topics discussed in these slides are revenue trend, bar chart, financial. This is a completely editable PowerPoint presentation and is available for immediate download. Download now and impress your audience.

Graph Showing Income Comparison Of Different Companies In Years Ppt PowerPoint Presentation Gallery Clipart PDF
Presenting this set of slides with name graph showing income comparison of different companies in years ppt powerpoint presentation gallery clipart pdf. The topics discussed in these slide is graph showing income comparison of different companies in years. This is a completely editable PowerPoint presentation and is available for immediate download. Download now and impress your audience.

Current And Quick Ratio Comparison Graph For Liquidity Assessment Structure PDF
This slide showcases current and quick ratio graph that can help to evaluate companys liquidity and and assess the company abilities to pay off debt. It also showcases comparison of ratio with previous financial year. Showcasing this set of slides titled Current And Quick Ratio Comparison Graph For Liquidity Assessment Structure PDF. The topics addressed in these templates are Short Term Debt, Delayed Payments, Cash Shortage. All the content presented in this PPT design is completely editable. Download it and make adjustments in color, background, font etc. as per your unique business setting.

Monthly Comparison Graph For Operating And Gross Profit Margin Pictures PDF
This slide showcases monthly comparison graph that can help organization to compare the profits margin generated in different months. Its key components are gross, operating and net profit margin. Showcasing this set of slides titled Monthly Comparison Graph For Operating And Gross Profit Margin Pictures PDF. The topics addressed in these templates are Gross Profit Margin, Operating Profit Margin, Net Profit Margin. All the content presented in this PPT design is completely editable. Download it and make adjustments in color, background, font etc. as per your unique business setting.

Economic Facts And Insights Graph For Revenue Comparison Ppt PowerPoint Presentation Gallery Portfolio PDF
Pitch your topic with ease and precision using this economic facts and insights graph for revenue comparison ppt powerpoint presentation gallery portfolio pdf. This layout presents information on year 2021, revenue, key insights. It is also available for immediate download and adjustment. So, changes can be made in the color, design, graphics or any other component to create a unique layout.
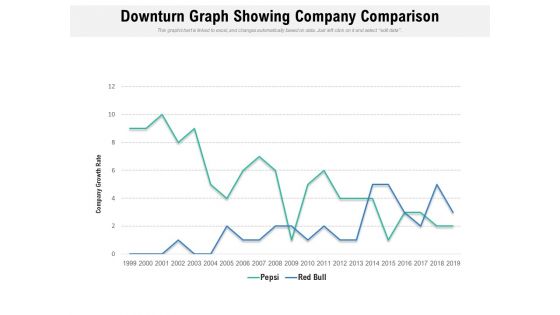
Downturn Graph Showing Company Comparison Ppt PowerPoint Presentation Professional Graphics Design PDF
Pitch your topic with ease and precision using this downturn graph showing company comparison ppt powerpoint presentation professional graphics design pdf. This layout presents information on company growth rate, red bull, pepsi. It is also available for immediate download and adjustment. So, changes can be made in the color, design, graphics or any other component to create a unique layout.
Gross And Net Revenue Comparison Shown By Graph Ppt PowerPoint Presentation File Icons PDF
Presenting this set of slides with name gross and net revenue comparison shown by graph ppt powerpoint presentation file icons pdf. The topics discussed in these slides are gross profit, net profit. This is a completely editable PowerPoint presentation and is available for immediate download. Download now and impress your audience.
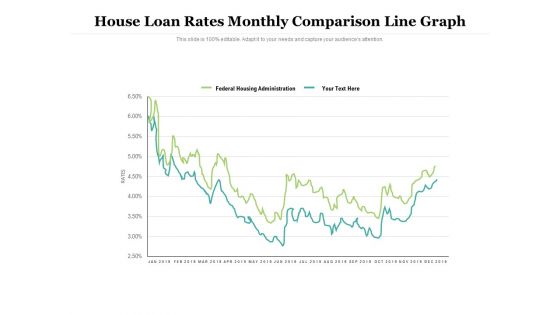
House Loan Rates Monthly Comparison Line Graph Ppt PowerPoint Presentation Slides Graphics Pictures PDF
Showcasing this set of slides titled house loan rates monthly comparison line graph ppt powerpoint presentation slides graphics pictures pdf. The topics addressed in these templates are federal housing administration, house loan rates, line graph. All the content presented in this PPT design is completely editable. Download it and make adjustments in color, background, font etc. as per your unique business setting.
Expenses And Income Comparison Graph With Budget Summary Ppt PowerPoint Presentation Icon Inspiration PDF
This slide illustrates budget summary of expenditure of a company. it includes income and expenditure comparative data and expenditure chart etc.Pitch your topic with ease and precision using this Expenses And Income Comparison Graph With Budget Summary Ppt PowerPoint Presentation Icon Inspiration PDF. This layout presents information on Budget Summary, Expenditure Comparative, Actual Income. It is also available for immediate download and adjustment. So, changes can be made in the color, design, graphics or any other component to create a unique layout.

Comparison Of Social Media Platforms To Run Online Ads Ppt PowerPoint Presentation Diagram Graph Charts PDF
This slide showcases comparative assessment of social media channels which can help marketers to identify ideal platform for running ad campaigns. Its key components are platform, worldwide users, user demographics, B2B and B2C Slidegeeks is here to make your presentations a breeze with Comparison Of Social Media Platforms To Run Online Ads Ppt PowerPoint Presentation Diagram Graph Charts PDF With our easy to use and customizable templates, you can focus on delivering your ideas rather than worrying about formatting. With a variety of designs to choose from, you are sure to find one that suits your needs. And with animations and unique photos, illustrations, and fonts, you can make your presentation pop. So whether you are giving a sales pitch or presenting to the board, make sure to check out Slidegeeks first.

Contrast Circle Graph Comparison Circular Shape Ppt PowerPoint Presentation Complete Deck
If designing a presentation takes a lot of your time and resources and you are looking for a better alternative, then this contrast circle graph comparison circular shape ppt powerpoint presentation complete deck is the right fit for you. This is a prefabricated set that can help you deliver a great presentation on the topic. All the ten slides included in this sample template can be used to present a birds-eye view of the topic. These slides are also fully editable, giving you enough freedom to add specific details to make this layout more suited to your business setting. Apart from the content, all other elements like color, design, theme are also replaceable and editable. This helps in designing a variety of presentations with a single layout. Not only this, you can use this PPT design in formats like PDF, PNG, and JPG once downloaded. Therefore, without any further ado, download and utilize this sample presentation as per your liking.
Bar Graph And Pie Charts For Business Reports Vector Icon Ppt PowerPoint Presentation Show Graphics Tutorials PDF
Pitch your topic with ease and precision using this bar graph and pie charts for business reports vector icon ppt powerpoint presentation show graphics tutorials pdf. This layout presents information on bar graph and pie charts for business reports vector icon. It is also available for immediate download and adjustment. So, changes can be made in the color, design, graphics or any other component to create a unique layout.

Comparison Template PDF
Deliver an awe inspiring pitch with this creative comparison template pdf bundle. Topics like comparison can be discussed with this completely editable template. It is available for immediate download depending on the needs and requirements of the user.

Comparison Brochure PDF
Deliver an awe inspiring pitch with this creative comparison brochure pdf bundle. Topics like comparison can be discussed with this completely editable template. It is available for immediate download depending on the needs and requirements of the user.

Comparison Information PDF
Deliver and pitch your topic in the best possible manner with this comparison information pdf. Use them to share invaluable insights on comparison and impress your audience. This template can be altered and modified as per your expectations. So, grab it now.
Comparison Icons PDF
Deliver and pitch your topic in the best possible manner with this comparison icons pdf. Use them to share invaluable insights on male population, female population and impress your audience. This template can be altered and modified as per your expectations. So, grab it now.
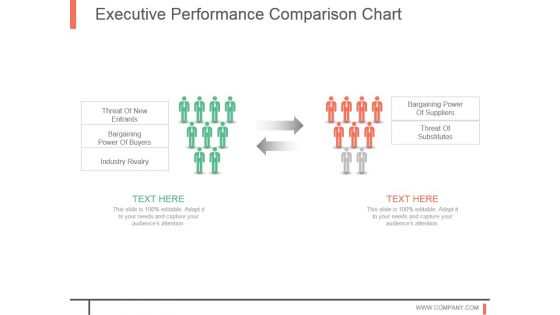
Executive Performance Comparison Chart
This is a executive performance comparison chart. This is a two stage process. The stages in this process are threat of new entrants, bargaining power of buyers, industry rivalry, bargaining power of suppliers, threat of substitutes.

Clustered Bar Ppt PowerPoint Presentation Pictures Demonstration
This is a clustered bar ppt powerpoint presentation pictures demonstration. This is a two stage process. The stages in this process are clustered bar, finance, marketing, analysis, business.
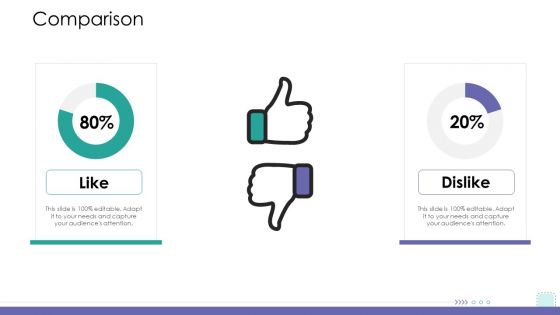
Corporate Governance Comparison Structure PDF
Deliver an awe inspiring pitch with this creative corporate governance comparison structure pdf bundle. Topics like comparison can be discussed with this completely editable template. It is available for immediate download depending on the needs and requirements of the user.
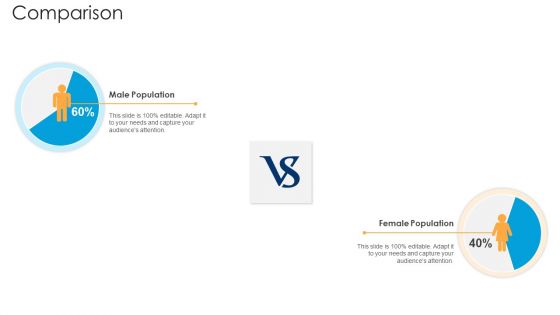
Comparison Ppt Styles Inspiration PDF
Deliver an awe-inspiring pitch with this creative comparison ppt styles inspiration pdf. bundle. Topics like comparison can be discussed with this completely editable template. It is available for immediate download depending on the needs and requirements of the user.
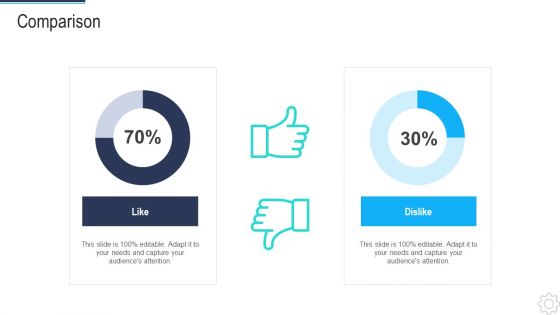
DSDM IT Comparison Slides PDF
Deliver an awe inspiring pitch with this creative dsdm it comparison slides pdf bundle. Topics like comparison can be discussed with this completely editable template. It is available for immediate download depending on the needs and requirements of the user.

Comparison Ppt Layouts Outline PDF
Deliver and pitch your topic in the best possible manner with this comparison ppt layouts outline pdf. Use them to share invaluable insights on comparison and impress your audience. This template can be altered and modified as per your expectations. So, grab it now.

Comparison Ppt Pictures Deck PDF
Deliver and pitch your topic in the best possible manner with this comparison ppt pictures deck pdf. Use them to share invaluable insights on comparison and impress your audience. This template can be altered and modified as per your expectations. So, grab it now.
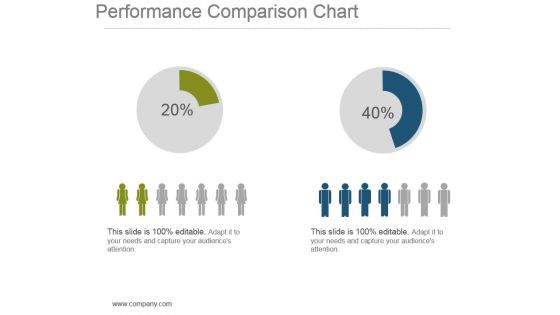
Performance Comparison Chart Powerpoint Show
This is a performance comparison chart powerpoint show. This is a two stage process. The stages in this process are finance, compare, strategy, management, planning.

Comparison Ppt PowerPoint Presentation Inspiration
This is a comparison ppt powerpoint presentation inspiration. This is a two stage process. The stages in this process are arrows, business, marketing, management, strategy, success.
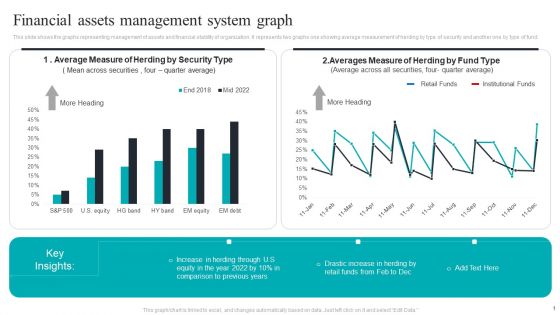
Financial Assets Management System Graph Structure PDF
This slide shows the graphs representing management of assets and financial stability of organization. It represents two graphs one showing average measurement of herding by type of security and another one by type of fund. Pitch your topic with ease and precision using this Financial Assets Management System Graph Structure PDF. This layout presents information on Financial Assets, Management System Graph. It is also available for immediate download and adjustment. So, changes can be made in the color, design, graphics or any other component to create a unique layout.
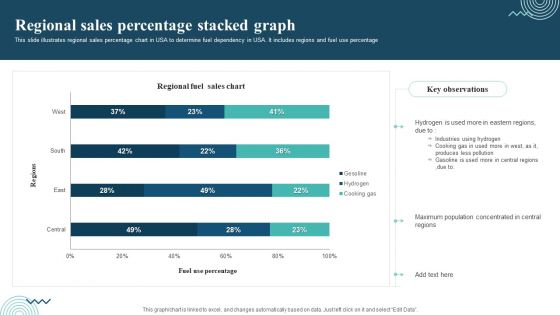
Regional Sales Percentage Stacked Graph Themes PDF
This slide illustrates regional sales percentage chart in USA to determine fuel dependency in USA. It includes regions and fuel use percentage. Pitch your topic with ease and precision using this Regional Sales Percentage Stacked Graph Themes PDF. This layout presents information on Regional Sales, Industries Using Hydrogen, Cooking Gas. It is also available for immediate download and adjustment. So, changes can be made in the color, design, graphics or any other component to create a unique layout.
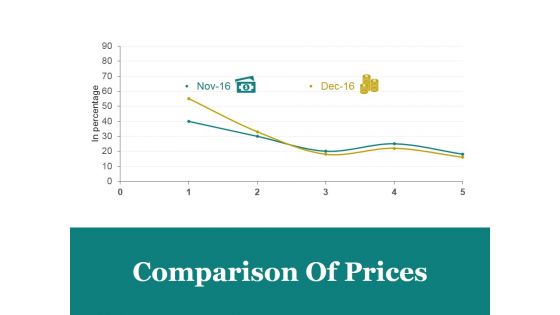
Comparison Of Prices Ppt PowerPoint Presentation Designs Download
This is a comparison of prices ppt powerpoint presentation designs download. This is a two stage process. The stages in this process are comparison of prices, marketing, in percentage, bar graph, business.
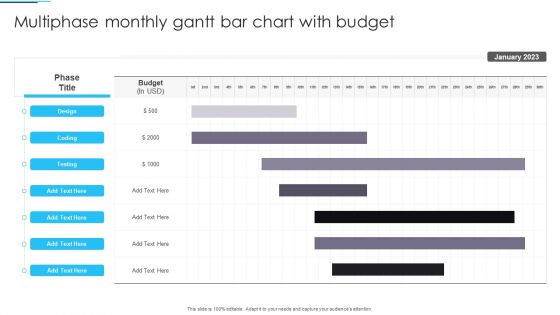
Multiphase Monthly Gantt Bar Chart With Budget Clipart PDF
Pitch your topic with ease and precision using this Multiphase Monthly Gantt Bar Chart With Budget Clipart PDF. This layout presents information on Gantt Bar Chart, Budget. It is also available for immediate download and adjustment. So, changes can be made in the color, design, graphics or any other component to create a unique layout.
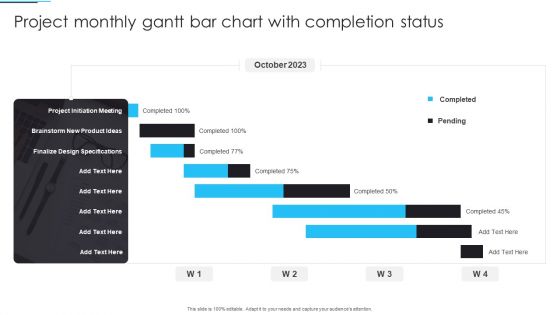
Project Monthly Gantt Bar Chart With Completion Status Infographics PDF
Pitch your topic with ease and precision using this Project Monthly Gantt Bar Chart With Completion Status Infographics PDF. This layout presents information on Project, Monthly Gantt Bar Chart. It is also available for immediate download and adjustment. So, changes can be made in the color, design, graphics or any other component to create a unique layout.

Sales Target Monitoring Monthly Gantt Bar Chart Ideas PDF
Pitch your topic with ease and precision using this Sales Target Monitoring Monthly Gantt Bar Chart Ideas PDF. This layout presents information on Sales Target Monitoring, Monthly Gantt Bar Chart. It is also available for immediate download and adjustment. So, changes can be made in the color, design, graphics or any other component to create a unique layout.
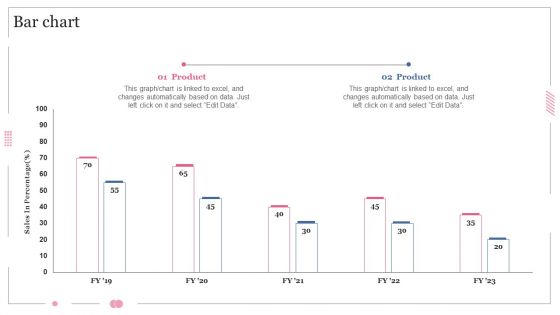
Bar Chart Software Designing And Development Playbook Ideas PDF
Presenting this PowerPoint presentation, titled Bar Chart Software Designing And Development Playbook Ideas PDF, with topics curated by our researchers after extensive research. This editable presentation is available for immediate download and provides attractive features when used. Download now and captivate your audience. Presenting this Bar Chart Software Designing And Development Playbook Ideas PDF. Our researchers have carefully researched and created these slides with all aspects taken into consideration. This is a completely customizable Bar Chart Software Designing And Development Playbook Ideas PDF that is available for immediate downloading. Download now and make an impact on your audience. Highlight the attractive features available with our PPTs.

Business Environment Components Bar Chart Ppt Professional Format Ideas PDF
Presenting this set of slides with name business environment components bar chart ppt professional format ideas pdf. The topics discussed in these slides are product 01, product 02. This is a completely editable PowerPoint presentation and is available for immediate download. Download now and impress your audience.
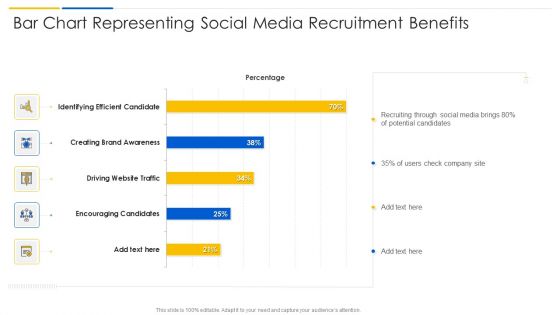
Bar Chart Representing Social Media Recruitment Benefits Infographics PDF
Pitch your topic with ease and precision using this bar chart representing social media recruitment benefits infographics pdf. This layout presents information on encouraging candidates, driving website traffic, creating brand awareness. It is also available for immediate download and adjustment. So, changes can be made in the color, design, graphics or any other component to create a unique layout.
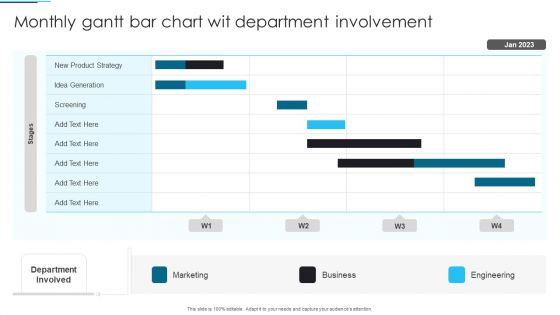
Monthly Gantt Bar Chart Wit Department Involvement Inspiration PDF
Pitch your topic with ease and precision using this Monthly Gantt Bar Chart Wit Department Involvement Inspiration PDF. This layout presents information on Product Strategy, Business, Marketing. It is also available for immediate download and adjustment. So, changes can be made in the color, design, graphics or any other component to create a unique layout.
Comparison Between Two Graphs On Board Icon Ppt Portfolio Professional PDF
Presenting Comparison Between Two Graphs On Board Icon Ppt Portfolio Professional PDF to dispense important information. This template comprises three stages. It also presents valuable insights into the topics including comparison between two graphs on board icon. This is a completely customizable PowerPoint theme that can be put to use immediately. So, download it and address the topic impactfully.
Stacked Bar Chart Ppt PowerPoint Presentation Complete Deck With Slides
This Stacked Bar Chart Ppt PowerPoint Presentation Complete Deck With Slides acts as backup support for your ideas, vision, thoughts, etc. Use it to present a thorough understanding of the topic. This PPT slideshow can be utilized for both in-house and outside presentations depending upon your needs and business demands. Entailing eleven slides with a consistent design and theme, this template will make a solid use case. As it is intuitively designed, it suits every business vertical and industry. All you have to do is make a few tweaks in the content or any other component to design unique presentations. The biggest advantage of this complete deck is that it can be personalized multiple times once downloaded. The color, design, shapes, and other elements are free to modify to add personal touches. You can also insert your logo design in this PPT layout. Therefore a well-thought and crafted presentation can be delivered with ease and precision by downloading this Stacked Bar Chart Ppt PowerPoint Presentation Complete Deck With Slides PPT slideshow.
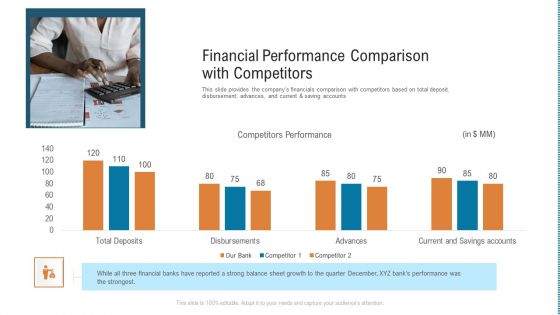
Financial Performance Comparison With Competitors Rules PDF
This slide provides the companys financials comparison with competitors based on total deposit, disbursement, advances, and current and saving accounts. Deliver an awe-inspiring pitch with this creative financial performance comparison with competitors rules pdf. bundle. Topics like financial performance comparison with competitors can be discussed with this completely editable template. It is available for immediate download depending on the needs and requirements of the user.

Operating Cost Comparison Analysis Labor Structure PDF
The table shows the operating cost comparison between the home country, country A and country B in million USD, wherein the home country is the most expensive. Deliver an awe inspiring pitch with this creative operating cost comparison analysis labor structure pdf bundle. Topics like operating cost comparison analysis can be discussed with this completely editable template. It is available for immediate download depending on the needs and requirements of the user.
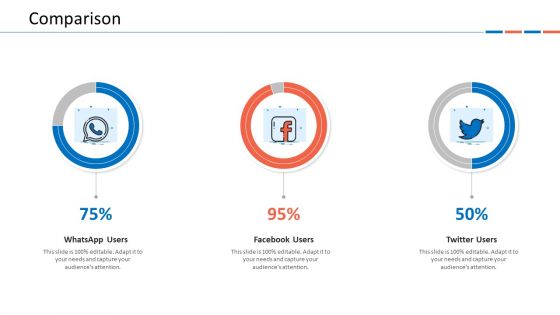
Customer Relationship Management Dashboard Comparison Formats PDF
Deliver an awe inspiring pitch with this creative customer relationship management dashboard comparison formats pdf bundle. Topics like comparison can be discussed with this completely editable template. It is available for immediate download depending on the needs and requirements of the user.
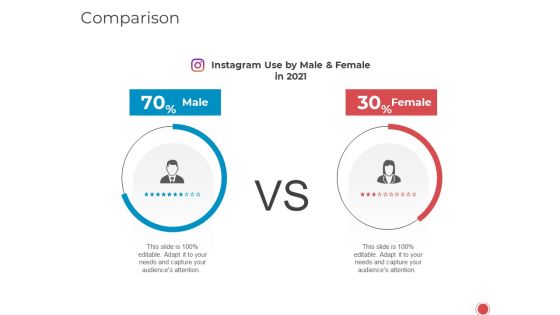
Introduce Yourself Comparison Ppt Professional Sample PDF
Deliver an awe inspiring pitch with this creative introduce yourself comparison ppt professional sample pdf bundle. Topics like comparison can be discussed with this completely editable template. It is available for immediate download depending on the needs and requirements of the user.
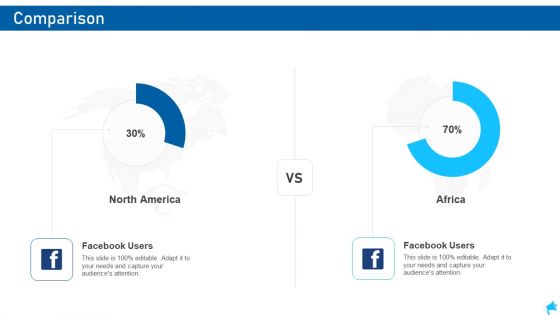
Social Media Marketing Comparison Sample PDF
Deliver and pitch your topic in the best possible manner with this social media marketing comparison sample pdf. Use them to share invaluable insights on comparison and impress your audience. This template can be altered and modified as per your expectations. So, grab it now.
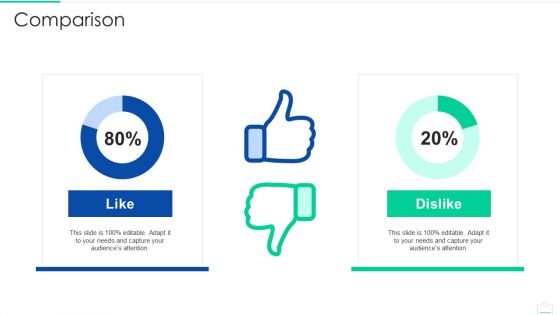
Market Area Analysis Comparison Slides PDF
Deliver an awe inspiring pitch with this creative market area analysis comparison slides pdf bundle. Topics like comparison can be discussed with this completely editable template. It is available for immediate download depending on the needs and requirements of the user.

Food Company Overview Competitor Comparison Infographics PDF
The slide highlights the competitor comparison for top competitors. It compares companies on the basis of global market share, revenue, employee count, service area, number of brands and total sales.Deliver and pitch your topic in the best possible manner with this Food Company Overview Competitor Comparison Infographics PDF. Use them to share invaluable insights on Currently Serves, Quantum Foods, Key Insights and impress your audience. This template can be altered and modified as per your expectations. So, grab it now.
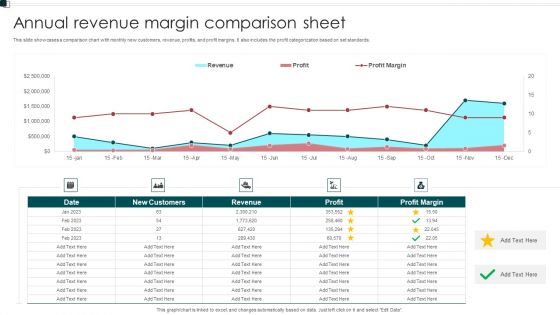
Annual Revenue Margin Comparison Sheet Information PDF
This slide showcases a comparison chart with monthly new customers, revenue, profits, and profit margins. It also includes the profit categorization based on set standards. Showcasing this set of slides titled Annual Revenue Margin Comparison Sheet Information PDF. The topics addressed in these templates are Customers, Revenue, Profit Margin. All the content presented in this PPT design is completely editable. Download it and make adjustments in color, background, font etc. as per your unique business setting.
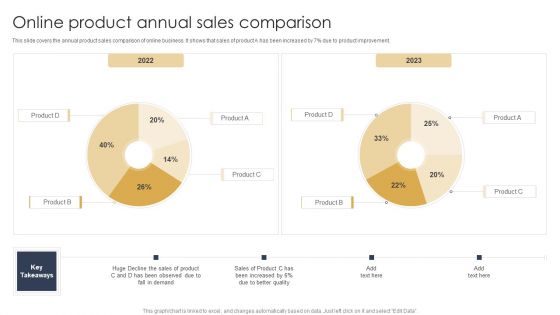
Online Product Annual Sales Comparison Brochure PDF
This slide covers the annual product sales comparison of online business. It shows that sales of product A has been increased by 7 percent due to product improvement. Showcasing this set of slides titled Online Product Annual Sales Comparison Brochure PDF. The topics addressed in these templates are Demand, Sales Of Product, Quality. All the content presented in this PPT design is completely editable. Download it and make adjustments in color, background, font etc. as per your unique business setting.
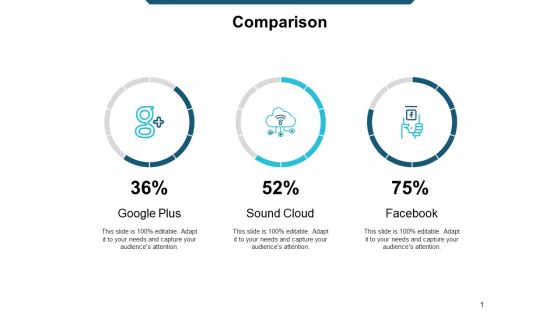
Comparison Management Ppt Powerpoint Presentation Styles Vector
This is a comparison management ppt powerpoint presentation styles vector. The topics discussed in this diagram are finance, marketing, management, investment, analysis. This is a completely editable PowerPoint presentation, and is available for immediate download.
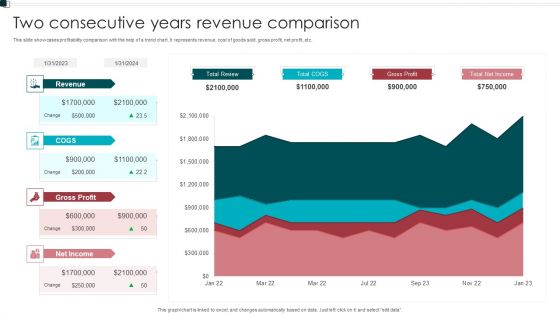
Two Consecutive Years Revenue Comparison Topics PDF
This slide showcases profitability comparison with the help of a trend chart. It represents revenue, cost of goods sold, gross profit, net profit, etc. Pitch your topic with ease and precision using this Two Consecutive Years Revenue Comparison Topics PDF. This layout presents information on Revenue, Gross Profit, Net Income. It is also available for immediate download and adjustment. So, changes can be made in the color, design, graphics or any other component to create a unique layout.
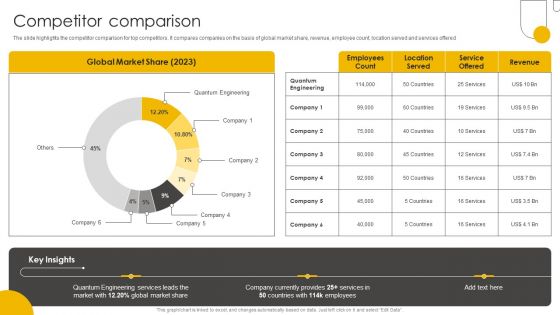
Engineering Enterprise Competitive Competitor Comparison Topics PDF
The slide highlights the competitor comparison for top competitors. It compares companies on the basis of global market share, revenue, employee count, location served and services offered. If you are looking for a format to display your unique thoughts, then the professionally designed Engineering Enterprise Competitive Competitor Comparison Topics PDF is the one for you. You can use it as a Google Slides template or a PowerPoint template. Incorporate impressive visuals, symbols, images, and other charts. Modify or reorganize the text boxes as you desire. Experiment with shade schemes and font pairings. Alter, share or cooperate with other people on your work. Download Engineering Enterprise Competitive Competitor Comparison Topics PDF and find out how to give a successful presentation. Present a perfect display to your team and make your presentation unforgettable.

Smartphone App Performance Comparison Chart Rules PDF
Showcasing this set of slides titled Smartphone App Performance Comparison Chart Rules PDF. The topics addressed in these templates are Development Speed, Maintenance Cost, Graphical Performance. All the content presented in this PPT design is completely editable. Download it and make adjustments in color, background, font etc. as per your unique business setting.
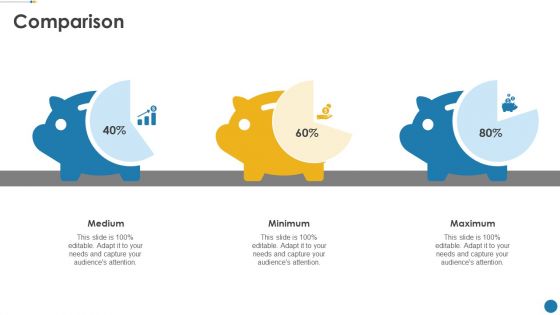
IT Operations Automation Comparison Slides PDF
Deliver an awe inspiring pitch with this creative it operations automation comparison slides pdf bundle. Topics like medium, minimum, maximum can be discussed with this completely editable template. It is available for immediate download depending on the needs and requirements of the user.
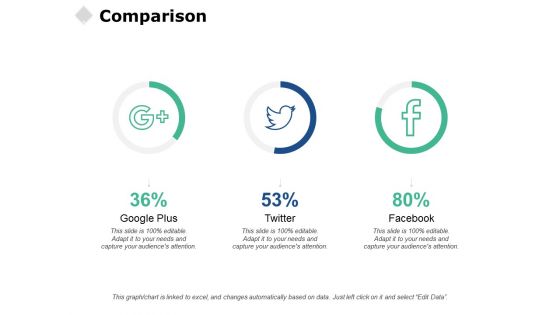
Comparison Management Ppt PowerPoint Presentation Show
Presenting this set of slides with name comparison management ppt powerpoint presentation show. The topics discussed in these slides are finance, marketing, management, investment, analysis. This is a completely editable PowerPoint presentation and is available for immediate download. Download now and impress your audience.
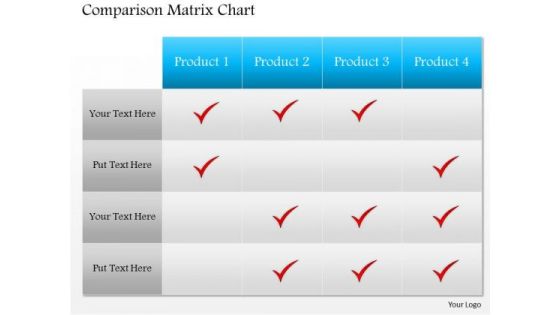
Business Framework Template Comparison Matrix PowerPoint Presentation
This business diagram displays framework for comparison chart. It contains matrix chart for comparison of four products. This diagram enables the users to create their own display of the required processes in an easy way.
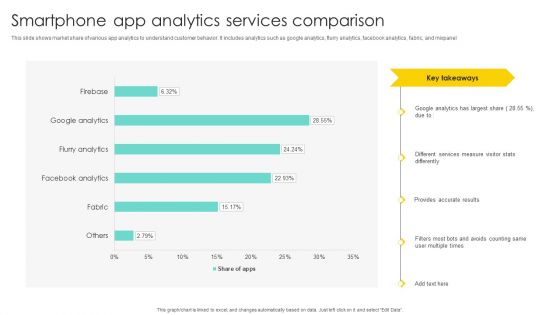
Smartphone App Analytics Services Comparison Brochure PDF
This slide shows market share of various app analytics to understand customer behavior. It includes analytics such as google analytics, flurry analytics, facebook analytics, fabric, and mixpanel. Pitch your topic with ease and precision using this Smartphone App Analytics Services Comparison Brochure PDF. This layout presents information on Different Services Measure, Visitor Stats Differently, Provides Accurate Results. It is also available for immediate download and adjustment. So, changes can be made in the color, design, graphics or any other component to create a unique layout.

Comparison Finance Ppt PowerPoint Presentation Model Influencers
This is a comparison finance ppt powerpoint presentation model influencers. This is a two stage process. The stages in this process are comparison, planning, marketing, finance, strategy.

Comparison Strategy Ppt PowerPoint Presentation Slides Samples
This is a comparison strategy ppt powerpoint presentation slides samples. This is a two stage process. The stages in this process are comparison, male, female, marketing, strategy.

Comparison Ppt PowerPoint Presentation File Example
This is a comparison ppt powerpoint presentation file example. This is a two stage process. The stages in this process are compare, graph, finance, marketing.
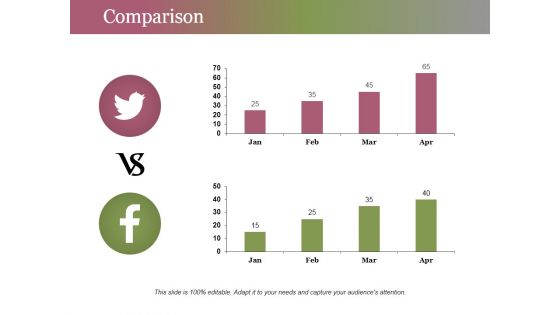
Comparison Ppt PowerPoint Presentation Pictures Gridlines
This is a comparison ppt powerpoint presentation pictures gridlines. This is a two stage process. The stages in this process are graph, compare, social media, business, marketing.
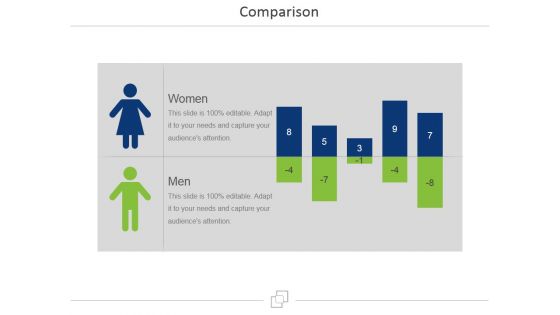
Comparison Ppt PowerPoint Presentation Professional Tips
This is a comparison ppt powerpoint presentation professional tips. This is a two stage process. The stages in this process are women, men.
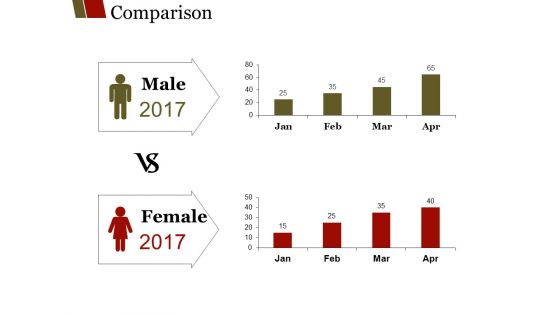
Comparison Ppt PowerPoint Presentation Outline Guidelines
This is a comparison ppt powerpoint presentation outline guidelines. This is a two stage process. The stages in this process are male, years, business, female, marketing.

Comparison Marketing Ppt PowerPoint Presentation File Model
This is a comparison marketing ppt powerpoint presentation file model. This is a three stage process. The stages in this process are business, planning, strategy, marketing, management.

Comparison Finance Ppt PowerPoint Presentation Pictures Good
This is a comparison finance ppt powerpoint presentation pictures good. This is a three stage process. The stages in this process are finance, analysis, business, investment, marketing.

 Home
Home