Comparison Bar Graph

Triangular Shaped Donut Diagram Data Comparison Ppt Business Plan PowerPoint Slides
We present our triangular shaped donut diagram data comparison ppt business plan PowerPoint Slides.Present our Construction PowerPoint Templates because Our PowerPoint Templates and Slides will embellish your thoughts. See them provide the desired motivation to your team. Download and present our Finance PowerPoint Templates because You should Ascend the ladder of success with ease. Our PowerPoint Templates and Slides will provide strong and sturdy steps. Present our Triangles PowerPoint Templates because you should Whip up a frenzy with our PowerPoint Templates and Slides. They will fuel the excitement of your team. Present our Business PowerPoint Templates because Our PowerPoint Templates and Slides will help you be quick off the draw. Just enter your specific text and see your points hit home. Download and present our Shapes PowerPoint Templates because you should Whip up a frenzy with our PowerPoint Templates and Slides. They will fuel the excitement of your team.Use these PowerPoint slides for presentations relating to Pyramid, chart, 3d, level, icon, cartoon, isolated, tower, model, conical, layout, triangle, sign, architectural, symbol, template, diagram, cone, scheme, graphic, data, element, drawing, shape, illustration, geometric, figure, illustrated, dimensional, clipart, design, architecture, picture, art, part, mining, image, triangular. The prominent colors used in the PowerPoint template are Blue, Gray, Black.

Shaped Donut Diagram Data Comparison Tips For Writing Business Plan PowerPoint Slides
We present our shaped donut diagram data comparison tips for writing business plan PowerPoint Slides.Download and present our Construction PowerPoint Templates because Our PowerPoint Templates and Slides will bullet point your ideas. See them fall into place one by one. Download and present our Finance PowerPoint Templates because It can Bubble and burst with your ideas. Download and present our Triangles PowerPoint Templates because Our PowerPoint Templates and Slides has conjured up a web of all you need with the help of our great team. Use them to string together your glistening ideas. Download our Business PowerPoint Templates because Your ideas provide food for thought. Our PowerPoint Templates and Slides will help you create a dish to tickle the most discerning palate. Download and present our Shapes PowerPoint Templates because Our PowerPoint Templates and Slides will let you Hit the target. Go the full distance with ease and elan.Use these PowerPoint slides for presentations relating to Pyramid, chart, 3d, level, icon, cartoon, isolated, tower, model, conical, layout, triangle, sign, architectural, symbol, template, diagram, cone, scheme, graphic, data, element, drawing, shape, illustration, geometric, figure, illustrated, dimensional, clipart, design, architecture, picture, art, part, mining, image, triangular. The prominent colors used in the PowerPoint template are Green, Gray, White.

Figure Chart Illustrating Product Features Comparison Ppt PowerPoint Presentation Gallery Guidelines PDF
Pitch your topic with ease and precision using this figure chart illustrating monthly customer retention data ppt powerpoint presentation icon model pdf. This layout presents information on figure chart illustrating product features comparison. It is also available for immediate download and adjustment. So, changes can be made in the color, design, graphics or any other component to create a unique layout.

Pitch Deck For Fundraising From Post Market Financing Revenue And Expenses Comparison Historical And Projection Designs PDF
The slide provides the comparative graph of companys revenue and expenses for last 5 years historical and coming 4 years forecastedDeliver and pitch your topic in the best possible manner with this pitch deck for fundraising from post market financing revenue and expenses comparison historical and projection designs pdf. Use them to share invaluable insights on historical, forecasted, financials and impress your audience. This template can be altered and modified as per your expectations. So, grab it now.

Pitch Deck To Raise Funding From Secondary Market Revenue And Expenses Comparison Historical And Projection Summary PDF
The slide provides the comparative graph of companys revenue and expenses for last 5 years historical and coming 4 years forecasted. Deliver and pitch your topic in the best possible manner with this pitch deck to raise funding from secondary market revenue and expenses comparison historical and projection summary pdf. Use them to share invaluable insights on financials, revenue, operating expenses and impress your audience. This template can be altered and modified as per your expectations. So, grab it now.

Pitch Deck To Attract Funding After IPO Market Revenue And Expenses Comparison Historical And Projection Topics PDF
the slide provides the comparative graph of companys revenue and expenses for last 5 years historical and coming 4 years forecasted Deliver and pitch your topic in the best possible manner with this pitch deck to attract funding after ipo market revenue and expenses comparison historical and projection topics pdf. Use them to share invaluable insights on historical, forecasted, financials and impress your audience. This template can be altered and modified as per your expectations. So, grab it now.

Vehicle Sales Plunge In An Automobile Firm Additional Unit Sold Comparison In Three Market Scenarios Introduction PDF
The slide shows the line graph comparison of additional vehicle sold in three different market scenarios Positive, Average and Negative. The value is provided for the next five years 2020 2024 Deliver an awe inspiring pitch with this creative vehicle sales plunge in an automobile firm additional unit sold comparison in three market scenarios introduction pdf bundle. Topics like additional unit sold comparison in three market scenarios can be discussed with this completely editable template. It is available for immediate download depending on the needs and requirements of the user.

Collection Of Quality Assurance PPT Sample Box And Whisker Plot For Two Year Sales Comparison Elements PDF
Following slide illustrates sample two to year sales comparison box and whisker plot along with key takeaways. Users can edit it as per their requirement. Deliver an awe inspiring pitch with this creative collection of quality assurance ppt sample box and whisker plot for two year sales comparison elements pdf bundle. Topics like graph, data can be discussed with this completely editable template. It is available for immediate download depending on the needs and requirements of the user.
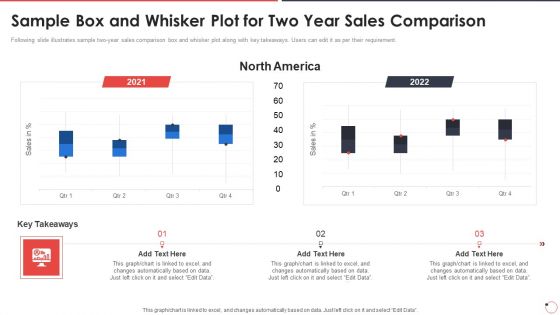
Quality Assurance Templates Set 1 Sample Box And Whisker Plot For Two Year Sales Comparison Ppt Slides Visual Aids PDF

Investment Pitch To Generate Capital From Series B Venture Round Series A To Series B Funding Comparison Clipart PDF
The slide provides the comparison of funding between the series A Angel Investors and series B Private Equity Investors, Venture Capitalists funding with commitments. Presenting investment pitch to generate capital from series b venture round series a to series b funding comparison clipart pdf to provide visual cues and insights. Share and navigate important information on two stages that need your due attention. This template can be used to pitch topics like committed, angel investments, total number shares, private equity investors, venture capitalists. In addition, this PPT design contains high-resolution images, graphics, etc, that are easily editable and available for immediate download.
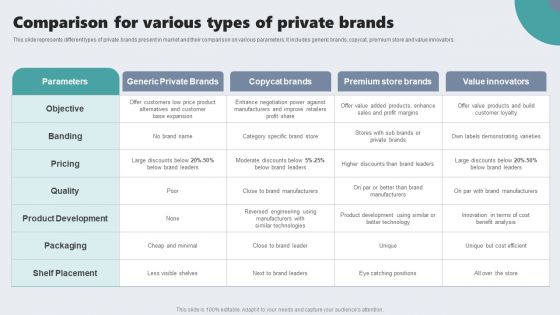
Guide To Private Branding For Increase Brand Value Comparison For Various Types Of Private Brands Topics PDF
This slide represents different types of private brands present in market and their comparison on various parameters. It includes generic brands, copycat, premium store and value innovators. If you are looking for a format to display your unique thoughts, then the professionally designed Guide To Private Branding For Increase Brand Value Comparison For Various Types Of Private Brands Topics PDF is the one for you. You can use it as a Google Slides template or a PowerPoint template. Incorporate impressive visuals, symbols, images, and other charts. Modify or reorganize the text boxes as you desire. Experiment with shade schemes and font pairings. Alter, share or cooperate with other people on your work. Download Guide To Private Branding For Increase Brand Value Comparison For Various Types Of Private Brands Topics PDF and find out how to give a successful presentation. Present a perfect display to your team and make your presentation unforgettable.

Strategies For Successful Customer Base Development In B2b M Commerce Comparison For B2b And B2c E Commerce Payment Diagrams PDF
This slide represents comparison for b2b and b2c payment systems. It cover parameters such as payment size, frequency, terms, order quantity and payment methods. If you are looking for a format to display your unique thoughts, then the professionally designed Strategies For Successful Customer Base Development In B2b M Commerce Comparison For B2b And B2c E Commerce Payment Diagrams PDF is the one for you. You can use it as a Google Slides template or a PowerPoint template. Incorporate impressive visuals, symbols, images, and other charts. Modify or reorganize the text boxes as you desire. Experiment with shade schemes and font pairings. Alter, share or cooperate with other people on your work. Download Strategies For Successful Customer Base Development In B2b M Commerce Comparison For B2b And B2c E Commerce Payment Diagrams PDF and find out how to give a successful presentation. Present a perfect display to your team and make your presentation unforgettable.
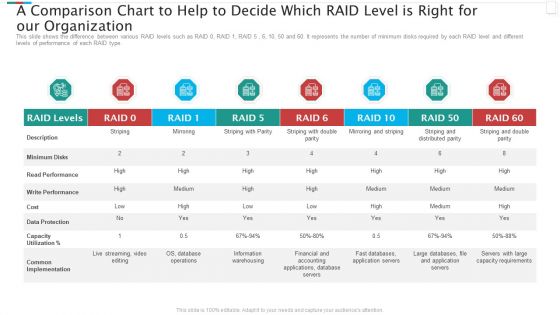
A Comparison Chart To Help To Decide Which RAID Level Is Right For Our Organization Mockup PDF
This slide shows the difference between various RAID levels such as RAID 0, RAID 1, RAID 5 , 6, 10, 50 and 60. It represents the number of minimum disks required by each RAID level and different levels of performance of each RAID type. Deliver an awe inspiring pitch with this creative a comparison chart to help to decide which raid level is right for our organization mockup pdf bundle. Topics like read performance, common implementation, data protection, financial and accounting can be discussed with this completely editable template. It is available for immediate download depending on the needs and requirements of the user.

Pie Chart Data Comparisons 5 Stages Business Plan PowerPoint Templates
We present our pie chart data comparisons 5 stages business plan PowerPoint templates.Download and present our Marketing PowerPoint Templates because Our PowerPoint Templates and Slides offer you the widest possible range of options. Use our Finance PowerPoint Templates because You should Ascend the ladder of success with ease. Our PowerPoint Templates and Slides will provide strong and sturdy steps. Download and present our Business PowerPoint Templates because You should Throw the gauntlet with our PowerPoint Templates and Slides. They are created to take up any challenge. Present our Sales PowerPoint Templates because Our PowerPoint Templates and Slides help you pinpoint your timelines. Highlight the reasons for your deadlines with their use. Present our Success PowerPoint Templates because It will Raise the bar of your Thoughts. They are programmed to take you to the next level.Use these PowerPoint slides for presentations relating to Analysis, Analyzing, Brands, Business, Chart, Colorful, Commerce, Compare, Comparison, Data, Economical, Finance, Financial, Grow, Growth, Market, Market Share, Marketing, Measure, Pen, Pie, Pie Chart, Presentation, Profit, Revenue, Sales, Sales Chat, Sales Increase, Share, Statistical, Success, Successful. The prominent colors used in the PowerPoint template are Green, Gray, White.
Graphics Card Comparisons In Powerpoint And Google Slides Cpb
Presenting our innovatively-designed set of slides titled Graphics Card Comparisons In Powerpoint And Google Slides Cpb. This completely editable PowerPoint graphic exhibits Graphics Card Comparisons that will help you convey the message impactfully. It can be accessed with Google Slides and is available in both standard screen and widescreen aspect ratios. Apart from this, you can download this well-structured PowerPoint template design in different formats like PDF, JPG, and PNG. So, click the download button now to gain full access to this PPT design.

Sales By Area With Financial Graphs And Growth Percentage Inspiration PDF
Pitch your topic with ease and precision using this Sales By Area With Financial Graphs And Growth Percentage Inspiration PDF. This layout presents information on Sales Area, Financial Graphs, Growth Percentage. It is also available for immediate download and adjustment. So, changes can be made in the color, design, graphics or any other component to create a unique layout.

Business Share In Market With Various Pie Graphs Ppt PowerPoint Presentation Gallery Skills PDF
Pitch your topic with ease and precision using this business share in market with various pie graphs ppt powerpoint presentation gallery skills pdf. This layout presents information on 2018 to 2020, business share, market, various pie graphs. It is also available for immediate download and adjustment. So, changes can be made in the color, design, graphics or any other component to create a unique layout.
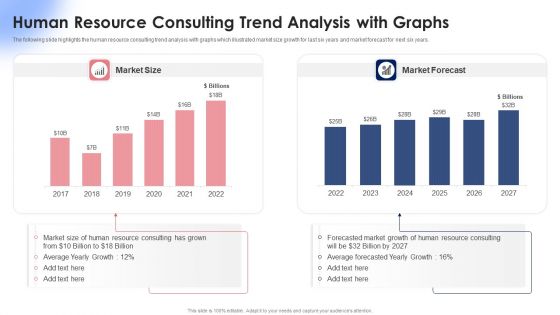
Human Resource Consulting Trend Analysis With Graphs Ppt Summary Clipart Images PDF
The following slide highlights the human resource consulting trend analysis with graphs which illustrated market size growth for last six years and market forecast for next six years. Pitch your topic with ease and precision using this Human Resource Consulting Trend Analysis With Graphs Ppt Summary Clipart Images PDF. This layout presents information on Market Size, Market Forecast, 2017 To 2022. It is also available for immediate download and adjustment. So, changes can be made in the color, design, graphics or any other component to create a unique layout.

Gain From Various Products In Four Pie Graphs Ppt PowerPoint Presentation Gallery Example Introduction PDF
Pitch your topic with ease and precision using this gain from various products in four pie graphs ppt powerpoint presentation gallery example introduction pdf. This layout presents information on 2017 to 2020. It is also available for immediate download and adjustment. So, changes can be made in the color, design, graphics or any other component to create a unique layout.

Performance Analysis Of Car Segment In Various Pie Graphs Ppt PowerPoint Presentation Professional Example PDF
Pitch your topic with ease and precision using this performance analysis of car segment in various pie graphs ppt powerpoint presentation professional example pdf. This layout presents information on 2017 to 2020, car segment. It is also available for immediate download and adjustment. So, changes can be made in the color, design, graphics or any other component to create a unique layout.

Sales And Expenses In Various Pie Graphs Ppt PowerPoint Presentation Ideas Backgrounds PDF
Pitch your topic with ease and precision using this sales and expenses in various pie graphs ppt powerpoint presentation ideas backgrounds pdf. This layout presents information on sales, expenses, quarter. It is also available for immediate download and adjustment. So, changes can be made in the color, design, graphics or any other component to create a unique layout.

Various Pie Graphs With Marketing And Promotion Costs Ppt PowerPoint Presentation Summary Graphics Design PDF
Pitch your topic with ease and precision using this various pie graphs with marketing and promotion costs ppt powerpoint presentation summary graphics design pdf. This layout presents information on marketing expense, promotion expense. It is also available for immediate download and adjustment. So, changes can be made in the color, design, graphics or any other component to create a unique layout.
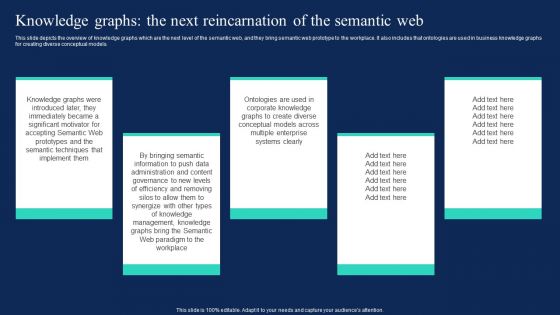
Knowledge Graphs The Next Reincarnation Of The Semantic Web Introduction PDF
This slide depicts the overview of knowledge graphs which are the next level of the semantic web, and they bring semantic web prototype to the workplace. It also includes that ontologies are used in business knowledge graphs for creating diverse conceptual models. Are you searching for a Knowledge Graphs The Next Reincarnation Of The Semantic Web Introduction PDF that is uncluttered, straightforward, and original Its easy to edit, and you can change the colors to suit your personal or business branding. For a presentation that expresses how much effort you have put in, this template is ideal With all of its features, including tables, diagrams, statistics, and lists, its perfect for a business plan presentation. Make your ideas more appealing with these professional slides. Download Knowledge Graphs The Next Reincarnation Of The Semantic Web Introduction PDF from Slidegeeks today.
Managers Conducting Corporate Intelligence Analysis Using Data Graphs Ppt Icon Structure PDF
This is a managers conducting corporate intelligence analysis using data graphs ppt icon structure pdf template with various stages. Focus and dispense information on three stages using this creative set, that comes with editable features. It contains large content boxes to add your information on topics like managers conducting corporate intelligence analysis using data graphs. You can also showcase facts, figures, and other relevant content using this PPT layout. Grab it now.
Continuous Enhancement Icon Process Graphs Ppt PowerPoint Presentation Complete Deck With Slides
This continuous enhancement icon process graphs ppt powerpoint presentation complete deck with slides acts as backup support for your ideas, vision, thoughts, etc. Use it to present a thorough understanding of the topic. This PPT slideshow can be utilized for both in-house and outside presentations depending upon your needs and business demands. Entailing thirteen slides with a consistent design and theme, this template will make a solid use case. As it is intuitively designed, it suits every business vertical and industry. All you have to do is make a few tweaks in the content or any other component to design unique presentations. The biggest advantage of this complete deck is that it can be personalized multiple times once downloaded. The color, design, shapes, and other elements are free to modify to add personal touches. You can also insert your logo design in this PPT layout. Therefore a well-thought and crafted presentation can be delivered with ease and precision by downloading this continuous enhancement icon process graphs ppt powerpoint presentation complete deck with slides PPT slideshow.

Pie Chart Data Comparisons 5 Stages Examples Small Business Plans PowerPoint Slides
We present our pie chart data comparisons 5 stages examples small business plans PowerPoint Slides.Download our Marketing PowerPoint Templates because you can Set pulses racing with our PowerPoint Templates and Slides. They will raise the expectations of your team. Present our Finance PowerPoint Templates because Our PowerPoint Templates and Slides are the chords of your song. String them along and provide the lilt to your views. Download and present our Business PowerPoint Templates because It will Raise the bar of your Thoughts. They are programmed to take you to the next level. Download our Sales PowerPoint Templates because Our PowerPoint Templates and Slides will fulfill your every need. Use them and effectively satisfy the desires of your audience. Present our Success PowerPoint Templates because You can Be the puppeteer with our PowerPoint Templates and Slides as your strings. Lead your team through the steps of your script.Use these PowerPoint slides for presentations relating to Analysis, Analyzing, Brands, Business, Chart, Colorful, Commerce, Compare, Comparison, Data, Economical, Finance, Financial, Grow, Growth, Market, Market Share, Marketing, Measure, Pen, Pie, Pie Chart, Presentation, Profit, Revenue, Sales, Sales Chat, Sales Increase, Share, Statistical, Success, Successful. The prominent colors used in the PowerPoint template are Yellow, Gray, White.

Chart For Data Comparisons 3 Stages How To Complete Business Plan PowerPoint Templates
We present our chart for data comparisons 3 stages how to complete business plan PowerPoint templates.Download and present our Business PowerPoint Templates because You canTake a leap off the starting blocks with our PowerPoint Templates and Slides. They will put you ahead of the competition in quick time. Download our Ring Charts PowerPoint Templates because You canTake a leap off the starting blocks with our PowerPoint Templates and Slides. They will put you ahead of the competition in quick time. Use our Process and Flows PowerPoint Templates because Our PowerPoint Templates and Slides are created with admirable insight. Use them and give your group a sense of your logical mind. Download our Shapes PowerPoint Templates because Our PowerPoint Templates and Slides will give you great value for your money. Be assured of finding the best projection to highlight your words. Present our Flow Charts PowerPoint Templates because Our PowerPoint Templates and Slides are designed to help you succeed. They have all the ingredients you need.Use these PowerPoint slides for presentations relating to Chart, flow, diagram, around, numbers, model, perspective, green, white, red, business, rotation, presentation, shadow, representation, circle, ring,flowchart, rotate, marketing, repeat, abstract, management, cycle, illustration, icon, three, guidance, connection, strategy, direction, recurrent, motion, connect,variation, contrast, background, commerce, repetitive. The prominent colors used in the PowerPoint template are Green, Gray, White.
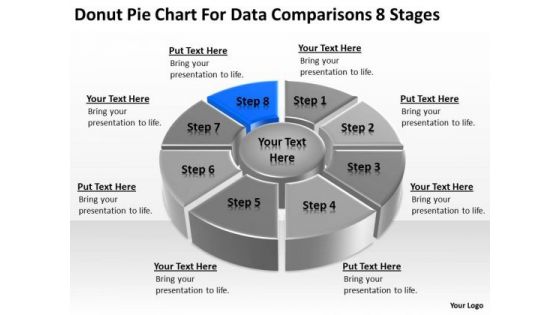
Chart For Data Comparisons 8 Stages Ppt Sample Business Plan Restaurant PowerPoint Templates
We present our chart for data comparisons 8 stages ppt sample business plan restaurant PowerPoint templates.Use our Competition PowerPoint Templates because Our PowerPoint Templates and Slides will let you Clearly mark the path for others to follow. Use our Marketing PowerPoint Templates because Our PowerPoint Templates and Slides have the Brilliant backdrops. Guaranteed to illuminate the minds of your audience. Download and present our Business PowerPoint Templates because Our PowerPoint Templates and Slides will help you be quick off the draw. Just enter your specific text and see your points hit home. Download our Circle Charts PowerPoint Templates because Our PowerPoint Templates and Slides will provide the perfect balance. Your weighty ideas will get the ideal impetus. Download and present our Shapes PowerPoint Templates because You can Give birth to your ideas with our PowerPoint Templates and Slides. See them grow big and strong in record time.Use these PowerPoint slides for presentations relating to Chart, wheel, pie, graph, vector, process, marketing, diagram, business, catalog, website, network, statistics, model, document, junction, plan, presentation, template, circle, brochure, data, stock, management, box, options, direction, design, company, navigation, financial, structure, button, goals, results. The prominent colors used in the PowerPoint template are Blue, Black, Gray.
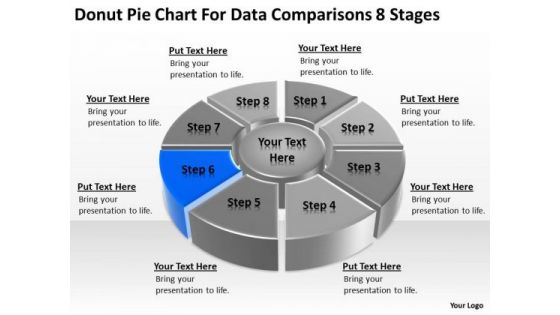
Donut Pie Chart For Data Comparisons 8 Stages Business Plan Examples PowerPoint Templates
We present our donut pie chart for data comparisons 8 stages business plan examples PowerPoint templates.Download and present our Success PowerPoint Templates because You can Stir your ideas in the cauldron of our PowerPoint Templates and Slides. Cast a magic spell on your audience. Download and present our Finance PowerPoint Templates because You should Kick up a storm with our PowerPoint Templates and Slides. The heads of your listeners will swirl with your ideas. Use our Arrows PowerPoint Templates because You should Ascend the ladder of success with ease. Our PowerPoint Templates and Slides will provide strong and sturdy steps. Download and present our Circle Charts PowerPoint Templates because Your ideas provide food for thought. Our PowerPoint Templates and Slides will help you create a dish to tickle the most discerning palate. Use our Business PowerPoint Templates because Our PowerPoint Templates and Slides are conceived by a dedicated team. Use them and give form to your wondrous ideas.Use these PowerPoint slides for presentations relating to Chart, wheel, pie, graph, vector, process, marketing, diagram, business, catalog, website, network, statistics, model, document, junction, plan, presentation, template, circle, brochure, data, stock, management, box, options, direction, design, company, navigation, financial, structure, button, goals, results. The prominent colors used in the PowerPoint template are Blue, Gray, Black.
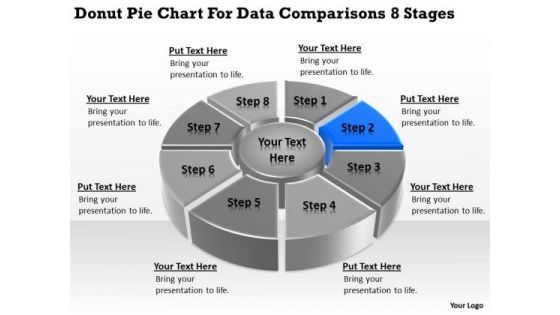
Donut Pie Chart For Data Comparisons 8 Stages Business Plans PowerPoint Templates
We present our donut pie chart for data comparisons 8 stages business plans PowerPoint templates.Download our Success PowerPoint Templates because Our PowerPoint Templates and Slides will embellish your thoughts. See them provide the desired motivation to your team. Download and present our Finance PowerPoint Templates because Our PowerPoint Templates and Slides offer you the widest possible range of options. Use our Arrows PowerPoint Templates because Our PowerPoint Templates and Slides are specially created by a professional team with vast experience. They diligently strive to come up with the right vehicle for your brilliant Ideas. Download our Circle Charts PowerPoint Templates because Our PowerPoint Templates and Slides will bullet point your ideas. See them fall into place one by one. Present our Business PowerPoint Templates because It will Give impetus to the hopes of your colleagues. Our PowerPoint Templates and Slides will aid you in winning their trust.Use these PowerPoint slides for presentations relating to Chart, wheel, pie, graph, vector, process, marketing, diagram, business, catalog, website, network, statistics, model, document, junction, plan, presentation, template, circle, brochure, data, stock, management, box, options, direction, design, company, navigation, financial, structure, button, goals, results. The prominent colors used in the PowerPoint template are Blue, Gray, Black.
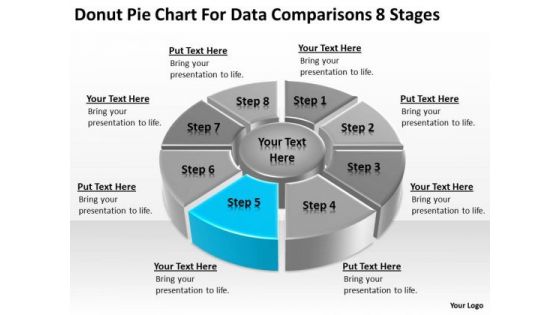
Pie Chart For Data Comparisons 8 Stages Business Plan Downloads PowerPoint Templates
We present our pie chart for data comparisons 8 stages business plan downloads PowerPoint templates.Download and present our Communication PowerPoint Templates because You can Inspire your team with our PowerPoint Templates and Slides. Let the force of your ideas flow into their minds. Download and present our Marketing PowerPoint Templates because Our PowerPoint Templates and Slides are a sure bet. Gauranteed to win against all odds. Present our Business PowerPoint Templates because You can Channelise the thoughts of your team with our PowerPoint Templates and Slides. Urge them to focus on the goals you have set. Present our Process and Flows PowerPoint Templates because Our PowerPoint Templates and Slides offer you the widest possible range of options. Use our Circle Charts PowerPoint Templates because Our PowerPoint Templates and Slides are created with admirable insight. Use them and give your group a sense of your logical mind.Use these PowerPoint slides for presentations relating to Diagram, Pie, Chart, Process, Network, Statistics, Item, Junction, Corporate, Business, Plan, Vector, Presentation, Template, Circle, Brochure, Data, Report, Marketing, Different, Abstract, Management, Graph, Multicolored, Modern, Four, Illustration, Connection, Options, Strategy, Catalog, Company, Banner, Information, Navigation, Structure, Arrows, Communication. The prominent colors used in the PowerPoint template are Blue, Gray, White.

Pie Chart For Data Comparisons 8 Stages Sample Business Plans Free PowerPoint Templates
We present our pie chart for data comparisons 8 stages sample business plans free PowerPoint templates.Present our Communication PowerPoint Templates because Our PowerPoint Templates and Slides ensures Effective communication. They help you put across your views with precision and clarity. Use our Marketing PowerPoint Templates because Our PowerPoint Templates and Slides help you pinpoint your timelines. Highlight the reasons for your deadlines with their use. Download our Business PowerPoint Templates because Our PowerPoint Templates and Slides will effectively help you save your valuable time. They are readymade to fit into any presentation structure. Present our Process and Flows PowerPoint Templates because Timeline crunches are a fact of life. Meet all deadlines using our PowerPoint Templates and Slides. Download and present our Circle Charts PowerPoint Templates because You have gained great respect for your brilliant ideas. Use our PowerPoint Templates and Slides to strengthen and enhance your reputation.Use these PowerPoint slides for presentations relating to Diagram, Pie, Chart, Process, Network, Statistics, Item, Junction, Corporate, Business, Plan, Vector, Presentation, Template, Circle, Brochure, Data, Report, Marketing, Different, Abstract, Management, Graph, Multicolored, Modern, Four, Illustration, Connection, Options, Strategy, Catalog, Company, Banner, Information, Navigation, Structure, Arrows, Communication. The prominent colors used in the PowerPoint template are Blue, Gray, White.
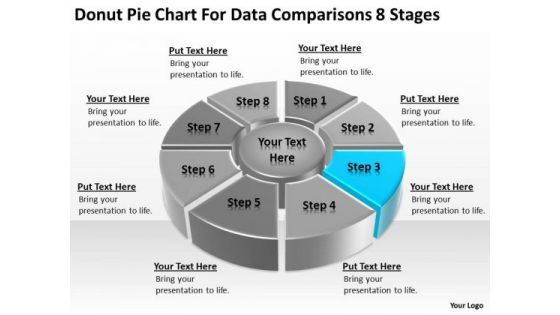
Donut Pie Chart For Data Comparisons 8 Stages Business Action Plan PowerPoint Templates
We present our donut pie chart for data comparisons 8 stages business action plan PowerPoint templates.Download our Success PowerPoint Templates because Our PowerPoint Templates and Slides are effectively colour coded to prioritise your plans They automatically highlight the sequence of events you desire. Present our Finance PowerPoint Templates because you should once Tap the ingenuity of our PowerPoint Templates and Slides. They are programmed to succeed. Present our Arrows PowerPoint Templates because Your audience will believe you are the cats whiskers. Present our Circle Charts PowerPoint Templates because You can Zap them with our PowerPoint Templates and Slides. See them reel under the impact. Download our Business PowerPoint Templates because It can Leverage your style with our PowerPoint Templates and Slides. Charm your audience with your ability.Use these PowerPoint slides for presentations relating to Chart, wheel, pie, graph, vector, process, marketing, diagram, business, catalog, website, network, statistics, model, document, junction, plan, presentation, template, circle, brochure, data, stock, management, box, options, direction, design, company, navigation, financial, structure, button, goals, results. The prominent colors used in the PowerPoint template are Blue, Gray, Black.

Donut Chart For Data Comparisons 3 Stages Ppt Business Plan PowerPoint Templates
We present our donut chart for data comparisons 3 stages ppt business plan PowerPoint templates.Use our Process and Flows PowerPoint Templates because Our PowerPoint Templates and Slides provide you with a vast range of viable options. Select the appropriate ones and just fill in your text. Download our Circle Charts PowerPoint Templates because Our PowerPoint Templates and Slides will let you Hit the right notes. Watch your audience start singing to your tune. Download our Business PowerPoint Templates because It can Bubble and burst with your ideas. Use our Marketing PowerPoint Templates because Our PowerPoint Templates and Slides will provide you a launch platform. Give a lift off to your ideas and send them into orbit. Use our Shapes PowerPoint Templates because Our PowerPoint Templates and Slides will weave a web of your great ideas. They are gauranteed to attract even the most critical of your colleagues.Use these PowerPoint slides for presentations relating to Diagram, wheel, graphic, graph, chart, vector, round, fuel, wiper, change, circle, brakes, vehicle, illustration, circular, system, surfaces, tune-up, clipart, care, reflection, upkeep, clip, text, maintenance, blades , art, filter, routine. The prominent colors used in the PowerPoint template are Blue light, Gray, Black.
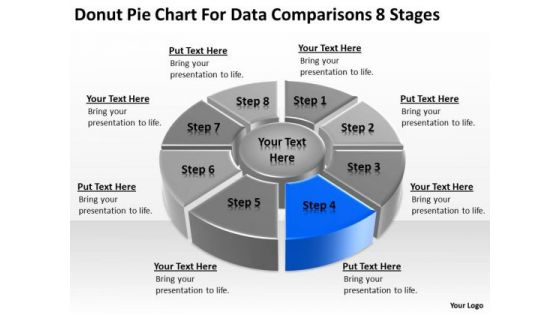
Donut Pie Chart For Data Comparisons 8 Stages Example Business Plan PowerPoint Slides
We present our donut pie chart for data comparisons 8 stages example business plan PowerPoint Slides.Download and present our Success PowerPoint Templates because You are an avid believer in ethical practices. Highlight the benefits that accrue with our PowerPoint Templates and Slides. Download our Finance PowerPoint Templates because You can Channelise the thoughts of your team with our PowerPoint Templates and Slides. Urge them to focus on the goals you have set. Use our Arrows PowerPoint Templates because You should Bet on your luck with our PowerPoint Templates and Slides. Be assured that you will hit the jackpot. Download and present our Circle Charts PowerPoint Templates because You are working at that stage with an air of royalty. Let our PowerPoint Templates and Slides be the jewels in your crown. Download and present our Business PowerPoint Templates because They will Put the wind in your sails. Skim smoothly over the choppy waters of the market.Use these PowerPoint slides for presentations relating to Chart, wheel, pie, graph, vector, process, marketing, diagram, business, catalog, website, network, statistics, model, document, junction, plan, presentation, template, circle, brochure, data, stock, management, box, options, direction, design, company, navigation, financial, structure, button, goals, results. The prominent colors used in the PowerPoint template are Blue, Gray, Black.

Pie Chart For Data Comparisons 8 Stages People Who Write Business Plans PowerPoint Slides
We present our pie chart for data comparisons 8 stages people who write business plans PowerPoint Slides.Present our Communication PowerPoint Templates because Our PowerPoint Templates and Slides will let Your superior ideas hit the target always and everytime. Download and present our Marketing PowerPoint Templates because Our PowerPoint Templates and Slides team portray an attitude of elegance. Personify this quality by using them regularly. Download and present our Business PowerPoint Templates because It will mark the footprints of your journey. Illustrate how they will lead you to your desired destination. Present our Process and Flows PowerPoint Templates because Our PowerPoint Templates and Slides will fulfill your every need. Use them and effectively satisfy the desires of your audience. Download our Circle Charts PowerPoint Templates because Our PowerPoint Templates and Slides offer you the widest possible range of options.Use these PowerPoint slides for presentations relating to Diagram, Pie, Chart, Process, Network, Statistics, Item, Junction, Corporate, Business, Plan, Vector, Presentation, Template, Circle, Brochure, Data, Report, Marketing, Different, Abstract, Management, Graph, Multicolored, Modern, Four, Illustration, Connection, Options, Strategy, Catalog, Company, Banner, Information, Navigation, Structure, Arrows, Communication. The prominent colors used in the PowerPoint template are Blue, Gray, White.
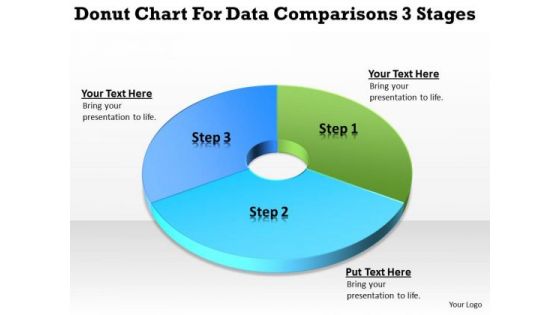
Donut Chart For Data Comparisons 3 Stages Business Planning PowerPoint Slides
We present our donut chart for data comparisons 3 stages business planning PowerPoint Slides.Present our Business PowerPoint Templates because It will Strengthen your hand with your thoughts. They have all the aces you need to win the day. Use our Finance PowerPoint Templates because You will get more than you ever bargained for. Use our Circle Charts PowerPoint Templates because It will Give impetus to the hopes of your colleagues. Our PowerPoint Templates and Slides will aid you in winning their trust. Present our Shapes PowerPoint Templates because You can Raise a toast with our PowerPoint Templates and Slides. Spread good cheer amongst your audience. Download our Process and Flows PowerPoint Templates because Our PowerPoint Templates and Slides help you meet the demand of the Market. Just browse and pick the slides that appeal to your intuitive senses.Use these PowerPoint slides for presentations relating to chart, donut, market, isolated, diminishing, rate, downtrend, business, three-dimensional, success, presentation, diagram, circle, uptrend, percentage, graphic, finance, data, stock, holdings, report, marketing, analyzing, trading, graph, illustration, pie, sale, up, money, design, currency, growth, descriptive, representing, painting, moving, progress, part, increases, background, investment, index, financial, multi, counter, portion, exchange. The prominent colors used in the PowerPoint template are Blue , Blue light, Green.
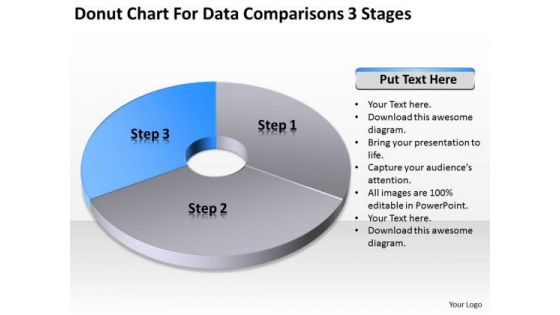
Chart For Data Comparisons 3 Stages Ppt Business Plan PowerPoint Templates
We present our chart for data comparisons 3 stages ppt business plan PowerPoint templates.Use our Business PowerPoint Templates because Our PowerPoint Templates and Slides are innately eco-friendly. Their high recall value negate the need for paper handouts. Present our Ring Charts PowerPoint Templates because Our PowerPoint Templates and Slides will Embellish your thoughts. They will help you illustrate the brilliance of your ideas. Present our Process and Flows PowerPoint Templates because You aspire to touch the sky with glory. Let our PowerPoint Templates and Slides provide the fuel for your ascent. Use our Shapes PowerPoint Templates because It can be used to Set your controls for the heart of the sun. Our PowerPoint Templates and Slides will be the propellant to get you there. Use our Flow Charts PowerPoint Templates because Our PowerPoint Templates and Slides ensures Effective communication. They help you put across your views with precision and clarity.Use these PowerPoint slides for presentations relating to Chart, flow, diagram, around, numbers, model, perspective, green, white, red, business, rotation, presentation, shadow, representation, circle, ring,flowchart, rotate, marketing, repeat, abstract, management, cycle, illustration, icon, three, guidance, connection, strategy, direction, recurrent, motion, connect,variation, contrast, background, commerce, repetitive. The prominent colors used in the PowerPoint template are Blue, White, Gray.

Business Marketing PowerPoint Templates Business Product Comparisons Over Time Ppt Slides
Business Marketing PowerPoint Templates Business product comparisons over time PPT Slides--This chart is useful for showing data changes over a period of time or for illustrating comparisons among items. -Business Marketing PowerPoint Templates Business product comparison over time PPT Slides-This ppt can be used for concepts relating to-chart,, graph, growth, investment, , market, percentage, , presentation report, results, statistics, stock, success and business.

Market Share Statistics Of Different IT Cloud Services Providers Topics PDF
This slide represents the market comparison bar graph on market share of different cloud computing service providers. It includes competitive analysis between various companies and there implemented strategies for growth. Showcasing this set of slides titled market share statistics of different it cloud services providers topics pdf. The topics addressed in these templates are largest market share, cloud computing services. All the content presented in this PPT design is completely editable. Download it and make adjustments in color, background, font etc. as per your unique business setting.
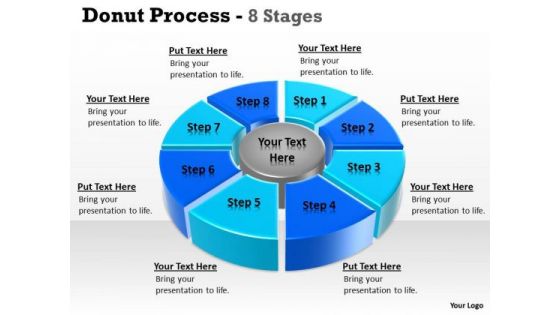
Strategic Management Donut Pie Chart For Data Comparisons 8 Stages Sales Diagram
Be The Doer With Our Strategic Management Donut Pie Chart For Data Comparisons 8 Stages Sales Diagram Powerpoint Templates. Put Your Thoughts Into Practice.

Pie Chart Data Comparisons 5 Stages Business Plan Templates PowerPoint Slides
We present our pie chart data comparisons 5 stages business plan templates PowerPoint Slides.Present our Marketing PowerPoint Templates because Our PowerPoint Templates and Slides are Clear and concise. Use them and dispel any doubts your team may have. Present our Finance PowerPoint Templates because You can Create a matrix with our PowerPoint Templates and Slides. Feel the strength of your ideas click into place. Download our Business PowerPoint Templates because You can Inspire your team with our PowerPoint Templates and Slides. Let the force of your ideas flow into their minds. Present our Sales PowerPoint Templates because Our PowerPoint Templates and Slides are aesthetically designed to attract attention. We gaurantee that they will grab all the eyeballs you need. Present our Success PowerPoint Templates because Our PowerPoint Templates and Slides are specially created by a professional team with vast experience. They diligently strive to come up with the right vehicle for your brilliant Ideas. Use these PowerPoint slides for presentations relating to Analysis, Analyzing, Brands, Business, Chart, Colorful, Commerce, Compare, Comparison, Data, Economical, Finance, Financial, Grow, Growth, Market, Market Share, Marketing, Measure, Pen, Pie, Pie Chart, Presentation, Profit, Revenue, Sales, Sales Chat, Sales Increase, Share, Statistical, Success, Successful. The prominent colors used in the PowerPoint template are Blue, Gray, White.

Pie Chart Data Comparisons 5 Stages How To Develop Business Plan PowerPoint Templates
We present our pie chart data comparisons 5 stages how to develop business plan PowerPoint templates.Present our Marketing PowerPoint Templates because You can Be the star of the show with our PowerPoint Templates and Slides. Rock the stage with your ideas. Download and present our Finance PowerPoint Templates because Timeline crunches are a fact of life. Meet all deadlines using our PowerPoint Templates and Slides. Use our Business PowerPoint Templates because You can Be the puppeteer with our PowerPoint Templates and Slides as your strings. Lead your team through the steps of your script. Download and present our Sales PowerPoint Templates because Our PowerPoint Templates and Slides are a sure bet. Gauranteed to win against all odds. Download our Success PowerPoint Templates because Our PowerPoint Templates and Slides will provide weight to your words. They will bring out the depth of your thought process.Use these PowerPoint slides for presentations relating to Analysis, Analyzing, Brands, Business, Chart, Colorful, Commerce, Compare, Comparison, Data, Economical, Finance, Financial, Grow, Growth, Market, Market Share, Marketing, Measure, Pen, Pie, Pie Chart, Presentation, Profit, Revenue, Sales, Sales Chat, Sales Increase, Share, Statistical, Success, Successful. The prominent colors used in the PowerPoint template are Blue, Gray, White.
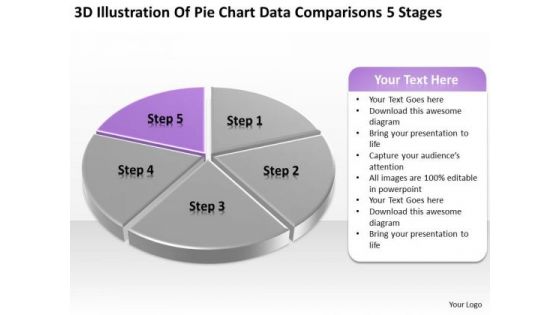
Pie Chart Data Comparisons 5 Stages Ppt Designing Business Plan PowerPoint Templates
We present our pie chart data comparisons 5 stages ppt designing business plan PowerPoint templates.Use our Marketing PowerPoint Templates because Our PowerPoint Templates and Slides are innately eco-friendly. Their high recall value negate the need for paper handouts. Download our Finance PowerPoint Templates because Our PowerPoint Templates and Slides are truly out of this world. Even the MIB duo has been keeping tabs on our team. Use our Business PowerPoint Templates because You should Bet on your luck with our PowerPoint Templates and Slides. Be assured that you will hit the jackpot. Present our Sales PowerPoint Templates because Our PowerPoint Templates and Slides are created with admirable insight. Use them and give your group a sense of your logical mind. Present our Success PowerPoint Templates because Our PowerPoint Templates and Slides are focused like a searchlight beam. They highlight your ideas for your target audience.Use these PowerPoint slides for presentations relating to Analysis, Analyzing, Brands, Business, Chart, Colorful, Commerce, Compare, Comparison, Data, Economical, Finance, Financial, Grow, Growth, Market, Market Share, Marketing, Measure, Pen, Pie, Pie Chart, Presentation, Profit, Revenue, Sales, Sales Chat, Sales Increase, Share, Statistical, Success, Successful. The prominent colors used in the PowerPoint template are Purple, Gray, White.
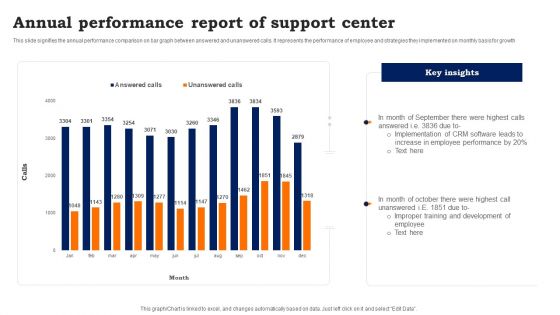
Annual Performance Report Of Support Center Inspiration PDF
This slide signifies the annual performance comparison on bar graph between answered and unanswered calls. It represents the performance of employee and strategies they implemented on monthly basis for growth. Showcasing this set of slides titled Annual Performance Report Of Support Center Inspiration PDF. The topics addressed in these templates are Annual Performance, Report Of Support Center. All the content presented in this PPT design is completely editable. Download it and make adjustments in color, background, font etc. as per your unique business setting.
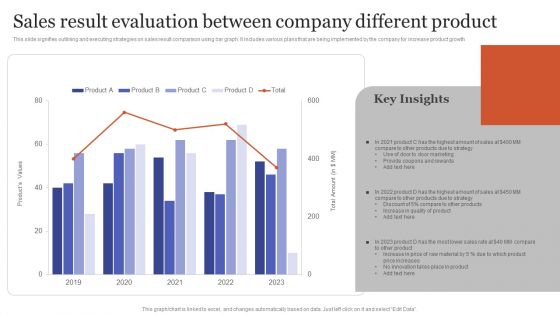
Sales Result Evaluation Between Company Different Product Microsoft PDF
This slide signifies outlining and executing strategies on sales result comparison using bar graph. It includes various plans that are being implemented by the company for increase product growth. Showcasing this set of slides titled Sales Result Evaluation Between Company Different Product Microsoft PDF. The topics addressed in these templates are Door Marketing, Provide Coupons Rewards, Increase Quality Product. All the content presented in this PPT design is completely editable. Download it and make adjustments in color, background, font etc. as per your unique business setting.
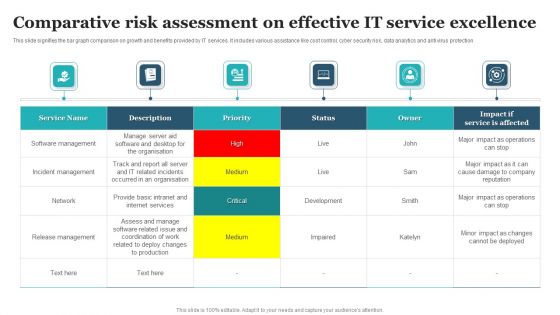
Comparative Risk Assessment On Effective IT Service Excellence Designs PDF
This slide signifies the bar graph comparison on growth and benefits provided by IT services. It includes various assistance like cost control, cyber security risk, data analytics and anti virus protection. Showcasing this set of slides titled Comparative Risk Assessment On Effective IT Service Excellence Designs PDF. The topics addressed in these templates are Software Management, Incident Management, Release Management. All the content presented in this PPT design is completely editable. Download it and make adjustments in color, background, font etc. as per your unique business setting.
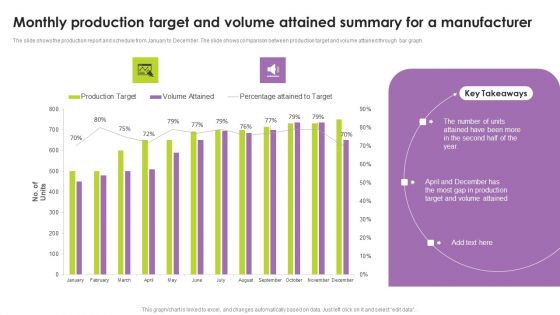
Monthly Production Target And Volume Attained Summary For A Manufacturer Portrait PDF
The slide shows the production report and schedule from January to December. The slide shows comparison between production target and volume attained through bar graph. Pitch your topic with ease and precision using this Monthly Production Target And Volume Attained Summary For A Manufacturer Portrait PDF. This layout presents information on Monthly Production Target, Volume Attained Summary, Manufacturer. It is also available for immediate download and adjustment. So, changes can be made in the color, design, graphics or any other component to create a unique layout.
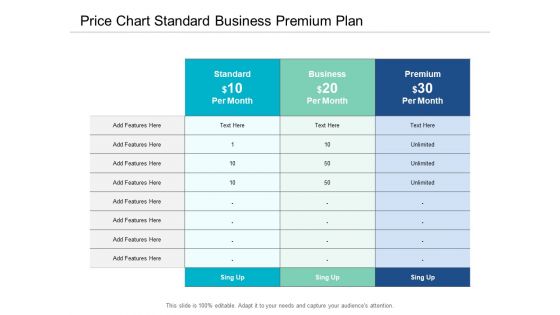
Price Chart Standard Business Premium Plan Ppt Powerpoint Presentation Visual Aids Infographic Template
This is a price chart standard business premium plan ppt powerpoint presentation visual aids infographic template. This is a three stage process. The stages in this process are comparison chart, comparison table, comparison matrix.
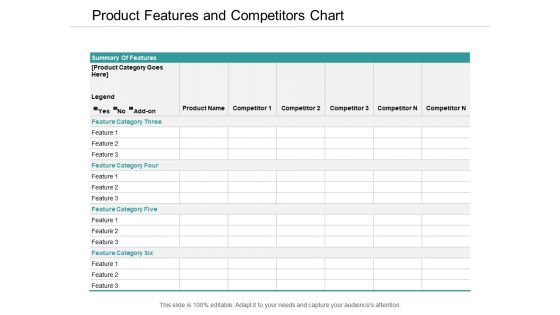
Product Features And Competitors Chart Ppt Powerpoint Presentation Slides Graphics Design
This is a product features and competitors chart ppt powerpoint presentation slides graphics design. This is a three stage process. The stages in this process are comparison chart, comparison table, comparison matrix.
Business Competitors Analysis Table Ppt Powerpoint Presentation Icon Brochure
This is a business competitors analysis table ppt powerpoint presentation icon brochure. This is a six stage process. The stages in this process are comparison chart, comparison table, comparison matrix.

Compare Versions Essential Deluxe And Platinum Ppt Powerpoint Presentation File Graphics Download
This is a compare versions essential deluxe and platinum ppt powerpoint presentation file graphics download. This is a four stage process. The stages in this process are comparison chart, comparison table, comparison matrix.
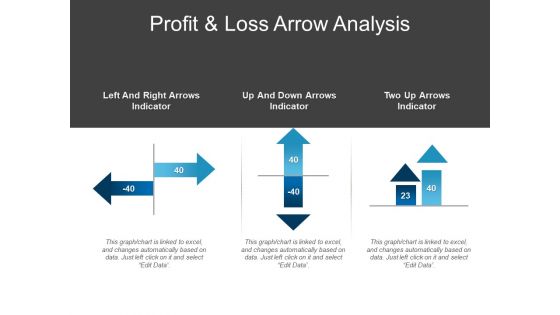
Profit And Loss Arrow Analysis Ppt PowerPoint Presentation Infographic Template Model
This is a profit and loss arrow analysis ppt powerpoint presentation infographic template model. This is a three stage process. The stages in this process are comparison chart, comparison table, comparison matrix.

Bank Offerings Analysis Chart Ppt PowerPoint Presentation Slides Show
This is a bank offerings analysis chart ppt powerpoint presentation slides show. This is a five stage process. The stages in this process are comparison chart, comparison table, comparison matrix.

Product Benefits Analysis Ppt PowerPoint Presentation Summary Background
This is a product benefits analysis ppt powerpoint presentation summary background. This is a four stage process. The stages in this process are comparison chart, comparison table, comparison matrix.

Customer Analysis Percentage Chart Ppt PowerPoint Presentation Infographics Master Slide
This is a customer analysis percentage chart ppt powerpoint presentation infographics master slide. This is a four stage process. The stages in this process are comparison chart, comparison table, comparison matrix.

Analyzing Bank Features Ppt PowerPoint Presentation Professional Background
This is a analyzing bank features ppt powerpoint presentation professional background. This is a six stage process. The stages in this process are comparison chart, comparison table, comparison matrix.
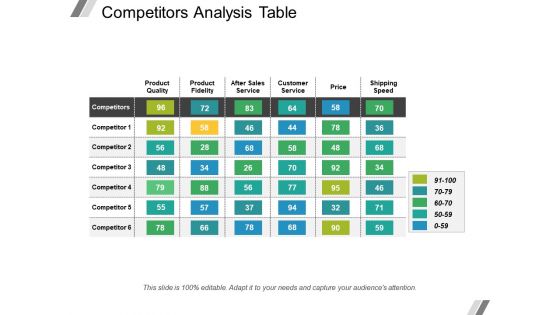
Competitors Analysis Table Ppt PowerPoint Presentation Layouts Example Introduction
This is a competitors analysis table ppt powerpoint presentation layouts example introduction. This is a seven stage process. The stages in this process are comparison chart, comparison table, comparison matrix.
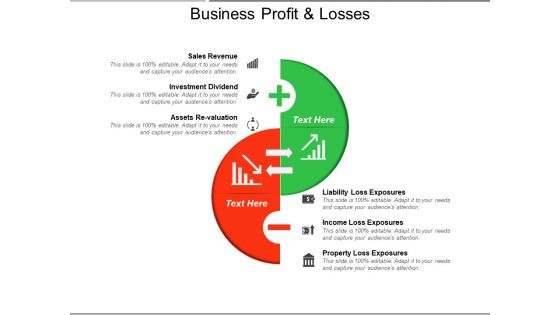
Business Profit And Losses Ppt PowerPoint Presentation Summary Outline
This is a business profit and losses ppt powerpoint presentation summary outline. This is a two stage process. The stages in this process are comparison chart, comparison table, comparison matrix.

Internet Usage Rate By Gender Ppt PowerPoint Presentation Outline Diagrams
This is a internet usage rate by gender ppt powerpoint presentation outline diagrams. This is a two stage process. The stages in this process are comparison chart, comparison table, comparison matrix.

Product Pricing Table Ppt PowerPoint Presentation File Deck
This is a product pricing table ppt powerpoint presentation file deck. This is a four stage process. The stages in this process are comparison chart, comparison table, comparison matrix.
Service Marketing Example Ppt PowerPoint Presentation Styles Example File
This is a service marketing example ppt powerpoint presentation styles example file. This is a two stage process. The stages in this process are comparison chart, comparison table, comparison matrix.
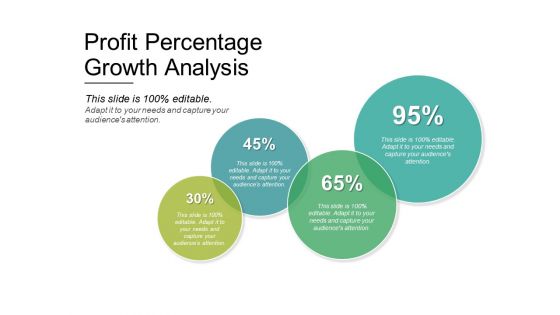
Profit Percentage Growth Analysis Ppt PowerPoint Presentation Layouts Graphics Tutorials
This is a profit percentage growth analysis ppt powerpoint presentation layouts graphics tutorials. This is a four stage process. The stages in this process are comparison chart, comparison table, comparison matrix.
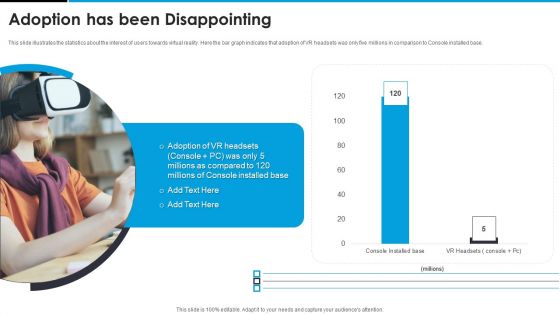
Sandbox VR Venture Capital Financing Pitch Deck Adoption Has Been Disappointing Information PDF
This slide illustrates the statistics about the interest of users towards virtual reality. Here the bar graph indicates that adoption of VR headsets was only five millions in comparison to Console installed base. Deliver an awe inspiring pitch with this creative sandbox vr venture capital financing pitch deck adoption has been disappointing information pdf bundle. Topics like adoption has been disappointing can be discussed with this completely editable template. It is available for immediate download depending on the needs and requirements of the user.
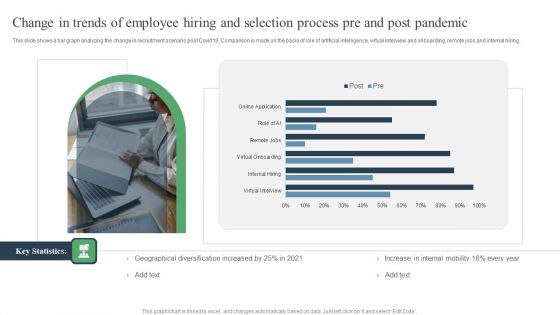
Change In Trends Of Employee Hiring And Selection Process Pre And Post Pandemic Ppt PowerPoint Presentation Images PDF
This slide shows a bar graph analyzing the change in recruitment scenario post Covid19. Comparison is made on the basis of role of artificial intelligence, virtual interview and onboarding, remote jobs and internal hiring. Showcasing this set of slides titled Change In Trends Of Employee Hiring And Selection Process Pre And Post Pandemic Ppt PowerPoint Presentation Images PDF. The topics addressed in these templates are Geographical Diversification, Internal Mobility, Virtual Onboarding. All the content presented in this PPT design is completely editable. Download it and make adjustments in color, background, font etc. as per your unique business setting.

Agile Crystal Techniques Crystal Methodology Implementation Dashboard Themes PDF
This slide represents the crystal methodology implementation dashboard by covering annual gross revenue, product type comparison, sales rep comparison and top 10 clients. Deliver an awe inspiring pitch with this creative Agile Crystal Techniques Crystal Methodology Implementation Dashboard Themes PDF bundle. Topics like Monthly Sales Trend, Sales Rep Comparison, Product Type Comparison can be discussed with this completely editable template. It is available for immediate download depending on the needs and requirements of the user.
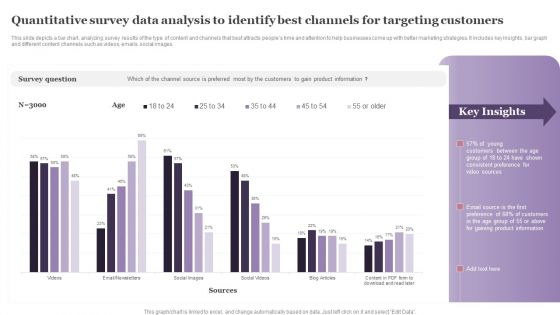
Quantitative Survey Data Analysis To Identify Best Channels For Targeting Customers Formats PDF
This slide depicts a bar chart, analyzing survey results of the type of content and channels that best attracts peoples time and attention to help businesses come up with better marketing strategies. It includes key insights, bar graph and different content channels such as videos, emails, social images. Pitch your topic with ease and precision using this Quantitative Survey Data Analysis To Identify Best Channels For Targeting Customers Formats PDF. This layout presents information on Survey Question, Young Customers, Consistent Preference. It is also available for immediate download and adjustment. So, changes can be made in the color, design, graphics or any other component to create a unique layout.
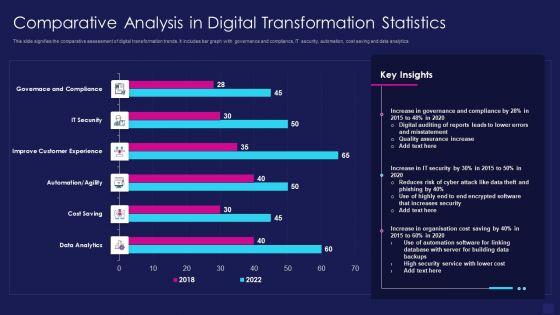
Comparative Analysis In Digital Transformation Statistics Graphics PDF
This slide signifies the comparative assessment of digital transformation trends. It includes bar graph with governance and compliance, IT security, automation, cost saving and data analytics. Showcasing this set of slides titled comparative analysis in digital transformation statistics graphics pdf. The topics addressed in these templates are data analytics, cost saving, improve customer experience. All the content presented in this PPT design is completely editable. Download it and make adjustments in color, background, font etc. as per your unique business setting.

Project Metrics Dashboard With Monthly Sales Professional PDF
This slide focuses on project management dashboard which states the progress of the project, spending on designing, developing and testing of project, monthly sales graph using bar and line chart with number of sales and referrals in 12 months. Pitch your topic with ease and precision using this Project Metrics Dashboard With Monthly Sales Professional PDF. This layout presents information on Project Progress, Project Spend, Sales Graph. It is also available for immediate download and adjustment. So, changes can be made in the color, design, graphics or any other component to create a unique layout.

Income Assessment Document Key Average Salary Given To Employees By Introduction PDF
This slide shows the average compensation structure given to the employees and has been compared with other competitive salaries. It shows the comparison by years of experience, salary by education, and average bonus rate received by the employee. Deliver and pitch your topic in the best possible manner with this Income Assessment Document Key Average Salary Given To Employees By Introduction PDF. Use them to share invaluable insights on Salary Comparison, Years Experience, Salary Comparison Education and impress your audience. This template can be altered and modified as per your expectations. So, grab it now.

Quality Improvement In Healthcare Institutions And Hospitals Ideas PDF
This slide shows a bar graph of quality improvement in healthcare institutions. Main components covered are patient satisfaction, reducing readmissions and cost savings.Showcasing this set of slides titled Quality Improvement In Healthcare Institutions And Hospitals Ideas PDF The topics addressed in these templates are Improvement Initiatives, Healthcare Institutes ,Focusing Improving All the content presented in this PPT design is completely editable. Download it and make adjustments in color, background, font etc. as per your unique business setting.
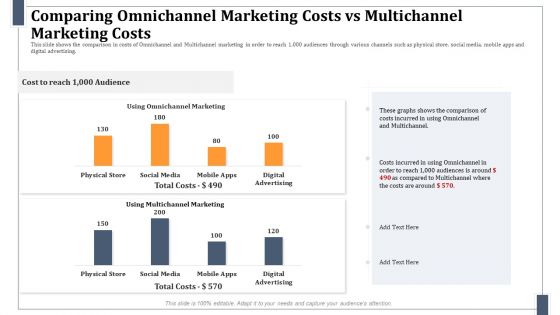
Comparing Omnichannel Marketing Costs Vs Multichannel Marketing Costs Professional PDF
This slide shows the comparison in costs of Omnichannel and Multichannel marketing in order to reach 1,000 audiences through various channels such as physical store, social media, mobile apps and digital advertising. Deliver an awe inspiring pitch with this creative comparing omnichannel marketing costs vs multichannel marketing costs professional pdf bundle. Topics like digital advertising, multichannel marketing, comparison can be discussed with this completely editable template. It is available for immediate download depending on the needs and requirements of the user.
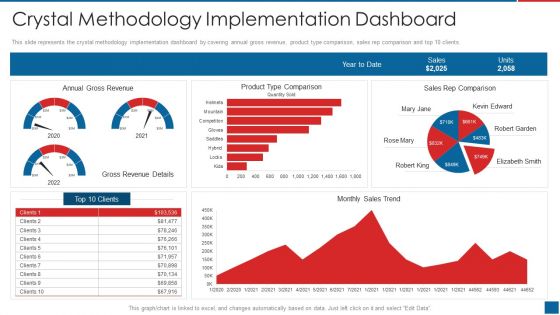
Agile Crystal Method Crystal Methodology Implementation Dashboard Pictures PDF
This slide represents the crystal methodology implementation dashboard by covering annual gross revenue, product type comparison, sales rep comparison and top 10 clients.Deliver an awe inspiring pitch with this creative Agile Crystal Method Crystal Methodology Implementation Dashboard Pictures PDF bundle. Topics like Crystal Methodology Implementation Dashboard can be discussed with this completely editable template. It is available for immediate download depending on the needs and requirements of the user.
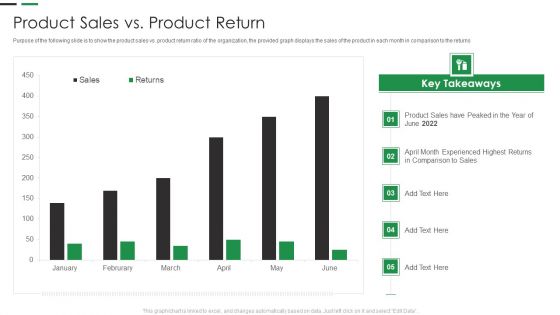
Evaluating New Commodity Impact On Market Product Sales Vs Product Return Template PDF
Purpose of the following slide is to show the product sales vs. product return ratio of the organization, the provided graph displays the sales of the product in each month in comparison to the returns Deliver an awe inspiring pitch with this creative Evaluating New Commodity Impact On Market Product Sales Vs Product Return Template PDF bundle. Topics like Experienced Highest, Returns Comparison, Key Takeaways can be discussed with this completely editable template. It is available for immediate download depending on the needs and requirements of the user.

Performance Analysis Of New Product Development Product Sales Vs Product Return Infographics PDF
Purpose of the following slide is to show the product sales vs. product return ratio of the organization, the provided graph displays the sales of the product in each month in comparison to the returns. Deliver an awe inspiring pitch with this creative performance analysis of new product development product sales vs product return infographics pdf bundle. Topics like comparison, sales, returns can be discussed with this completely editable template. It is available for immediate download depending on the needs and requirements of the user.
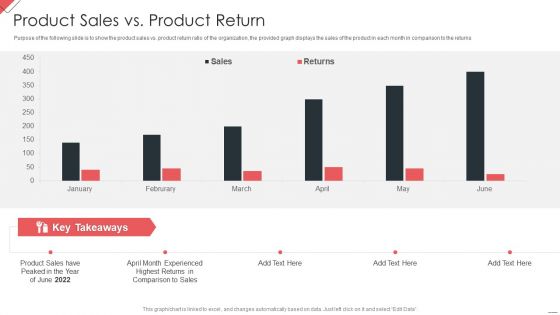
New Commodity Market Viability Review Product Sales Vs Product Return Mockup PDF
Purpose of the following slide is to show the product sales vs. product return ratio of the organization, the provided graph displays the sales of the product in each month in comparison to the returns Deliver an awe inspiring pitch with this creative New Commodity Market Viability Review Product Sales Vs Product Return Mockup PDF bundle. Topics like Product Sales, Comparison Sales, Highest Returns can be discussed with this completely editable template. It is available for immediate download depending on the needs and requirements of the user.
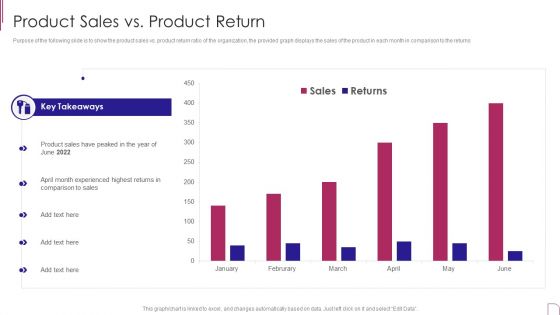
Yearly Product Performance Assessment Repor Product Sales Vs Product Return Information PDF
Purpose of the following slide is to show the product sales vs. product return ratio of the organization, the provided graph displays the sales of the product in each month in comparison to the returns.Deliver an awe inspiring pitch with this creative Yearly Product Performance Assessment Repor Product Sales Vs Product Return Information PDF bundle. Topics like Key Takeaways, Experienced Highest, Comparison Sales can be discussed with this completely editable template. It is available for immediate download depending on the needs and requirements of the user.

Pricing Benchmarks Analysis Dashboard For Manufacturing Company Structure PDF
This slide represents the price benchmarking comparison report of manufacturing company. It includes information related to gross and profit margin and revenue growth of all organizations along with graph showing benchmark index comparison from industry average. Pitch your topic with ease and precision using this Pricing Benchmarks Analysis Dashboard For Manufacturing Company Structure PDF. This layout presents information on Pricing Benchmarks Analysis, Dashboard For Manufacturing Company. It is also available for immediate download and adjustment. So, changes can be made in the color, design, graphics or any other component to create a unique layout.
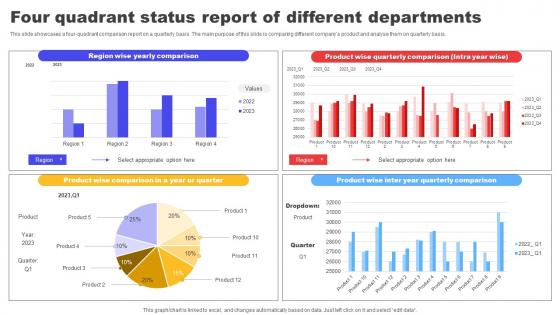
Four Quadrant Status Report Of Different Departments Clipart pdf
This slide showcases a four-quadrant comparison report on a quarterly basis. The main purpose of this slide is comparing different companys product and analyse them on quarterly basis. Pitch your topic with ease and precision using this Four Quadrant Status Report Of Different Departments Clipart pdf. This layout presents information on Region Wise,Yearly Comparison,Product Wise Compariso. It is also available for immediate download and adjustment. So, changes can be made in the color, design, graphics or any other component to create a unique layout.

Engage Customers Ppt PowerPoint Presentation Summary Portrait
This is a business structure comparison chart ppt powerpoint presentation infographic template vector. This is a three stage process. The stages in this process are business structure comparison chart.
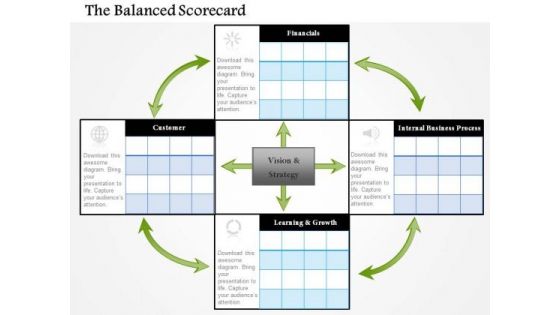
Business Framework The Balanced Scorecard PowerPoint Presentation
This business diagram displays framework for comparison chart. It contains matrix chart for comparison of four products. This diagram enables the users to create their own display of the required processes in an easy way.

Inventory Turnover Financial Ratios Chart Conversion Portrait PDF
This slide illustrates graph for inventory turnover ratio that can help company to analyze efficiency of inventory management. It showcases ratio graph comparison of 4 companies for a period of last 6 years Pitch your topic with ease and precision using this inventory turnover financial ratios chart conversion portrait pdf. This layout presents information on inventory turnover financial ratios chart conversion. It is also available for immediate download and adjustment. So, changes can be made in the color, design, graphics or any other component to create a unique layout.

Market Potential And Opportunity Size For The Company Ppt File Ideas PDF
The slide provides a the comparison graph of market size of online money transfer remittances mobile payment market. It covers the historical 2015-2020 as well as forecasted 2021-2026 data. Deliver an awe-inspiring pitch with this creative market potential and opportunity size for the company ppt file ideas pdf bundle. Topics like market potential and opportunity size for the company can be discussed with this completely editable template. It is available for immediate download depending on the needs and requirements of the user.

Software Developer Playbook Kpi Dashboard To Measure Overall Business Performance Topics PDF
This graph or chart is linked to excel, and changes automatically based on data. Just left click on it and select Edit Data. Deliver and pitch your topic in the best possible manner with this software developer playbook kpi dashboard to measure overall business performance topics pdf. Use them to share invaluable insights on revenue new customers, gross profit, customer satisfaction, sales comparison and impress your audience. This template can be altered and modified as per your expectations. So, grab it now.

Buy Side M And A Service Management Vs Consensus Revenue Forecast Introduction PDF
The graph depicts a revenue comparison between management and consensus. It shows historical 2015 to 2020 and projected revenue 2021 to 2024. There are so many reasons you need a Buy Side M And A Service Management Vs Consensus Revenue Forecast Introduction PDF. The first reason is you can not spend time making everything from scratch, Thus, Slidegeeks has made presentation templates for you too. You can easily download these templates from our website easily.

ALM Optimizing The Profit Generated By Your Assets How Much Will It Cost To Replace The Asset Microsoft PDF
In this slide we have provided you with a graph that displays the total replacement cost of multiple assets and a brief analysis of the same. Deliver an awe inspiring pitch with this creative alm optimizing the profit generated by your assets how much will it cost to replace the asset microsoft pdf bundle. Topics like replacement cost, comparison can be discussed with this completely editable template. It is available for immediate download depending on the needs and requirements of the user.

People Are Using More Phone Than Banks Virtual Currency Financing Pitch Deck Graphics PDF
The slide provides the comparison graph of number of mobile users and number of bank accounts from the year 2014 to 2021. Deliver an awe inspiring pitch with this creative people are using more phone than banks virtual currency financing pitch deck graphics pdf bundle. Topics like people are using more phone than banks can be discussed with this completely editable template. It is available for immediate download depending on the needs and requirements of the user.
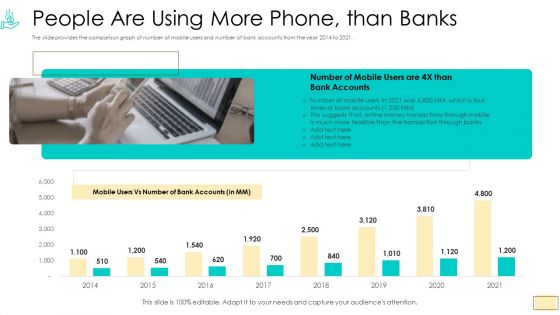
Investor Pitch Ppt For Crypto Funding People Are Using More Phone Than Banks Download PDF
The slide provides the comparison graph of number of mobile users and number of bank accounts from the year 2014 to 2021.Deliver an awe-inspiring pitch with this creative investor pitch ppt for crypto funding people are using more phone than banks download pdf. bundle. Topics like 2014 to 2021 can be discussed with this completely editable template. It is available for immediate download depending on the needs and requirements of the user.

Investor Pitch Ppt Raise Finances Crypto Initial Public Offering People Are Using More Phonethan Banks Summary PDF
The slide provides the comparison graph of number of mobile users and number of bank accounts from the year 2013 to 2021.Deliver an awe-inspiring pitch with this creative investor pitch ppt raise finances crypto initial public offering people are using more phonethan banks summary pdf. bundle. Topics like 2014 to 2021 can be discussed with this completely editable template. It is available for immediate download depending on the needs and requirements of the user.

Investor Pitch Deck To Generate Capital From Initial Currency Offering People Are Using More Phone Than Banks Clipart PDF
The slide provides the comparison graph of number of mobile users and number of bank accounts from the year 2014 to 2021.Deliver an awe-inspiring pitch with this creative investor pitch deck to generate capital from initial currency offering people are using more phone than banks clipart pdf bundle. Topics like people are using more phone than banks can be discussed with this completely editable template. It is available for immediate download depending on the needs and requirements of the user.

Russia Ukraine War Influence On Airline Sector Decrease In Flight Search History Of Users Sample PDF
This slide illustrates graph which provides details about user search history for airline bookings. It also showcases comparison of forecasted figures with actual data Deliver an awe inspiring pitch with this creative russia ukraine war influence on airline sector decrease in flight search history of users sample pdf bundle. Topics like decrease in flight search history of users can be discussed with this completely editable template. It is available for immediate download depending on the needs and requirements of the user.
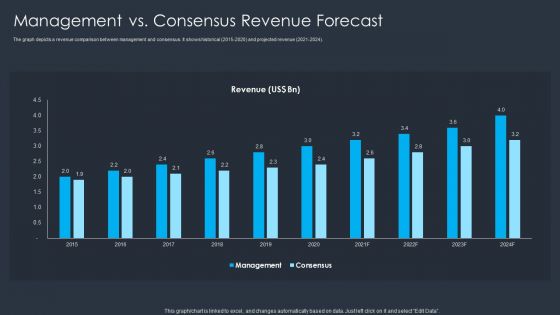
Merger And Acquisition Buying Strategy For Business Growth Management Vs Consensus Revenue Forecast Designs PDF
The graph depicts a revenue comparison between management and consensus. It shows historical 2015 to 2020 and projected revenue 2021 to 2024. Deliver and pitch your topic in the best possible manner with this Merger And Acquisition Buying Strategy For Business Growth Management Vs Consensus Revenue Forecast Designs PDF. Use them to share invaluable insights on Management, Consensus Revenue Forecast and impress your audience. This template can be altered and modified as per your expectations. So, grab it now.
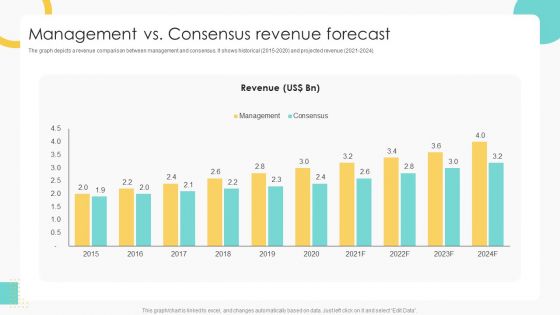
Buy Side Merger And Acquisition Pitch Book Management Vs Consensus Revenue Forecast Brochure PDF
The graph depicts a revenue comparison between management and consensus. It shows historical 2015 2020 and projected revenue 2021 2024. Deliver and pitch your topic in the best possible manner with this Buy Side Merger And Acquisition Pitch Book Management Vs Consensus Revenue Forecast Brochure PDF. Use them to share invaluable insights on Management, Consensus Revenue Forecast and impress your audience. This template can be altered and modified as per your expectations. So, grab it now.
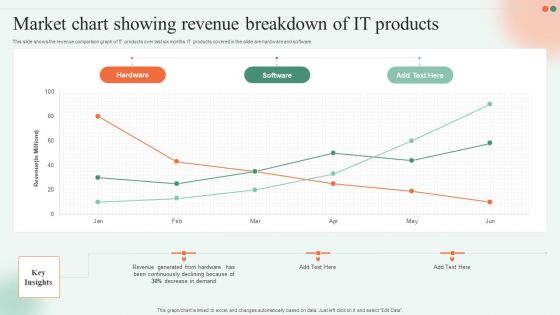
Market Chart Showing Revenue Breakdown Of IT Products Ppt File Elements PDF
This slide shows the revenue comparison graph of IT products over last six months. IT products covered in the slide are hardware and software. Pitch your topic with ease and precision using this Market Chart Showing Revenue Breakdown Of IT Products Ppt File Elements PDF. This layout presents information on Hardware, Software, Key Insights. It is also available for immediate download and adjustment. So, changes can be made in the color, design, graphics or any other component to create a unique layout.
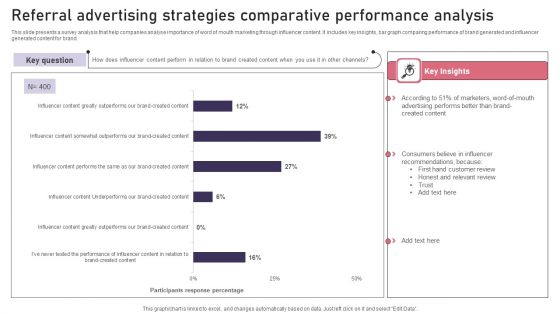
Referral Advertising Strategies Comparative Performance Analysis Diagrams PDF
This slide presents a survey analysis that help companies analyse importance of word of mouth marketing through influencer content. It includes key insights, bar graph comparing performance of brand generated and influencer generated content for brand. Showcasing this set of slides titled Referral Advertising Strategies Comparative Performance Analysis Diagrams PDF. The topics addressed in these templates are Referral Advertising, Strategies Comparative, Performance Analysis. All the content presented in this PPT design is completely editable. Download it and make adjustments in color, background, font etc. as per your unique business setting.

Business Framework Building Blocks In A Pyramid PowerPoint Presentation
This power point diagram slide has been crafted with graphic of building blocks in a pyramid shape. This PPT slide displays the concept of comparison product launch. Use this image for production and business related presentations.
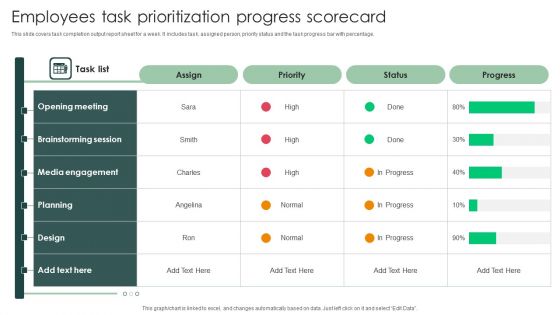
Employees Task Prioritization Progress Scorecard Download PDF
This slide covers task completion output report sheet for a week. It includes task, assigned person, priority status and the task progress bar with percentage.Pitch your topic with ease and precision using this Employees Task Prioritization Progress Scorecard Download PDF. This layout presents information on Communication Skills Development, Manager Training, Area Sales . It is also available for immediate download and adjustment. So, changes can be made in the color, design, graphics or any other component to create a unique layout.
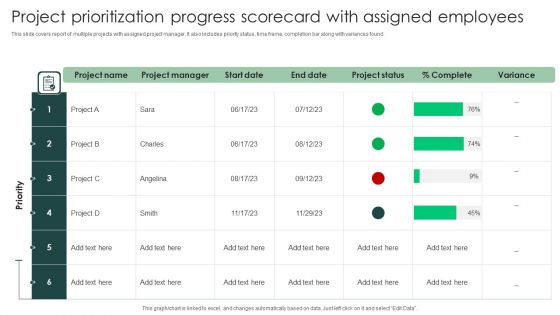
Project Prioritization Progress Scorecard With Assigned Employees Diagrams PDF
This slide covers report of multiple projects with assigned project manager. It also includes priority status, time frame, completion bar along with variances found. Pitch your topic with ease and precision using this Project Prioritization Progress Scorecard With Assigned Employees Diagrams PDF. This layout presents information on Project Prioritization, Progress Scorecard, Assigned Employees. It is also available for immediate download and adjustment. So, changes can be made in the color, design, graphics or any other component to create a unique layout.
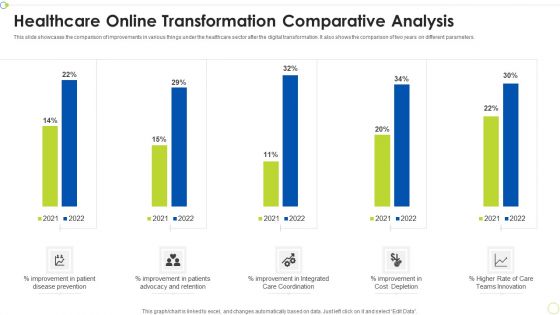
Healthcare Online Transformation Comparative Analysis Ppt PowerPoint Presentation File Sample PDF
This slide showcases the comparison of improvements in various things under the healthcare sector after the digital transformation. It also shows the comparison of two years on different parameters. Showcasing this set of slides titled Healthcare Online Transformation Comparative Analysis Ppt PowerPoint Presentation File Sample PDF. The topics addressed in these templates are Healthcare Online, Transformation, Comparative Analysis. All the content presented in this PPT design is completely editable. Download it and make adjustments in color, background, font etc. as per your unique business setting.

Dashboard Of Property Operations And Maintenance Ppt Infographic Template Objects PDF
This slide focuses on maintenance dashboard for certified reliability engineer which covers team efficiency, cumulative savings, planned maintenance, chiller performance analysis, portfolio comparison, alarm and fault diagnostics, etc. Pitch your topic with ease and precision using this Dashboard Of Property Operations And Maintenance Ppt Infographic Template Objects PDF. This layout presents information on Planned Maintenance Efficiency, Chiller Performance Analysis, Portfolio Comparison Team, Alarm And Fault. It is also available for immediate download and adjustment. So, changes can be made in the color, design, graphics or any other component to create a unique layout.

Income Assessment Document Industry Payroll Trends Ppt Pictures Deck PDF
This slide represents key statistics of employees working in US region. It shows average salary based on employee experience, education, and average bonus rate should be receive to full time employees. This slide also helps in making comparison with company compensation structure. Deliver and pitch your topic in the best possible manner with this Income Assessment Document Industry Payroll Trends Ppt Pictures Deck PDF. Use them to share invaluable insights on Salary Comparison, Years Experience, Average Annual Salary and impress your audience. This template can be altered and modified as per your expectations. So, grab it now.
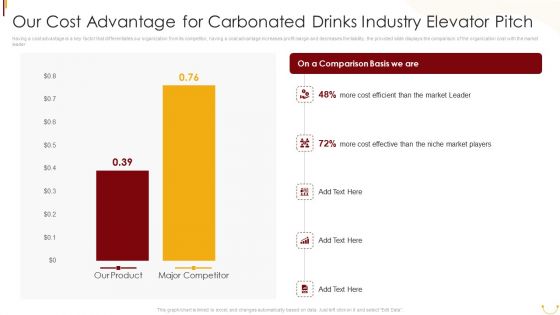
Our Cost Advantage For Carbonated Drinks Industry Elevator Pitch Ppt PowerPoint Presentation File Model PDF
Having a cost advantage is a key factor that differentiates our organization from its competitor, having a cost advantage increases profit margin and decreases the liability, the provided slide displays the comparison of the organization cost with the market leader. Deliver an awe inspiring pitch with this creative Our Cost Advantage For Carbonated Drinks Industry Elevator Pitch Ppt PowerPoint Presentation File Model PDF bundle. Topics like Comparison Basis, Our Product, Major Competitor, Niche Market Players, Market Leader can be discussed with this completely editable template. It is available for immediate download depending on the needs and requirements of the user.
Soft Drink Company Executive Report Overview Icons PDF
This slide illustrate soft drink manufacturing company overview along with its vision and mission statement. It includes elements such as company background, key facts about company, sales, revenue and cost of goods comparison etc. Pitch your topic with ease and precision using this Soft Drink Company Executive Report Overview Icons PDF. This layout presents information on Vision, Products, Financial Comparison. It is also available for immediate download and adjustment. So, changes can be made in the color, design, graphics or any other component to create a unique layout.
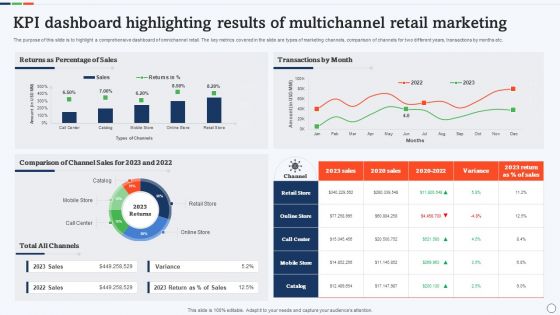
KPI Dashboard Highlighting Results Of Multichannel Retail Marketing Rules PDF
The purpose of this slide is to highlight a comprehensive dashboard of omnichannel retail. The key metrics covered in the slide are types of marketing channels, comparison of channels for two different years, transactions by months etc. Pitch your topic with ease and precision using this KPI Dashboard Highlighting Results Of Multichannel Retail Marketing Rules PDF. This layout presents information on Comparison Of Channel Sales, Percentage Of Sales, Transactions By Month. It is also available for immediate download and adjustment. So, changes can be made in the color, design, graphics or any other component to create a unique layout.
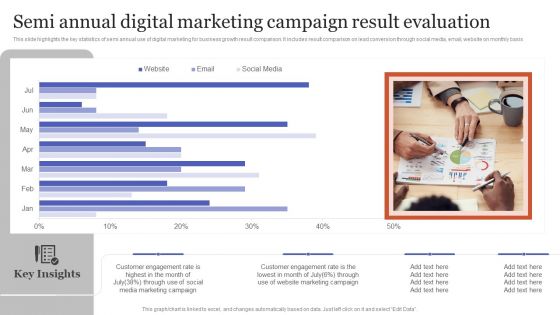
Semi Annual Digital Marketing Campaign Result Evaluation Topics PDF
This slide highlights the key statistics of semi annual use of digital marketing for business growth result comparison. It includes result comparison on lead conversion through social media, email, website on monthly basis. Pitch your topic with ease and precision using this Semi Annual Digital Marketing Campaign Result Evaluation Topics PDF. This layout presents information on Customer Engagement, Marketing Campaign, Through Social. It is also available for immediate download and adjustment. So, changes can be made in the color, design, graphics or any other component to create a unique layout.

Monthly Cost Comparative Analysis Of Advertising Expenditure Introduction PDF
This slide represents the bar graph on marketing monthly cost comparative analysis for increasing organisation revenue. It includes methods like online, catalogues, conventions, trade shows, print, radio and magazines Pitch your topic with ease and precision using this Monthly Cost Comparative Analysis Of Advertising Expenditure Introduction PDF This layout presents information on Monthly Cost Comparative Analysis Of Advertising Expenditure It is also available for immediate download and adjustment. So, changes can be made in the color, design, graphics or any other component to create a unique layout.
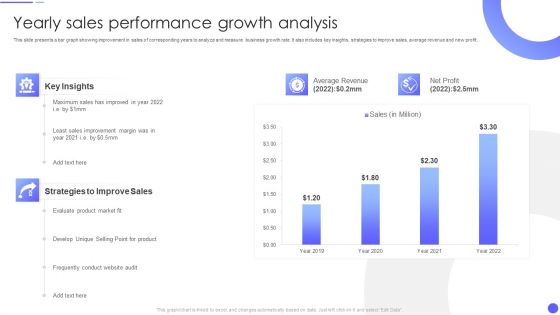
Yearly Sales Performance Growth Analysis Rules PDF
This slide presents a bar graph showing improvement in sales of corresponding years to analyze and measure business growth rate. It also includes key insights, strategies to improve sales, average revenue and new profit.Pitch your topic with ease and precision using this Yearly Sales Performance Growth Analysis Rules PDF This layout presents information on Average Revenue, Strategies To Improve, Sales Improvement It is also available for immediate download and adjustment. So, changes can be made in the color, design, graphics or any other component to create a unique layout.

Business Financial Highlights For Planning And Forecasting Background PDF
The slide shows bar graph showing actual and forecasted revenue, expenses and net profit of a company for various financial years. It is done to effectively conduct financial and investment planning for business growth and sustainability. Pitch your topic with ease and precision using this Business Financial Highlights For Planning And Forecasting Background PDF. This layout presents information on Revenue, Expenses And Costs, Net Profit. It is also available for immediate download and adjustment. So, changes can be made in the color, design, graphics or any other component to create a unique layout.

Allocation Of Funds Writing Enhancement Software Pitch Deck PPT Template
This slide presents stacked bar chart highlights areas where raised funds will be allocated. It includes areas such as reach expansion, product feature enhancement, security and communication. The Allocation Of Funds Writing Enhancement Software Pitch Deck PPT Template is a compilation of the most recent design trends as a series of slides. It is suitable for any subject or industry presentation, containing attractive visuals and photo spots for businesses to clearly express their messages. This template contains a variety of slides for the user to input data, such as structures to contrast two elements, bullet points, and slides for written information. Slidegeeks is prepared to create an impression.
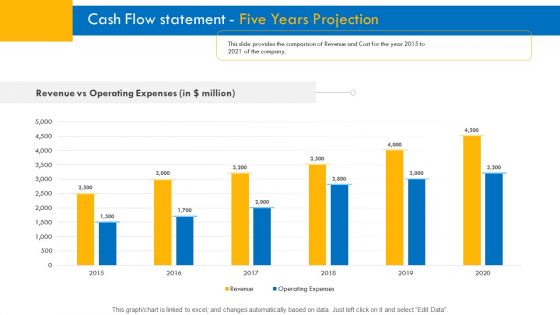
Investor Pitch Deck For Interim Financing Revenue Vs Cost Of The Company Graphics PDF
This slide provides the comparison of Revenue and Cost for the year 2015 to 2021 of the company.Deliver and pitch your topic in the best possible manner with this v. Use them to share invaluable insights on revenue vs cost of the company and impress your audience. This template can be altered and modified as per your expectations. So, grab it now.
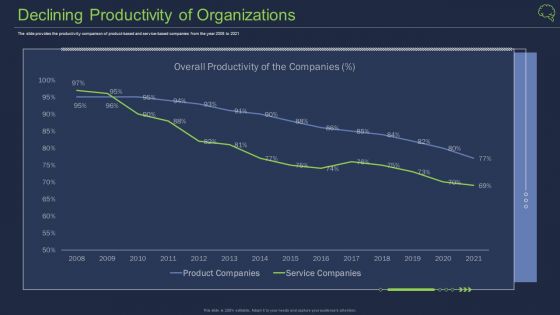
Declining Productivity Of Organizations Ppt Summary PDF
The slide provides the productivity comparison of product-based and service-based companies from the year 2008 to 2021 Deliver an awe inspiring pitch with this creative declining productivity of organizations ppt summary pdf bundle. Topics like declining productivity of organizations can be discussed with this completely editable template. It is available for immediate download depending on the needs and requirements of the user.
AIM Principles For Data Storage Application Cost Dashboard Ppt Icon Diagrams PDF
Deliver an awe inspiring pitch with this creative aim principles for data storage application cost dashboard ppt icon diagrams pdf bundle. Topics like investment, department, budget, cost, comparison can be discussed with this completely editable template. It is available for immediate download depending on the needs and requirements of the user.

Application Performance Management Application Cost Dashboard Ppt Ideas Inspiration PDF
Deliver an awe inspiring pitch with this creative application performance management application cost dashboard ppt ideas inspiration pdf bundle. Topics like investment, department, budget, cost, comparison can be discussed with this completely editable template. It is available for immediate download depending on the needs and requirements of the user.
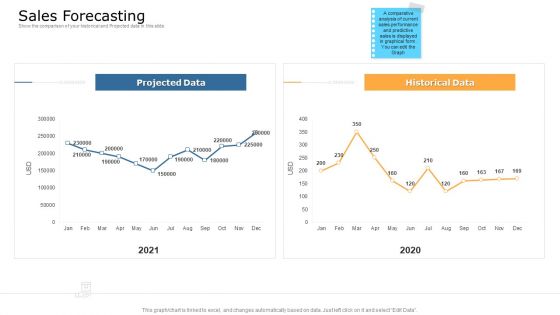
Commodity Unique Selling Proposition Sales Forecasting Diagrams PDF
Show the comparison of your historical and Projected data in this slide. Deliver and pitch your topic in the best possible manner with this commodity unique selling proposition sales forecasting diagrams pdf. Use them to share invaluable insights on sales forecasting and impress your audience. This template can be altered and modified as per your expectations. So, grab it now.
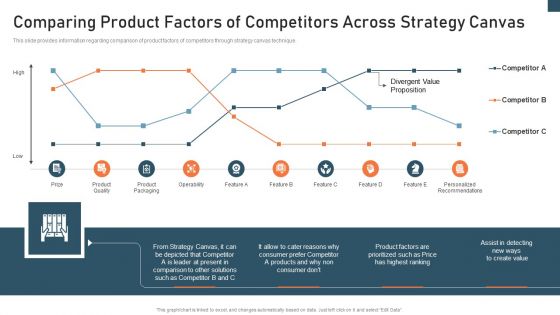
Planning And Action Playbook Comparing Product Factors Brochure PDF
This slide provides information regarding comparison of product factors of competitors through strategy canvas technique. Deliver an awe inspiring pitch with this creative planning and action playbook comparing product factors brochure pdf bundle. Topics like strategy, consumer, products can be discussed with this completely editable template. It is available for immediate download depending on the needs and requirements of the user.

Brand Valuation Scorecard With Social Selling Index Sample PDF
Deliver an awe inspiring pitch with this creative Brand Valuation Scorecard With Social Selling Index Sample PDF bundle. Topics like Content Marketing, Engagement Sources, Cms Comparison can be discussed with this completely editable template. It is available for immediate download depending on the needs and requirements of the user.
New Product Introduction In The Market Sales Dashboard Ppt PowerPoint Presentation Icon Graphics Download PDF
Presenting this set of slides with name new product introduction in the market sales dashboard ppt powerpoint presentation icon graphics download pdf. The topics discussed in these slides are top products revenue, product sale comparison 2019 2020, incremental sales campaign, cost goods sold. This is a completely editable PowerPoint presentation and is available for immediate download. Download now and impress your audience.

Monthly Planned Vs Actual Revenue Analysis Professional Pdf
This slide showcase monthly target sales with actual sales comparison with variance percentage calculation. It include monthly performance, variance, highest sales. Showcasing this set of slides titled Monthly Planned Vs Actual Revenue Analysis Professional Pdf The topics addressed in these templates are Monthly Planned, Actual Revenue Analysis All the content presented in this PPT design is completely editable. Download it and make adjustments in color, background, font etc. as per your unique business setting.

Visual Metrics For Variance Analysis Techniques And Models Mockup PDF
This slide covers the visual dashboard for Gap analysis model and method. It also contains action plan results, total problems and solution comparison function useful in analysing the gaps and loopholes in the value stream. Showcasing this set of slides titled visual metrics for variance analysis techniques and models mockup pdf. The topics addressed in these templates are total problems vs solutions, action plan results, problems vs solutions comparison. All the content presented in this PPT design is completely editable. Download it and make adjustments in color, background, font etc. as per your unique business setting.
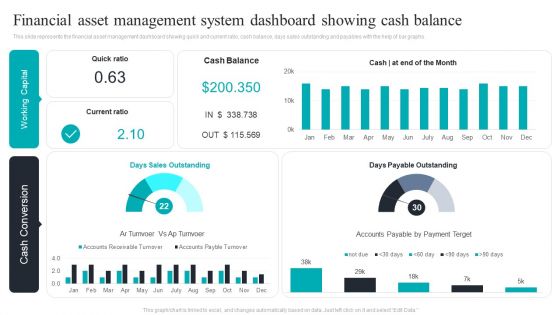
Financial Asset Management System Dashboard Showing Cash Balance Download PDF
This slide represents the financial asset management dashboard showing quick and current ratio, cash balance, days sales outstanding and payables with the help of bar graphs. Pitch your topic with ease and precision using this Financial Asset Management System Dashboard Showing Cash Balance Download PDF. This layout presents information on Financial Asset, Management System, Dashboard Showing, Cash Balance. It is also available for immediate download and adjustment. So, changes can be made in the color, design, graphics or any other component to create a unique layout.

 Home
Home