Comparison Bar Graph

Analyze Corporate Training Effectiveness With KPI Dashboard Ppt Visual Aids Backgrounds PDF
The following slide showcases outcomes of conducting corporate trainings to measure its effectiveness. It includes elements such as absence rate, cost, productivity rate, engagement index, satisfaction rate, acceptance ratio etc. This Analyze Corporate Training Effectiveness With KPI Dashboard Ppt Visual Aids Backgrounds PDF from Slidegeeks makes it easy to present information on your topic with precision. It provides customization options, so you can make changes to the colors, design, graphics, or any other component to create a unique layout. It is also available for immediate download, so you can begin using it right away. Slidegeeks has done good research to ensure that you have everything you need to make your presentation stand out. Make a name out there for a brilliant performance.

Brand Awareness Metrics Volume Of Social Mentions Ppt Gallery Maker PDF
This slide provides information regarding volume of social or brand mentions as brand awareness metrics. It helps in assessing the frequency of brand name mentioned across online platforms. It also include ways to increase volume of mentions. This Brand Awareness Metrics Volume Of Social Mentions Ppt Gallery Maker PDF from Slidegeeks makes it easy to present information on your topic with precision. It provides customization options, so you can make changes to the colors, design, graphics, or any other component to create a unique layout. It is also available for immediate download, so you can begin using it right away. Slidegeeks has done good research to ensure that you have everything you need to make your presentation stand out. Make a name out there for a brilliant performance.
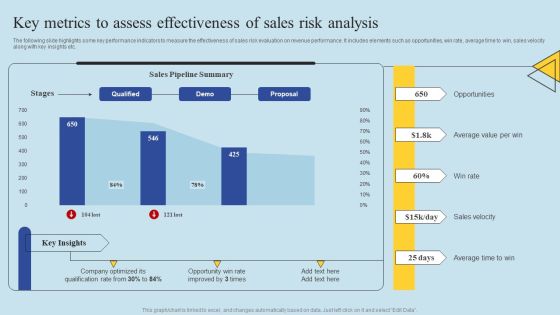
Determining Risks In Sales Administration Procedure Key Metrics To Assess Effectiveness Of Sales Pictures PDF
The following slide highlights some key performance indicators to measure the effectiveness of sales risk evaluation on revenue performance. It includes elements such as opportunities, win rate, average time to win, sales velocity along with key insights etc. This Determining Risks In Sales Administration Procedure Key Metrics To Assess Effectiveness Of Sales Pictures PDF from Slidegeeks makes it easy to present information on your topic with precision. It provides customization options, so you can make changes to the colors, design, graphics, or any other component to create a unique layout. It is also available for immediate download, so you can begin using it right away. Slidegeeks has done good research to ensure that you have everything you need to make your presentation stand out. Make a name out there for a brilliant performance.
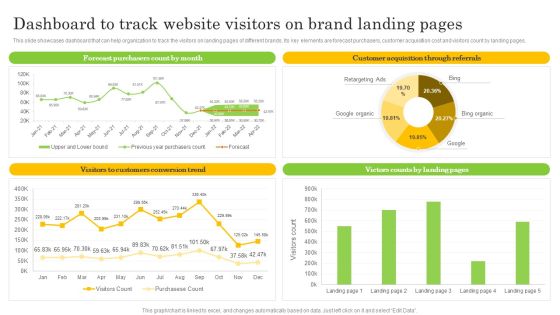
Dashboard To Track Website Visitors On Brand Landing Pages Sample PDF
This slide showcases dashboard that can help organization to track the visitors on landing pages of different brands. Its key elements are forecast purchasers, customer acquisition cost and visitors count by landing pages. This Dashboard To Track Website Visitors On Brand Landing Pages Sample PDF from Slidegeeks makes it easy to present information on your topic with precision. It provides customization options, so you can make changes to the colors, design, graphics, or any other component to create a unique layout. It is also available for immediate download, so you can begin using it right away. Slidegeeks has done good research to ensure that you have everything you need to make your presentation stand out. Make a name out there for a brilliant performance.

Integrating Cobots To Improve Business Processes Which Industry Uses The Most Cobots Infographics PDF
This slide describes the usage of cobots in different industries such as the automotive industry, electrical or electronics, plastic and chemical products, and food and beverage. This Integrating Cobots To Improve Business Processes Which Industry Uses The Most Cobots Infographics PDF from Slidegeeks makes it easy to present information on your topic with precision. It provides customization options, so you can make changes to the colors, design, graphics, or any other component to create a unique layout. It is also available for immediate download, so you can begin using it right away. Slidegeeks has done good research to ensure that you have everything you need to make your presentation stand out. Make a name out there for a brilliant performance.
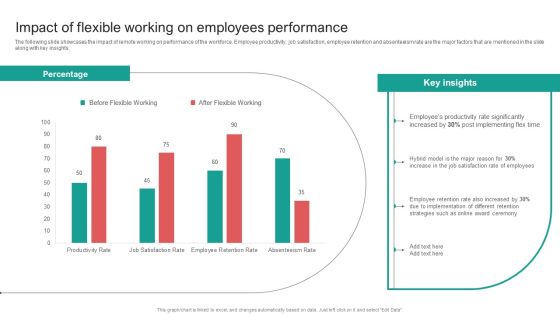
Organising Staff Flexible Job Arrangements Impact Of Flexible Working On Employees Performance Slides PDF
The following slide showcases the impact of remote working on performance of the workforce. Employee productivity, job satisfaction, employee retention and absenteeism rate are the major factors that are mentioned in the slide along with key insights. This Organising Staff Flexible Job Arrangements Impact Of Flexible Working On Employees Performance Slides PDF from Slidegeeks makes it easy to present information on your topic with precision. It provides customization options, so you can make changes to the colors, design, graphics, or any other component to create a unique layout. It is also available for immediate download, so you can begin using it right away. Slidegeeks has done good research to ensure that you have everything you need to make your presentation stand out. Make a name out there for a brilliant performance.

Procurement Strategies For Reducing Stock Wastage Dashboard To Track Inventory Background PDF
This slide showcases KPIs that can help organization to evaluate the efficiency of inventory management process. Its key KPIs are - out of stock rate, on time full deliveries, inventory turnover and average time to sell. This Procurement Strategies For Reducing Stock Wastage Dashboard To Track Inventory Background PDF from Slidegeeks makes it easy to present information on your topic with precision. It provides customization options, so you can make changes to the colors, design, graphics, or any other component to create a unique layout. It is also available for immediate download, so you can begin using it right away. Slidegeeks has done good research to ensure that you have everything you need to make your presentation stand out. Make a name out there for a brilliant performance.

Customer Experience Optimization Customer Service Concerns Faced By The Company Ideas PDF
This slide represent the issues faced by the company due to poor customer services such as decline in customer satisfaction, poor retention rate, falling churn rate etc. This Customer Experience Optimization Customer Service Concerns Faced By The Company Ideas PDF from Slidegeeks makes it easy to present information on your topic with precision. It provides customization options, so you can make changes to the colors, design, graphics, or any other component to create a unique layout. It is also available for immediate download, so you can begin using it right away. Slidegeeks has done good research to ensure that you have everything you need to make your presentation stand out. Make a name out there for a brilliant performance.
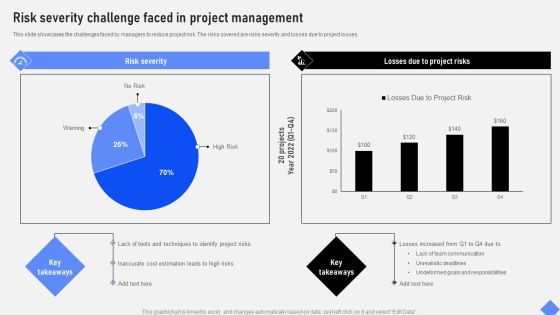
Effective Business Project Risk Mitigation Plan Risk Severity Challenge Faced In Project Management Diagrams PDF
This slide showcases the challenges faced by managers to reduce project risk. The risks covered are risks severity and losses due to project issues. This Effective Business Project Risk Mitigation Plan Risk Severity Challenge Faced In Project Management Diagrams PDF from Slidegeeks makes it easy to present information on your topic with precision. It provides customization options, so you can make changes to the colors, design, graphics, or any other component to create a unique layout. It is also available for immediate download, so you can begin using it right away. Slidegeeks has done good research to ensure that you have everything you need to make your presentation stand out. Make a name out there for a brilliant performance.
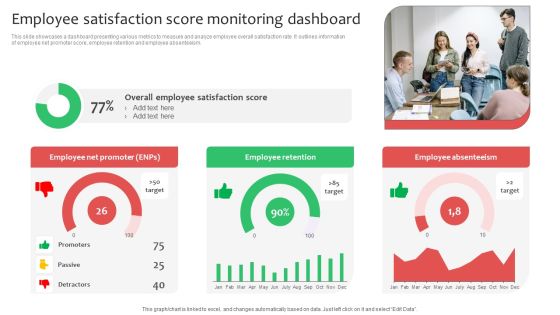
Employee Satisfaction Score Monitoring Dashboard Ppt Infographics Deck PDF
This slide showcases a dashboard presenting various metrics to measure and analyze employee overall satisfaction rate. It outlines information of employee net promoter score, employee retention and employee absenteeism. This Employee Satisfaction Score Monitoring Dashboard Ppt Infographics Deck PDF from Slidegeeks makes it easy to present information on your topic with precision. It provides customization options, so you can make changes to the colors, design, graphics, or any other component to create a unique layout. It is also available for immediate download, so you can begin using it right away. Slidegeeks has done good research to ensure that you have everything you need to make your presentation stand out. Make a name out there for a brilliant performance.
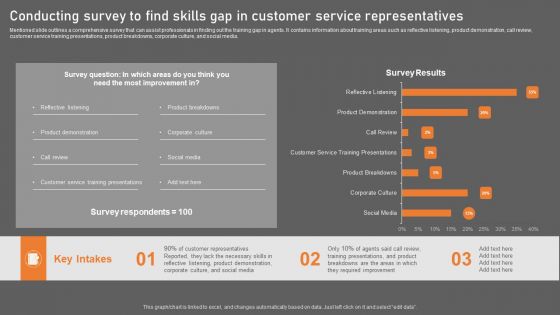
Conducting Survey To Find Skills Gap In Customer Service Representatives Demonstration PDF
Mentioned slide outlines a comprehensive survey that can assist professionals in finding out the training gap in agents. It contains information about training areas such as reflective listening, product demonstration, call review, customer service training presentations, product breakdowns, corporate culture, and social media. This Conducting Survey To Find Skills Gap In Customer Service Representatives Demonstration PDF from Slidegeeks makes it easy to present information on your topic with precision. It provides customization options, so you can make changes to the colors, design, graphics, or any other component to create a unique layout. It is also available for immediate download, so you can begin using it right away. Slidegeeks has done good research to ensure that you have everything you need to make your presentation stand out. Make a name out there for a brilliant performance.

Guide To Healthcare Services Administration KPI Metrics Dashboard To Measure Effectiveness Healthcare Information PDF
The following slide showcases key performance indicator KPI metrics dashboard which can be used to evaluate the success rate of healthcare recruitment. It covers information about technical and non-technical hiring, recruitment costs, current hiring pipeline etc. This Guide To Healthcare Services Administration KPI Metrics Dashboard To Measure Effectiveness Healthcare Information PDF from Slidegeeks makes it easy to present information on your topic with precision. It provides customization options, so you can make changes to the colors, design, graphics, or any other component to create a unique layout. It is also available for immediate download, so you can begin using it right away. Slidegeeks has done good research to ensure that you have everything you need to make your presentation stand out. Make a name out there for a brilliant performance.

Service Strategy Guide To Maximize Customer Experience Statistics Associated With Various Customer Service Portrait PDF
This slide shows statistics which can be used by organizations to draw insights regarding right channel selection for providing customer service. This includes channels such as online live chat, phone, email, social media, etc. This Service Strategy Guide To Maximize Customer Experience Statistics Associated With Various Customer Service Portrait PDF from Slidegeeks makes it easy to present information on your topic with precision. It provides customization options, so you can make changes to the colors, design, graphics, or any other component to create a unique layout. It is also available for immediate download, so you can begin using it right away. Slidegeeks has done good research to ensure that you have everything you need to make your presentation stand out. Make a name out there for a brilliant performance.

Online Marketing Strategy For Lead Generation Dashboard To Track Results Of Performance Marketing Ad Campaigns Slides PDF
This slide showcases dashboard that can help marketers to track and evaluate the outcomes of performance marketing ad campaigns. Its key elements are impressions, clicks, conversions, click through rate, cost per conversion, revenue per click etc This Online Marketing Strategy For Lead Generation Dashboard To Track Results Of Performance Marketing Ad Campaigns Slides PDF from Slidegeeks makes it easy to present information on your topic with precision. It provides customization options, so you can make changes to the colors, design, graphics, or any other component to create a unique layout. It is also available for immediate download, so you can begin using it right away. Slidegeeks has done good research to ensure that you have everything you need to make your presentation stand out. Make a name out there for a brilliant performance.

Comprehensive Guide For Sales And Advertising Processes Digital Marketing Metrics Dashboard To Track Measure Clipart PDF
This slide presents a dashboard to measure and track performance of digital marketing activities using various metrics. It highlights element such as leads, users, users to leads, leads to MQLs, MQLs to SQLs, SQLs to opportunities, social events and social interactions. This Comprehensive Guide For Sales And Advertising Processes Digital Marketing Metrics Dashboard To Track Measure Clipart PDF from Slidegeeks makes it easy to present information on your topic with precision. It provides customization options, so you can make changes to the colors, design, graphics, or any other component to create a unique layout. It is also available for immediate download, so you can begin using it right away. Slidegeeks has done good research to ensure that you have everything you need to make your presentation stand out. Make a name out there for a brilliant performance.

Business To Business Digital Channel Management B2B Ecommerce Market Segmentation By Product Type Designs PDF
This slide represents b2b ecommerce market division on the basis of type of product. it covers consumer electronics, automotive, personal care, clothing, sports etc. This Business To Business Digital Channel Management B2B Ecommerce Market Segmentation By Product Type Designs PDF from Slidegeeks makes it easy to present information on your topic with precision. It provides customization options, so you can make changes to the colors, design, graphics, or any other component to create a unique layout. It is also available for immediate download, so you can begin using it right away. Slidegeeks has done good research to ensure that you have everything you need to make your presentation stand out. Make a name out there for a brilliant performance.
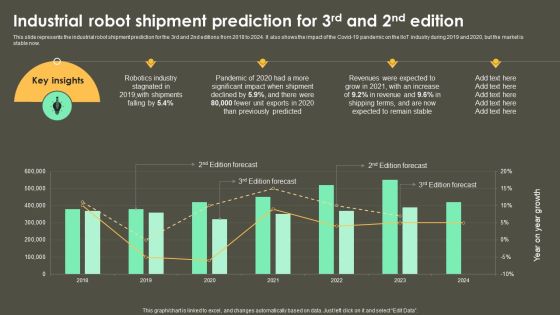
Iot Integration In Manufacturing Industrial Robot Shipment Prediction For 3Rd And 2Nd Edition Themes PDF
This slide represents the industrial robot shipment prediction for the 3rd and 2nd editions from 2018 to 2024. It also shows the impact of the Covid-19 pandemic on the IIoT industry during 2019 and 2020, but the market is stable now. This Iot Integration In Manufacturing Industrial Robot Shipment Prediction For 3Rd And 2Nd Edition Themes PDF from Slidegeeks makes it easy to present information on your topic with precision. It provides customization options, so you can make changes to the colors, design, graphics, or any other component to create a unique layout. It is also available for immediate download, so you can begin using it right away. Slidegeeks has done good research to ensure that you have everything you need to make your presentation stand out. Make a name out there for a brilliant performance.

Advertising Campaign Optimization Process Digital Marketing Performance Evaluation Dashboard Sample PDF
This slide showcases the dashboard that helps to track and measure digital marketing campaign performance. It includes cost, clicks, impressions, STR, conversion rate, etc. This Advertising Campaign Optimization Process Digital Marketing Performance Evaluation Dashboard Sample PDF from Slidegeeks makes it easy to present information on your topic with precision. It provides customization options, so you can make changes to the colors, design, graphics, or any other component to create a unique layout. It is also available for immediate download, so you can begin using it right away. Slidegeeks has done good research to ensure that you have everything you need to make your presentation stand out. Make a name out there for a brilliant performance.

Dashboard For Personalized Digital Marketing Kpis Rules PDF
This slide showcases dashboard that can help organization to measure the KPIs after implementing personalized marketing campaigns. Its key elements are lead breakdown, web user to lead, lead to trial, leads by region and google analtics web traffic. This Dashboard For Personalized Digital Marketing Kpis Rules PDF from Slidegeeks makes it easy to present information on your topic with precision. It provides customization options, so you can make changes to the colors, design, graphics, or any other component to create a unique layout. It is also available for immediate download, so you can begin using it right away. Slidegeeks has done good research to ensure that you have everything you need to make your presentation stand out. Make a name out there for a brilliant performance.

Strategic Approaches To Efficient Candidate Selection Problems Faced By HR Managers While Hiring Guidelines PDF
Following slide illustrates survey that help companies to understand reasons of ineffective hiring by managers. It include pointers such as attracting passive candidates, budget constraints, employee compensation package competition etc. This Strategic Approaches To Efficient Candidate Selection Problems Faced By HR Managers While Hiring Guidelines PDF from Slidegeeks makes it easy to present information on your topic with precision. It provides customization options, so you can make changes to the colors, design, graphics, or any other component to create a unique layout. It is also available for immediate download, so you can begin using it right away. Slidegeeks has done good research to ensure that you have everything you need to make your presentation stand out. Make a name out there for a brilliant performance.

Facebook Ads Dashboard With Campaign Performance Ppt PowerPoint Presentation File Ideas PDF
The following slide outlines comprehensive dashboard through which advertisers can monitor Facebook ads performance. The KPIs outlined in slide are ad spend, conversions, cost per conversion, cost per action, brand impressions, clicks, etc. This Facebook Ads Dashboard With Campaign Performance Ppt PowerPoint Presentation File Ideas PDF from Slidegeeks makes it easy to present information on your topic with precision. It provides customization options, so you can make changes to the colors, design, graphics, or any other component to create a unique layout. It is also available for immediate download, so you can begin using it right away. Slidegeeks has done good research to ensure that you have everything you need to make your presentation stand out. Make a name out there for a brilliant performance.
Evaluating Current Marketing Performance Of Organization Rules PDF
This slide showcases overview of current marketing performance that can help organization to determine issues in current promotional campaigns. Its key elements are website traffic, marketing budget and product sales. This Evaluating Current Marketing Performance Of Organization Rules PDF from Slidegeeks makes it easy to present information on your topic with precision. It provides customization options, so you can make changes to the colors, design, graphics, or any other component to create a unique layout. It is also available for immediate download, so you can begin using it right away. Slidegeeks has done good research to ensure that you have everything you need to make your presentation stand out. Make a name out there for a brilliant performance.

Stages Of Growth Ppt PowerPoint Presentation Complete Deck With Slides
Boost your confidence and team morale with this well-structured Stages Of Growth Ppt PowerPoint Presentation Complete Deck With Slides. This prefabricated set gives a voice to your presentation because of its well-researched content and graphics. Our experts have added all the components very carefully, thus helping you deliver great presentations with a single click. Not only that, it contains a set of seventeen slides that are designed using the right visuals, graphics, etc. Various topics can be discussed, and effective brainstorming sessions can be conducted using the wide variety of slides added in this complete deck. Apart from this, our PPT design contains clear instructions to help you restructure your presentations and create multiple variations. The color, format, design anything can be modified as deemed fit by the user. Not only this, it is available for immediate download. So, grab it now.

Monetary Planning And Evaluation Guide Selecting The Best Source Of Business Finance Ppt Gallery Diagrams PDF
The following slide outlines various sources of finance which will assist the organization to expand their operations. Information covered in this slide is related to sources such as business loans, trade credit, private investors and venture capitalists. Presenting this PowerPoint presentation, titled Monetary Planning And Evaluation Guide Selecting The Best Source Of Business Finance Ppt Gallery Diagrams PDF, with topics curated by our researchers after extensive research. This editable presentation is available for immediate download and provides attractive features when used. Download now and captivate your audience. Presenting this Monetary Planning And Evaluation Guide Selecting The Best Source Of Business Finance Ppt Gallery Diagrams PDF. Our researchers have carefully researched and created these slides with all aspects taken into consideration. This is a completely customizable Monetary Planning And Evaluation Guide Selecting The Best Source Of Business Finance Ppt Gallery Diagrams PDF that is available for immediate downloading. Download now and make an impact on your audience. Highlight the attractive features available with our PPTs.

Market Research Assessment Of Target Market Requirements Kpi Dashboard To Analyze Customer Satisfaction Pictures PDF
The following slide outlines a comprehensive visual representation of customer satisfaction CSAT that can assist companies to measure how happy are customers wit the brand. The KPIs covered are net promoter score NPS, customer effort score CES, product quality, pricing, etc. Presenting this PowerPoint presentation, titled Market Research Assessment Of Target Market Requirements Kpi Dashboard To Analyze Customer Satisfaction Pictures PDF, with topics curated by our researchers after extensive research. This editable presentation is available for immediate download and provides attractive features when used. Download now and captivate your audience. Presenting this Market Research Assessment Of Target Market Requirements Kpi Dashboard To Analyze Customer Satisfaction Pictures PDF. Our researchers have carefully researched and created these slides with all aspects taken into consideration. This is a completely customizable Market Research Assessment Of Target Market Requirements Kpi Dashboard To Analyze Customer Satisfaction Pictures PDF that is available for immediate downloading. Download now and make an impact on your audience. Highlight the attractive features available with our PPTs.

Business Strategy And Promotional Approach For Multiplayer Oriented Mobile Game Casual Gaming User Demographics Icons PDF
The following slide helps in understanding the user demographics of mobile casual gamers, it displays essential data points such as average daily spend by gender, gender breakdown by causal game, age breakdown and average daily time spent by age. Presenting this PowerPoint presentation, titled Business Strategy And Promotional Approach For Multiplayer Oriented Mobile Game Casual Gaming User Demographics Icons PDF, with topics curated by our researchers after extensive research. This editable presentation is available for immediate download and provides attractive features when used. Download now and captivate your audience. Presenting this Business Strategy And Promotional Approach For Multiplayer Oriented Mobile Game Casual Gaming User Demographics Icons PDF. Our researchers have carefully researched and created these slides with all aspects taken into consideration. This is a completely customizable Business Strategy And Promotional Approach For Multiplayer Oriented Mobile Game Casual Gaming User Demographics Icons PDF that is available for immediate downloading. Download now and make an impact on your audience. Highlight the attractive features available with our PPTs.

Showcasing The Results Of Resolving Employees Conflict In House Strategy Ppt Pictures Master Slide PDF
The purpose of this slide is to outline the results of resolving workplace conflicts after developing in-house strategy. Reduction in stress level, increase in trust level, improved work performance and increase in employee retention rate are the major benefits which are mentioned in the slide. Presenting this PowerPoint presentation, titled Showcasing The Results Of Resolving Employees Conflict In House Strategy Ppt Pictures Master Slide PDF, with topics curated by our researchers after extensive research. This editable presentation is available for immediate download and provides attractive features when used. Download now and captivate your audience. Presenting this Showcasing The Results Of Resolving Employees Conflict In House Strategy Ppt Pictures Master Slide PDF. Our researchers have carefully researched and created these slides with all aspects taken into consideration. This is a completely customizable Showcasing The Results Of Resolving Employees Conflict In House Strategy Ppt Pictures Master Slide PDF that is available for immediate downloading. Download now and make an impact on your audience. Highlight the attractive features available with our PPTs.

Benefits Of Enterprise Risk Management Experienced By Organizations Guidelines PDF
This slide represents the ways in which enterprise risk management helps organizations to improve decision quality, reduce business liability and frame regulatory issues. It includes details related to results of survey conducted to analyze benefits of ERM experienced by various organizations. Presenting this PowerPoint presentation, titled Benefits Of Enterprise Risk Management Experienced By Organizations Guidelines PDF, with topics curated by our researchers after extensive research. This editable presentation is available for immediate download and provides attractive Benefits when used. Download now and captivate your audience. Presenting this Benefits Of Enterprise Risk Management Experienced By Organizations Guidelines PDF. Our researchers have carefully researched and created these slides with all aspects taken into consideration. This is a completely customizable Benefits Of Enterprise Risk Management Experienced By Organizations Guidelines PDF that is available for immediate downloading. Download now and make an impact on your audience. Highlight the attractive features available with our PPTs.

Interoperability Software Testing Dashboard For Interoperability Testing Information PDF
This slide depicts the interoperability testing dashboard, based on features like test case analysis, tests linked to requirements, test case breakdown, and tests per requirement, among others. Do you have an important presentation coming up Are you looking for something that will make your presentation stand out from the rest Look no further than Interoperability Software Testing Dashboard For Interoperability Testing Information PDF. With our professional designs, you can trust that your presentation will pop and make delivering it a smooth process. And with Slidegeeks, you can trust that your presentation will be unique and memorable. So why wait Grab Interoperability Software Testing Dashboard For Interoperability Testing Information PDF today and make your presentation stand out from the rest.
Various Factors To Consider While Selecting The Supply Chain Management Automation Tool Icons PDF
The following slide outlines the different factors which can be considered before selecting the automation tool. Reliability of the vendor, availability of core features, usability of the software and deployment are some of the key factors which are highlighted in the slide. Do you have an important presentation coming up Are you looking for something that will make your presentation stand out from the rest Look no further than Various Factors To Consider While Selecting The Supply Chain Management Automation Tool Icons PDF. With our professional designs, you can trust that your presentation will pop and make delivering it a smooth process. And with Slidegeeks, you can trust that your presentation will be unique and memorable. So why wait Grab Various Factors To Consider While Selecting The Supply Chain Management Automation Tool Icons PDF today and make your presentation stand out from the rest.
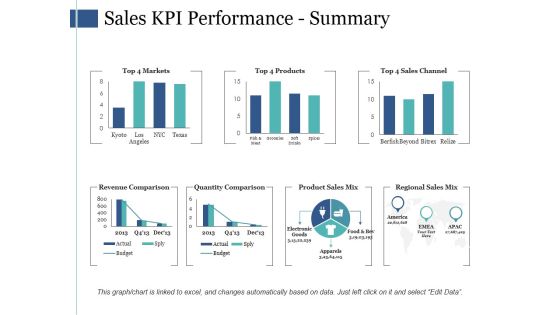
Sales Kpi Performance Summary Ppt PowerPoint Presentation Infographic Template Infographics
This is a sales kpi performance summary ppt powerpoint presentation infographic template infographics. This is a seven stage process. The stages in this process are revenue comparison, quantity comparison, product sales mix, regional sales mix.

Sales Kpi Performance Summary Ppt PowerPoint Presentation Ideas Graphics Template
This is a sales kpi performance summary ppt powerpoint presentation ideas graphics template. This is a seven stage process. The stages in this process are revenue comparison, quantity comparison, product sales mix, regional sales mix.
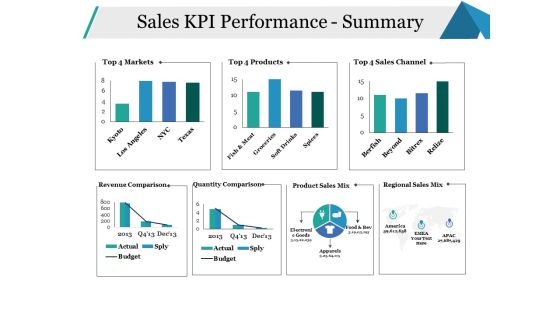
Sales KPI Performance Summary Ppt PowerPoint Presentation Infographics Model
This is a sales kpi performance summary ppt powerpoint presentation infographics model. This is a seven stage process. The stages in this process are sales channel, revenue comparison, quantity comparison, business, marketing.
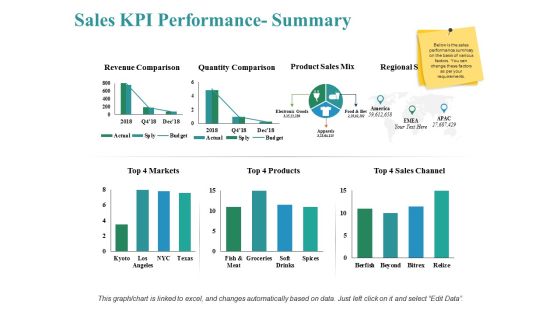
Sales Kpi Performance Summary Ppt PowerPoint Presentation Show Themes
This is a sales kpi performance summary ppt powerpoint presentation show themes. This is a three stage process. The stages in this process are revenue comparison, quantity comparison, product sales mix, markets, sales channel.

Assessing Debt And Equity Fundraising Alternatives For Business Growth Assessing Debt And Best Strategy Template PDF
This slide showcases graph that can help organization to identify the different sources equity funding based upon company stage and size of investment. It can help company to evaluate and compare the different options of equity fundraising. Get a simple yet stunning designed Assessing Debt And Equity Fundraising Alternatives For Business Growth Assessing Debt And Best Strategy Template PDF. It is the best one to establish the tone in your meetings. It is an excellent way to make your presentations highly effective. So, download this PPT today from Slidegeeks and see the positive impacts. Our easy to edit Assessing Debt And Equity Fundraising Alternatives For Business Growth Assessing Debt And Best Strategy Template PDF can be your go to option for all upcoming conferences and meetings. So, what are you waiting for Grab this template today.

Determining The Activities Tools And Skills Required For BPM Initiatives Themes PDF
Mentioned slide portrays details about activities and tools required for business process management initiatives. Here the component on the x-axis of graph is goals and on y-axis is scope.Create an editable Determining The Activities Tools And Skills Required For BPM Initiatives Themes PDF that communicates your idea and engages your audience. Whether you are presenting a business or an educational presentation, pre-designed presentation templates help save time. Determining The Activities Tools And Skills Required For BPM Initiatives Themes PDF is highly customizable and very easy to edit, covering many different styles from creative to business presentations. Slidegeeks has creative team members who have crafted amazing templates. So, go and get them without any delay.
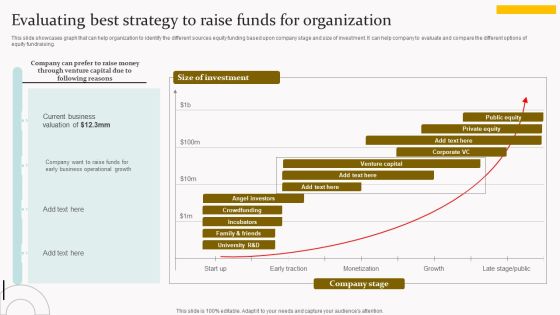
Evaluating Best Strategy To Raise Funds For Organization Ideas PDF
This slide showcases graph that can help organization to identify the different sources equity funding based upon company stage and size of investment. It can help company to evaluate and compare the different options of equity fundraising. Are you searching for a Evaluating Best Strategy To Raise Funds For Organization Ideas PDF that is uncluttered, straightforward, and original Its easy to edit, and you can change the colors to suit your personal or business branding. For a presentation that expresses how much effort you have put in, this template is ideal With all of its features, including tables, diagrams, statistics, and lists, its perfect for a business plan presentation. Make your ideas more appealing with these professional slides. Download Evaluating Best Strategy To Raise Funds For Organization Ideas PDF from Slidegeeks today.

Determining The Activities Tools And Skills Required For BPM Initiatives Designs PDF
Mentioned slide portrays details about activities and tools required for business process management initiatives. Here the component on the x-axis of graph is goals and on y axis is scope. Create an editable Determining The Activities Tools And Skills Required For BPM Initiatives Designs PDF that communicates your idea and engages your audience. Whether you are presenting a business or an educational presentation, pre designed presentation templates help save time. Determining The Activities Tools And Skills Required For BPM Initiatives Designs PDF is highly customizable and very easy to edit, covering many different styles from creative to business presentations. Slidegeeks has creative team members who have crafted amazing templates. So, go and get them without any delay.
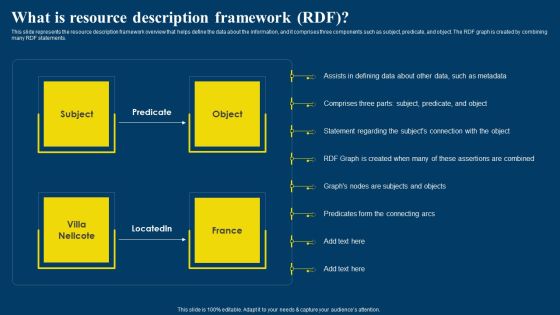
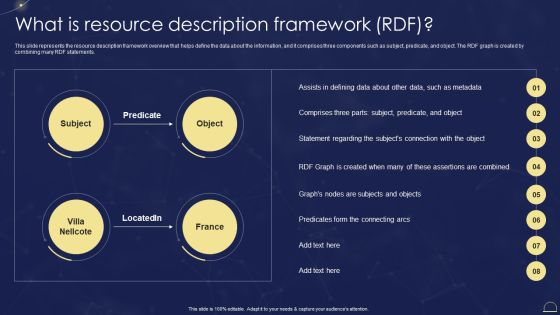
Semantic Web Business Framework Advantages IT What Is Resource Description Framework Demonstration PDF
This slide represents the resource description framework overview that helps define the data about the information, and it comprises three components such as subject, predicate, and object. The RDF graph is created by combining many RDF statements. If you are looking for a format to display your unique thoughts, then the professionally designed Semantic Web Business Framework Advantages IT What Is Resource Description Framework Demonstration PDF is the one for you. You can use it as a Google Slides template or a PowerPoint template. Incorporate impressive visuals, symbols, images, and other charts. Modify or reorganize the text boxes as you desire. Experiment with shade schemes and font pairings. Alter, share or cooperate with other people on your work. Download Semantic Web Business Framework Advantages IT What Is Resource Description Framework Demonstration PDF and find out how to give a successful presentation. Present a perfect display to your team and make your presentation unforgettable.
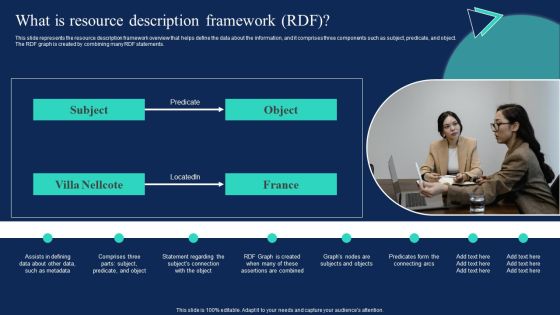
Semantic Web Technologies What Is Resource Description Framework RDF Infographics PDF
This slide represents the resource description framework overview that helps define the data about the information, and it comprises three components such as subject, predicate, and object. The RDF graph is created by combining many RDF statements. Do you know about Slidesgeeks Semantic Web Technologies What Is Resource Description Framework RDF Infographics PDF These are perfect for delivering any kind od presentation. Using it, create PowerPoint presentations that communicate your ideas and engage audiences. Save time and effort by using our pre-designed presentation templates that are perfect for a wide range of topic. Our vast selection of designs covers a range of styles, from creative to business, and are all highly customizable and easy to edit. Download as a PowerPoint template or use them as Google Slides themes.

Concept Of Ontology In The Semantic Web What Is Resource Description Framework RDF Diagrams PDF
This slide represents the resource description framework overview that helps define the data about the information, and it comprises three components such as subject, predicate, and object. The RDF graph is created by combining many RDF statements. Do you know about Slidesgeeks Concept Of Ontology In The Semantic Web Steps To Obtain Semantic Searchs Benefits Demonstration PDF These are perfect for delivering any kind od presentation. Using it, create PowerPoint presentations that communicate your ideas and engage audiences. Save time and effort by using our pre designed presentation templates that are perfect for a wide range of topic. Our vast selection of designs covers a range of styles, from creative to business, and are all highly customizable and easy to edit. Download as a PowerPoint template or use them as Google Slides themes.
Enterprise Information Web Standards What Is Resource Description Framework RDF Diagrams PDF
This slide represents the resource description framework overview that helps define the data about the information, and it comprises three components such as subject, predicate, and object. The RDF graph is created by combining many RDF statements. Welcome to our selection of the Enterprise Information Web Standards What Is Resource Description Framework RDF Diagrams PDF. These are designed to help you showcase your creativity and bring your sphere to life. Planning and Innovation are essential for any business that is just starting out. This collection contains the designs that you need for your everyday presentations. All of our PowerPoints are 100 percent editable, so you can customize them to suit your needs. This multi purpose template can be used in various situations. Grab these presentation templates today.
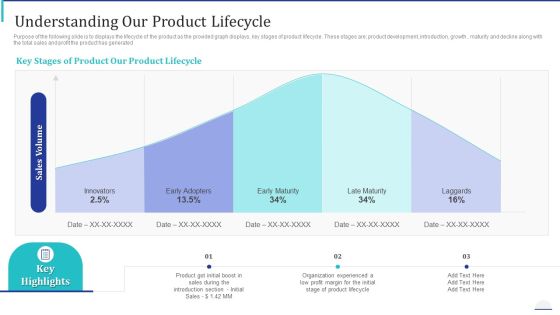
How Make Impactful Product Marketing Message Build Product Differentiation Understanding Our Product Lifecycle Rules PDF
Purpose of the following slide is to displays the lifecycle of the product as the provided graph displays, key stages of product lifecycle. These stages are product development, introduction, growth , maturity and decline along with the total sales and profit the product has generated. This is a how make impactful product marketing message build product differentiation understanding our product lifecycle rules pdf template with various stages. Focus and dispense information on five stages using this creative set, that comes with editable features. It contains large content boxes to add your information on topics like innovators, early adopters, early maturity, late maturity, laggards. You can also showcase facts, figures, and other relevant content using this PPT layout. Grab it now.

Pmi Agile Scrum Master Certification It Figures Showcasing Details About Pmi Credential Holders In Past 12 Months Download PDF
This slide provides information on the rise in PMI ACP credential holders since 2014. Here the graph shows that number of active PMI ACP credential holders surpass the 30,000 mark in the year 2019. This is a pmi agile scrum master certification it figures showcasing details about pmi credential holders in past 12 months download pdf template with various stages. Focus and dispense information on four stages using this creative set, that comes with editable features. It contains large content boxes to add your information on topics like figures showcasing details about pmi credential holders in past 12 months. You can also showcase facts, figures, and other relevant content using this PPT layout. Grab it now.
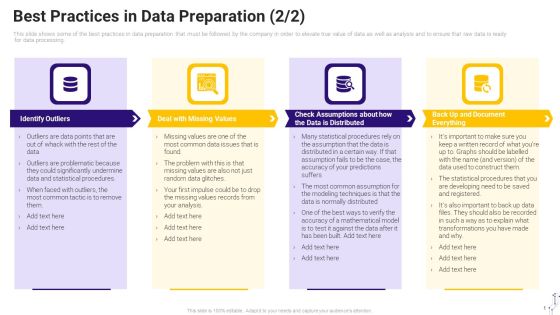
Effective Data Arrangement For Data Accessibility And Processing Readiness Best Practices In Data Preparation Values Information PDF
This slide shows some of the best practices in data preparation that must be followed by the company in order to elevate true value of data as well as analysis and to ensure that raw data is ready for data processing. This is a effective data arrangement for data accessibility and processing readiness best practices in data preparation values information pdf template with various stages. Focus and dispense information on four stages using this creative set, that comes with editable features. It contains large content boxes to add your information on topics like check data formats, verify data types, graph the data, verify data accuracy. You can also showcase facts, figures, and other relevant content using this PPT layout. Grab it now.

Sales Performance Dashboard Template Ppt PowerPoint Presentation Professional Elements
This is a sales performance dashboard template ppt powerpoint presentation professional elements. This is a eight stage process. The stages in this process are sales comparison, sales by product category, sales by month, brand profitability, revenue.
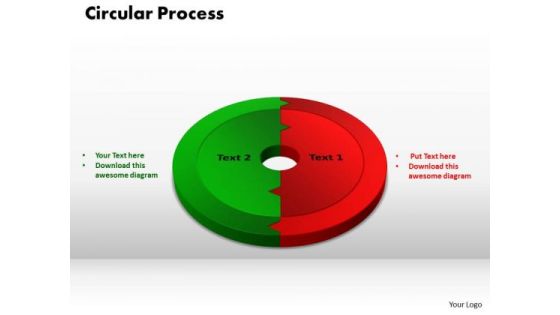
PowerPoint Design Slides Circular Process Business Ppt Backgrounds
PowerPoint Design Slides Circular Process Business PPT Backgrounds-This PowerPoint slide has circular process chart divided two parts that can be used for comparison. You can easily edit the size, percentage, text and color.-PowerPoint Design Slides Circular Process Business PPT Backgrounds

Business Framework Product Segments Vs Customer Market Segments PowerPoint Presentation
Blue and white cubes are used to design this chart for defining the concept of comparison. This PPT slide can be used to compare the product and customer market segments. Use this PPT slide for business and marketing presentations.
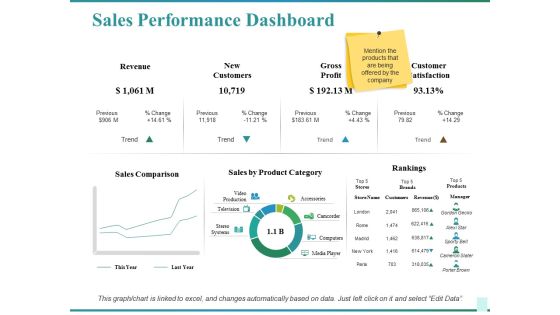
Sales Performance Dashboard Ppt PowerPoint Presentation Show Graphics Design
This is a sales performance dashboard ppt powerpoint presentation show graphics design. This is a two stage process. The stages in this process are sales comparison, sales by product category, rankings, customer satisfaction, revenue.
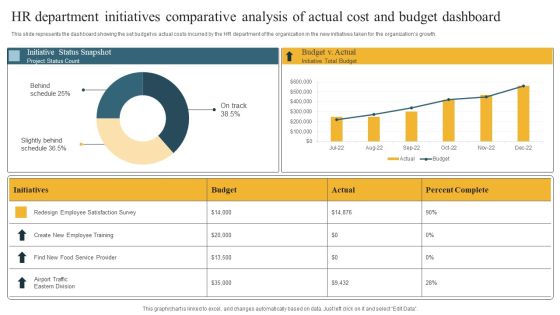
HR Department Initiatives Comparative Analysis Of Actual Cost And Budget Dashboard Introduction PDF
This slide represents the dashboard showing the set budget vs actual costs incurred by the HR department of the organization in the new initiatives taken for the organizations growth. Showcasing this set of slides titled HR Department Initiatives Comparative Analysis Of Actual Cost And Budget Dashboard Introduction PDF. The topics addressed in these templates are Behind Schedule, Slightly Behind Schedule, Initiative Status Snapshot. All the content presented in this PPT design is completely editable. Download it and make adjustments in color, background, font etc. as per your unique business setting.
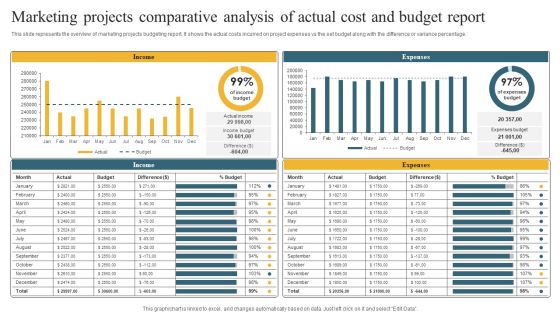
Marketing Projects Comparative Analysis Of Actual Cost And Budget Report Themes PDF
This slide represents the overview of marketing projects budgeting report. It shows the actual costs incurred on project expenses vs the set budget along with the difference or variance percentage. Showcasing this set of slides titled Marketing Projects Comparative Analysis Of Actual Cost And Budget Report Themes PDF. The topics addressed in these templates are Income, Expenses, Report. All the content presented in this PPT design is completely editable. Download it and make adjustments in color, background, font etc. as per your unique business setting.

Feature Development Data Associated Activities Guidelines PDF
This slide exhibits survey of data scientists to understand feature engineering activities that helps to improve performance of machine learning business models. It includes activities such as data cleaning, organizing, collection, mining, refining algorithms etc. Pitch your topic with ease and precision using this Feature Development Data Associated Activities Guidelines PDF. This layout presents information on Programming, Developing Training Sets, Gathering Data Sets. It is also available for immediate download and adjustment. So, changes can be made in the color, design, graphics or any other component to create a unique layout.
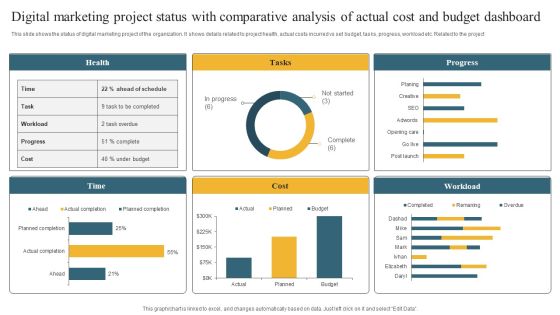
Digital Marketing Project Status With Comparative Analysis Of Actual Cost And Budget Dashboard Information PDF
This slide shows the status of digital marketing project of the organization. It shows details related to project health, actual costs incurred vs set budget, tasks, progress, workload etc. Related to the project Pitch your topic with ease and precision using this Digital Marketing Project Status With Comparative Analysis Of Actual Cost And Budget Dashboard Information PDF. This layout presents information on Health, Tasks, Progress. It is also available for immediate download and adjustment. So, changes can be made in the color, design, graphics or any other component to create a unique layout.

3d Building Blocks Business Success 5 Stages Ideas PowerPoint Slides
We present our 3d building blocks business success 5 stages ideas PowerPoint Slides.Present our Process and Flows PowerPoint Templates because Timeline crunches are a fact of life. Meet all deadlines using our PowerPoint Templates and Slides. Download and present our Flow Charts PowerPoint Templates because Our PowerPoint Templates and Slides will give good value for money. They also have respect for the value of your time. Download and present our Business PowerPoint Templates because These PowerPoint Templates and Slides will give the updraft to your ideas. See them soar to great heights with ease. Download our Marketing PowerPoint Templates because Our PowerPoint Templates and Slides are aesthetically designed to attract attention. We gaurantee that they will grab all the eyeballs you need. Download our Success PowerPoint Templates because you should once Tap the ingenuity of our PowerPoint Templates and Slides. They are programmed to succeed.Use these PowerPoint slides for presentations relating to Lego, building, concept, standard, electric, brick, economy, conservation, bar, eco, power, pollution, consumption, render, diagram, electricity, ecology, level, effectiveness, scale, idea, graph, protection, energy, comparison, object, efficiency, chart, protect, efficient, rating, norm, color, toy, friendly, saving, background, environment, ecological, construction, game, block, effective. The prominent colors used in the PowerPoint template are Red, Green, Yellow.

Blocks For Two Dendent Processes 6 Stages Ppt Business Plan PowerPoint Templates
We present our blocks for two dendent processes 6 stages ppt business plan PowerPoint templates.Use our Process and Flows PowerPoint Templates because Our PowerPoint Templates and Slides will let your ideas bloom. Create a bed of roses for your audience. Use our Flow Charts PowerPoint Templates because Our PowerPoint Templates and Slides will Embellish your thoughts. They will help you illustrate the brilliance of your ideas. Present our Business PowerPoint Templates because Our PowerPoint Templates and Slides have the Brilliant backdrops. Guaranteed to illuminate the minds of your audience. Download our Marketing PowerPoint Templates because You can Raise a toast with our PowerPoint Templates and Slides. Spread good cheer amongst your audience. Download and present our Success PowerPoint Templates because They will Put the wind in your sails. Skim smoothly over the choppy waters of the market.Use these PowerPoint slides for presentations relating to Lego, building, concept, standard, electric, brick, economy, conservation, bar, eco, power, pollution, consumption, render, diagram, electricity, ecology, level, effectiveness, scale, idea, graph, protection, energy, comparison, object, efficiency, chart, protect, efficient, rating, norm, color, toy,home, house, friendly, saving, background, environment, ecological, construction, game, block, effective. The prominent colors used in the PowerPoint template are Black, Green, Blue.

Colorful Lego Blocks Business Development Open Source Plan Software PowerPoint Slides
We present our colorful lego blocks business development open source plan software PowerPoint Slides.Use our Process and Flows PowerPoint Templates because It is Aesthetically crafted by artistic young minds. Our PowerPoint Templates and Slides are designed to display your dexterity. Download and present our Flow Charts PowerPoint Templates because You can Double your output with our PowerPoint Templates and Slides. They make beating deadlines a piece of cake. Download and present our Business PowerPoint Templates because Our PowerPoint Templates and Slides come in all colours, shades and hues. They help highlight every nuance of your views. Present our Marketing PowerPoint Templates because you can Add colour to your speech with our PowerPoint Templates and Slides. Your presentation will leave your audience speechless. Download and present our Success PowerPoint Templates because you should once Tap the ingenuity of our PowerPoint Templates and Slides. They are programmed to succeed.Use these PowerPoint slides for presentations relating to Lego, building, concept, standard, electric, brick, economy, conservation, bar, eco, power, pollution, consumption, render, diagram, electricity, ecology, level, effectiveness, scale, idea, graph, protection, energy, comparison, object, efficiency, chart, protect, efficient, rating, norm, color, toy, friendly, saving, background, environment, ecological, construction, game, block, effective. The prominent colors used in the PowerPoint template are Green, Red, Blue.
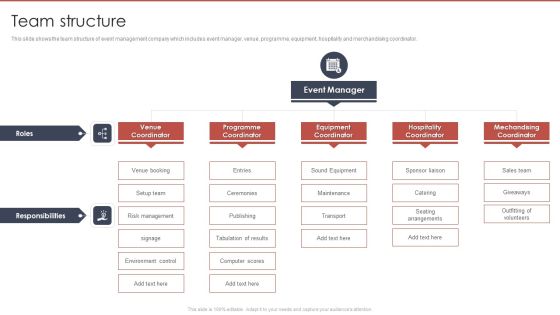
Event Planning And Management Company Profile Team Structure Designs PDF
This slide shows the team structure of event management company which includes event manager, venue, programme, equipment, hospitality and merchandising coordinator. This is a Event Planning And Management Company Profile Team Structure Designs PDF template with various stages. Focus and dispense information on three stages using this creative set, that comes with editable features. It contains large content boxes to add your information on topics like Venue Coordinator Programme, Coordinator Equipment Coordinator, Hospitality Coordinator Mechandising. You can also showcase facts, figures, and other relevant content using this PPT layout. Grab it now.

HR Recruitment Flow Chart Ppt PowerPoint Presentation Complete With Slides
This HR Recruitment Flow Chart Ppt PowerPoint Presentation Complete With Slides acts as backup support for your ideas, vision, thoughts, etc. Use it to present a thorough understanding of the topic. This PPT slideshow can be utilized for both in-house and outside presentations depending upon your needs and business demands. Entailing sixteen slides with a consistent design and theme, this template will make a solid use case. As it is intuitively designed, it suits every business vertical and industry. All you have to do is make a few tweaks in the content or any other component to design unique presentations. The biggest advantage of this complete deck is that it can be personalized multiple times once downloaded. The color, design, shapes, and other elements are free to modify to add personal touches. You can also insert your logo design in this PPT layout. Therefore a well-thought and crafted presentation can be delivered with ease and precision by downloading this HR Recruitment Flow Chart Ppt PowerPoint Presentation Complete With Slides PPT slideshow.
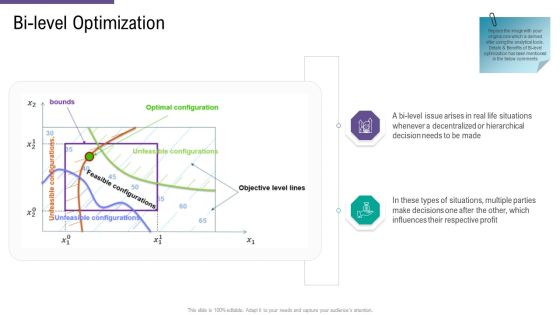
SCM And Purchasing Bi Level Optimization Ppt Pictures Background Images PDF
This is a scm and purchasing bi level optimization ppt pictures background images pdf template with various stages. Focus and dispense information on two stages using this creative set, that comes with editable features. It contains large content boxes to add your information on topics like bi level optimization . You can also showcase facts, figures, and other relevant content using this PPT layout. Grab it now.

Employee Demographics Data And Designation Analysis Dashboard Introduction PDF
The purpose of this template is to explain the analysis of employee demographics and designation dashboard. The slide provides information about gender, ethnicity, location and structure. Pitch your topic with ease and precision using this Employee Demographics Data And Designation Analysis Dashboard Introduction PDF. This layout presents information on Job Functions, Top Locations, Employee Structure It is also available for immediate download and adjustment. So, changes can be made in the color, design, graphics or any other component to create a unique layout.

Challenges Faced In Implementation Of Advocacy Strategy Introduction PDF
The following slide displays statistical report for advocacy plan execution challenges faced by organization. It includes components such as employee motivation, budget, regulatory compliance, tools and technologies, etc. Showcasing this set of slides titled Challenges Faced In Implementation Of Advocacy Strategy Introduction PDF The topics addressed in these templates are Key Insights, Strategy, Overall Engagement. All the content presented in this PPT design is completely editable. Download it and make adjustments in color, background, font etc. as per your unique business setting.
IT Organization Structure Ppt PowerPoint Presentation Complete Deck With Slides
This IT Organization Structure Ppt PowerPoint Presentation Complete Deck With Slides acts as backup support for your ideas, vision, thoughts, etc. Use it to present a thorough understanding of the topic. This PPT slideshow can be utilized for both in-house and outside presentations depending upon your needs and business demands. Entailing eleven slides with a consistent design and theme, this template will make a solid use case. As it is intuitively designed, it suits every business vertical and industry. All you have to do is make a few tweaks in the content or any other component to design unique presentations. The biggest advantage of this complete deck is that it can be personalized multiple times once downloaded. The color, design, shapes, and other elements are free to modify to add personal touches. You can also insert your logo design in this PPT layout. Therefore a well-thought and crafted presentation can be delivered with ease and precision by downloading this IT Organization Structure Ppt PowerPoint Presentation Complete Deck With Slides PPT slideshow.

Process Landscape Diagram Ppt PowerPoint Presentation Complete Deck
This Process Landscape Diagram Ppt PowerPoint Presentation Complete Deck acts as backup support for your ideas, vision, thoughts, etc. Use it to present a thorough understanding of the topic. This PPT slideshow can be utilized for both in-house and outside presentations depending upon your needs and business demands. Entailing tweleve slides with a consistent design and theme, this template will make a solid use case. As it is intuitively designed, it suits every business vertical and industry. All you have to do is make a few tweaks in the content or any other component to design unique presentations. The biggest advantage of this complete deck is that it can be personalized multiple times once downloaded. The color, design, shapes, and other elements are free to modify to add personal touches. You can also insert your logo design in this PPT layout. Therefore a well-thought and crafted presentation can be delivered with ease and precision by downloading this Process Landscape Diagram Ppt PowerPoint Presentation Complete Deck PPT slideshow.

Big Data Architect Artificial Intelligence And Big Data Management Introduction PDF
This slide explains the relationship between artificial intelligence and big data and how it would help detect anomalies, probabilities of future outcomes, pattern recognition, and data bars and graphs.This is a Big Data Architect Artificial Intelligence And Big Data Management Introduction PDF template with various stages. Focus and dispense information on eight stages using this creative set, that comes with editable features. It contains large content boxes to add your information on topics like Planning Scheduling, Speech Recognition, Future Outcomes. You can also showcase facts, figures, and other relevant content using this PPT layout. Grab it now.

Data Analytics Management Artificial Intelligence And Big Data Management Microsoft PDF
This slide explains the relationship between artificial intelligence and big data and how it would help detect anomalies, probabilities of future outcomes, pattern recognition, and data bars and graphs.This is a Data Analytics Management Artificial Intelligence And Big Data Management Microsoft PDF template with various stages. Focus and dispense information on one stage using this creative set, that comes with editable features. It contains large content boxes to add your information on topics like Machine Learning, Language Processing, Planning Scheduling. You can also showcase facts, figures, and other relevant content using this PPT layout. Grab it now.
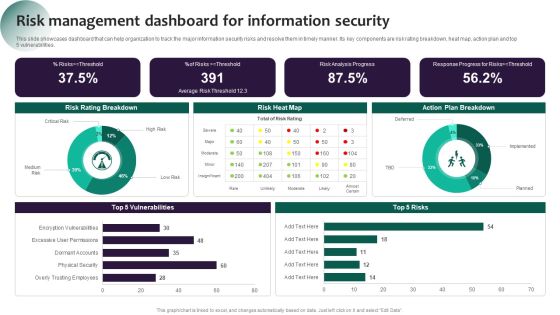
Information Systems Security And Risk Management Plan Risk Management Dashboard For Information Security Pictures PDF
This slide showcases dashboard that can help organization to track the major information security risks and resolve them in timely manner. Its key components are risk rating breakdown, heat map, action plan and top 5 vulnerabilities. The best PPT templates are a great way to save time, energy, and resources. Slidegeeks have 100 percent editable powerpoint slides making them incredibly versatile. With these quality presentation templates, you can create a captivating and memorable presentation by combining visually appealing slides and effectively communicating your message. Download Information Systems Security And Risk Management Plan Risk Management Dashboard For Information Security Pictures PDF from Slidegeeks and deliver a wonderful presentation.

Multi Channel Marketing Strategy Dashboard Slides PDF
This slide showcases marketing channels instrument board. The purpose of this template is evaluate progress and improve decision making. It includes elements such as marketing channel type digital marketing, free marketing, paid marketing and traditional marketing, main KPIS, click revenue. Pitch your topic with ease and precision using this Multi Channel Marketing Strategy Dashboard Slides PDF. This layout presents information on Bounce Rate, Conversion Rate, Marketing Channel Type. It is also available for immediate download and adjustment. So, changes can be made in the color, design, graphics or any other component to create a unique layout.

Metrics Dashboard Depicting Call Center Performance Pictures PDF
Mentioned slide outlines key performance indicator KPI dashboard which can be used by call center to optimize the agents performance. The major metrics covered in the template are total calls, average speed of answer, abandon rate, service level agreement SLA limit etc. Pitch your topic with ease and precision using this Metrics Dashboard Depicting Call Center Performance Pictures PDF. This layout presents information on Overall Satisfaction Score, Satisfaction Score, Performance. It is also available for immediate download and adjustment. So, changes can be made in the color, design, graphics or any other component to create a unique layout.

Business Survey Analysis Dashboard Based On Demographics Data Microsoft PDF
The purpose of this template is to explain the analysis of business survey conduct based on demographics. The slide provides information about support team, respondents and product preference. Pitch your topic with ease and precision using this Business Survey Analysis Dashboard Based On Demographics Data Microsoft PDF. This layout presents information on Support, Team Performance, Product Preference It is also available for immediate download and adjustment. So, changes can be made in the color, design, graphics or any other component to create a unique layout.

Analysis Plan For E Commerce Promotion Tactics Dashboard To Track Cross Channel Social Media Performance Demonstration PDF
This slide depicts the dashboard to track cross channel social media performance providing information regarding the multiple KPIs such as social engagement, applause rate, conversation rate. It also includes details of average ROI from multiple social media channels such as Twitter, Facebook, Instagram etc. This Analysis Plan For E Commerce Promotion Tactics Dashboard To Track Cross Channel Social Media Performance Demonstration PDF is perfect for any presentation, be it in front of clients or colleagues. It is a versatile and stylish solution for organizing your meetings. The Analysis Plan For E Commerce Promotion Tactics Dashboard To Track Cross Channel Social Media Performance Demonstration PDF features a modern design for your presentation meetings. The adjustable and customizable slides provide unlimited possibilities for acing up your presentation. Slidegeeks has done all the homework before launching the product for you. So, do not wait, grab the presentation templates today.

Analysis Plan For E Commerce Promotion Tactics Spend And Return On Investment Of Deployed Social Media Channels Mockup PDF
This slide graphically illustrate the spend and ROI performance of deployed social media channels. It also provides the information regarding the number of lead generated from each channel such as Twitter, Facebook, Instagram. Are you searching for a Analysis Plan For E Commerce Promotion Tactics Spend And Return On Investment Of Deployed Social Media Channels Mockup PDF that is uncluttered, straightforward, and original Its easy to edit, and you can change the colors to suit your personal or business branding. For a presentation that expresses how much effort you have put in, this template is ideal With all of its features, including tables, diagrams, statistics, and lists, its perfect for a business plan presentation. Make your ideas more appealing with these professional slides. Download Analysis Plan For E Commerce Promotion Tactics Spend And Return On Investment Of Deployed Social Media Channels Mockup PDF from Slidegeeks today.
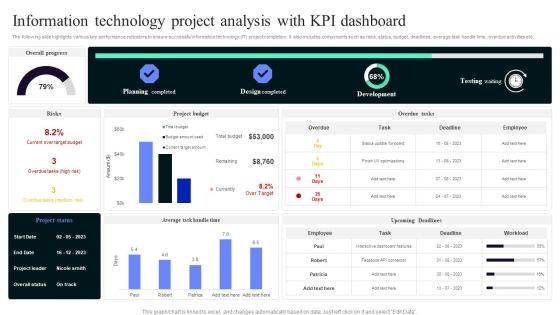
Information Technology Project Analysis With Kpi Dashboard Portrait PDF
The following slide highlights various key performance indicators to ensure successful information technology IT project completion. It also includes components such as risks, status, budget, deadlines, average task handle time, overdue activities etc. Pitch your topic with ease and precision using this Information Technology Project Analysis With Kpi Dashboard Portrait PDF. This layout presents information on Planning Completed, Design Completed, Development . It is also available for immediate download and adjustment. So, changes can be made in the color, design, graphics or any other component to create a unique layout.
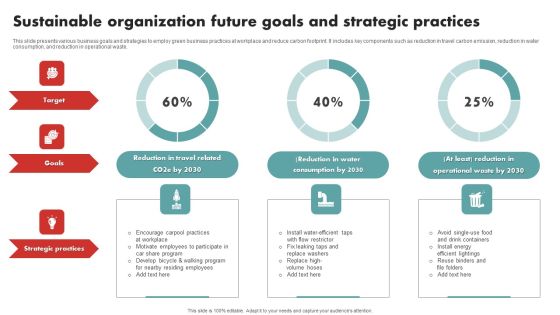
Sustainable Organization Future Goals And Strategic Practices Sample PDF
This slide presents various business goals and strategies to employ green business practices at workplace and reduce carbon footprint. It includes key components such as reduction in travel carbon emission, reduction in water consumption, and reduction in operational waste. Pitch your topic with ease and precision using this Sustainable Organization Future Goals And Strategic Practices Sample PDF This layout presents information on Goals, Target, Strategic Practices. It is also available for immediate download and adjustment. So, changes can be made in the color, design, graphics or any other component to create a unique layout.

Skill Will Matrix To Improve Effectiveness Ppt PowerPoint Presentation Complete With Slides
Boost your confidence and team morale with this well-structured Skill Will Matrix To Improve Effectiveness Ppt PowerPoint Presentation Complete With Slides. This prefabricated set gives a voice to your presentation because of its well-researched content and graphics. Our experts have added all the components very carefully, thus helping you deliver great presentations with a single click. Not only that, it contains a set of forteen slides that are designed using the right visuals, graphics, etc. Various topics can be discussed, and effective brainstorming sessions can be conducted using the wide variety of slides added in this complete deck. Apart from this, our PPT design contains clear instructions to help you restructure your presentations and create multiple variations. The color, format, design anything can be modified as deemed fit by the user. Not only this, it is available for immediate download. So, grab it now.
Workflow Management Icon Ppt PowerPoint Presentation Complete Deck With Slides
Boost your confidence and team morale with this well-structured Workflow Management Icon Ppt PowerPoint Presentation Complete Deck With Slides. This prefabricated set gives a voice to your presentation because of its well-researched content and graphics. Our experts have added all the components very carefully, thus helping you deliver great presentations with a single click. Not only that, it contains a set of twelve slides that are designed using the right visuals, graphics, etc. Various topics can be discussed, and effective brainstorming sessions can be conducted using the wide variety of slides added in this complete deck. Apart from this, our PPT design contains clear instructions to help you restructure your presentations and create multiple variations. The color, format, design anything can be modified as deemed fit by the user. Not only this, it is available for immediate download. So, grab it now.

Data Governance Operational Framework Ppt PowerPoint Presentation Complete Deck With Slides
Boost your confidence and team morale with this well-structured Data Governance Operational Framework Ppt PowerPoint Presentation Complete Deck With Slides. This prefabricated set gives a voice to your presentation because of its well-researched content and graphics. Our experts have added all the components very carefully, thus helping you deliver great presentations with a single click. Not only that, it contains a set of fifteen slides that are designed using the right visuals, graphics, etc. Various topics can be discussed, and effective brainstorming sessions can be conducted using the wide variety of slides added in this complete deck. Apart from this, our PPT design contains clear instructions to help you restructure your presentations and create multiple variations. The color, format, design anything can be modified as deemed fit by the user. Not only this, it is available for immediate download. So, grab it now.
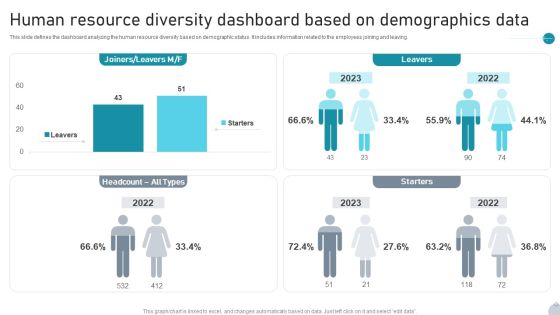
Human Resource Diversity Dashboard Based On Demographics Data Rules PDF
This slide defines the dashboard analyzing the human resource diversity based on demographic status. It includes information related to the employees joining and leaving. Pitch your topic with ease and precision using this Human Resource Diversity Dashboard Based On Demographics Data Rules PDF. This layout presents information on Starters, Leavers, Demographics Data It is also available for immediate download and adjustment. So, changes can be made in the color, design, graphics or any other component to create a unique layout.

Social Media Demographic Data Analysis Dashboard Infographics PDF
This slide defines the dashboard analyzing the social media demographics. It includes information related to the trends, followers and impressions. Pitch your topic with ease and precision using this Social Media Demographic Data Analysis Dashboard Infographics PDF. This layout presents information on Audience Demographics, Group Trends, Impressions Demographics It is also available for immediate download and adjustment. So, changes can be made in the color, design, graphics or any other component to create a unique layout.

Dashboard For Innovative Product Concept Performance In Market Formats PDF
This slide represents dashboard for innovative product performance in market. It includes usage intention, willingness to pay, purchase intention etc. Pitch your topic with ease and precision using this Dashboard For Innovative Product Concept Performance In Market Formats PDF This layout presents information on Usage Intention, Willingess To Pay, Purchase Intention . It is also available for immediate download and adjustment. So, changes can be made in the color, design, graphics or any other component to create a unique layout.

Innovative Product Concept Development And Management Dashboard Introduction PDF
This slide represents dashboard for innovative product management. It includes ideas raised, project funding, challenges against ideas etc. Pitch your topic with ease and precision using this Innovative Product Concept Development And Management Dashboard Introduction PDF This layout presents information on Scoring Ideas, Budget Allocated, Challenges. It is also available for immediate download and adjustment. So, changes can be made in the color, design, graphics or any other component to create a unique layout.

Digital Transformation Purpose And Key Performance Indicators Formats PDF
The slide shows a pie chart presenting objectives of conducting digital advancement in organization with KPIs. It includes KPIs like user satisfaction, economic, productive, trader control metrics, risk metrics, saving goals and advancements. Pitch your topic with ease and precision using this Digital Transformation Purpose And Key Performance Indicators Formats PDF. This layout presents information on Key Performance Indicators, Digital Transformation, Minimize Costs. It is also available for immediate download and adjustment. So, changes can be made in the color, design, graphics or any other component to create a unique layout.

Cybersecurity Statistical Data Insights Sample PDF
The given below slide presents the number of organizations being victim of cyber attacks in the previous year. It also includes category wise attack data in the form of donut chart. Pitch your topic with ease and precision using this Cybersecurity Statistical Data Insights Sample PDF. This layout presents information on Social Media Attacks, Malware Attacks, Phishing Attacks. It is also available for immediate download and adjustment. So, changes can be made in the color, design, graphics or any other component to create a unique layout.

Energy Efficiency Dashboard To Track Campaign Effectiveness Pictures PDF
This slide consists of a dashboard which presents an energy saving dashboard which can be used to track effectiveness of energy saving program. The key performance indicators relate to energy sources, energy consumption by sectors, energy consumption by sectors etc. Pitch your topic with ease and precision using this Energy Efficiency Dashboard To Track Campaign Effectiveness Pictures PDF. This layout presents information on Energy Sources, Energy Usage, Trend Analysis. It is also available for immediate download and adjustment. So, changes can be made in the color, design, graphics or any other component to create a unique layout.

Global Health Technology Trends Highlighting Artificial Intelligence Applications Formats PDF
The following slide showcases applications to change fitness trends which helps to connect with patients and provides care by increasing overall efficiency of customer management. It presents information related to fraud detection, connected machines, etc. Pitch your topic with ease and precision using this Global Health Technology Trends Highlighting Artificial Intelligence Applications Formats PDF. This layout presents information on Key Drivers, Solutions, Enhanced Accuracy. It is also available for immediate download and adjustment. So, changes can be made in the color, design, graphics or any other component to create a unique layout.

Facebook Strategies Dashboard To Track Progress Structure PDF
This slides showcases dashboard to monitor the progress of Facebook page. It includes elements such as total likes, followers, likes by country, by age , engagement types and Facebook videos views. Pitch your topic with ease and precision using this Facebook Strategies Dashboard To Track Progress Structure PDF. This layout presents information on Followers, Engagement Type, Shares. It is also available for immediate download and adjustment. So, changes can be made in the color, design, graphics or any other component to create a unique layout.

KPI Dashboard To Assess Deals In Mergers And Acquisitions Strategy Rules PDF
Following slide showcases dashboard for mergers and acquisitions to measure effects of milestones to confirm integration plan accordingly. It presents information related to deals by types, country, etc. Pitch your topic with ease and precision using this KPI Dashboard To Assess Deals In Mergers And Acquisitions Strategy Rules PDF. This layout presents information on Status, Strategy, Minority Equity Stake. It is also available for immediate download and adjustment. So, changes can be made in the color, design, graphics or any other component to create a unique layout.

Annual Financial Data With KPI Insights Dashboard Structure PDF
The following slides highlights the financial kpas in summarized form to evaluate companys annual operating performance. It includes metrics such as gross, operating and net profit margin, income statement, target versus actual EBIT etc. Pitch your topic with ease and precision using this Annual Financial Data With KPI Insights Dashboard Structure PDF. This layout presents information on Gross Profit Margin, Operating Profit Margin, Net Profit Margin. It is also available for immediate download and adjustment. So, changes can be made in the color, design, graphics or any other component to create a unique layout.
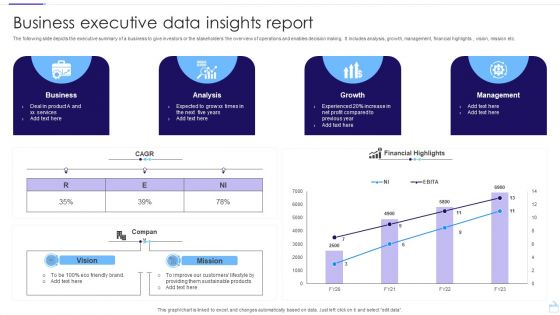
Business Executive Data Insights Report Pictures PDF
The following slide depicts the executive summary of a business to give investors or the stakeholders the overview of operations and enables decision making. It includes analysis, growth, management, financial highlights , vision, mission etc. Pitch your topic with ease and precision using this Business Executive Data Insights Report Pictures PDF. This layout presents information on Business, Analysis, Growth. It is also available for immediate download and adjustment. So, changes can be made in the color, design, graphics or any other component to create a unique layout.

Product Data Insights Analysis Sheet Infographics PDF
The following slide depicts the annual performance of multiple products in terms of profit or loss to track whether they are doing well or not. The analysis sheet includes element such as cost, units, selling price, sales etc. Pitch your topic with ease and precision using this Product Data Insights Analysis Sheet Infographics PDF. This layout presents information on Unit Sold, Selling Price, Total Sales. It is also available for immediate download and adjustment. So, changes can be made in the color, design, graphics or any other component to create a unique layout.

Call Center Metrics Dashboard Highlighting Service Level Infographics PDF
Mentioned slide outlines comprehensive call center KPI dashboard. Information covered in this slide is related to various metrics such as queue calls, support and billing service level, inbound volume, outbound volume etc. Pitch your topic with ease and precision using this Call Center Metrics Dashboard Highlighting Service Level Infographics PDF. This layout presents information on All Agents, Queue Calls, Billing Service Level. It is also available for immediate download and adjustment. So, changes can be made in the color, design, graphics or any other component to create a unique layout.

Call Center Metrics Dashboard With Average Queue Time Topics PDF
Mentioned slide outlines call center KPI dashboard which gives insights into customer agent performance. The KPI covered in the slide are total voicemail, average talk time, queue time, average quality rate, agent performance, etc. Pitch your topic with ease and precision using this Call Center Metrics Dashboard With Average Queue Time Topics PDF. This layout presents information on Efficiency, Quality, Activity. It is also available for immediate download and adjustment. So, changes can be made in the color, design, graphics or any other component to create a unique layout.

Call Center Metrics Dashboard With Cost Per Contact Rules PDF
Mentioned slide outlines KPI dashboard which allows the business to monitor the efficiency of call center. The metrics covered in the slide are first call resolution, average speed of answer, customer satisfaction, cost per contact etc. Pitch your topic with ease and precision using this Call Center Metrics Dashboard With Cost Per Contact Rules PDF. This layout presents information on Cost Per Contract, Key Metrics, Customer Satisfaction. It is also available for immediate download and adjustment. So, changes can be made in the color, design, graphics or any other component to create a unique layout.

Call Center Metrics Dashboard With First Response Time Background PDF
Mentioned slide outlines a KPI dashboard which can be used by call centers for the ticket system. Tickets created, unassigned, open, solved, escalated, tickets solved by agents, first response and full resolution time are the key metrics highlighted in the slide. Pitch your topic with ease and precision using this Call Center Metrics Dashboard With First Response Time Background PDF. This layout presents information on First Response Time, First Resolution Time, Response Time. It is also available for immediate download and adjustment. So, changes can be made in the color, design, graphics or any other component to create a unique layout.
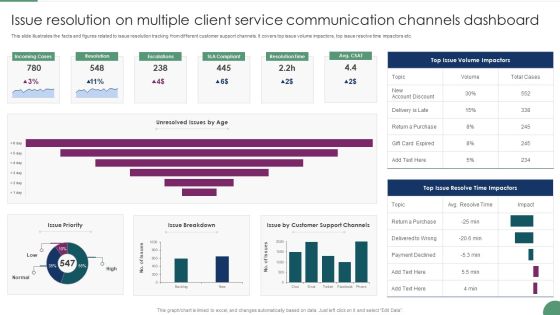
Issue Resolution On Multiple Client Service Communication Channels Dashboard Microsoft PDF
This slide illustrates the facts and figures related to issue resolution tracking from different customer support channels. It covers top issue volume impactors, top issue resolve time impactors etc. Pitch your topic with ease and precision using this Issue Resolution On Multiple Client Service Communication Channels Dashboard Microsoft PDF This layout presents information on Incoming Cases, Resolution, Escalations. It is also available for immediate download and adjustment. So, changes can be made in the color, design, graphics or any other component to create a unique layout.
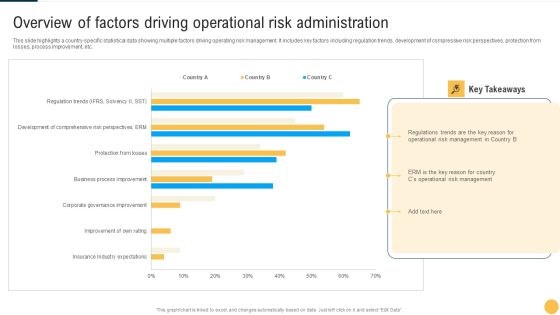
Overview Of Factors Driving Operational Risk Administration Summary PDF
This slide highlights a country specific statistical data showing multiple factors driving operating risk management. It includes key factors including regulation trends, development of compressive risk perspectives, protection from losses, process improvement, etc. Pitch your topic with ease and precision using this Overview Of Factors Driving Operational Risk Administration Summary PDF This layout presents information on Key Takeaways, Risk Management, Administration. It is also available for immediate download and adjustment. So, changes can be made in the color, design, graphics or any other component to create a unique layout.

Revenue Generated From Operations Management And Control In IT Services Guidelines PDF
This slide illustrates the graphical representation of revenue generated from operation management in IT services in the recent years. It shows the revenue in millions of US dollars from 2015 to 2022 and expected revenue generation in upcoming years. Pitch your topic with ease and precision using this Revenue Generated From Operations Management And Control In IT Services Guidelines PDF. This layout presents information on Revenue, IT Service, Cloud Computing. It is also available for immediate download and adjustment. So, changes can be made in the color, design, graphics or any other component to create a unique layout.

Software Implementation Project Code Churn Introduction PDF
This slide represents code churn which helps managers in noticing when deadline is at risk and identification of problematic code areas. It includes details related to strategies to prevent high code churn rates. This Software Implementation Project Code Churn Introduction PDF from Slidegeeks makes it easy to present information on your topic with precision. It provides customization options, so you can make changes to the colors, design, graphics, or any other component to create a unique layout. It is also available for immediate download, so you can begin using it right away. Slidegeeks has done good research to ensure that you have everything you need to make your presentation stand out. Make a name out there for a brilliant performance.

Ppt Team Work Person Presentation Standing Orange Piece Of Chart PowerPoint Templates
PPT team work person presentation standing orange piece of chart PowerPoint Templates-Use this graphical approach to represent global business issues such as financial data, stock market Exchange, increase in sales, corporate presentations and more. Create captivating presentations to deliver comparative and weighted arguments.-PPT team work person presentation standing orange piece of chart PowerPoint Templates-arrow, bar, business, businessman, candidate, cartoon, character, chart, circle, circular, client, communication, company, concept, diagram, finance, financial, flow, growth, human, illustration, increase, information, iteration, man, market, marketing, process, processing, profit, sales, statistics, stats, success, target

Ppt Application Of 4 Steps Working With Slide Numbers Involved Procedur PowerPoint Templates
PPT application of 4 steps working with slide numbers involved procedur PowerPoint Templates-This chart visualize the process steps, reoccurrences and components or of your company structure or product features. These premium graphics are especially suitable for chronologies, sequences. This Diagram will fit for Business processes like Marketing, Management etc. You can show various processes with these linear designed Circular pieces. -PPT application of 4 steps working with slide numbers involved procedur PowerPoint Templates-Add, Aqua, Arrows, Badges, Bar, Blend, Blue, Bright, Bubbles, Buttons, Caution, Circle, Drop, Elements, Glossy, Glowing, Graphic, Heart, Help, Icons, Idea, Illustration, Navigation, Oblong, Plus, Round, Service, Shadow, Shiny, Sign, Speech, Squares
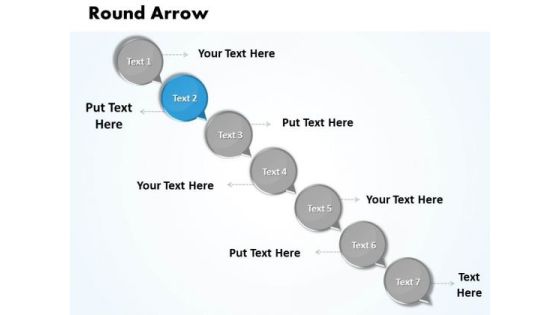
Ppt Text Circles With Circular Arrows PowerPoint 2007 Steps Business Templates
PPT text circles with circular arrows powerpoint 2007 steps Business Templates-Use this layout to define the outcome and the multiple possibilities in a way that is used in calculation of probabilities, genetics and strategic reasoning. This chart visualizes the concept of process steps, reoccurrences and components or of your company structure or product features. You can change color, size and orientation of any icon to your liking. -PPT text circles with circular arrows powerpoint 2007 steps Business Templates-Add, Aqua, Arrows, Badges, Bar, Blend, Blue, Bright, Bubbles, Buttons, Caution, Circle, Drop, Elements, Glossy, Glowing, Graphic, Heart, Help, Icons, Idea, Illustration, Navigation, Oblong, Plus, Round, Service, Shadow, Shiny, Sign, Speech, Squares

Ppt Circular PowerPoint Menu Template Arrow Description Of 5 State Diagram Templates
PPT circular powerpoint menu template arrow description of 5 state diagram Templates-This PowerPoint Diagram consists of five circular arrows which explain the steps involved in any Business Process. It implies that when all these five Components are combined then only Business Process is Completed. This Diagram will fit for Business related Presentations. -PPT circular powerpoint menu template arrow description of 5 state diagram Templates-Add, Aqua, Arrows, Badges, Bar, Blend, Blue, Bright, Bubbles, Buttons, Caution, Circle, Drop, Elements, Glossy, Glowing, Graphic, Heart, Help, Icons, Idea, Illustration, Navigation, Oblong, Plus, Round, Service, Shadow, Shiny, Sign, Speech, Squares
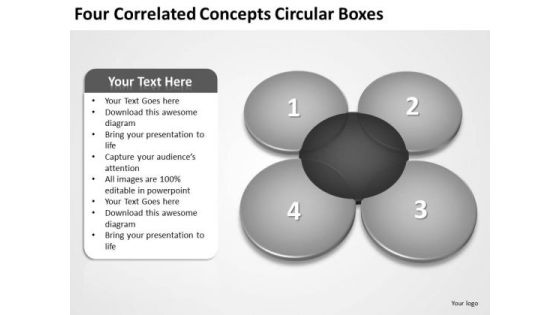
Four Correlated Concepts Circular Boxes Best Business Plan Template PowerPoint Slides
We present our four correlated concepts circular boxes best business plan template PowerPoint Slides.Present our Communication PowerPoint Templates because Our PowerPoint Templates and Slides will give you great value for your money. Be assured of finding the best projection to highlight your words. Download our Circle Charts PowerPoint Templates because You will get more than you ever bargained for. Present our Business PowerPoint Templates because You can Stir your ideas in the cauldron of our PowerPoint Templates and Slides. Cast a magic spell on your audience. Download and present our Shapes PowerPoint Templates because You are well armed with penetrative ideas. Our PowerPoint Templates and Slides will provide the gunpowder you need. Use our Process and Flows PowerPoint Templates because Our PowerPoint Templates and Slides are effectively colour coded to prioritise your plans They automatically highlight the sequence of events you desire.Use these PowerPoint slides for presentations relating to Design, vector, diagram, graphic, banner, box, background, label, abstract, flyer, ribbon, text, connection, web, set, website, copy, bar, business, blank, tag, new, sign, presentation, symbol, template, circle, element, shape, team, modern, illustration, color, tab, badge, tape, empty, paper, style, sticker, menu, message, site, bookmark, announcement. The prominent colors used in the PowerPoint template are Black, White, Gray.
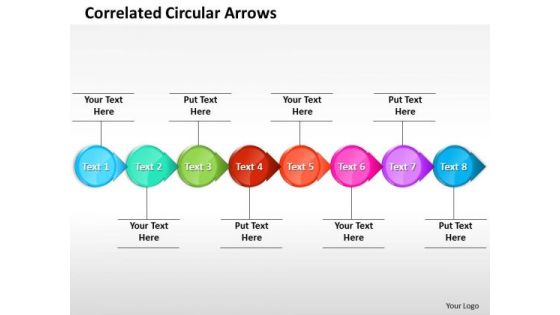
Ppt Correlated Circular Arrows PowerPoint Templates Horizontal Line 8 Stages
PPT correlated circular arrows powerpoint templates horizontal line 8 stages-This PowerPoint Diagram shows you Correlated Circular Arrows in Horizontal Line which signifies step by step Execution, inter-related approaches etc.-PPT correlated circular arrows powerpoint templates horizontal line 8 stages-8 Steps, 8 Steps Diagram, Arrow, Artfulness, Chart, Circle, Circular, Circulation, Concept, Connection, Continuity, Correlate, Course, Diagram, Direction, Duplicate, Flow, Four, Iterate, Manage, Method, Order, Phase, Presentation, Procedure, Process, React, Recycle, Refresh, Relate, Repeat, Repetition, Report, Review, Section, Sequence, Simple, Stage, Step, Strategy, Success, Swirl, System, Work Flow
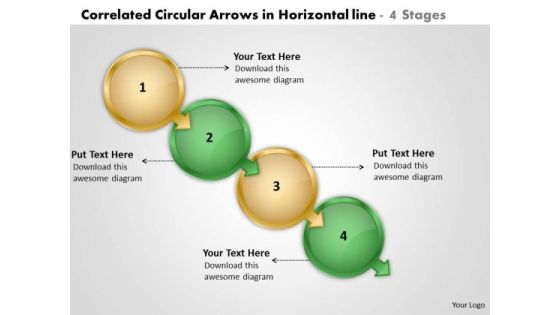
Correlated Circular Arrows In Horizontal Line 4 Stages Create Flow Charts PowerPoint Slides
We present our correlated circular arrows in horizontal line 4 stages create flow charts PowerPoint Slides.Use our Circle Charts PowerPoint Templates because,Motivating your team will cross all barriers. Use our Arrows PowerPoint Templates because,The foundation stones of many a life. Use our Leadership PowerPoint Templates because, You can Show them how to churn out fresh ideas. Use our Business PowerPoint Templates because, You have had your share of being a goldfish in a small bowl.You are ready to launch out and spread your wings Use our Process and Flows PowerPoint Templates because, It can illustrate your chain of ideas focusing on that aspect or resource in order to enhance the quality of your product.Use these PowerPoint slides for presentations relating to 3d, abstract, around, arrows, blue, border, business, center, circle, circular, concept, connections, copy, curve, cycle, directions, distribution, illustration, management, middle, objects, pieces, plan, pointing, process, recycle, rounded, shadows, space, system. The prominent colors used in the PowerPoint template are Yellow, Green, Black. People tell us our correlated circular arrows in horizontal line 4 stages create flow charts PowerPoint Slides will get their audience's attention. The feedback we get is that our circle PowerPoint templates and PPT Slides are Charming. People tell us our correlated circular arrows in horizontal line 4 stages create flow charts PowerPoint Slides are Graceful. Presenters tell us our circle PowerPoint templates and PPT Slides will make you look like a winner. The feedback we get is that our correlated circular arrows in horizontal line 4 stages create flow charts PowerPoint Slides are Romantic. Professionals tell us our around PowerPoint templates and PPT Slides are Adorable.

Achieve Business Outcome 8 Stages How Formulate Plan PowerPoint Templates
We present our achieve business outcome 8 stages how formulate plan PowerPoint templates.Download our Communication PowerPoint Templates because You can safely bank on our PowerPoint Templates and Slides. They will provide a growth factor to your valuable thoughts. Use our Circle Charts PowerPoint Templates because Your ideas provide food for thought. Our PowerPoint Templates and Slides will help you create a dish to tickle the most discerning palate. Download and present our Process and Flows PowerPoint Templates because Our PowerPoint Templates and Slides will let you meet your Deadlines. Use our Business PowerPoint Templates because our PowerPoint Templates and Slides are the string of your bow. Fire of your ideas and conquer the podium. Present our Shapes PowerPoint Templates because Our PowerPoint Templates and Slides are truly out of this world. Even the MIB duo has been keeping tabs on our team.Use these PowerPoint slides for presentations relating to Circle, flow, network, platform, diagram, connection, connect, business, flowchart, function, organization, coordinates, molecular, table, square, plan, interrelations, tech, scheme, graphic, technology, graph, molecule, arrangement, comparison, scientific, variable, solve, project, relationships, lines,attached, segments, interconnected, solution, organize, device, analyze, draft, pattern, construction, structure. The prominent colors used in the PowerPoint template are Blue, Black, Gray.

Concentric Data Flow Process 9 Stages Business Plan PowerPoint Templates
We present our concentric data flow process 9 stages business plan PowerPoint templates.Download and present our Process and Flows PowerPoint Templates because Our PowerPoint Templates and Slides will let Your superior ideas hit the target always and everytime. Download our Flow Charts PowerPoint Templates because You can safely bank on our PowerPoint Templates and Slides. They will provide a growth factor to your valuable thoughts. Download and present our Success PowerPoint Templates because It will get your audience in sync. Download and present our Marketing PowerPoint Templates because Our PowerPoint Templates and Slides will provide the perfect balance. Your weighty ideas will get the ideal impetus. Download our Business PowerPoint Templates because Your success is our commitment. Our PowerPoint Templates and Slides will ensure you reach your goal.Use these PowerPoint slides for presentations relating to Flow, network, platform, diagram, connection, connect, business, flowchart, function, organization, coordinates, molecular, square, plan, interrelations, scheme, graphic, technology, graph, molecule, arrangement, comparison, scientific, variable, project, relationships, lines,attached, segments, interconnected, solution, organize, device, analyze, draft, pattern, construction, structure, nine, steps. The prominent colors used in the PowerPoint template are Blue, White, Gray.
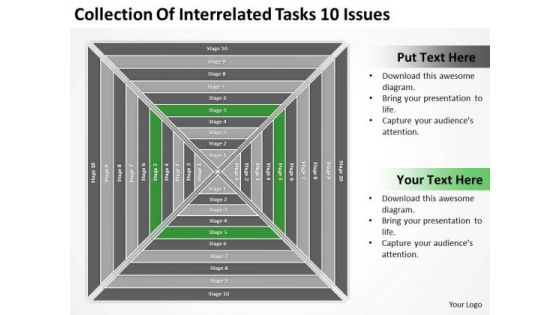
Collection Of Interrelated Tasks 10 Issues Ppt Business Plan PowerPoint Templates
We present our collection of interrelated tasks 10 issues ppt business plan PowerPoint templates.Present our Flow Charts PowerPoint Templates because Our PowerPoint Templates and Slides will let you Illuminate the road ahead to Pinpoint the important landmarks along the way. Present our Business PowerPoint Templates because Our PowerPoint Templates and Slides will generate and maintain the level of interest you desire. They will create the impression you want to imprint on your audience. Use our Flow Charts PowerPoint Templates because our PowerPoint Templates and Slides will give your ideas the shape. Download our Shapes PowerPoint Templates because Our PowerPoint Templates and Slides offer you the needful to organise your thoughts. Use them to list out your views in a logical sequence. Download our Marketing PowerPoint Templates because Our PowerPoint Templates and Slides will steer your racing mind. Hit the right buttons and spur on your audience.Use these PowerPoint slides for presentations relating to Flow, network, platform, diagram, connection, connect, business, flowchart, function, organization, coordinates, molecular, square, plan, interrelations, scheme, graphic, technology, graph, molecule, arrangement, comparison, scientific, variable, project, relationships, lines,attached, segments, interconnected, solution, organize, device, analyze, draft, pattern, construction, structure. The prominent colors used in the PowerPoint template are Green, White, Gray.

Achieve Business Outcome 8 Stages Real Estate Plan Sample PowerPoint Templates
We present our achieve business outcome 8 stages real estate plan sample PowerPoint templates.Use our Circle Charts PowerPoint Templates because Our PowerPoint Templates and Slides will embellish your thoughts. See them provide the desired motivation to your team. Download our Process and Flows PowerPoint Templates because You aspire to touch the sky with glory. Let our PowerPoint Templates and Slides provide the fuel for your ascent. Download and present our Business PowerPoint Templates because Our PowerPoint Templates and Slides are truly out of this world. Even the MIB duo has been keeping tabs on our team. Use our Communication PowerPoint Templates because you should Whip up a frenzy with our PowerPoint Templates and Slides. They will fuel the excitement of your team. Present our Shapes PowerPoint Templates because Our PowerPoint Templates and Slides will embellish your thoughts. See them provide the desired motivation to your team.Use these PowerPoint slides for presentations relating to Circle, flow, network, platform, diagram, connection, connect, business, flowchart, function, organization, coordinates, molecular, table, square, plan, interrelations, tech, scheme, graphic, technology, graph, molecule, arrangement, comparison, scientific, variable, solve, project, relationships, lines,attached, segments, interconnected, solution, organize, device, analyze, draft, pattern, construction, structure. The prominent colors used in the PowerPoint template are Gray, Blue, Black.
Collection Of Interrelated Tasks 10 Issues Ppt Business Plan Free PowerPoint Templates
We present our collection of interrelated tasks 10 issues ppt business plan free PowerPoint templates.Download our Flow Charts PowerPoint Templates because It will let you Set new benchmarks with our PowerPoint Templates and Slides. They will keep your prospects well above par. Present our Process and Flows PowerPoint Templates because our PowerPoint Templates and Slides will give your ideas the shape. Download and present our Business PowerPoint Templates because Our PowerPoint Templates and Slides will let you Hit the right notes. Watch your audience start singing to your tune. Use our Marketing PowerPoint Templates because It can Conjure up grand ideas with our magical PowerPoint Templates and Slides. Leave everyone awestruck by the end of your presentation. Present our Shapes PowerPoint Templates because You can Stir your ideas in the cauldron of our PowerPoint Templates and Slides. Cast a magic spell on your audience.Use these PowerPoint slides for presentations relating to Flow, network, platform, diagram, connection, connect, business, flowchart, function, organization, coordinates, molecular, square, plan, interrelations, scheme, graphic, technology, graph, molecule, arrangement, comparison, scientific, variable, project, relationships, lines,attached, segments, interconnected, solution, organize, device, analyze, draft, pattern, construction, structure. The prominent colors used in the PowerPoint template are Green dark , White, Gray.
Concentric Data Flow Process 9 Stages Ppt Easy Business Plan Template PowerPoint Slides
We present our concentric data flow process 9 stages ppt easy business plan template PowerPoint Slides.Use our Process and Flows PowerPoint Templates because Our PowerPoint Templates and Slides will effectively help you save your valuable time. They are readymade to fit into any presentation structure. Download our Flow Charts PowerPoint Templates because You can Zap them with our PowerPoint Templates and Slides. See them reel under the impact. Download and present our Business PowerPoint Templates because You aspire to touch the sky with glory. Let our PowerPoint Templates and Slides provide the fuel for your ascent. Present our Shapes PowerPoint Templates because Our PowerPoint Templates and Slides are topically designed to provide an attractive backdrop to any subject. Download and present our Success PowerPoint Templates because Our PowerPoint Templates and Slides offer you the widest possible range of options.Use these PowerPoint slides for presentations relating to Flow, network, platform, diagram, connection, connect, business, flowchart, function, organization, coordinates, molecular, square, plan, interrelations, scheme, graphic, technology, graph, molecule, arrangement, comparison, scientific, variable, project, relationships, lines,attached, segments, interconnected, solution, organize, device, analyze, draft, pattern, construction, structure, nine, steps. The prominent colors used in the PowerPoint template are Blue light, White, Gray.
Collection Of Interrelated Tasks 10 Issues Ppt How To Business Plan PowerPoint Templates
We present our collection of interrelated tasks 10 issues ppt how to business plan PowerPoint templates.Download our Flow Charts PowerPoint Templates because Our PowerPoint Templates and Slides will give you great value for your money. Be assured of finding the best projection to highlight your words. Use our Business PowerPoint Templates because They will bring a lot to the table. Their alluring flavours will make your audience salivate. Use our Process and Flows PowerPoint Templates because It can Conjure up grand ideas with our magical PowerPoint Templates and Slides. Leave everyone awestruck by the end of your presentation. Use our Marketing PowerPoint Templates because you should once Tap the ingenuity of our PowerPoint Templates and Slides. They are programmed to succeed. Use our Shapes PowerPoint Templates because Our PowerPoint Templates and Slides are created with admirable insight. Use them and give your group a sense of your logical mind.Use these PowerPoint slides for presentations relating to Flow, network, platform, diagram, connection, connect, business, flowchart, function, organization, coordinates, molecular, square, plan, interrelations, scheme, graphic, technology, graph, molecule, arrangement, comparison, scientific, variable, project, relationships, lines,attached, segments, interconnected, solution, organize, device, analyze, draft, pattern, construction, structure. The prominent colors used in the PowerPoint template are White, Green dark , Gray.

Concentric Data Flow Process 9 Stages Business Plans For PowerPoint Templates
We present our concentric data flow process 9 stages business plans for PowerPoint templates.Download and present our Flow Charts PowerPoint Templates because They will Put the wind in your sails. Skim smoothly over the choppy waters of the market. Use our Business PowerPoint Templates because You can Hit the nail on the head with our PowerPoint Templates and Slides. Embed your ideas in the minds of your audience. Download our Marketing PowerPoint Templates because Our PowerPoint Templates and Slides help you meet the demand of the Market. Just browse and pick the slides that appeal to your intuitive senses. Download our Process and Flow PowerPoint Templates because Our PowerPoint Templates and Slides will let Your superior ideas hit the target always and everytime. Present our Shapes PowerPoint Templates because Our PowerPoint Templates and Slides will let you Illuminate the road ahead to Pinpoint the important landmarks along the way.Use these PowerPoint slides for presentations relating to Flow, network, platform, diagram, connection, connect, business, flowchart, function, organization, coordinates, molecular, square, plan, interrelations, scheme, graphic, technology, graph, molecule, arrangement, comparison, scientific, variable, project, relationships, lines,attached, segments, interconnected, solution, organize, device, analyze, draft, pattern, construction, structure, nine, steps. The prominent colors used in the PowerPoint template are Gray, Blue, White.

Concentric Data Flow Process 9 Stages Ppt Template For Business Plan PowerPoint Slides
We present our concentric data flow process 9 stages ppt template for business plan PowerPoint Slides.Download our Process and Flows PowerPoint Templates because Our PowerPoint Templates and Slides are designed to help you succeed. They have all the ingredients you need. Download and present our Flow Charts PowerPoint Templates because Our PowerPoint Templates and Slides will weave a web of your great ideas. They are gauranteed to attract even the most critical of your colleagues. Use our Business PowerPoint Templates because Our PowerPoint Templates and Slides will provide you a launch platform. Give a lift off to your ideas and send them into orbit. Download and present our Shapes PowerPoint Templates because You will get more than you ever bargained for. Use our Success PowerPoint Templates because you should Experience excellence with our PowerPoint Templates and Slides. They will take your breath away.Use these PowerPoint slides for presentations relating to Flow, network, platform, diagram, connection, connect, business, flowchart, function, organization, coordinates, molecular, square, plan, interrelations, scheme, graphic, technology, graph, molecule, arrangement, comparison, scientific, variable, project, relationships, lines,attached, segments, interconnected, solution, organize, device, analyze, draft, pattern, construction, structure, nine, steps. The prominent colors used in the PowerPoint template are Blue light, White, Gray.

Concentric Data Flow Process 9 Stages Ppt Business Plan PowerPoint Templates
We present our concentric data flow process 9 stages ppt business plan PowerPoint templates.Download our Business PowerPoint Templates because It will get your audience in sync. Present our Flow Charts PowerPoint Templates because Watching this your Audience will Grab their eyeballs, they wont even blink. Use our Process and Flows PowerPoint Templates because Our PowerPoint Templates and Slides will fulfill your every need. Use them and effectively satisfy the desires of your audience. Download and present our Marketing PowerPoint Templates because Our PowerPoint Templates and Slides will let you meet your Deadlines. Use our Shapes PowerPoint Templates because Our PowerPoint Templates and Slides will bullet point your ideas. See them fall into place one by one.Use these PowerPoint slides for presentations relating to Flow, network, platform, diagram, connection, connect, business, flowchart, function, organization, coordinates, molecular, square, plan, interrelations, scheme, graphic, technology, graph, molecule, arrangement, comparison, scientific, variable, project, relationships, lines,attached, segments, interconnected, solution, organize, device, analyze, draft, pattern, construction, structure, nine, steps. The prominent colors used in the PowerPoint template are White, Gray, Blue.

E Business PowerPoint Presentation Format Plan Templates
We present our e business powerpoint presentation format plan templates.Use our Process and Flows PowerPoint Templates because Our PowerPoint Templates and Slides offer you the widest possible range of options. Use our Marketing PowerPoint Templates because Our PowerPoint Templates and Slides will provide weight to your words. They will bring out the depth of your thought process. Download and present our Business PowerPoint Templates because Your success is our commitment. Our PowerPoint Templates and Slides will ensure you reach your goal. Present our Flow Charts PowerPoint Templates because Our PowerPoint Templates and Slides will provide you the cutting edge. Slice through the doubts in the minds of your listeners. Present our Shapes PowerPoint Templates because Our PowerPoint Templates and Slides offer you the widest possible range of options.Use these PowerPoint slides for presentations relating to Diagram, graph, line, cross, statistics, print, economy, state, business, concept, vector, circle, brochure, scheme, graphic, balance, calculation,development, four, illustration, flyer, economic, comparison, chart, catalog, round, backdrop, design, poster, situation, progress, background, image, financial. The prominent colors used in the PowerPoint template are Yellow, Black, Gray.
Concentric Data Flow Process 9 Stages Ppt Business Plan PowerPoint Slides
We present our concentric data flow process 9 stages ppt business plan PowerPoint Slides.Download our Flow Charts PowerPoint Templates because our PowerPoint Templates and Slides are the string of your bow. Fire of your ideas and conquer the podium. Use our Process and Flows PowerPoint Templates because You should Kick up a storm with our PowerPoint Templates and Slides. The heads of your listeners will swirl with your ideas. Download our Marketing PowerPoint Templates because You are working at that stage with an air of royalty. Let our PowerPoint Templates and Slides be the jewels in your crown. Download our Business PowerPoint Templates because You should Bet on your luck with our PowerPoint Templates and Slides. Be assured that you will hit the jackpot. Present our Shapes PowerPoint Templates because You have the co-ordinates for your destination of success. Let our PowerPoint Templates and Slides map out your journey.Use these PowerPoint slides for presentations relating to Flow, network, platform, diagram, connection, connect, business, flowchart, function, organization, coordinates, molecular, square, plan, interrelations, scheme, graphic, technology, graph, molecule, arrangement, comparison, scientific, variable, project, relationships, lines,attached, segments, interconnected, solution, organize, device, analyze, draft, pattern, construction, structure, nine, steps. The prominent colors used in the PowerPoint template are Blue light, White, Gray.

Collection Of Interrelated Tasks 10 Issues Ppt Business Plan PowerPoint Slide
We present our collection of interrelated tasks 10 issues ppt business plan PowerPoint Slide.Use our Flow Charts PowerPoint Templates because It will let you Set new benchmarks with our PowerPoint Templates and Slides. They will keep your prospects well above par. Use our Process and Flows PowerPoint Templates because Our PowerPoint Templates and Slides are created with admirable insight. Use them and give your group a sense of your logical mind. Present our Business PowerPoint Templates because Our PowerPoint Templates and Slides will effectively help you save your valuable time. They are readymade to fit into any presentation structure. Download and present our Marketing PowerPoint Templates because Our PowerPoint Templates and Slides are aesthetically designed to attract attention. We gaurantee that they will grab all the eyeballs you need. Download and present our Shapes PowerPoint Templates because You can Channelise the thoughts of your team with our PowerPoint Templates and Slides. Urge them to focus on the goals you have set.Use these PowerPoint slides for presentations relating to Flow, network, platform, diagram, connection, connect, business, flowchart, function, organization, coordinates, molecular, square, plan, interrelations, scheme, graphic, technology, graph, molecule, arrangement, comparison, scientific, variable, project, relationships, lines,attached, segments, interconnected, solution, organize, device, analyze, draft, pattern, construction, structure. The prominent colors used in the PowerPoint template are Green lime, White, Gray.
Collection Of Interrelated Tasks 10 Issues Ppt Fashion Business Plan PowerPoint Slides
We present our collection of interrelated tasks 10 issues ppt fashion business plan PowerPoint Slides.Present our Process and Flows PowerPoint Templates because you can Add colour to your speech with our PowerPoint Templates and Slides. Your presentation will leave your audience speechless. Present our Flow Charts PowerPoint Templates because You should Throw the gauntlet with our PowerPoint Templates and Slides. They are created to take up any challenge. Download our Marketing PowerPoint Templates because You can Create a matrix with our PowerPoint Templates and Slides. Feel the strength of your ideas click into place. Download and present our Shapes PowerPoint Templates because Our PowerPoint Templates and Slides will let you Leave a lasting impression to your audiences. They possess an inherent longstanding recall factor. Use our Business PowerPoint Templates because Our PowerPoint Templates and Slides ensures Effective communication. They help you put across your views with precision and clarity.Use these PowerPoint slides for presentations relating to Flow, network, platform, diagram, connection, connect, business, flowchart, function, organization, coordinates, molecular, square, plan, interrelations, scheme, graphic, technology, graph, molecule, arrangement, comparison, scientific, variable, project, relationships, lines,attached, segments, interconnected, solution, organize, device, analyze, draft, pattern, construction, structure. The prominent colors used in the PowerPoint template are Green, Gray, White.
Concentric Data Flow Process 9 Stages Ppt Plans PowerPoint Slides
We present our concentric data flow process 9 stages ppt plans PowerPoint Slides.Download and present our Process and Flows PowerPoint Templates because Our PowerPoint Templates and Slides are topically designed to provide an attractive backdrop to any subject. Download our Flow Charts PowerPoint Templates because Our PowerPoint Templates and Slides offer you the widest possible range of options. Use our Business PowerPoint Templates because Our PowerPoint Templates and Slides offer you the widest possible range of options. Present our Shapes PowerPoint Templates because Our PowerPoint Templates and Slides will let you Hit the right notes. Watch your audience start singing to your tune. Download our Success PowerPoint Templates because Our PowerPoint Templates and Slides will Embellish your thoughts. They will help you illustrate the brilliance of your ideas.Use these PowerPoint slides for presentations relating to Flow, network, platform, diagram, connection, connect, business, flowchart, function, organization, coordinates, molecular, square, plan, interrelations, scheme, graphic, technology, graph, molecule, arrangement, comparison, scientific, variable, project, relationships, lines,attached, segments, interconnected, solution, organize, device, analyze, draft, pattern, construction, structure, nine, steps. The prominent colors used in the PowerPoint template are Gray, Blue light, White.

Collection Of Interrelated Tasks 10 Issues How To Prepare Business Plan PowerPoint Slides
We present our collection of interrelated tasks 10 issues how to prepare business plan PowerPoint Slides.Present our Flow Charts PowerPoint Templates because Our PowerPoint Templates and Slides are created by a hardworking bunch of busybees. Always flitting around with solutions gauranteed to please. Present our Process and Flows PowerPoint Templates because It will Give impetus to the hopes of your colleagues. Our PowerPoint Templates and Slides will aid you in winning their trust. Download and present our Business PowerPoint Templates because It will mark the footprints of your journey. Illustrate how they will lead you to your desired destination. Download our Marketing PowerPoint Templates because Our PowerPoint Templates and Slides will provide you a launch platform. Give a lift off to your ideas and send them into orbit. Download and present our Shapes PowerPoint Templates because Our PowerPoint Templates and Slides will let you Hit the target. Go the full distance with ease and elan.Use these PowerPoint slides for presentations relating to Flow, network, platform, diagram, connection, connect, business, flowchart, function, organization, coordinates, molecular, square, plan, interrelations, scheme, graphic, technology, graph, molecule, arrangement, comparison, scientific, variable, project, relationships, lines,attached, segments, interconnected, solution, organize, device, analyze, draft, pattern, construction, structure. The prominent colors used in the PowerPoint template are Green dark , White, Gray.

 Home
Home