Comparison Bar Graph
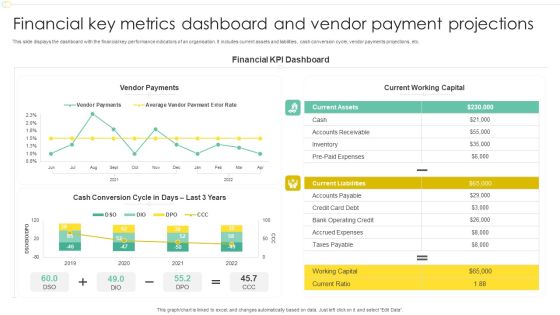
Financial Key Metrics Dashboard And Vendor Payment Projections Professional PDF
This slide displays the dashboard with the financial key performance indicators of an organisation. It includes current assets and liabilities, cash conversion cycle, vendor payments projections, etc. Pitch your topic with ease and precision using this Financial Key Metrics Dashboard And Vendor Payment Projections Professional PDF. This layout presents information on Financial KPI Dashboard, Current Working Capital, Vendor Payments. It is also available for immediate download and adjustment. So, changes can be made in the color, design, graphics or any other component to create a unique layout.
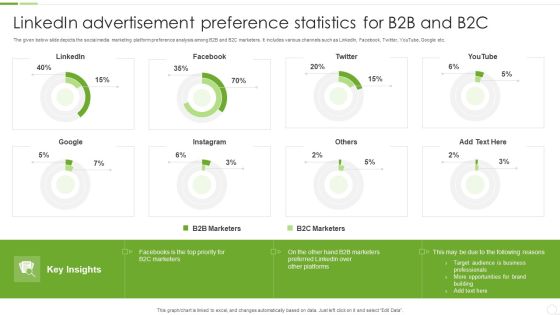
Linkedin Advertisement Preference Statistics For B2B And B2C Ppt Visual Aids Professional PDF
The given below slide depicts the social media marketing platform preference analysis among B2B and B2C marketers. It includes various channels such as LinkedIn, Facebook, Twitter, YouTube, Google etc. Pitch your topic with ease and precision using this Linkedin Advertisement Preference Statistics For B2B And B2C Ppt Visual Aids Professional PDF. This layout presents information on B2B Marketers, B2C Marketers, Target Audience. It is also available for immediate download and adjustment. So, changes can be made in the color, design, graphics or any other component to create a unique layout.
Saas Cloud Security Analysis With KPI Dashboard Ppt PowerPoint Presentation Icon Slides PDF
The following slide highlights the assessment of Software as a security to meet safety standards. It includes key elements such as critical incidents, risk analysis, number of open tasks etc. Pitch your topic with ease and precision using this Saas Cloud Security Analysis With KPI Dashboard Ppt PowerPoint Presentation Icon Slides PDF. This layout presents information on Quarterly Incident Severity, Incident Risk Analysis, Critical Incidents. It is also available for immediate download and adjustment. So, changes can be made in the color, design, graphics or any other component to create a unique layout.

Company Inward Marketing Strategy Key Barriers Statistics Icons PDF
This slide covers top challenges of inbound marketing strategy that reduces its effectiveness. It includes generation of traffic, proving ROI for marketing activities, securing budget, technology update, website management, hiring talent and training team.Pitch your topic with ease and precision using this Company Inward Marketing Strategy Key Barriers Statistics Icons PDF. This layout presents information on Difficult To Search, Insufficient Traffic, Setting Budget. It is also available for immediate download and adjustment. So, changes can be made in the color, design, graphics or any other component to create a unique layout.

Statistics Showing Growth Rate Of Managed Cyber Security Solutions Service Market Ppt Show Inspiration PDF
This slide exhibits key statistics highlighting overview of managed security service market with expected market growth rate from 2020 to 2030 along with key insights. Pitch your topic with ease and precision using this Statistics Showing Growth Rate Of Managed Cyber Security Solutions Service Market Ppt Show Inspiration PDF. This layout presents information on Statistics Showing Growth, Cyber Security, Solutions Service Market. It is also available for immediate download and adjustment. So, changes can be made in the color, design, graphics or any other component to create a unique layout.

Recognition Program To Boost Workforce Morale Ppt Gallery Information PDF
This slide shows statistical data of recognition programs to engage and motivate employees. It includes monetary program, awards, employee of the month, service anniversaries and verbal appreciation. Pitch your topic with ease and precision using this Recognition Program To Boost Workforce Morale Ppt Gallery Information PDF. This layout presents information on Monetary Program, Awards And Trophies, Employee Month, Service Anniversaries. It is also available for immediate download and adjustment. So, changes can be made in the color, design, graphics or any other component to create a unique layout.
Stock Requirement Plan With Delivery Performance Ppt PowerPoint Presentation Icon Deck PDF
The following slide highlights the material requirement planning with delivery performance illustrating top clients by revenue details, top clients by revenue, delivery performance and shipments. Pitch your topic with ease and precision using this Stock Requirement Plan With Delivery Performance Ppt PowerPoint Presentation Icon Deck PDF. This layout presents information on Delivery Performance, Shipments, Top Clients Revenue. It is also available for immediate download and adjustment. So, changes can be made in the color, design, graphics or any other component to create a unique layout.

Parameters Affecting Employee Professional Journey Map In Workplace Download PDF
This slide covers different factors that impact employee experience in an organization. It includes work nature, development opportunities, colleagues, company culture, hitting targets, getting raise, promotion and management. Pitch your topic with ease and precision using this Parameters Affecting Employee Professional Journey Map In Workplace Download PDF. This layout presents information on Management, Promotion, Getting Raise, Hitting Targets. It is also available for immediate download and adjustment. So, changes can be made in the color, design, graphics or any other component to create a unique layout.
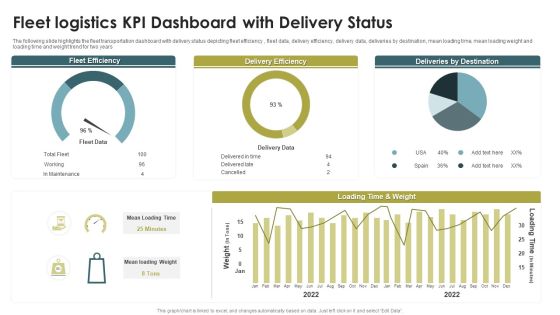
Fleet Logistics KPI Dashboard With Delivery Status Ppt Model Guide PDF
The following slide highlights the fleet transportation dashboard with delivery status depicting fleet efficiency , fleet data, delivery efficiency, delivery data, deliveries by destination, mean loading time, mean loading weight and loading time and weight trend for two years. Pitch your topic with ease and precision using this Fleet Logistics KPI Dashboard With Delivery Status Ppt Model Guide PDF. This layout presents information on Fleet Efficiency, Delivery Efficiency, Deliveries By Destination. It is also available for immediate download and adjustment. So, changes can be made in the color, design, graphics or any other component to create a unique layout.

Dashboard For Logistics KPI Management System Of Logistics Company Infographics PDF
The following slide highlights the dashboard for transportation management system of logistics company illustrating shipment status of 30 days, shipment by carrier, on time shipment, average shipment cost, carrier efficiency and shipment count. Pitch your topic with ease and precision using this Dashboard For Logistics KPI Management System Of Logistics Company Infographics PDF. This layout presents information on Shipment Status, Shipment By Carrier, On Time Shipment. It is also available for immediate download and adjustment. So, changes can be made in the color, design, graphics or any other component to create a unique layout.

Logistics KPI Carrier Management Dashboard For Ecommerce Company Microsoft PDF
The following slide highlights the transportation carrier management dashboard for Ecommerce company depicting vehicle status, yearly cost, maintenance cost, cost breakdown, vehicle life span, empty miles and insurance by vehicle type. Pitch your topic with ease and precision using this Logistics KPI Carrier Management Dashboard For Ecommerce Company Microsoft PDF. This layout presents information on Mini Trucks, 13 Trailers, Empty Miles, Vehicle Life Span. It is also available for immediate download and adjustment. So, changes can be made in the color, design, graphics or any other component to create a unique layout.

Personnel Engagement Measurement Effective Approaches With Statistics Structure PDF
This slide depicts different approaches to measure engagement in employees. It includes engagement surveys, exit interviews, one on ones with managers, performance ratings, first year employees retention rate, retention rate for experience employees, customer satisfaction rates and employee productivity. Pitch your topic with ease and precision using this Personnel Engagement Measurement Effective Approaches With Statistics Structure PDF. This layout presents information on Employees Increases, Person Discussion, Employee Morale. It is also available for immediate download and adjustment. So, changes can be made in the color, design, graphics or any other component to create a unique layout.
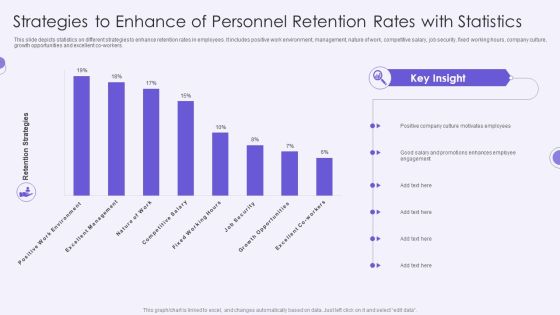
Strategies To Enhance Of Personnel Retention Rates With Statistics Summary PDF
This slide depicts statistics on different strategies to enhance retention rates in employees. It includes positive work environment, management, nature of work, competitive salary, job security, fixed working hours, company culture, growth opportunities and excellent co-workers.Pitch your topic with ease and precision using this Strategies To Enhance Of Personnel Retention Rates With Statistics Summary PDF. This layout presents information on Positive Company, Culture Motivates, Employees Promotions . It is also available for immediate download and adjustment. So, changes can be made in the color, design, graphics or any other component to create a unique layout.
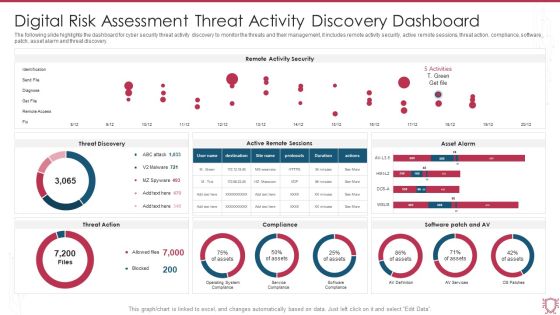
Digital Risk Assessment Threat Activity Discovery Dashboard Ppt Ideas Skills PDF
The following slide highlights the dashboard for cyber security threat activity discovery to monitor the threats and their management, it includes remote activity security, active remote sessions, threat action, compliance, software patch, asset alarm and threat discovery. Pitch your topic with ease and precision using this Digital Risk Assessment Threat Activity Discovery Dashboard Ppt Ideas Skills PDF. This layout presents information on Remote Activity Security, Threat Discovery, Asset Alarm. It is also available for immediate download and adjustment. So, changes can be made in the color, design, graphics or any other component to create a unique layout.

Digital Risk Assessment Management Dashboard With Geographical Distribution Clipart PDF
The following slide highlights the cyber security risk management dashboard with dashboard with geographical distribution depicting incident volume by severity, open incidents, root cause details, divisional details and geographical distribution of risks. Pitch your topic with ease and precision using this Digital Risk Assessment Management Dashboard With Geographical Distribution Clipart PDF. This layout presents information on Geographical Distribution, Root Cause Details, Divisional Details, Social Engineering. It is also available for immediate download and adjustment. So, changes can be made in the color, design, graphics or any other component to create a unique layout.

Dashboard For Tracking New Food Product Launch Strategic Plan Effectiveness Themes PDF
This slide illustrates facts and figures related to new food item introduction for FY22. It includes social media views and interactions, weekly income, and promotional expenditure.Pitch your topic with ease and precision using this Dashboard For Tracking New Food Product Launch Strategic Plan Effectiveness Themes PDF. This layout presents information on Promotion Expenditure, Social Media, Views Interactions. It is also available for immediate download and adjustment. So, changes can be made in the color, design, graphics or any other component to create a unique layout.

Marketing Strategy For Shipping Business Key Performance Indicator Dashboard Graphics PDF
The following slide depicts the key areas in Marketing Strategy for Shipping Business to monitor and optimize supply chain processes. It includes elements such as fleet and shipment status, country wise revenue, location wise delivery, average shipment time etc.Pitch your topic with ease and precision using this Marketing Strategy For Shipping Business Key Performance Indicator Dashboard Graphics PDF. This layout presents information on Shipment Status, Average Shipment, Wise Revenue. It is also available for immediate download and adjustment. So, changes can be made in the color, design, graphics or any other component to create a unique layout.
Market Insights Research Results With KPI Dashboard Ppt PowerPoint Presentation Icon File Formats PDF
The given below slide highlights the KPAs of market research associated with customer satisfaction. It includes net promoter score, customer effort score, monthly NPS and CES trend etc.Pitch your topic with ease and precision using this Market Insights Research Results With KPI Dashboard Ppt PowerPoint Presentation Icon File Formats PDF. This layout presents information on Satisfaction Score, Customer Effort, Customer Score. It is also available for immediate download and adjustment. So, changes can be made in the color, design, graphics or any other component to create a unique layout.

Healthcare Big Data Assessment Dashboard Portrait PDF
This slide displays the data of healthcare sector showing the total number of patients in the hospital, average treatment cost and waiting time. It also shows the outpatient and impatient trends. Pitch your topic with ease and precision using this Healthcare Big Data Assessment Dashboard Portrait PDF. This layout presents information on Patient Status, Treatment Costs. It is also available for immediate download and adjustment. So, changes can be made in the color, design, graphics or any other component to create a unique layout.

Content Freelance Marketing Metrics With Total Visits And Bounce Rate Slides PDF
The following slide highlights the content freelance marketing metrics with total visits and bounce rate. It showcases total visits, average visit per day, page overview, page engagement, unique visits, bounce rate, retention rate and top content Pitch your topic with ease and precision using this Content Freelance Marketing Metrics With Total Visits And Bounce Rate Slides PDF. This layout presents information on Average, Page Engagement, Bounce Rate. It is also available for immediate download and adjustment. So, changes can be made in the color, design, graphics or any other component to create a unique layout.
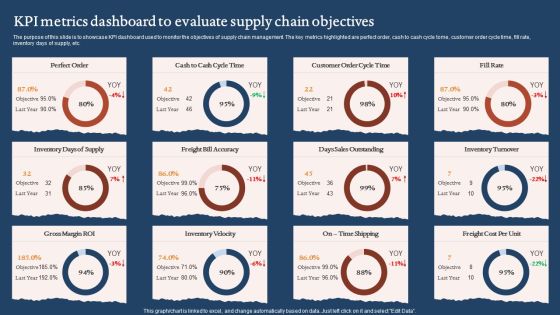
KPI Metrics Dashboard To Evaluate Supply Chain Objectives Graphics PDF
The purpose of this slide is to showcase KPI dashboard used to monitor the objectives of supply chain management. The key metrics highlighted are perfect order, cash to cash cycle tome, customer order cycle time, fill rate, inventory days of supply, etc. Pitch your topic with ease and precision using this KPI Metrics Dashboard To Evaluate Supply Chain Objectives Graphics PDF. This layout presents information on Days Sales Outstanding, Inventory Velocity, Gross Margin Roi. It is also available for immediate download and adjustment. So, changes can be made in the color, design, graphics or any other component to create a unique layout.
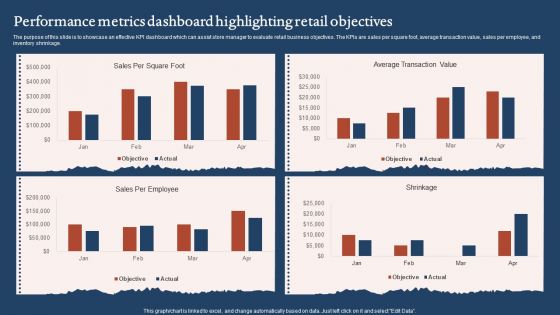
Performance Metrics Dashboard Highlighting Retail Objectives Sample PDF
The purpose of this slide is to showcase an effective KPI dashboard which can assist store manager to evaluate retail business objectives. The KPIs are sales per square foot, average transaction value, sales per employee, and inventory shrinkage. Pitch your topic with ease and precision using this Performance Metrics Dashboard Highlighting Retail Objectives Sample PDF. This layout presents information on Average Transaction Value, Sales Per Employee. It is also available for immediate download and adjustment. So, changes can be made in the color, design, graphics or any other component to create a unique layout.

Dashboard Showing Work Resource Planning Management Microsoft PDF
This slide covers the dashboard depicting work resourcing plan which includes utilization, scheduled time, overtime capacity, waiting list, holiday, sick leave, other downtime with total scheduled, billable, non billable, unscheduled time with resource name, etc. Pitch your topic with ease and precision using this Dashboard Showing Work Resource Planning Management Microsoft PDF. This layout presents information on Software Developer, Team Leader, Information Architect. It is also available for immediate download and adjustment. So, changes can be made in the color, design, graphics or any other component to create a unique layout.

Resource Planning Management Dashboard With Effective Utilization Mockup PDF
This slide shows the resourcing plan dashboard which focuses on the over and under utilization, trend by team, data by team which includes resource and utilization time of software developer, web designer and project manager. Pitch your topic with ease and precision using this Resource Planning Management Dashboard With Effective Utilization Mockup PDF. This layout presents information on Web Designer, Software Developer, Team. It is also available for immediate download and adjustment. So, changes can be made in the color, design, graphics or any other component to create a unique layout.

Resource Planning Management With Task Status And Priority Elements PDF
This slide covers the resourcing plan which focuses on the tasks associated with the project such as application development, attending conference meeting, organizing email campaign, employee onboarding process, etc. with owner name, timeline, status, priority and due date. Pitch your topic with ease and precision using this Resource Planning Management With Task Status And Priority Elements PDF. This layout presents information on Application Development, Email Campaign, Employee Onboarding. It is also available for immediate download and adjustment. So, changes can be made in the color, design, graphics or any other component to create a unique layout.
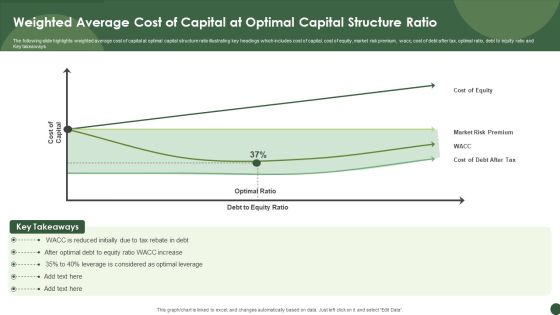
Weighted Average Cost Of Capital At Optimal Capital Structure Ratio Sample PDF
The following slide highlights weighted average cost of capital at optimal capital structure ratio illustrating key headings which includes cost of capital, cost of equity, market risk premium, wacc, cost of debt after tax, optimal ratio, debt to equity ratio and Key takeaways.Pitch your topic with ease and precision using this Weighted Average Cost Of Capital At Optimal Capital Structure Ratio Sample PDF. This layout presents information on Reduced Initially, Leverage Considered, Optimal Leverage. It is also available for immediate download and adjustment. So, changes can be made in the color, design, graphics or any other component to create a unique layout.
Gross Profit Margin Dashboard With Revenue Vs Expenses Icons PDF
This slide showcases dashboard that can help organization to evaluate the revenue generated and expenses incurred in conducting operations. It also showcases gross profit and margin of last financial year. Pitch your topic with ease and precision using this Gross Profit Margin Dashboard With Revenue Vs Expenses Icons PDF. This layout presents information on Gross Profit Margin, EBITDA Margin, Net Profit Margin. It is also available for immediate download and adjustment. So, changes can be made in the color, design, graphics or any other component to create a unique layout.

Fashion Marketing And Advertisement Analysis Dashboard Ppt PowerPoint Presentation Gallery Topics PDF
This slide defines the dashboard for fashion marketing and Advertisement revenue analysis . It includes information related to the revenue, sales, brands and gender breakdown. Pitch your topic with ease and precision using this Fashion Marketing And Advertisement Analysis Dashboard Ppt PowerPoint Presentation Gallery Topics PDF. This layout presents information on Total Revenue, Total Brands, Total Sales. It is also available for immediate download and adjustment. So, changes can be made in the color, design, graphics or any other component to create a unique layout.
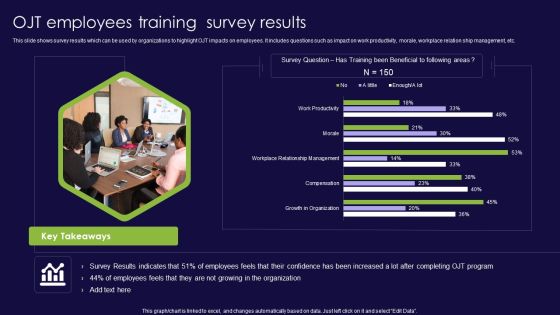
OJT Employees Training Survey Results Ppt PowerPoint Presentation File Master Slide PDF
This slide shows survey results which can be used by organizations to highlight OJT impacts on employees. It includes questions such as impact on work productivity, morale, workplace relation ship management, etc. Pitch your topic with ease and precision using this OJT Employees Training Survey Results Ppt PowerPoint Presentation File Master Slide PDF. This layout presents information on Growth Organization, Compensation, Workplace Relationship Management. It is also available for immediate download and adjustment. So, changes can be made in the color, design, graphics or any other component to create a unique layout.

Business Performance Review Dashboard With Customer Acquisition Cost Diagrams PDF
The following slide highlights KPI dashboard which can be used for quarterly business review QBR. It provides detailed information about actual revenue vs target, number of new customers, average revenue per customer, customer acquisition cost CAC etc. Pitch your topic with ease and precision using this Business Performance Review Dashboard With Customer Acquisition Cost Diagrams PDF. This layout presents information on Revenue, Customer Acquisition Cost, Current Quarter. It is also available for immediate download and adjustment. So, changes can be made in the color, design, graphics or any other component to create a unique layout.

Business Performance Review Report To Evaluate Performance Of Sales Rep Infographics PDF
The following slide highlights quarterly business review QBR report which can be used by firm to evaluate the efficiency of sales rep. information covered in this slide is related to total sales by employees in different quarters, number of calls made. Pitch your topic with ease and precision using this Business Performance Review Report To Evaluate Performance Of Sales Rep Infographics PDF. This layout presents information on Revenue Sales, Tim Paine, Number Colds Calls. It is also available for immediate download and adjustment. So, changes can be made in the color, design, graphics or any other component to create a unique layout.

Ecommerce Marketing Activities KPI Dashboard To Analyse Performance Guidelines PDF
This slide covers ecommerce marketing KPI dashboard to track performance. It involves details such as ecommerce revenue generated, number of new customers, repeat buying rate, attribute revenue and conversion rate and attributed revenue and conversion rate by marketing channel.Pitch your topic with ease and precision using this Ecommerce Marketing Activities KPI Dashboard To Analyse Performance Guidelines PDF. This layout presents information on Revenue Generated, Ecommerce Revenue, Generate Conversion. It is also available for immediate download and adjustment. So, changes can be made in the color, design, graphics or any other component to create a unique layout.

Online Marketing Activities KPI Dashboard To Improve Sales Ideas PDF
This slide covers online marketing dashboard to improve sales. It involves details such as web performance, conversion funnel, revenue this month, traffic sources and number of followers on social media.Pitch your topic with ease and precision using this Online Marketing Activities KPI Dashboard To Improve Sales Ideas PDF. This layout presents information on Email Performance, Web Performance, Cost Conversion. It is also available for immediate download and adjustment. So, changes can be made in the color, design, graphics or any other component to create a unique layout.
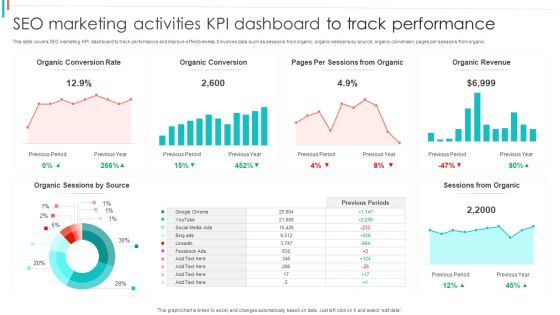
SEO Marketing Activities KPI Dashboard To Track Performance Brochure PDF
This slide covers SEO marketing KPI dashboard to track performance and improve effectiveness. It involves data such as sessions from organic, organic sessions by source, organic conversion, pages per sessions from organic.Pitch your topic with ease and precision using this SEO Marketing Activities KPI Dashboard To Track Performance Brochure PDF. This layout presents information on Organic Conversion, Sessions Organic, Organic Revenue. It is also available for immediate download and adjustment. So, changes can be made in the color, design, graphics or any other component to create a unique layout.

Financial Unsatisfactory Performance Dashboard With Accounting Ratios Diagrams PDF
This slide contains the information of the financial sector of the company to know where it stands and what needs to be done to improve the performance.It includes multiple ratios ROA, ROE, working capital ration and debt-equity ratio. Pitch your topic with ease and precision using this Financial Unsatisfactory Performance Dashboard With Accounting Ratios Diagrams PDF. This layout presents information on Return Assets, Working Capital, Return Equity. It is also available for immediate download and adjustment. So, changes can be made in the color, design, graphics or any other component to create a unique layout.
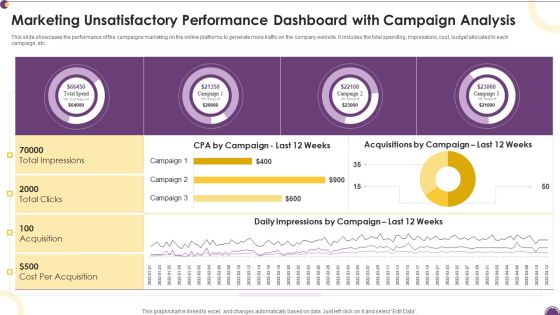
Marketing Unsatisfactory Performance Dashboard With Campaign Analysis Information PDF
This slide showcases the performance of the campaigns marketing on the online platforms to generate more traffic on the company website. It includes the total spending, impressions, cost, budget allocated to each campaign, etc.Pitch your topic with ease and precision using this Marketing Unsatisfactory Performance Dashboard With Campaign Analysis Information PDF. This layout presents information on Cost Acquisition, Total Clicks, Total Impressions. It is also available for immediate download and adjustment. So, changes can be made in the color, design, graphics or any other component to create a unique layout.

B2B Market Segmentation Dashboard Microsoft PDF
This slide illustrates the market segmentation dashboard for B2B which can benefit them to improve the focus and boost the revenue of the organization. It includes segmentation based in company size and different industries under B2B market. Pitch your topic with ease and precision using this B2B Market Segmentation Dashboard Microsoft PDF. This layout presents information on Industries, Market Segmentation, Service. It is also available for immediate download and adjustment. So, changes can be made in the color, design, graphics or any other component to create a unique layout.

Client Coverage Through Marketing Methods Ppt Inspiration Maker PDF
This slide displays the percentages of the amount of customers that are acquired by using these marketing methods. It includes influencer marketing, social media, guest blogging, paid distribution, etc. Pitch your topic with ease and precision using this Client Coverage Through Marketing Methods Ppt Inspiration Maker PDF. This layout presents information on Influencer Marketing, Paid Distribution, Social Media. It is also available for immediate download and adjustment. So, changes can be made in the color, design, graphics or any other component to create a unique layout.

Key Client Coverage Marketing Statistics Ppt Inspiration Design Inspiration PDF
This slide covers the stats for covering the customers for the betterment of the business and its speedily growth. It shows distribution channels used and region wise capturing of customers. Pitch your topic with ease and precision using this Key Client Coverage Marketing Statistics Ppt Inspiration Design Inspiration PDF. This layout presents information on Customer Penetration, Traditional, Indirect, Direct. It is also available for immediate download and adjustment. So, changes can be made in the color, design, graphics or any other component to create a unique layout.
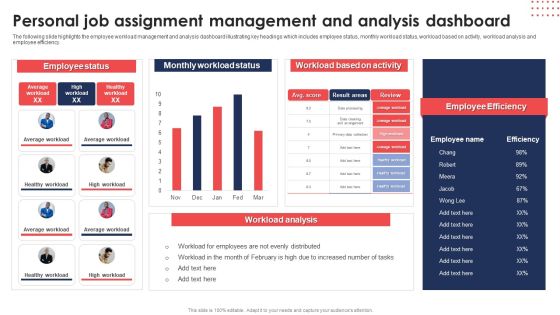
Personal Job Assignment Management And Analysis Dashboard Diagrams PDF
The following slide highlights the employee workload management and analysis dashboard illustrating key headings which includes employee status, monthly workload status, workload based on activity, workload analysis and employee efficiency. Pitch your topic with ease and precision using thisPersonal Job Assignment Management And Analysis Dashboard Diagrams PDF. This layout presents information on Employee Status, Monthly Workload Status, Workload Based Activity. It is also available for immediate download and adjustment. So, changes can be made in the color, design, graphics or any other component to create a unique layout.
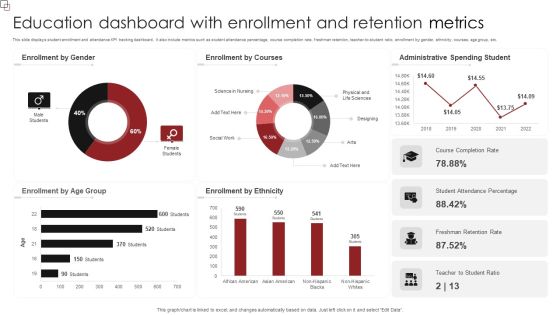
Education Dashboard With Enrollment And Retention Metrics Sample PDF
This slide displays student enrollment and attendance KPI tracking dashboard. It also include metrics such as student attendance percentage, course completion rate, freshman retention, teacher-to-student ratio, enrollment by gender, ethnicity, courses, age group, etc. Pitch your topic with ease and precision using this Education Dashboard With Enrollment And Retention Metrics Sample PDF. This layout presents information on Enrollment Gender, Enrollment Courses, Administrative Spending Student. It is also available for immediate download and adjustment. So, changes can be made in the color, design, graphics or any other component to create a unique layout.
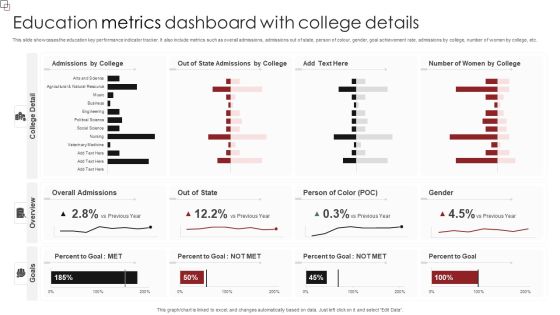
Education Metrics Dashboard With College Details Formats PDF
This slide showcases the education key performance indicator tracker. It also include metrics such as overall admissions, admissions out of state, person of colour, gender, goal achievement rate, admissions by college, number of women by college, etc. Pitch your topic with ease and precision using this Education Metrics Dashboard With College Details Formats PDF. This layout presents information on Overall Admissions, Person Of Color, Percent To Goal. It is also available for immediate download and adjustment. So, changes can be made in the color, design, graphics or any other component to create a unique layout.

Education Scorecard With Division Based Enrolment Metrics Professional PDF
This slide showcases dashboard for tracking student enrollment in a district. It include metrics such as student-teacher ratio, enrolment by gender, education assessment score, detention by school type, etc. Pitch your topic with ease and precision using this Education Scorecard With Division Based Enrolment Metrics Professional PDF. This layout presents information on Education Assessment Score, Enrollment Gender. It is also available for immediate download and adjustment. So, changes can be made in the color, design, graphics or any other component to create a unique layout.

Quarterly Financial Performance Kpis With Balance Sheet Designs PDF
The given slide highlights the quarterly financial performance of a company. It also includes KPIs such as ROA, working capital ratio, return on equity, debt equity ratio etc. Pitch your topic with ease and precision using this Quarterly Financial Performance Kpis With Balance Sheet Designs PDF. This layout presents information on Total Liabilities, Return On Equity, Working Capital Ratio. It is also available for immediate download and adjustment. So, changes can be made in the color, design, graphics or any other component to create a unique layout.

Quarterly Overall Business Performance Assessment With Kpi Dashboard Microsoft PDF
The given below slide showcases the overall business performance to evaluate the trends and KPAs. It includes quarterly insights of elements such as revenue, new customers, net profit, customer satisfaction, sales profitability, growth etc. Pitch your topic with ease and precision using this Quarterly Overall Business Performance Assessment With Kpi Dashboard Microsoft PDF. This layout presents information on Revenue, Customer Satisfaction, Net Profit. It is also available for immediate download and adjustment. So, changes can be made in the color, design, graphics or any other component to create a unique layout.
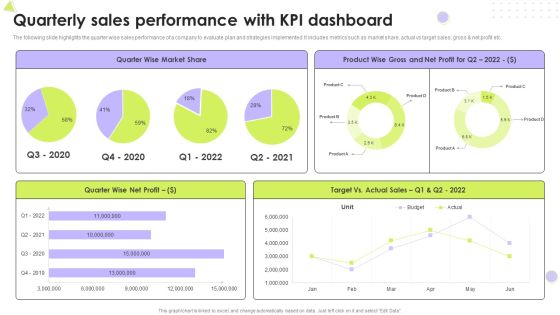
Quarterly Sales Performance With Kpi Dashboard Introduction PDF
The following slide highlights the quarter wise sales performance of a company to evaluate plan and strategies implemented. It includes metrics such as market share, actual vs target sales, gross and net profit etc. Pitch your topic with ease and precision using this Quarterly Sales Performance With Kpi Dashboard Introduction PDF. This layout presents information on Market Share, Net Profit, Target. It is also available for immediate download and adjustment. So, changes can be made in the color, design, graphics or any other component to create a unique layout.
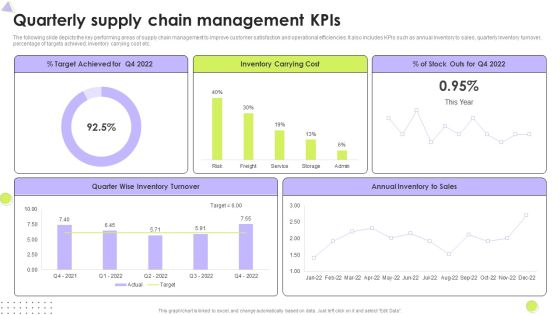
Quarterly Supply Chain Management Kpis Mockup PDF
The following slide depicts the key performing areas of supply chain management to improve customer satisfaction and operational efficiencies. It also includes KPIs such as annual inventory to sales, quarterly inventory turnover, percentage of targets achieved, inventory carrying cost etc. Pitch your topic with ease and precision using this Quarterly Supply Chain Management Kpis Mockup PDF. This layout presents information on Inventory Turnover, Inventory Carrying Cost, Target Achieved. It is also available for immediate download and adjustment. So, changes can be made in the color, design, graphics or any other component to create a unique layout.
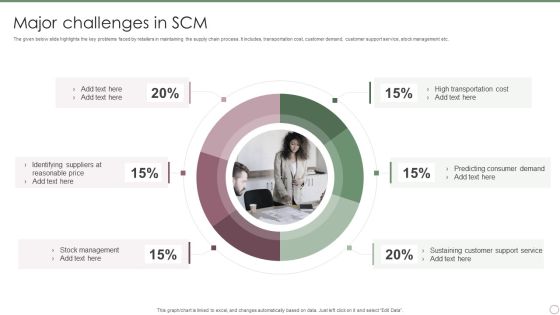
Major Challenges In SCM Ppt PowerPoint Presentation Gallery Pictures PDF
The given below slide highlights the key problems faced by retailers in maintaining the supply chain process. It includes, transportation cost, customer demand, customer support service, stock management etc. Pitch your topic with ease and precision using this Major Challenges In SCM Ppt PowerPoint Presentation Gallery Pictures PDF. This layout presents information on High Transportation Cost, Predicting Consumer Demand, Sustaining Customer, Support Service. It is also available for immediate download and adjustment. So, changes can be made in the color, design, graphics or any other component to create a unique layout.
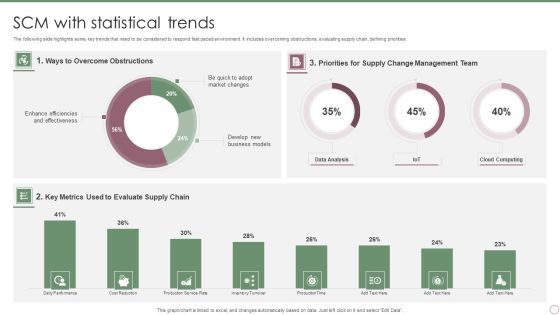
SCM With Statistical Trends Ppt PowerPoint Presentation Gallery Examples PDF
The following slide highlights some key trends that need to be considered to respond fast paced environment. It includes overcoming obstructions, evaluating supply chain, defining priorities. Pitch your topic with ease and precision using this SCM With Statistical Trends Ppt PowerPoint Presentation Gallery Examples PDF. This layout presents information on Ways To Overcome, Obstructions, Key Metrics, Evaluate Supply Chain. It is also available for immediate download and adjustment. So, changes can be made in the color, design, graphics or any other component to create a unique layout.

Manpower Data Analytics Strategy For Stakeholders For Decision Making Summary PDF
This slide depicts application of workforce analytics strategy among different stakeholders. It includes human resource executives, staff, senior executive and managers for taking effective decisions. Pitch your topic with ease and precision using this Manpower Data Analytics Strategy For Stakeholders For Decision Making Summary PDF. This layout presents information on Organizations, Analytics Capabilities, Generate Better Quality. It is also available for immediate download and adjustment. So, changes can be made in the color, design, graphics or any other component to create a unique layout.

Critical Statistics Of Blockchain And Distributed Ledger Technology Market Structure PDF
Mentioned slide highlights various insights of blockchain technology market. This slide shows key statistics about blockchain market outlook, blockchain spenders worldwide and by country. Organization can decide if embracing the technology is the right move for company using these statistics. Pitch your topic with ease and precision using this Critical Statistics Of Blockchain And Distributed Ledger Technology Market Structure PDF. This layout presents information on USA Contribution, Projected Blockchain, Market Value. It is also available for immediate download and adjustment. So, changes can be made in the color, design, graphics or any other component to create a unique layout.
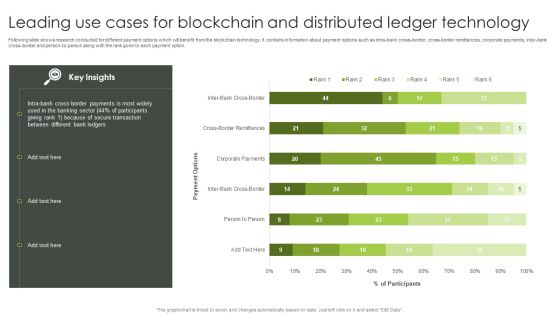
Leading Use Cases For Blockchain And Distributed Ledger Technology Slides PDF
Following slide shows research conducted for different payment options which will benefit from the blockchain technology. It contains information about payment options such as intra-bank cross-border, cross-border remittances, corporate payments, inter-bank cross-border and person-to-person along with the rank given to each payment option. Pitch your topic with ease and precision using this Leading Use Cases For Blockchain And Distributed Ledger Technology Slides PDF. This layout presents information on Person To Person, Corporate Payments, Cross Border Remittances. It is also available for immediate download and adjustment. So, changes can be made in the color, design, graphics or any other component to create a unique layout.
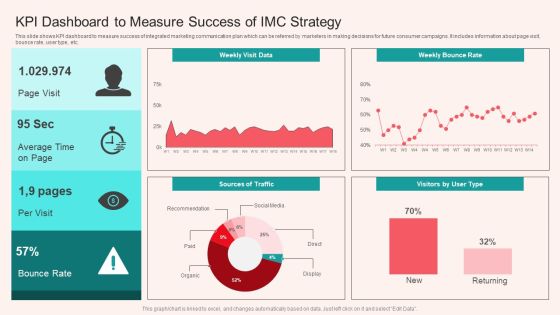
KPI Dashboard To Measure Success Of IMC Strategy Microsoft PDF
This slide shows KPI dashboard to measure success of integrated marketing communication plan which can be referred by marketers in making decisions for future consumer campaigns. It includes information about page visit, bounce rate, user type, etc. Pitch your topic with ease and precision using this KPI Dashboard To Measure Success Of IMC Strategy Microsoft PDF. This layout presents information on Average, Bounce Rate. It is also available for immediate download and adjustment. So, changes can be made in the color, design, graphics or any other component to create a unique layout.
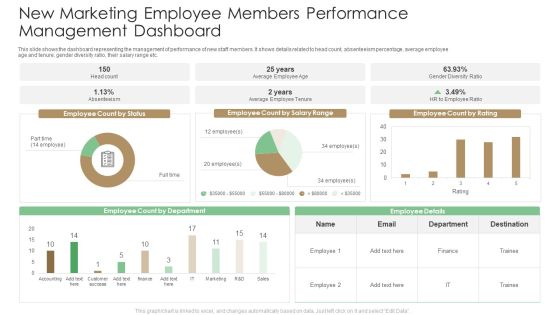
New Marketing Employee Members Performance Management Dashboard Summary PDF
This slide shows the dashboard representing the management of performance of new staff members. It shows details related to head count, absenteeism percentage, average employee age and tenure, gender diversity ratio, their salary range etc. Pitch your topic with ease and precision using this New Marketing Employee Members Performance Management Dashboard Summary PDF. This layout presents information on Employee Ratio, Average Employee Tenure. It is also available for immediate download and adjustment. So, changes can be made in the color, design, graphics or any other component to create a unique layout.

Support Team New Employee Members Performance Dashboard Designs PDF
This slide shows the dashboard representing the performance evaluation of the new staff members of the support team staff. It shoes details related to occupancy rate, net promoter score, average first contact resolution rate etc. Pitch your topic with ease and precision using this Support Team New Employee Members Performance Dashboard Designs PDF. This layout presents information on Target Range, Occupancy Rate, Contact Resolution Rate. It is also available for immediate download and adjustment. So, changes can be made in the color, design, graphics or any other component to create a unique layout.

Social Network Promotion Campaign Performance Report Demonstration PDF
The purpose of this slide is to highlight the digital marketing campaigning performance report to track information in real-time like new leads acquired, total leads, and revenue on monthly basis. The leads generated through various platforms are Twitter, Facebook, LinkedIn, etc. Pitch your topic with ease and precision using this Social Network Promotion Campaign Performance Report Demonstration PDF. This layout presents information on Sales Ready Leads, New Leads, New Revenue. It is also available for immediate download and adjustment. So, changes can be made in the color, design, graphics or any other component to create a unique layout.
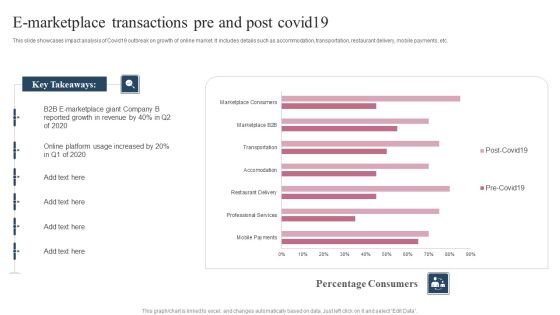
E Marketplace Transactions Pre And Post Covid19 Ppt Pictures Files PDF
This slide showcases impact analysis of Covid19 outbreak on growth of online market. It includes details such as accommodation, transportation, restaurant delivery, mobile payments, etc. Pitch your topic with ease and precision using this E Marketplace Transactions Pre And Post Covid19 Ppt Pictures Files PDF. This layout presents information on Key Takeaways, B2B E Marketplace, Online Platform. It is also available for immediate download and adjustment. So, changes can be made in the color, design, graphics or any other component to create a unique layout.
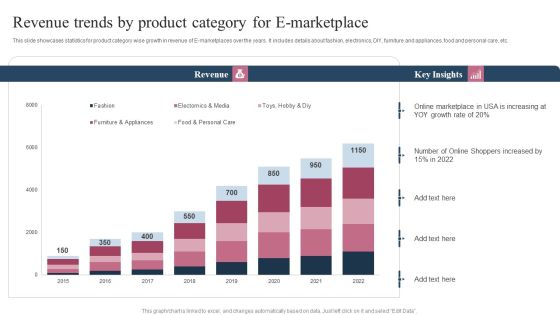
Revenue Trends By Product Category For E Marketplace Ppt Pictures Slide Portrait PDF
This slide showcases statistics for product category wise growth in revenue of E-marketplaces over the years. It includes details about fashion, electronics, DIY, furniture and appliances, food and personal care, etc. Pitch your topic with ease and precision using this Revenue Trends By Product Category For E Marketplace Ppt Pictures Slide Portrait PDF. This layout presents information on Revenue, Online Marketplace, Number Online, Shoppers Increased, 2015 To 2022. It is also available for immediate download and adjustment. So, changes can be made in the color, design, graphics or any other component to create a unique layout.

DISC Assessment Personality Style Report Of Employee Sample PDF
This slide covers employees disc personality style sheet. It includes DISC personality testing outcomes showing both natural or internal style and adapted or external style of an employee. Pitch your topic with ease and precision using this DISC Assessment Personality Style Report Of Employee Sample PDF. This layout presents information on Congratulations Sara Mathew, Internal Motivations, Remains Constant. It is also available for immediate download and adjustment. So, changes can be made in the color, design, graphics or any other component to create a unique layout.

Automotive Industry Report Motor Vehicle Production By Type Portrait PDF
This slide covers the details of the data related to vehicle production all over the world in last 10 years to know where we are right now and what is needed to be at a good spot in future. Pitch your topic with ease and precision using this Automotive Industry Report Motor Vehicle Production By Type Portrait PDF. This layout presents information on Automotive Industry Report, Motor Vehicle Production. It is also available for immediate download and adjustment. So, changes can be made in the color, design, graphics or any other component to create a unique layout.

 Home
Home