Comparison Bar Graph

Enterprise Marketing Activities KPI Dashboard To Track Performance Across Various Platforms Ideas PDF
This slide covers enterprise marketing dashboard to track performance across various platforms. It involves total insights connected, engagement from Facebook, twitter and Instagram.Pitch your topic with ease and precision using this Enterprise Marketing Activities KPI Dashboard To Track Performance Across Various Platforms Ideas PDF. This layout presents information on Instagram Engagement, Comments, Returning. It is also available for immediate download and adjustment. So, changes can be made in the color, design, graphics or any other component to create a unique layout.
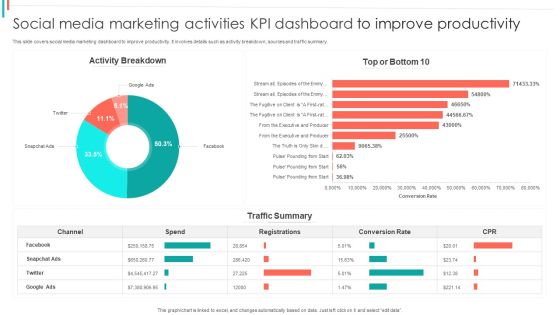
Social Media Marketing Activities KPI Dashboard To Improve Productivity Summary PDF
This slide covers social media marketing dashboard to improve productivity. It involves details such as activity breakdown, sources and traffic summary.Pitch your topic with ease and precision using this Social Media Marketing Activities KPI Dashboard To Improve Productivity Summary PDF. This layout presents information on Activity Breakdown, Conversion Rate, Traffic Summary. It is also available for immediate download and adjustment. So, changes can be made in the color, design, graphics or any other component to create a unique layout.

Technology Sales Enablement Survey Results Pictures PDF
The following slide showcase survey results conducted to find out the usage of sales enablement technology in organizations. The responses covered are maximum benefit to teams and improved efficiency.Pitch your topic with ease and precision using this Technology Sales Enablement Survey Results Pictures PDF. This layout presents information on Teams Benefited, Sales Marketing, Percent Respondents. It is also available for immediate download and adjustment. So, changes can be made in the color, design, graphics or any other component to create a unique layout.

Personal Job Assignment And Productivity Assessment Dashboard Sample PDF
The following slide highlights the employee workload and productivity assessment dashboard illustrating key headings which include employee work, productivity, workload by employee, assessment and summary. Pitch your topic with ease and precision using this Personal Job Assignment And Productivity Assessment Dashboard Sample PDF. This layout presents information on Employee Work, Assessment, Productivity. It is also available for immediate download and adjustment. So, changes can be made in the color, design, graphics or any other component to create a unique layout.

Education Dashboard With Absenteeism And Grade Details Metrics Diagrams PDF
This slide covers dashboard for tracking causes and rates of student absenteeism. It also include metrics such as average grades by subject and department. Pitch your topic with ease and precision using this Education Dashboard With Absenteeism And Grade Details Metrics Diagrams PDF. This layout presents information on Grade Department, English Proficiency, Medical Abs. It is also available for immediate download and adjustment. So, changes can be made in the color, design, graphics or any other component to create a unique layout.
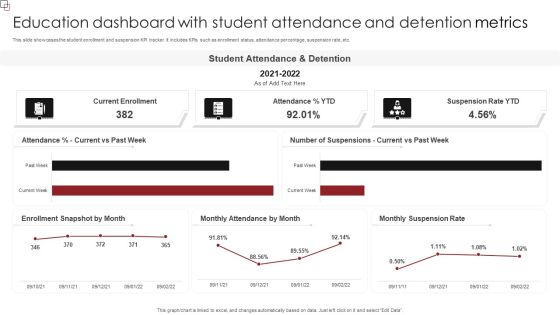
Education Dashboard With Student Attendance And Detention Metrics Inspiration PDF
This slide showcases the student enrollment and suspension KPI tracker. It includes KPIs such as enrollment status, attendance percentage, suspension rate, etc. Pitch your topic with ease and precision using this Education Dashboard With Student Attendance And Detention Metrics Inspiration PDF. This layout presents information on Student Attendance, Suspension Rate YTD, Current Enrollment. It is also available for immediate download and adjustment. So, changes can be made in the color, design, graphics or any other component to create a unique layout.
Training And Education Metrics Tracking Dashboard Guidelines PDF
This slide showcases dashboard for tracking training programs details. It include metrics such as training to invited percentage, unique trained, training man-days, total program names, etc. Pitch your topic with ease and precision using this Training And Education Metrics Tracking Dashboard Guidelines PDF. This layout presents information on Location Wise Training, Training Concerning Vertical, Tennessee. It is also available for immediate download and adjustment. So, changes can be made in the color, design, graphics or any other component to create a unique layout.
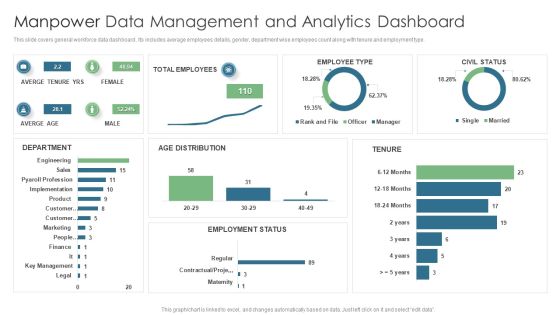
Manpower Data Management And Analytics Dashboard Topics PDF
This slide covers general workforce data dashboard . Its includes average employees details, gender, department wise employees count along with tenure and employment type. Pitch your topic with ease and precision using this Manpower Data Management And Analytics Dashboard Topics PDF. This layout presents information on Total Employees, Averge Tenure Yrs, Employee Type. It is also available for immediate download and adjustment. So, changes can be made in the color, design, graphics or any other component to create a unique layout.
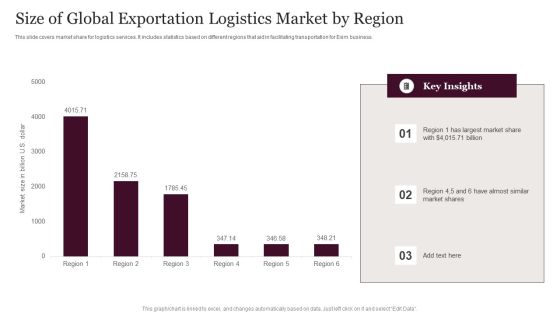
Size Of Global Exportation Logistics Market By Region Information PDF
This slide covers market share for logistics services. It includes statistics based on different regions that aid in facilitating transportation for Exim business. Pitch your topic with ease and precision using this Size Of Global Exportation Logistics Market By Region Information PDF. This layout presents information on Global Exportation Logistics, Market By Region. It is also available for immediate download and adjustment. So, changes can be made in the color, design, graphics or any other component to create a unique layout.

Open Organizational Management Transformation Kpi Dashboard Information PDF
This slide covers the KPI tracking dashboard for optimizing open changes. It includes metrics such as open changes by risk, status, due date, waiting for approval, etc. Pitch your topic with ease and precision using this Open Organizational Management Transformation Kpi Dashboard Information PDF. This layout presents information on Open Organizational Management, Transformation Kpi Dashboard. It is also available for immediate download and adjustment. So, changes can be made in the color, design, graphics or any other component to create a unique layout.
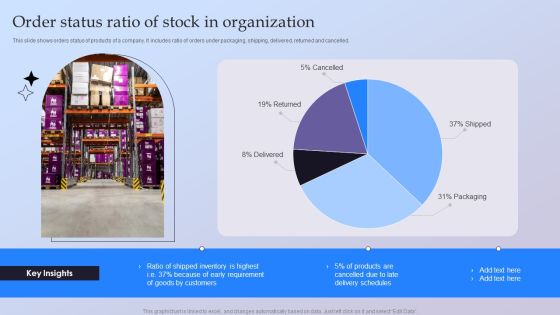
Order Status Ratio Of Stock In Organization Ppt Portfolio Examples PDF
This slide shows orders status of products of a company. It includes ratio of orders under packaging, shipping, delivered, returned and cancelled. Pitch your topic with ease and precision using this Order Status Ratio Of Stock In Organization Ppt Portfolio Examples PDF. This layout presents information on Shipped, Packaging, Delivered, Returned. It is also available for immediate download and adjustment. So, changes can be made in the color, design, graphics or any other component to create a unique layout.

Customer Acquisition Method In Brand Campaign Advertisement Themes PDF
This slide showcase the methods used by companies for product promotion in campaign. It includes influencer marketing, organic search and paid search. Pitch your topic with ease and precision using this Customer Acquisition Method In Brand Campaign Advertisement Themes PDF. This layout presents information on Product Promotion, Marketing, Organic Research. It is also available for immediate download and adjustment. So, changes can be made in the color, design, graphics or any other component to create a unique layout.
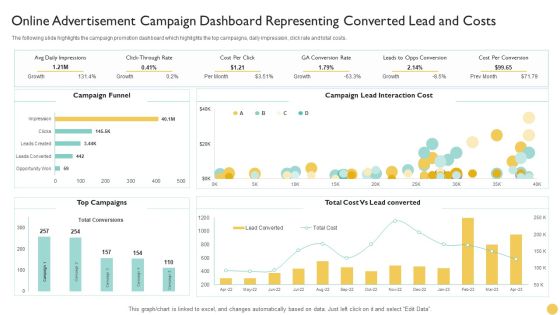
Online Advertisement Campaign Dashboard Representing Converted Lead And Costs Pictures PDF
The following slide highlights the campaign promotion dashboard which highlights the top campaigns, daily impression, click rate and total costs. Pitch your topic with ease and precision using this Online Advertisement Campaign Dashboard Representing Converted Lead And Costs Pictures PDF. This layout presents information on Campaign Funnel, Interaction Cost, Growth. It is also available for immediate download and adjustment. So, changes can be made in the color, design, graphics or any other component to create a unique layout.

Communication Barriers Manager Dashboard For Analyzing Ppt PowerPoint Presentation Inspiration Grid PDF
This slide represents the dashboard of communication manager. It includes KPIs such as current conversation, performance, customers and opportunities.Pitch your topic with ease and precision using this Communication Barriers Manager Dashboard For Analyzing Ppt PowerPoint Presentation Inspiration Grid PDF. This layout presents information on Current Conversation, Economic Indicator, Conversation Calls. It is also available for immediate download and adjustment. So, changes can be made in the color, design, graphics or any other component to create a unique layout.

Social Media Marketing And Advertising Promotional Investments Projections Sample PDF
This slide depicts investment in different social media platforms. It includes stats for Facebook, LinkedIn, Google plus, twitter, YouTube, Pinterest and Instagram platforms.Pitch your topic with ease and precision using this Social Media Marketing And Advertising Promotional Investments Projections Sample PDF. This layout presents information on Advertisements, People Facebook, People Believe. It is also available for immediate download and adjustment. So, changes can be made in the color, design, graphics or any other component to create a unique layout.
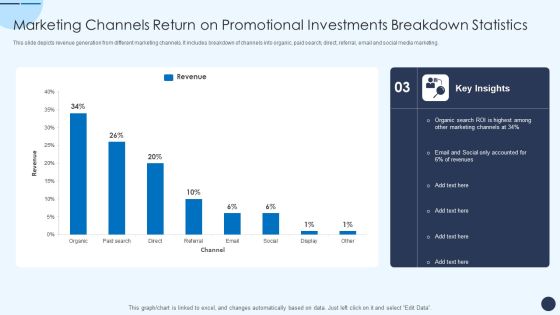
Marketing Channels Return On Promotional Investments Breakdown Statistics Information PDF
This slide depicts revenue generation from different marketing channels. It includes breakdown of channels into organic, paid search, direct, referral, email and social media marketing.Pitch your topic with ease and precision using this Marketing Channels Return On Promotional Investments Breakdown Statistics Information PDF. This layout presents information on Revenues Marketing, Organic Search, Social Accounted. It is also available for immediate download and adjustment. So, changes can be made in the color, design, graphics or any other component to create a unique layout.

Dashboard Depicting Construction Project Metrics Inspiration PDF
This slide states the construction project management dashboard which includes estimated costs and duration, site inspections, status of regional projects, name of customers from different countries, etc. Pitch your topic with ease and precision using this Dashboard Depicting Construction Project Metrics Inspiration PDF. This layout presents information on Estimated Cost, Estimated Duration, Projects. It is also available for immediate download and adjustment. So, changes can be made in the color, design, graphics or any other component to create a unique layout.
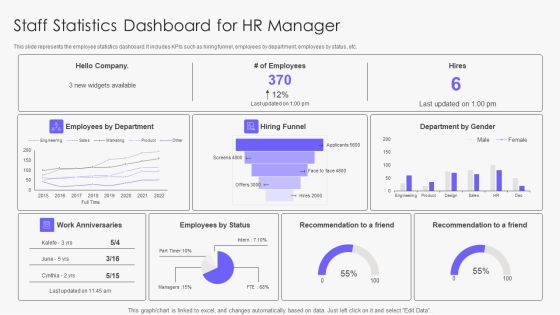
Staff Statistics Dashboard For Hr Manager Rules PDF
This slide represents the employee statistics dashboard. It includes KPIs such as hiring funnel, employees by department, employees by status, etc. Pitch your topic with ease and precision using this Staff Statistics Dashboard For Hr Manager Rules PDF. This layout presents information on Hiring Funnel, Employees By Status, Employees By Department. It is also available for immediate download and adjustment. So, changes can be made in the color, design, graphics or any other component to create a unique layout.

Team Distrust Barrier To Business Effective Communication Infographics PDF
The following slide showcases team distrust that affect workforce communication. Main problems faced by employee are that they dont receive clear instructions, inability to collaborate etc. Pitch your topic with ease and precision using this Team Distrust Barrier To Business Effective Communication Infographics PDF. This layout presents information on Team Distrust Barrier, Business Effective Communication. It is also available for immediate download and adjustment. So, changes can be made in the color, design, graphics or any other component to create a unique layout.

Increment In Social Media Engagement Through Campaign Metrics Professional PDF
This slide covers increment in social media engagement through campaign KPI which include lead break breakdown, online analytics of web traffic and key conversion metrics. Pitch your topic with ease and precision using this Increment In Social Media Engagement Through Campaign Metrics Professional PDF. This layout presents information on Quality, Key Conversion Metrics, Social Media. It is also available for immediate download and adjustment. So, changes can be made in the color, design, graphics or any other component to create a unique layout.
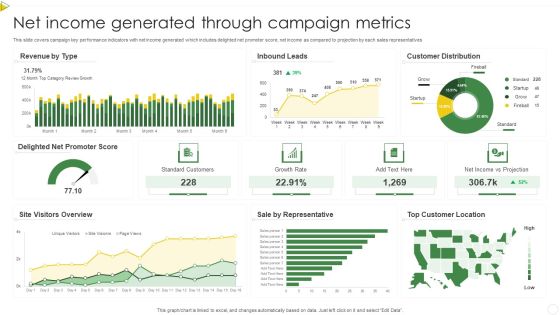
Net Income Generated Through Campaign Metrics Summary PDF
This slide covers campaign key performance indicators with net income generated which includes delighted net promoter score, net income as compared to projection by each sales representatives. Pitch your topic with ease and precision using this Net Income Generated Through Campaign Metrics Summary PDF. This layout presents information on Standard Customers, Growth Rate, Net Income. It is also available for immediate download and adjustment. So, changes can be made in the color, design, graphics or any other component to create a unique layout.

Web Monthly Usage Analysis Summary Dashboard Clipart PDF
This slide depicts website usage analytics report for tracking performance. It involves number of users, sessions, bounce rate and average session duration. Pitch your topic with ease and precision using this Web Monthly Usage Analysis Summary Dashboard Clipart PDF. This layout presents information on Agency Metrics, Source Rate, Goal. It is also available for immediate download and adjustment. So, changes can be made in the color, design, graphics or any other component to create a unique layout.

Consulting Project Status Report With Priority Rules PDF
This slide showcases project status to keep a track of tasks, monitor and mitigate any risk that arises. The following table covers task list, assign, priority, and progress. Pitch your topic with ease and precision using this Consulting Project Status Report With Priority Rules PDF. This layout presents information on Development, Design, Planning. It is also available for immediate download and adjustment. So, changes can be made in the color, design, graphics or any other component to create a unique layout.
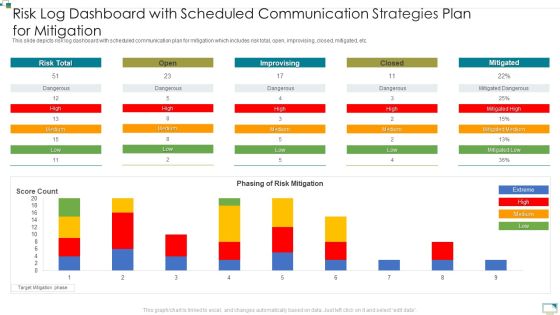
Risk Log Dashboard With Scheduled Communication Strategies Plan For Mitigation Brochure PDF
This slide depicts risk log dashboard with scheduled communication plan for mitigation which includes risk total, open, improvising, closed, mitigated, etc. Pitch your topic with ease and precision using this Risk Log Dashboard With Scheduled Communication Strategies Plan For Mitigation Brochure PDF. This layout presents information on Risk Total, Phasing, Risk Mitigation. It is also available for immediate download and adjustment. So, changes can be made in the color, design, graphics or any other component to create a unique layout.

Dashboard For Tracking Leadership Training And Development Program Progress Topics PDF
This slide illustrates dashboard for tracking leadership development program progress. It also contains information about performing leaders, competency heatmap, executive training, etc. Pitch your topic with ease and precision using this Dashboard For Tracking Leadership Training And Development Program Progress Topics PDF. This layout presents information on People Completed, Number Trainees, Leadership Training. It is also available for immediate download and adjustment. So, changes can be made in the color, design, graphics or any other component to create a unique layout.

Customer Relationship Management Lifecycle Analytics Dashboard With Sales Record Brochure PDF
This slide signifies the customer relationship management analytics dashboard. It covers information about sales record by different representative, total products sold, sales by different month, etc.Pitch your topic with ease and precision using this Customer Relationship Management Lifecycle Analytics Dashboard With Sales Record Brochure PDF. This layout presents information on Sales Record, Representative, Total Items. It is also available for immediate download and adjustment. So, changes can be made in the color, design, graphics or any other component to create a unique layout.

Opportunity Analysis Dashboard Indicating Business Performance Information Rules PDF
This slide shows opportunity analysis dashboard indicating market performance which contains opportunity count by size, sales stage, region, revenue and average revenue. Pitch your topic with ease and precision using this Opportunity Analysis Dashboard Indicating Business Performance Information Rules PDF. This layout presents information on Opportunity Count, Revenue, Sales. It is also available for immediate download and adjustment. So, changes can be made in the color, design, graphics or any other component to create a unique layout.
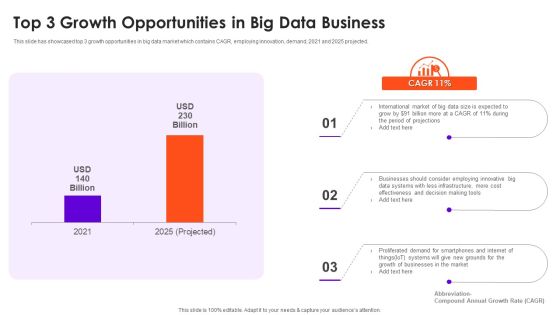
Top 3 Growth Opportunities In Big Data Business Download PDF
This slide has showcased top 3 growth opportunities in big data market which contains CAGR, employing innovation, demand, 2021 and 2025 projected. Pitch your topic with ease and precision using this Top 3 Growth Opportunities In Big Data Business Download PDF. This layout presents information on Cost, Businesses, Data Systems. It is also available for immediate download and adjustment. So, changes can be made in the color, design, graphics or any other component to create a unique layout.

Electronics Production Annual Market Growth Graphics PDF
This slide contains the information related to the growth of electronic devices manufacturing in the market. Pitch your topic with ease and precision using this Electronics Production Annual Market Growth Graphics PDF. This layout presents information on hnology Advancements, Electronics Market, Demand. It is also available for immediate download and adjustment. So, changes can be made in the color, design, graphics or any other component to create a unique layout.
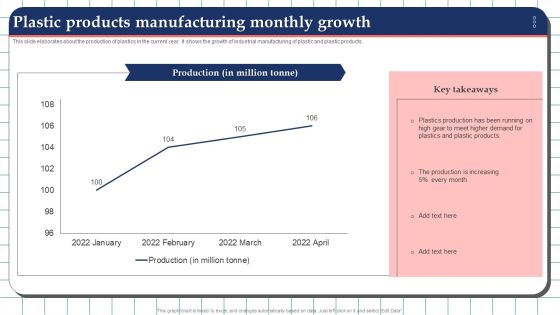
Plastic Products Manufacturing Monthly Growth Guidelines PDF
This slide elaborates about the production of plastics in the current year. It shows the growth of industrial manufacturing of plastic and plastic products. Pitch your topic with ease and precision using this Plastic Products Manufacturing Monthly Growth Guidelines PDF. This layout presents information on Production, Demand, Manufacturing Monthly Growth. It is also available for immediate download and adjustment. So, changes can be made in the color, design, graphics or any other component to create a unique layout.

Production Growth Of Green Building Materials By Product Formats PDF
This slide elaborates the manufacturing growth of green building materials over the last years with the product wise divisions. The product divisions include structural, interior, exterior, etc. Pitch your topic with ease and precision using this Production Growth Of Green Building Materials By Product Formats PDF. This layout presents information on Manufacturing, Materials, Global Crisis. It is also available for immediate download and adjustment. So, changes can be made in the color, design, graphics or any other component to create a unique layout.

Quarterly Beverages Industry Production Growth By Region Designs PDF
This slide contains the information regarding the quarterly manufacturing growth of beverages in the market. Pitch your topic with ease and precision using this Quarterly Beverages Industry Production Growth By Region Designs PDF. This layout presents information on Beverages Manufacturing, Quarterly Beverages Industry, Production Growth. It is also available for immediate download and adjustment. So, changes can be made in the color, design, graphics or any other component to create a unique layout.
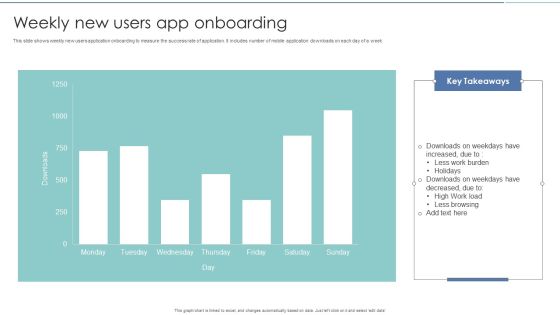
Weekly New Users App Onboarding Diagrams PDF
This slide shows weekly new users application onboarding to measure the success rate of application. It includes number of mobile application downloads on each day of a week. Pitch your topic with ease and precision using this Weekly New Users App Onboarding Diagrams PDF. This layout presents information on Weekly New Users, App Onboarding. It is also available for immediate download and adjustment. So, changes can be made in the color, design, graphics or any other component to create a unique layout.

Market Insights Of Data Center Architecture Management Elements PDF
This slide covers statistical information of data center infrastructure solutions market. It involves details such as CAGR growth, growth rate year over year and growth generated by APAC. Pitch your topic with ease and precision using this Market Insights Of Data Center Architecture Management Elements PDF. This layout presents information on Growth Rate, Market, Investors. It is also available for immediate download and adjustment. So, changes can be made in the color, design, graphics or any other component to create a unique layout.

Financial Feasibility Analysis Dashboard Depicting Income And Unemployment Analysis Download PDF
This slide illustrates economic feasibility dashboard depicting income and unemployment analysis. It contains information about household income, unemployment rate, poverty, status, etc. Pitch your topic with ease and precision using this Financial Feasibility Analysis Dashboard Depicting Income And Unemployment Analysis Download PDF. This layout presents information on Median Household Income, Unemployment Rate, Percent Living Poverty. It is also available for immediate download and adjustment. So, changes can be made in the color, design, graphics or any other component to create a unique layout.

Human Turnover Assessment Of Various Departments Ppt PowerPoint Presentation File Layouts PDF
This slide shows the workforce turnover rate in various departments of organization. HR department has seen the lowest employee turnover rate due to.Pitch your topic with ease and precision using this Human Turnover Assessment Of Various Departments Ppt PowerPoint Presentation File Layouts PDF. This layout presents information on Employee Turnover, Department Been, Poor Compensation. It is also available for immediate download and adjustment. So, changes can be made in the color, design, graphics or any other component to create a unique layout.
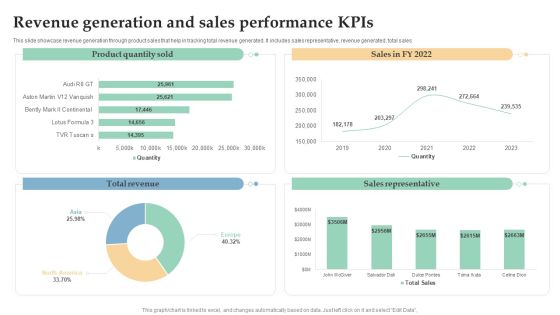
Revenue Generation And Sales Performance Kpis Ppt Inspiration Background Image PDF
This slide showcase revenue generation through product sales that help in tracking total revenue generated. It includes sales representative, revenue generated, total sales. Pitch your topic with ease and precision using this Revenue Generation And Sales Performance Kpis Ppt Inspiration Background Image PDF. This layout presents information on Total Revenue, Sales Representative, Product Quantity Sold. It is also available for immediate download and adjustment. So, changes can be made in the color, design, graphics or any other component to create a unique layout.

Dashboard To Business Success Measurement Of Email Marketing Campaign Professional PDF
This slide showcases dashboard to track effectiveness of email marketing campaign. It provides information about sent, direct, organic, paid, referral, analytics, sessions, etc. Pitch your topic with ease and precision using this Dashboard To Business Success Measurement Of Email Marketing Campaign Professional PDF. This layout presents information on Email Marketing, Analytics, Sessions. It is also available for immediate download and adjustment. So, changes can be made in the color, design, graphics or any other component to create a unique layout.

Customer Service Enterprise Workforce Dashboard Designs PDF
This slide ILLUSTRATES consumer support extended team dashboard. It provides information about average resolution time, cases transferred open cases, service level agreements SLAs, etc. Pitch your topic with ease and precision using this Customer Service Enterprise Workforce Dashboard Designs PDF. This layout presents information on Average Resolution Time, Active SLAs Breached, Average Customer. It is also available for immediate download and adjustment. So, changes can be made in the color, design, graphics or any other component to create a unique layout.

Earning Potential And Financial Forecasting Dashboard Summary PDF
This slide illustrates facts and figures related to sales figures. It includes data of monthly revenue generation FY23, yearly revenue, expected revenue generation FY23 etc. Pitch your topic with ease and precision using this Earning Potential And Financial Forecasting Dashboard Summary PDF. This layout presents information on Sales Revenue, Expected Revenue, Product. It is also available for immediate download and adjustment. So, changes can be made in the color, design, graphics or any other component to create a unique layout.
Enterprise Saas Vendor Market Share And Earnings Growth Icons PDF
This slide covers saas vendors comparative market share report. It also includes percentage of total annual revenue growth. Pitch your topic with ease and precision using this Enterprise Saas Vendor Market Share And Earnings Growth Icons PDF. This layout presents information on Annual Growth, Market Share, Revenue. It is also available for immediate download and adjustment. So, changes can be made in the color, design, graphics or any other component to create a unique layout.
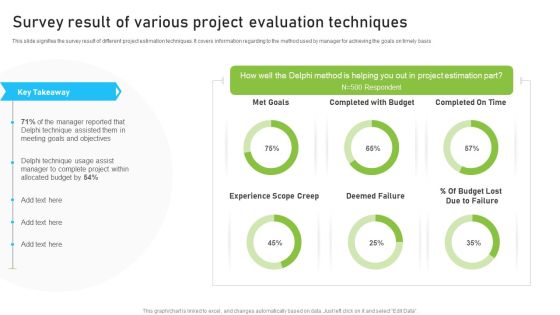
Survey Result Of Various Project Evaluation Techniques Sample PDF
This slide signifies the survey result of different project estimation techniques. It covers information regarding to the method used by manager for achieving the goals on timely basis. Pitch your topic with ease and precision using this Survey Result Of Various Project Evaluation Techniques Sample PDF. This layout presents information on Budget, Goals, Method. It is also available for immediate download and adjustment. So, changes can be made in the color, design, graphics or any other component to create a unique layout.

Project Risk Mitigation And Management KPI Dashboard Designs PDF
The following slide highlights the project risk management dashboard to evaluate key preforming areas KPAs. It includes elements such as tasks status, progress, time, risk etc. Pitch your topic with ease and precision using this Project Risk Mitigation And Management KPI Dashboard Designs PDF. This layout presents information on Resource Actuals, Resource Allocations, Risk. It is also available for immediate download and adjustment. So, changes can be made in the color, design, graphics or any other component to create a unique layout.

Corporate Annual Financial Summary Report Ppt Portfolio Skills PDF
This slide represents annual financial statement snapshot. It covers gross profit margin, operating expenditure, operating profit, net profit margin, revenue, EBIT etc. Pitch your topic with ease and precision using this Corporate Annual Financial Summary Report Ppt Portfolio Skills PDF. This layout presents information on Operating Expenditure Ratio, Operating Profit, Net Profit Margin. It is also available for immediate download and adjustment. So, changes can be made in the color, design, graphics or any other component to create a unique layout.
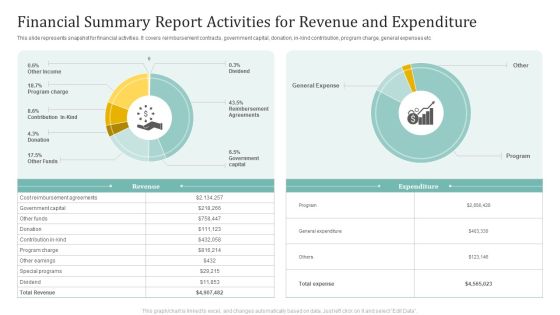
Financial Summary Report Activities For Revenue And Expenditure Ppt Inspiration Display PDF
This slide represents snapshot for financial activities. It covers reimbursement contracts, government capital, donation, in-kind contribution, program charge, general expenses etc. Pitch your topic with ease and precision using this Financial Summary Report Activities For Revenue And Expenditure Ppt Inspiration Display PDF. This layout presents information on Government Capital, Other Funds, Program Charge. It is also available for immediate download and adjustment. So, changes can be made in the color, design, graphics or any other component to create a unique layout.

Financial Summary Report Institute Showcasing Workplace Highlights Ppt Infographics Inspiration PDF
This slide represents financial institute snapshot. It showcase workplace highlights such as workplace demographics, work space, flexibility, workstation size station etc. Pitch your topic with ease and precision using this Financial Summary Report Institute Showcasing Workplace Highlights Ppt Infographics Inspiration PDF. This layout presents information on Shared Seating Arrangement, Flexibility Workplace, Workplace. It is also available for immediate download and adjustment. So, changes can be made in the color, design, graphics or any other component to create a unique layout.
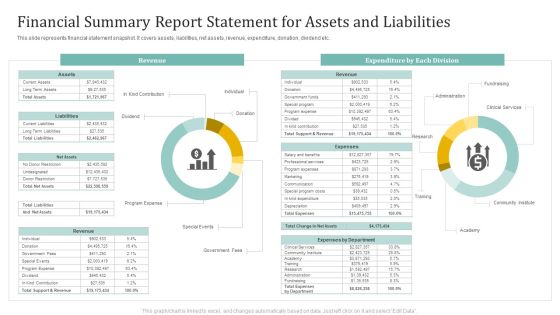
Financial Summary Report Statement For Assets And Liabilities Ppt Slides Guide PDF
This slide represents financial statement snapshot. It covers assets, liabilities, net assets, revenue, expenditure, donation, dividend etc. Pitch your topic with ease and precision using this Financial Summary Report Statement For Assets And Liabilities Ppt Slides Guide PDF. This layout presents information on Revenue, Expenditure Each Division, Fundraising. It is also available for immediate download and adjustment. So, changes can be made in the color, design, graphics or any other component to create a unique layout.
Five Years Sales Projection And Analysis Dashboard Icons PDF
This slide defines the dashboard for five years sales forecast and analysis . It includes information related to the estimated and actual sales. Pitch your topic with ease and precision using this Five Years Sales Projection And Analysis Dashboard Icons PDF. This layout presents information on Forecast Value, Forecast Accuracy, Won Opportunities. It is also available for immediate download and adjustment. So, changes can be made in the color, design, graphics or any other component to create a unique layout.
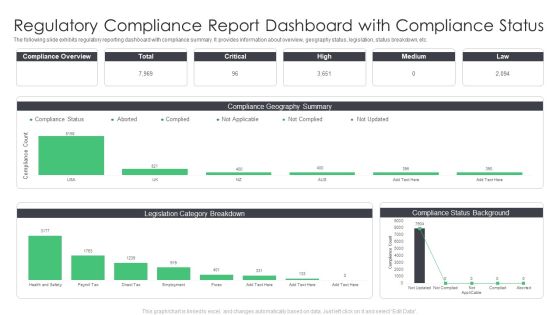
Regulatory Compliance Report Dashboard With Compliance Status Infographics PDF
The following slide exhibits regulatory reporting dashboard with compliance summary. It provides information about overview, geography status, legislation, status breakdown, etc. Pitch your topic with ease and precision using this Regulatory Compliance Report Dashboard With Compliance Status Infographics PDF. This layout presents information on Dashboard With Compliance Status, Regulatory Compliance Report. It is also available for immediate download and adjustment. So, changes can be made in the color, design, graphics or any other component to create a unique layout.

Media Company Quarterly Revenue Projection Dashboard Mockup PDF
This slide depicts estimation and actual revenue generated for a quarter. It also includes top ten customers, revenue by product and entity for media company. Pitch your topic with ease and precision using this Media Company Quarterly Revenue Projection Dashboard Mockup PDF. This layout presents information on Total Revenue, Quarterly Revenue Entity, Top 10 Customers. It is also available for immediate download and adjustment. So, changes can be made in the color, design, graphics or any other component to create a unique layout.
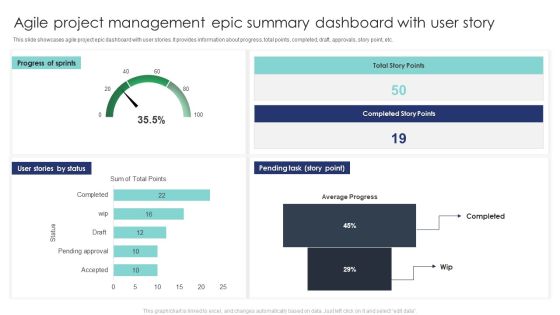
Agile Project Management Epic Summary Dashboard With User Story Formats PDF
This slide showcases agile project epic dashboard with user stories. It provides information about progress, total points, completed, draft, approvals, story point, etc. Pitch your topic with ease and precision using this Agile Project Management Epic Summary Dashboard With User Story Formats PDF. This layout presents information on Pending Tast, Progress Sprints, User Stories Status. It is also available for immediate download and adjustment. So, changes can be made in the color, design, graphics or any other component to create a unique layout.

KPI Dashboard To Measure Strategic Monetary Performance Graphics PDF
This slide shows KPI dashboard to measure strategic monetary performance. It includes gross profit margin, opex ratio, operating profit margin, revenue, etc. Pitch your topic with ease and precision using this KPI Dashboard To Measure Strategic Monetary Performance Graphics PDF. This layout presents information on Gross Profit Margin, Opex Ratio, Operating Profit Margin. It is also available for immediate download and adjustment. So, changes can be made in the color, design, graphics or any other component to create a unique layout.
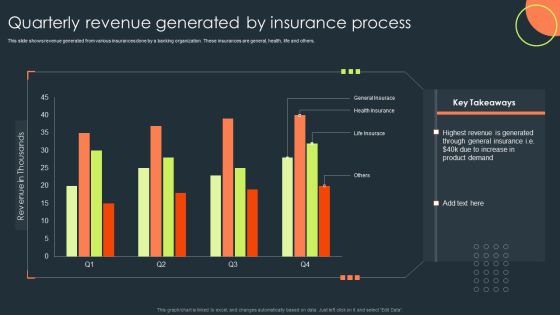
Quarterly Revenue Generated By Insurance Process Demonstration PDF
This slide shows revenue generated from various insurances done by a banking organization. These insurances are general, health, life and others. Pitch your topic with ease and precision using this Quarterly Revenue Generated By Insurance Process Demonstration PDF. This layout presents information on General Insurace, Health Insurance, Life Insurace. It is also available for immediate download and adjustment. So, changes can be made in the color, design, graphics or any other component to create a unique layout.
Workforce Productivity Tracking Report Slide2 Professional PDF
The following slide highlights the KPIs of work streams to identify the threats and formulate strategies to mitigate its effect. It includes elements such as summary, health report etc. Pitch your topic with ease and precision using this Workforce Productivity Tracking Report Slide2 Professional PDF. This layout presents information on Sales, Issues, Budget, Workforce. It is also available for immediate download and adjustment. So, changes can be made in the color, design, graphics or any other component to create a unique layout.

Real Time Dashboard For Change Impact Analysis Ppt Pictures Layouts PDF
This slide represents business change impact assessment metric dashboard. It includes impacted organizations and groups, impact severity, impacted users, impacted jobs etc. Pitch your topic with ease and precision using this Real Time Dashboard For Change Impact Analysis Ppt Pictures Layouts PDF. This layout presents information on Impact Severity, Role Changes Impact, High, Low, Medium. It is also available for immediate download and adjustment. So, changes can be made in the color, design, graphics or any other component to create a unique layout.

Earned Value Management Representing Project Progress Ppt Layouts Slide Portrait PDF
This slide represents earned value management key parameters representing project progress upto week 7 such as planned value, actual cost and earned value. Pitch your topic with ease and precision using this Earned Value Management Representing Project Progress Ppt Layouts Slide Portrait PDF. This layout presents information on Planned Value, Actual Cost, Earned Value. It is also available for immediate download and adjustment. So, changes can be made in the color, design, graphics or any other component to create a unique layout.
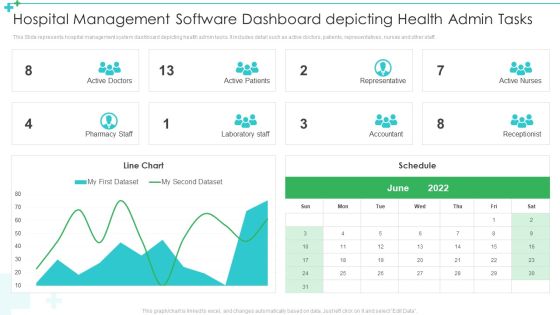
Hospital Management Software Dashboard Depicting Health Admin Tasks Ppt Pictures Inspiration PDF
This Slide represents hospital management system dashboard depicting health admin tasks. It includes detail such as active doctors, patients, representatives, nurses and other staff. Pitch your topic with ease and precision using this Hospital Management Software Dashboard Depicting Health Admin Tasks Ppt Pictures Inspiration PDF. This layout presents information on Active Doctors, Active Patients, Representative. It is also available for immediate download and adjustment. So, changes can be made in the color, design, graphics or any other component to create a unique layout.

Hospital Management Software Dashboard To Track Covid 19 Cases Ppt Professional Inspiration PDF
This slide shows hospital management system dashboard for tracking details of COVID-19 cases. It includes information about confirmed cases, recovered, deaths, death rate, etc. Pitch your topic with ease and precision using this Hospital Management Software Dashboard To Track Covid 19 Cases Ppt Professional Inspiration PDF. This layout presents information on Recovered Cases, Deaths, Mortality. It is also available for immediate download and adjustment. So, changes can be made in the color, design, graphics or any other component to create a unique layout.

Monthly Project Progress Report With Total Budget Ppt Inspiration Shapes PDF
This slide showcases monthly project status with total budget. It provides information about project understanding, design, development, internal and external testing, deployment, etc. Pitch your topic with ease and precision using this Monthly Project Progress Report With Total Budget Ppt Inspiration Shapes PDF. This layout presents information on Pending, Completed, Project Understanding. It is also available for immediate download and adjustment. So, changes can be made in the color, design, graphics or any other component to create a unique layout.
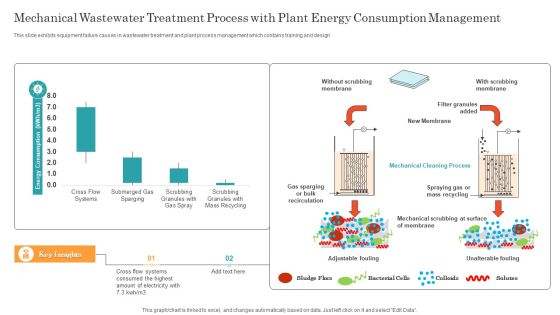
Mechanical Wastewater Treatment Process With Plant Energy Consumption Management Ppt Pictures File Formats PDF
This slide exhibits equipment failure causes in wastewater treatment and plant process management which contains training and design. Pitch your topic with ease and precision using this Mechanical Wastewater Treatment Process With Plant Energy Consumption Management Ppt Pictures File Formats PDF. This layout presents information on Cross Flow Systems, Mechanical Cleaning Process, New Membrane. It is also available for immediate download and adjustment. So, changes can be made in the color, design, graphics or any other component to create a unique layout.
Market Penetration Dashboard With Sales Metrics Ppt Icon Examples PDF
This slide shows market penetration dashboard for sales team. It provides information about regions, emerging markets, planned sales, actual sales, revenue, gender wise sales, etc. Pitch your topic with ease and precision using this Market Penetration Dashboard With Sales Metrics Ppt Icon Examples PDF. This layout presents information on Emerging Markets, Sales Gender, Actual Sales. It is also available for immediate download and adjustment. So, changes can be made in the color, design, graphics or any other component to create a unique layout.

Software Market Penetration KPI Dashboard Ppt Outline Aids PDF
This slide shows market penetration key performance indicator KPI dashboard for software sector. It provides information about growth rate, portfolio, platform, applications, services, on premises, cloud, etc. Pitch your topic with ease and precision using this Software Market Penetration KPI Dashboard Ppt Outline Aids PDF. This layout presents information on Market Size, Global Market, Cloud. It is also available for immediate download and adjustment. So, changes can be made in the color, design, graphics or any other component to create a unique layout.

Customer NPS Metric With Revenue Growth Impact Ppt Show Portrait PDF
This slide illustrates net promoter score with revenue growth impact. It provides information about market average NPS, respondents, promoter, detractor, passive, etc. Pitch your topic with ease and precision using this Customer NPS Metric With Revenue Growth Impact Ppt Show Portrait PDF. This layout presents information on Promoter, Detractor, Passive. It is also available for immediate download and adjustment. So, changes can be made in the color, design, graphics or any other component to create a unique layout.

Asset Assessment Dashboard Indicating Revenue And Productivity Infographics PDF
This slide showcases asset valuation dashboard highlighting company revenue and productivity index. It provides information about geographical evaluation, development cost, commercial cost, etc.Pitch your topic with ease and precision using this Asset Assessment Dashboard Indicating Revenue And Productivity Infographics PDF. This layout presents information on Projected Development, Productivity Index, Geographical Evaluation. It is also available for immediate download and adjustment. So, changes can be made in the color, design, graphics or any other component to create a unique layout.

Asset Assessment Dashboard With ROI Metrics Topics PDF
This slide illustrates asset valuation dashboard with return on investment metrics. It provides information about internal rate of return, investment type, deal size, asset type, Pitch your topic with ease and precision using this Asset Assessment Dashboard With ROI Metrics Topics PDF. This layout presents information on Investment Amount, Asset Valuation, Internal Return. It is also available for immediate download and adjustment. So, changes can be made in the color, design, graphics or any other component to create a unique layout.
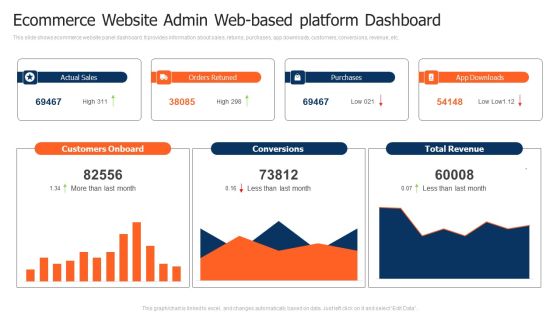
Ecommerce Website Admin Web Based Platform Dashboard Pictures PDF
This slide shows ecommerce website panel dashboard. It provides information about sales, returns, purchases, app downloads, customers, conversions, revenue, etc. Pitch your topic with ease and precision using this Ecommerce Website Admin Web Based Platform Dashboard Pictures PDF. This layout presents information on Customers Onboard, Purchases, Total Revenue. It is also available for immediate download and adjustment. So, changes can be made in the color, design, graphics or any other component to create a unique layout.

Dashboard For Business Operational Activities Operations Administration Designs PDF
This slide represents dashboard for management of business operational activities. It includes marketing, product, human resource, sales, finance, services and support. Pitch your topic with ease and precision using this Dashboard For Business Operational Activities Operations Administration Designs PDF. This layout presents information on Marketing, Product, Human Resources. It is also available for immediate download and adjustment. So, changes can be made in the color, design, graphics or any other component to create a unique layout.

Financial Structure Approach Showing Debt And Equity Division Introduction PDF
This slide shows the division of capital of an organisation into multiple sources that are debt, preferred stock, equity capital and other sources . Pitch your topic with ease and precision using this Financial Structure Approach Showing Debt And Equity Division Introduction PDF. This layout presents information on Other Sources, Preferred Stock, Equity Capital, Debt. It is also available for immediate download and adjustment. So, changes can be made in the color, design, graphics or any other component to create a unique layout.
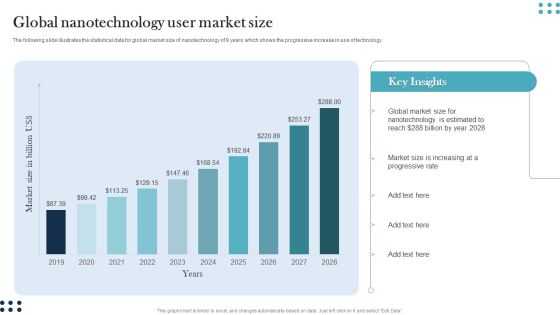
Global Nanotechnology User Market Size Guidelines PDF
The following slide illustrates the statistical data for global market size of nanotechnology of 9 years which shows the progressive increase in use of technology. Pitch your topic with ease and precision using this Global Nanotechnology User Market Size Guidelines PDF. This layout presents information on Global Market Size, Nanotechnology, Estimated To Reach. It is also available for immediate download and adjustment. So, changes can be made in the color, design, graphics or any other component to create a unique layout.

Kpi Dashboard To Track Business To Business E Commerce Performance Slides PDF
This slide shows KPI dashboard of online B2B trade performance. It includes sales, purchases and orders amount. Pitch your topic with ease and precision using this Kpi Dashboard To Track Business To Business E Commerce Performance Slides PDF. This layout presents information on Dashboard, Track Business, Performance. It is also available for immediate download and adjustment. So, changes can be made in the color, design, graphics or any other component to create a unique layout.

Organizational Change Management Process Flow Dashboard Ppt PowerPoint Presentation Diagram PDF
This slide covers Business change management lifecycle dashboard. It involves overall health, customer data, financials and operational efficiency. Pitch your topic with ease and precision using this Organizational Change Management Process Flow Dashboard Ppt PowerPoint Presentation Diagram PDF. This layout presents information on Financial Data, Operational Efficiency, Consumer Data. It is also available for immediate download and adjustment. So, changes can be made in the color, design, graphics or any other component to create a unique layout.
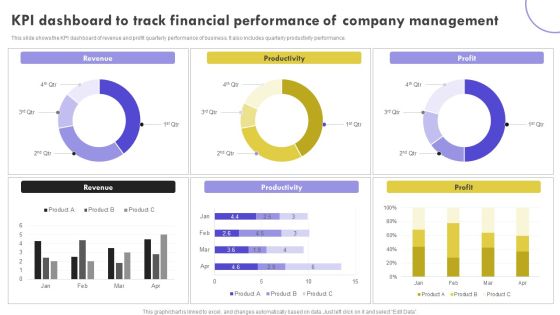
KPI Dashboard To Track Financial Performance Of Company Management Clipart PDF
This slide shows the KPI dashboard of revenue and profit quarterly performance of business. It also includes quarterly productivity performance. Pitch your topic with ease and precision using this KPI Dashboard To Track Financial Performance Of Company Management Clipart PDF. This layout presents information on Revenue, Productivity, Profit. It is also available for immediate download and adjustment. So, changes can be made in the color, design, graphics or any other component to create a unique layout.

Scrum Task Project Management Dashboard Information PDF
The following slide demonstrates scrum project task management dashboard. It includes information about sprint velocity, scope changes, tasks category, tasks progress, planned, finished, added, removed, bug, story, etc. Pitch your topic with ease and precision using this Scrum Task Project Management Dashboard Information PDF. This layout presents information on Scrum Task Project, Management Dashboard. It is also available for immediate download and adjustment. So, changes can be made in the color, design, graphics or any other component to create a unique layout.

Target Market Assessment With Audience Demographics Inspiration PDF
This slide covers the dashboard for target audience analysis. It includes demographics based on gender, age, region, population density, household structure, and income. Pitch your topic with ease and precision using this Target Market Assessment With Audience Demographics Inspiration PDF. This layout presents information on Target Market Assessment, Audience Demographics . It is also available for immediate download and adjustment. So, changes can be made in the color, design, graphics or any other component to create a unique layout.

Average Sales Compensation And Salary Dashboard Introduction PDF
The following slide showcases compensation administration dashboard highlighting sales compensation. The dashboard further includes average monthly compensation per employee. Pitch your topic with ease and precision using this Average Sales Compensation And Salary Dashboard Introduction PDF. This layout presents information on Salary Dashboard, Average Sales Compensation. It is also available for immediate download and adjustment. So, changes can be made in the color, design, graphics or any other component to create a unique layout.

Employee Compensation And Salary Dashboard By Gender And Location Download PDF
The following slide showcases compensation dashboard that assist in analyzing your companys employee compensation costs. It includes total salary, bonus, commission, employee and sick days. Pitch your topic with ease and precision using this Employee Compensation And Salary Dashboard By Gender And Location Download PDF. This layout presents information on Employee By Location, Location, Employee. It is also available for immediate download and adjustment. So, changes can be made in the color, design, graphics or any other component to create a unique layout.
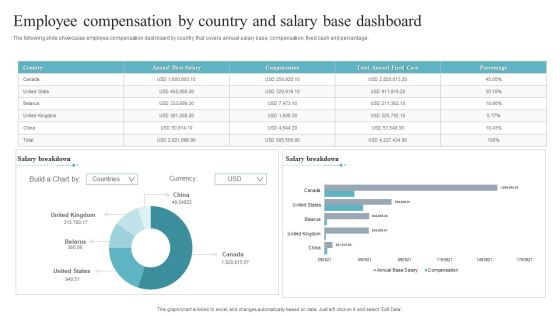
Employee Compensation By Country And Salary Base Dashboard Mockup PDF
The following slide showcases employee compensation dashboard by country that covers annual salary base, compensation, fixed cash and percentage. Pitch your topic with ease and precision using this Employee Compensation By Country And Salary Base Dashboard Mockup PDF. This layout presents information on Employee Compensation, Country Salary Base Dashboard. It is also available for immediate download and adjustment. So, changes can be made in the color, design, graphics or any other component to create a unique layout.

Employee Compensation Salary By Gender And Designation Levels Dashboard Portrait PDF
The following slides showcases overview of compensation analytics dashboard that includes average male and female salary, headcount by gender and salary distribution. Pitch your topic with ease and precision using this Employee Compensation Salary By Gender And Designation Levels Dashboard Portrait PDF. This layout presents information on Employee Compensation Salary, Designation Levels Dashboard. It is also available for immediate download and adjustment. So, changes can be made in the color, design, graphics or any other component to create a unique layout.

Personnel Salary Process Dashboard With Trend Brochure PDF
The following slide highlights the employee payroll process dashboard with trend illustrating key headings which includes payroll process status, status, payroll period, employees and payroll trend. Pitch your topic with ease and precision using this Personnel Salary Process Dashboard With Trend Brochure PDF. This layout presents information on Personnel Salary Process, Dashboard With Trend. It is also available for immediate download and adjustment. So, changes can be made in the color, design, graphics or any other component to create a unique layout.

Salary Management Dashboard For Origination Graphics PDF
The following slide highlights the payroll management dashboard for organization illustrating key headings which includes home, task to do, messages, last payroll and trends Pitch your topic with ease and precision using this Salary Management Dashboard For Origination Graphics PDF. This layout presents information on Salary Management Dashboard, Origination. It is also available for immediate download and adjustment. So, changes can be made in the color, design, graphics or any other component to create a unique layout.

Preferred Conflict Resolution Styles In Organization Demonstration PDF
The following slide showcases preferred conflict management styles and their effectiveness in organizations. Main styles included are dominating, compromising, collaborating, accommodating and avoiding. Pitch your topic with ease and precision using this Preferred Conflict Resolution Styles In Organization Demonstration PDF. This layout presents information on Preferred Conflict, Resolution Styles, Organization. It is also available for immediate download and adjustment. So, changes can be made in the color, design, graphics or any other component to create a unique layout.

Company Incident Management Dashboard With Priority Microsoft PDF
The following slide showcases workplace incident management and classification dashboard. It includes active incident priorities, support groups and problems by department. Pitch your topic with ease and precision using this Company Incident Management Dashboard With Priority Microsoft PDF. This layout presents information on Active Incident Classifications, Active Incident Support, Active Incident Priorities . It is also available for immediate download and adjustment. So, changes can be made in the color, design, graphics or any other component to create a unique layout.
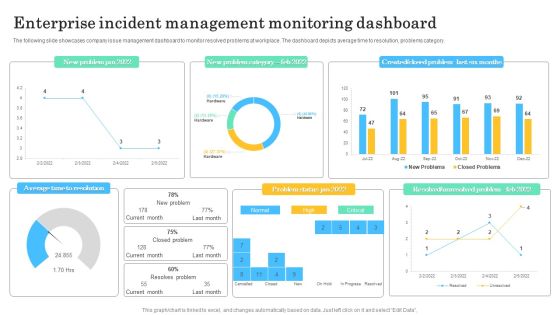
Enterprise Incident Management Monitoring Dashboard Graphics PDF
The following slide showcases company issue management dashboard to monitor resolved problems at workplace. The dashboard depicts average time to resolution, problems category. Pitch your topic with ease and precision using this Enterprise Incident Management Monitoring Dashboard Graphics PDF. This layout presents information on Average Time Resolution, New Problem Category. It is also available for immediate download and adjustment. So, changes can be made in the color, design, graphics or any other component to create a unique layout.
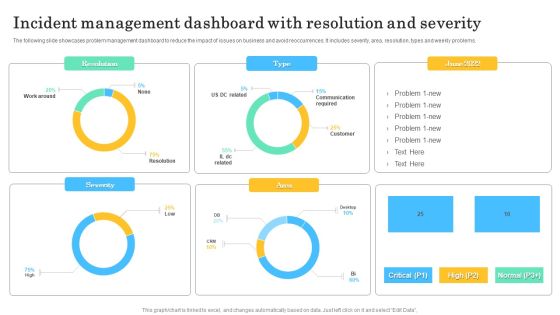
Incident Management Dashboard With Resolution And Severity Guidelines PDF
The following slide showcases problem management dashboard to reduce the impact of issues on business and avoid reoccurrences. It includes severity, area, resolution, types and weekly problems. Pitch your topic with ease and precision using this Incident Management Dashboard With Resolution And Severity Guidelines PDF. This layout presents information on Resolution, Severity, Area. It is also available for immediate download and adjustment. So, changes can be made in the color, design, graphics or any other component to create a unique layout.
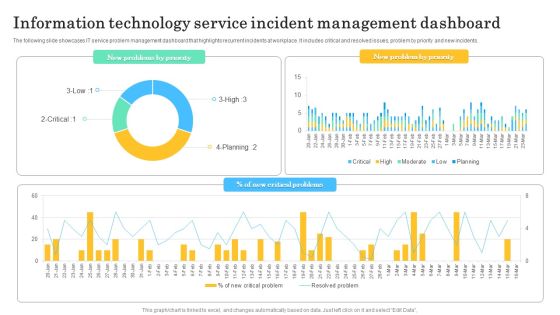
Information Technology Service Incident Management Dashboard Graphics PDF
The following slide showcases IT service problem management dashboard that highlights recurrent incidents at workplace. It includes critical and resolved issues, problem by priority and new incidents. Pitch your topic with ease and precision using this Information Technology Service Incident Management Dashboard Graphics PDF. This layout presents information onInformation Technology, Service Incident, Management Dashboard. It is also available for immediate download and adjustment. So, changes can be made in the color, design, graphics or any other component to create a unique layout.
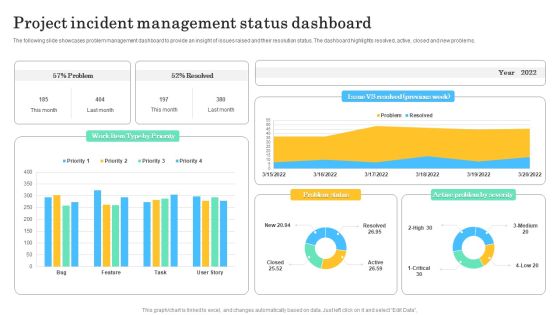
Project Incident Management Status Dashboard Sample PDF
The following slide showcases problem management dashboard to provide an insight of issues raised and their resolution status. The dashboard highlights resolved, active, closed and new problems. Pitch your topic with ease and precision using this Project Incident Management Status Dashboard Sample PDF. This layout presents information on Project Incident, Management Status Dashboard. It is also available for immediate download and adjustment. So, changes can be made in the color, design, graphics or any other component to create a unique layout.
Email Marketing Campaign Kpis Tracking Dashboard Graphics PDF
This slide shows key performance indicators KPI dashboard for measuring effectiveness of email campaigns. It provides information about sent, delivered, opens, clicks, unsubscribed, bounces, complaints, etc. Pitch your topic with ease and precision using this Email Marketing Campaign Kpis Tracking Dashboard Graphics PDF. This layout presents information on Email Marketing Campaign, Tracking Dashboard. It is also available for immediate download and adjustment. So, changes can be made in the color, design, graphics or any other component to create a unique layout.

Dashboard For Project Stakeholder Engagement And Management Metrics Brochure PDF
This slide showcases a dashboard for project stakeholders illustrating KPIs for measurement. It includes types of stakeholders, stakeholder receptiveness etc. Pitch your topic with ease and precision using this Dashboard For Project Stakeholder Engagement And Management Metrics Brochure PDF. This layout presents information on Types Of Stakeholders, Receptiveness, Number Of Stakeholders. It is also available for immediate download and adjustment. So, changes can be made in the color, design, graphics or any other component to create a unique layout.

Planned Vs Actual Cost Financial Yearly Forecast Portrait PDF
This slide shows planned and actual cost business finance plan to cover financial gaps. It includes planned and actual cost for a year with deviations. Pitch your topic with ease and precision using this Planned Vs Actual Cost Financial Yearly Forecast Portrait PDF. This layout presents information on Planned Vs Actual Cost, Financial Yearly Forecast. It is also available for immediate download and adjustment. So, changes can be made in the color, design, graphics or any other component to create a unique layout.

School Yearly Forecast With Financial Performance Information PDF
This slide shows business financial plan for pool water services to manage things effectively. It includes financial position, Target Market and Action Plan etc. Pitch your topic with ease and precision using this School Yearly Forecast With Financial Performance Information PDF. This layout presents information on Target Market, Action Plan. It is also available for immediate download and adjustment. So, changes can be made in the color, design, graphics or any other component to create a unique layout.

Business Information Protection Dashboard For Overtime Status Breakdown Introduction PDF
This slide covers business security dashboard for overtime status breakdown which includes monthly incident reporting.Pitch your topic with ease and precision using this Business Information Protection Dashboard For Overtime Status Breakdown Introduction PDF. This layout presents information on Business Security, Control Status Breakdown, Network Inspection. It is also available for immediate download and adjustment. So, changes can be made in the color, design, graphics or any other component to create a unique layout.
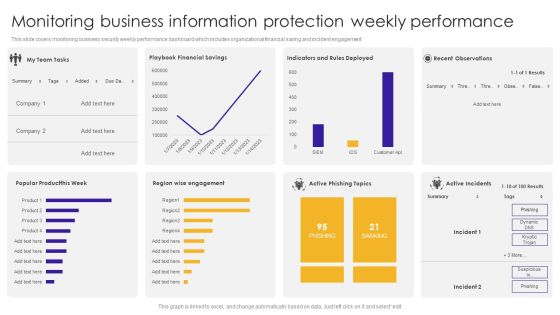
Monitoring Business Information Protection Weekly Performance Summary PDF
This slide covers monitoring business security weekly performance dashboard which includes organizational financial saving and incident engagement. Pitch your topic with ease and precision using this Monitoring Business Information Protection Weekly Performance Summary PDF. This layout presents information on Active Phishing, Active Incidents, Recent Observations. It is also available for immediate download and adjustment. So, changes can be made in the color, design, graphics or any other component to create a unique layout.

Communication Dissemination And Project Management Dashboard Inspiration PDF
This slide illustrates facts and figures related to project management and communication. It includes weekly clients meetings, project status, overdue tasks etc.Pitch your topic with ease and precision using this Communication Dissemination And Project Management Dashboard Inspiration PDF. This layout presents information on Progress Plan, Overdue Tasks, Project Status. It is also available for immediate download and adjustment. So, changes can be made in the color, design, graphics or any other component to create a unique layout.

Public Healthcare Administration Dashboard For Hospital Guidelines PDF
This slide illustrates facts and figures related to patient healthcare in a hospital. It includes metrics such as patient statistics, latest patients, total patients, total staff, etc.Pitch your topic with ease and precision using this Public Healthcare Administration Dashboard For Hospital Guidelines PDF. This layout presents information on Total Patients, Total Rooms, Patient Statistics. It is also available for immediate download and adjustment. So, changes can be made in the color, design, graphics or any other component to create a unique layout.

Manufacturing Plant Corporate Sustainability Dashboard Indicating Sourcing And Consumption Infographics PDF
The following slide showcases business sustainability dashboard highlighting multiple sources of technology. It provides information about renewable energy, plant age, solar, wind, biomass, regionality, etc.Pitch your topic with ease and precision using this Manufacturing Plant Corporate Sustainability Dashboard Indicating Sourcing And Consumption Infographics PDF. This layout presents information on Energy Consumption, Freshwater Consumption, Chemical Recovery. It is also available for immediate download and adjustment. So, changes can be made in the color, design, graphics or any other component to create a unique layout.
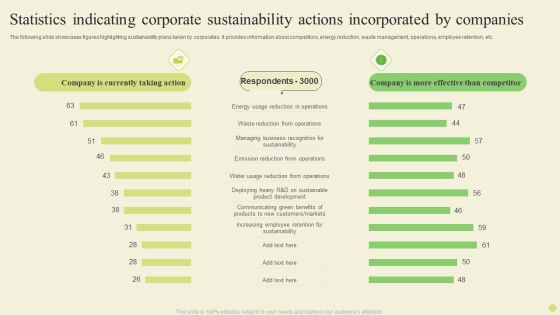
Statistics Indicating Corporate Sustainability Actions Incorporated By Companies Diagrams PDF
The following slide showcases figures highlighting sustainability plans taken by corporates. It provides information about competitors, energy reduction, waste management, operations, employee retention, etc.Pitch your topic with ease and precision using this Statistics Indicating Corporate Sustainability Actions Incorporated By Companies Diagrams PDF. This layout presents information on Energy Reduction, Emission Reduction, Increasing Employee. It is also available for immediate download and adjustment. So, changes can be made in the color, design, graphics or any other component to create a unique layout.
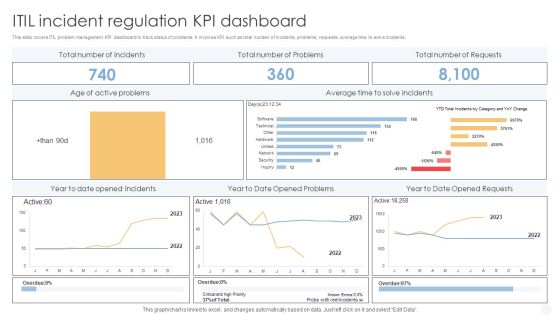
ITIL Incident Regulation Kpi Dashboard Background PDF
This slide covers ITIL problem management KPI dashboard to track status of problems. It involves KPI such as total number of incidents, problems, requests, average time to solve incidents.Pitch your topic with ease and precision using this ITIL Incident Regulation Kpi Dashboard Background PDF. This layout presents information on Active Problems, Average Incidents, Opened Problems. It is also available for immediate download and adjustment. So, changes can be made in the color, design, graphics or any other component to create a unique layout.

Engineering Performance Metrics Dashboard For Measuring Performance Download PDF
This slide covers engineering KPI dashboard to measure performance. It involves KPIs such as cycle time breakdown, risk breakdown, activities on focus and timeline. Pitch your topic with ease and precision using this Engineering Performance Metrics Dashboard For Measuring Performance Download PDF. This layout presents information on Average, Risk Breakdown, Measuring Performance. It is also available for immediate download and adjustment. So, changes can be made in the color, design, graphics or any other component to create a unique layout.
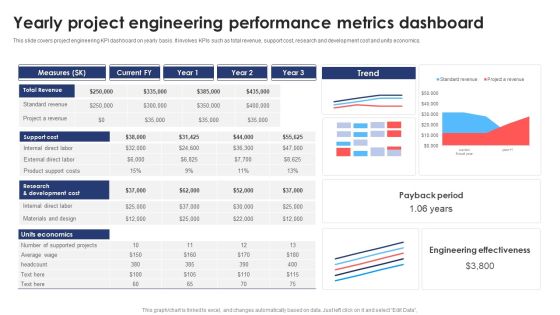
Yearly Project Engineering Performance Metrics Dashboard Information PDF
This slide covers project engineering KPI dashboard on yearly basis. It involves KPIs such as total revenue, support cost, research and development cost and units economics. Pitch your topic with ease and precision using this Yearly Project Engineering Performance Metrics Dashboard Information PDF. This layout presents information on Support Cost, Revenue, Measures. It is also available for immediate download and adjustment. So, changes can be made in the color, design, graphics or any other component to create a unique layout.

Monthly Sales Capability Statistical Data Background PDF
This slide illustrates graphical representation and tabular data of forecasted and cumulative sales to evaluate companys future targets and achievements. It includes month wise revenue generation. Pitch your topic with ease and precision using this Monthly Sales Capability Statistical Data Background PDF. This layout presents information on Monthly Sales, Capability Statistical Data. It is also available for immediate download and adjustment. So, changes can be made in the color, design, graphics or any other component to create a unique layout.
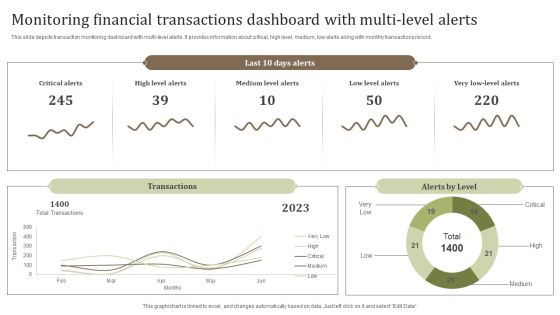
Monitoring Financial Transactions Dashboard With Multi Level Alerts Background PDF
This slide depicts transaction monitoring dashboard with multi-level alerts. It provides information about critical, high level, medium, low alerts along with monthly transactions record. Pitch your topic with ease and precision using this Monitoring Financial Transactions Dashboard With Multi Level Alerts Background PDF. This layout presents information on Critical Alerts, Medium Level Alerts, Total Transactions. It is also available for immediate download and adjustment. So, changes can be made in the color, design, graphics or any other component to create a unique layout.

Scrum Project Sprint Report Guidelines PDF
This slide illustrates sprint summary overview of scrum project management. It includes estimate, actual, difference from estimate, percent difference, goal percent difference, no. of tasks, etc. Pitch your topic with ease and precision using this Scrum Project Sprint Report Guidelines PDF. This layout presents information on Scrum Project, Sprint Report. It is also available for immediate download and adjustment. So, changes can be made in the color, design, graphics or any other component to create a unique layout.

Sprint Metrics And Backlog Summary Report Brochure PDF
This slide illustrates summary of Jira project management sprint testing. It includes sprint highlights, overall issues and risks, retrospective points, sprint spillover, etc. Pitch your topic with ease and precision using this Sprint Metrics And Backlog Summary Report Brochure PDF. This layout presents information on Sprint Metrics And Backlog, Summary Report. It is also available for immediate download and adjustment. So, changes can be made in the color, design, graphics or any other component to create a unique layout.

Annual Diversified Investment Portfolio Report Introduction PDF
This slide illustrates report on performance of a diversified investment portfolio. It includes investments like UK stocks, foreign stocks, bonds with average annual return, annualized volatility etc.Pitch your topic with ease and precision using this Annual Diversified Investment Portfolio Report Introduction PDF. This layout presents information on Foreign Stocks, Month Return, Term Investments. It is also available for immediate download and adjustment. So, changes can be made in the color, design, graphics or any other component to create a unique layout.

Business Performance Report Across Diversified Segments Microsoft PDF
This slide illustrates report on business performance on different segments . It includes order won, replacement business, new business across different products etc.Pitch your topic with ease and precision using this Business Performance Report Across Diversified Segments Microsoft PDF. This layout presents information on Replacement Business, New Business, Replacement Business. It is also available for immediate download and adjustment. So, changes can be made in the color, design, graphics or any other component to create a unique layout.
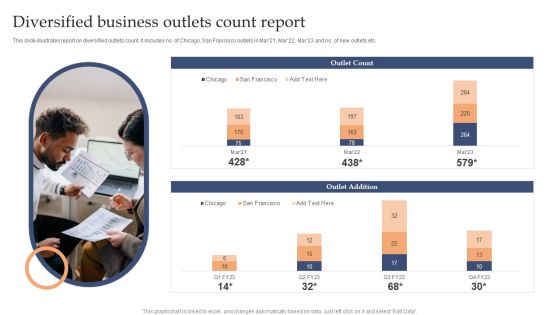
Diversified Business Outlets Count Report Background PDF
This slide illustrates report on diversified outlets count. It includes no. of Chicago, San Francisco outlets in Mar21, Mar22, Mar23 and no. of new outlets etc.Pitch your topic with ease and precision using this Diversified Business Outlets Count Report Background PDF. This layout presents information on Outlet Count, Outlet Addition, Chicago. It is also available for immediate download and adjustment. So, changes can be made in the color, design, graphics or any other component to create a unique layout.
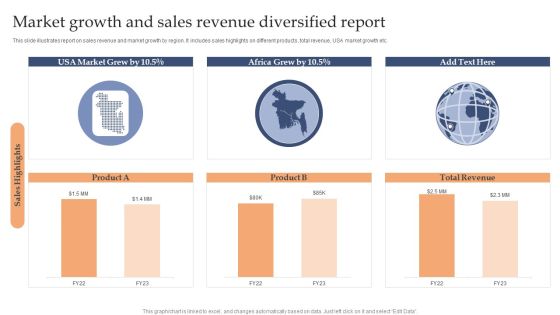
Market Growth And Sales Revenue Diversified Report Sample PDF
This slide illustrates report on sales revenue and market growth by region. It includes sales highlights on different products, total revenue, USA market growth etc.Pitch your topic with ease and precision using this Market Growth And Sales Revenue Diversified Report Sample PDF. This layout presents information on Market Grew, Africa Grew, Total Revenue. It is also available for immediate download and adjustment. So, changes can be made in the color, design, graphics or any other component to create a unique layout.
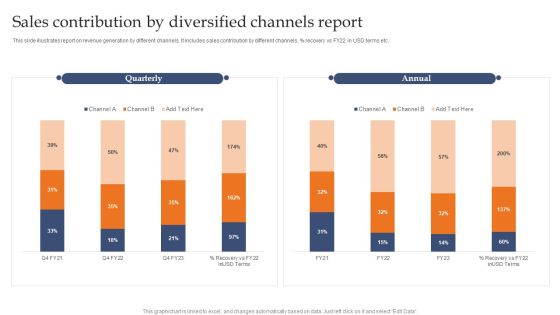
Sales Contribution By Diversified Channels Report Demonstration PDF
This slide illustrates report on revenue generation by different channels. It includes sales contribution by different channels, precent recovery vs FY22 in USD terms etc.Pitch your topic with ease and precision using this Sales Contribution By Diversified Channels Report Demonstration PDF. This layout presents information on Quarterly, Annual, Channel. It is also available for immediate download and adjustment. So, changes can be made in the color, design, graphics or any other component to create a unique layout.

Non Profit Business Quarterly Funding Sources Analysis Infographics PDF
This slide shows the quarterly funding sources of a non profit business. These sources include self funding, seed funding, venture capital, etc. Pitch your topic with ease and precision using this Non Profit Business Quarterly Funding Sources Analysis Infographics PDF. This layout presents information on Venture Capital, Seed Funding, Quarter Whereas. It is also available for immediate download and adjustment. So, changes can be made in the color, design, graphics or any other component to create a unique layout.

30 60 90 Days Project Administration Strategy Infographics PDF
This slide covers 30 60 90 days project management plan which will be helpful for the project leaders to take relevent actions for completing key activities.Pitch your topic with ease and precision using this 30 60 90 Days Project Administration Strategy Infographics PDF. This layout presents information on Team Discussion, Improve Product, Scheduling Process. It is also available for immediate download and adjustment. So, changes can be made in the color, design, graphics or any other component to create a unique layout.
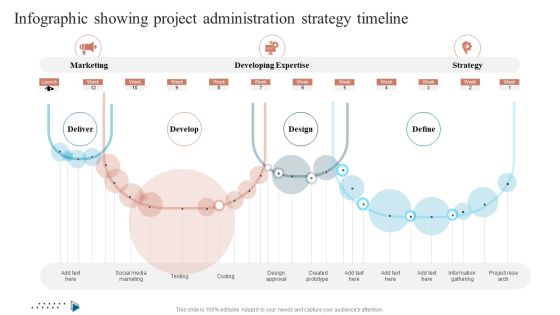
Infographic Showing Project Administration Strategy Timeline Background PDF
This slide covers a dashboard which includes 4 steps in IT process. It also includes project budget, workload, upcoming deadlines and overdue tasks.Pitch your topic with ease and precision using this Infographic Showing Project Administration Strategy Timeline Background PDF. This layout presents information on Developing Expertise, Design Approval, Created Prototype . It is also available for immediate download and adjustment. So, changes can be made in the color, design, graphics or any other component to create a unique layout.
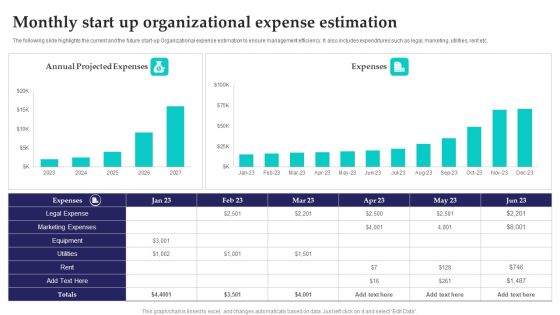
Monthly Start Up Organizational Expense Estimation Information PDF
The following slide highlights the current and the future start up Organizational expense estimation to ensure management efficiency. It also includes expenditures such as legal, marketing, utilities, rent etc. Pitch your topic with ease and precision using this Monthly Start Up Organizational Expense Estimation Information PDF. This layout presents information on Marketing Expenses, Equipment, Organizational. It is also available for immediate download and adjustment. So, changes can be made in the color, design, graphics or any other component to create a unique layout.
Project Tracking Dashboard With Multiple Metrics Pictures PDF
The following slide highlights the KPI of project management to avoid deviations. It includes elements such as schedule, tasks, issue assessment, budget and risk analysis etc. Pitch your topic with ease and precision using this Project Tracking Dashboard With Multiple Metrics Pictures PDF. This layout presents information on Projected Budget Analysis, Risk Analysis, Quality Affirmation. It is also available for immediate download and adjustment. So, changes can be made in the color, design, graphics or any other component to create a unique layout.

Quarterly Information Dashboard For Website Performance Portrait PDF
This slide displays KPI dashboard to analyze website performance and overall experience of online customers. It includes details about loading speed, internal links, views and average time. Pitch your topic with ease and precision using this Quarterly Information Dashboard For Website Performance Portrait PDF. This layout presents information on Quarterly Information, Dashboard For Website Performance. It is also available for immediate download and adjustment. So, changes can be made in the color, design, graphics or any other component to create a unique layout.

Annual Sales Growth Trend Of The Product Summary PDF
The slide shows an increasing trend year-on-year in the sales of the product. It include the sales from 2011 to 2021 with key takeaways.Pitch your topic with ease and precision using this Annual Sales Growth Trend Of The Product Summary PDF. This layout presents information on Increase Sales, Company Growing, Rise Population. It is also available for immediate download and adjustment. So, changes can be made in the color, design, graphics or any other component to create a unique layout.
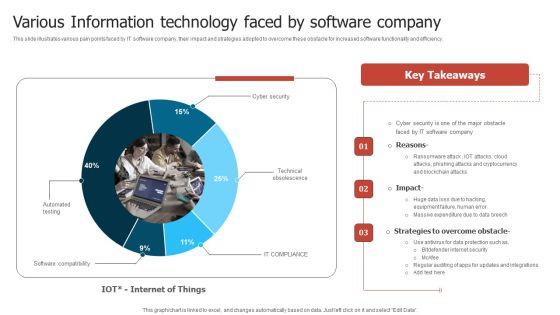
Various Information Technology Faced By Software Company Slides PDF
This slide illustrates various pain points faced by IT software company, their impact and strategies adopted to overcome these obstacle for increased software functionality and efficiency. Pitch your topic with ease and precision using this Various Information Technology Faced By Software Company Slides PDF. This layout presents information on Software Company, Phishing Attacks, Massive Expenditure. It is also available for immediate download and adjustment. So, changes can be made in the color, design, graphics or any other component to create a unique layout.

B2b Marketing Communication Strategies Survey Introduction PDF
The slide displays survey of various advertising strategies used by B2B marketers to communicate brand message. Various strategies included are seminars, e-book advertising, trade shows, paid advertisements, whitepapers, etc.Pitch your topic with ease and precision using this B2b Marketing Communication Strategies Survey Introduction PDF. This layout presents information on Increasing Customer, Engagement Activities, Adversting Strategies. It is also available for immediate download and adjustment. So, changes can be made in the color, design, graphics or any other component to create a unique layout.

Dashboard Depicting Procurement Cost Summary Report Microsoft PDF
This slide represents the procurement cost summary dashboard illustrating purchase order, cost reduction, savings, avoidance, return on investment, suppliers, procurement ROI etc. Pitch your topic with ease and precision using this Dashboard Depicting Procurement Cost Summary Report Microsoft PDF. This layout presents information on Purchase Order Cost, Cost Reduction, Cost Savings. It is also available for immediate download and adjustment. So, changes can be made in the color, design, graphics or any other component to create a unique layout.

Change Requests Management And Management Dashboard Clipart PDF
This slide illustrates facts and figures related to managing change requests. It includes request statistics, latest change requests, status by assignee, status by priority, etc. Pitch your topic with ease and precision using this Change Requests Management And Management Dashboard Clipart PDF. This layout presents information on Status By Assignee, Status By Priority, Request Statistics. It is also available for immediate download and adjustment. So, changes can be made in the color, design, graphics or any other component to create a unique layout.
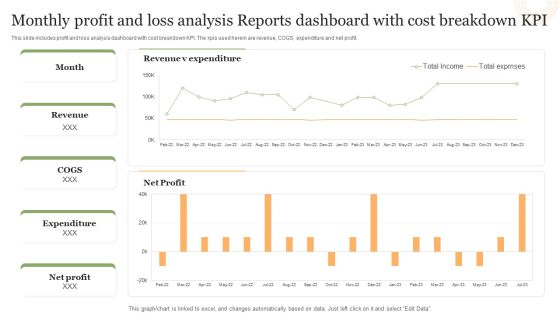
Monthly Profit And Loss Analysis Reports Dashboard With Cost Breakdown Kpi Structure PDF
This slide includes profit and loss analysis dashboard with cost breakdown KPI. The kpis used herein are revenue, COGS, expenditure and net profit.Pitch your topic with ease and precision using this Monthly Profit And Loss Analysis Reports Dashboard With Cost Breakdown Kpi Structure PDF. This layout presents information on Revenue Expenditure, Net Profit, Total Exprnses. It is also available for immediate download and adjustment. So, changes can be made in the color, design, graphics or any other component to create a unique layout.

 Home
Home