Comparison Bar Graph

Real Estate Asset Management Property Valuation Approaches Ppt Layouts Objects PDF
Presenting real estate asset management property valuation approaches ppt layouts objects pdf to provide visual cues and insights. Share and navigate important information on three stages that need your due attention. This template can be used to pitch topics like market comparison approach, cost approach, income approach. In addtion, this PPT design contains high resolution images, graphics, etc, that are easily editable and available for immediate download.

Industry Analysis Of Real Estate And Construction Sector Property Valuation Approaches Brochure PDF
Presenting industry analysis of real estate and construction sector property valuation approaches brochure pdf to provide visual cues and insights. Share and navigate important information on three stages that need your due attention. This template can be used to pitch topics like market comparison approach, cost approach, income approach. In addtion, this PPT design contains high resolution images, graphics, etc, that are easily editable and available for immediate download.

United States Real Estate Industry Property Valuation Approaches Ppt Infographics Styles PDF
Presenting united states real estate industry property valuation approaches ppt infographics styles pdf to provide visual cues and insights. Share and navigate important information on three stages that need your due attention. This template can be used to pitch topics like market comparison approach, cost approach, income approach. In addtion, this PPT design contains high resolution images, graphics, etc, that are easily editable and available for immediate download.

Commercial Property Administration And Advancement Property Valuation Approaches Rules PDF
Presenting commercial property administration and advancement property valuation approaches rules pdf to provide visual cues and insights. Share and navigate important information on three stages that need your due attention. This template can be used to pitch topics like market comparison approach, cost approach, income approach. In addtion, this PPT design contains high resolution images, graphics, etc, that are easily editable and available for immediate download.

Online Application Development Process Portrait PDF
The following slide showcases comparison between interface of two mobile applications. It further includes user base, development cost, learning curve, development environment, support, app discovery, revenue potential and lead platform.Presenting Online Application Development Process Portrait PDF to dispense important information. This template comprises six stages. It also presents valuable insights into the topics including Analysis Planning, Development And Support, Understandable Educational. This is a completely customizable PowerPoint theme that can be put to use immediately. So, download it and address the topic impactfully.

Two Factors Analysis Layout For Marketing Strategies Ppt PowerPoint Presentation Infographics Grid PDF
Persuade your audience using this two factors analysis layout for marketing strategies ppt powerpoint presentation infographics grid pdf. This PPT design covers two stages, thus making it a great tool to use. It also caters to a variety of topics including comparison of marketing strategies, service strategy, product strategy. Download this PPT design now to present a convincing pitch that not only emphasizes the topic but also showcases your presentation skills.

IT Infrastructure Management Which Tool Our Company Will Choose Formats PDF
This slide shows the comparison chart of all the monitoring tools available in the market along with their features, cost and services offered. And which tool our company will choose is selected in this template.Deliver an awe inspiring pitch with this creative IT Infrastructure Management Which Tool Our Company Will Choose Formats PDF bundle. Topics like Functionality, Maintenance Cost, Organization can be discussed with this completely editable template. It is available for immediate download depending on the needs and requirements of the user.

Comparative Analysis Of Managing Structured And Agile Hybrid Business Project Structure PDF
This slide illustrates comparison chart for structured and agile project management. It includes cost-effective, applicable for remote working, sequential, faster process etc. Presenting Comparative Analysis Of Managing Structured And Agile Hybrid Business Project Structure PDF to dispense important information. This template comprises one stages. It also presents valuable insights into the topics including Approaches, Structured, Comments. This is a completely customizable PowerPoint theme that can be put to use immediately. So, download it and address the topic impactfully.

Daily Sales Capability And Forecast Report Introduction PDF
This slide illustrates forecasting report and comparison chart for companys daily sales. It includes week wise price per unit and daily sold units. Pitch your topic with ease and precision using this Daily Sales Capability And Forecast Report Introduction PDF. This layout presents information on Daily Sales Capability, Forecast Report. It is also available for immediate download and adjustment. So, changes can be made in the color, design, graphics or any other component to create a unique layout.
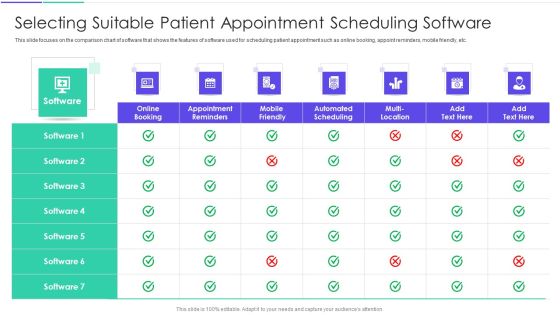
Medical Inventory Management System Selecting Suitable Patient Appointment Scheduling Software Brochure PDF
This slide focuses on the comparison chart of software that shows the features of software used for scheduling patient appointment such as online booking, appoint reminders, mobile friendly, etc.Deliver an awe inspiring pitch with this creative medical inventory management system selecting suitable patient appointment scheduling software brochure pdf bundle. Topics like selecting suitable patient appointment scheduling software can be discussed with this completely editable template. It is available for immediate download depending on the needs and requirements of the user.
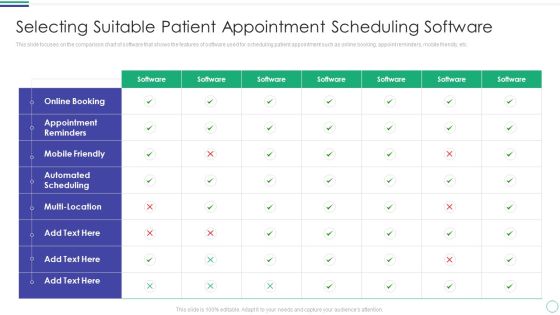
Selecting Suitable Patient Appointment Scheduling Software Introduction PDF
This slide focuses on the comparison chart of software that shows the features of software used for scheduling patient appointment such as online booking, appoint reminders, mobile friendly, etc.Deliver and pitch your topic in the best possible manner with this Selecting Suitable Patient Appointment Scheduling Software Introduction PDF Use them to share invaluable insights on Appointment Reminders, Automated Scheduling, Mobile Friendly and impress your audience. This template can be altered and modified as per your expectations. So, grab it now.

Advances In Healthcare Management System Selecting Suitable Patient Appointment Scheduling Software Portrait PDF
This slide focuses on the comparison chart of software that shows the features of software used for scheduling patient appointment such as online booking, appoint reminders, mobile friendly, etc. Deliver an awe inspiring pitch with this creative Advances In Healthcare Management System Selecting Suitable Patient Appointment Scheduling Software Portrait PDF bundle. Topics like Appointment Reminders, Automated Scheduling, Multi Location can be discussed with this completely editable template. It is available for immediate download depending on the needs and requirements of the user.

Implementing Integrated Software Selecting Suitable Patient Appointment Scheduling Software Formats PDF
This slide focuses on the comparison chart of software that shows the features of software used for scheduling patient appointment such as online booking, appoint reminders, mobile friendly, etc.Deliver and pitch your topic in the best possible manner with this Implementing Integrated Software Selecting Suitable Patient Appointment Scheduling Software Formats PDF. Use them to share invaluable insights on Appointment Reminders, Automated Scheduling, Online Booking and impress your audience. This template can be altered and modified as per your expectations. So, grab it now.
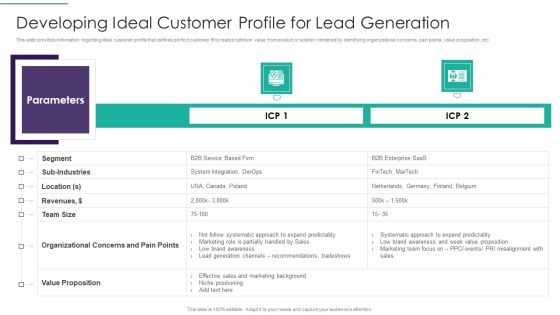
Sales Techniques Playbook Developing Ideal Customer Profile For Lead Generation Topics PDF
This slide provides information regarding ideal customer profile that defines perfect customer fit to realize optimum value from product or solution rendered by identifying organizational concerns, pain points, value proposition, etc. Deliver an awe inspiring pitch with this creative sales techniques playbook developing ideal customer profile for lead generation topics pdf bundle. Topics like different products price comparison chart can be discussed with this completely editable template. It is available for immediate download depending on the needs and requirements of the user.
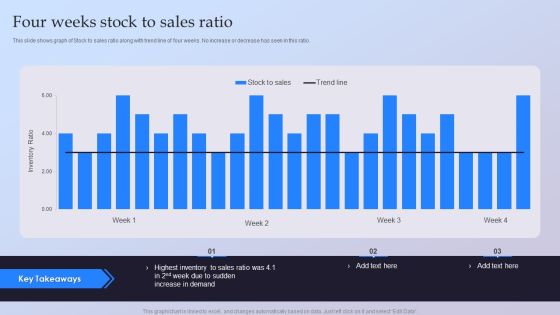
Four Weeks Stock To Sales Ratio Ppt Ideas Guide PDF
This slide shows graph of Stock to sales ratio along with trend line of four weeks. No increase or decrease has seen in this ratio. Pitch your topic with ease and precision using this Four Weeks Stock To Sales Ratio Ppt Ideas Guide PDF. This layout presents information on Highest Inventory, Sales Ratio, Increase Demand. It is also available for immediate download and adjustment. So, changes can be made in the color, design, graphics or any other component to create a unique layout.

Yearly Staff Engagement Trend Statistics Demonstration PDF
This slide represents the line graph for analyzing employee engagement trend . It includes the statistics such as percentage of engaged and actively disengaged employees. Pitch your topic with ease and precision using this Yearly Staff Engagement Trend Statistics Demonstration PDF. This layout presents information on Team, Employees, Average. It is also available for immediate download and adjustment. So, changes can be made in the color, design, graphics or any other component to create a unique layout.
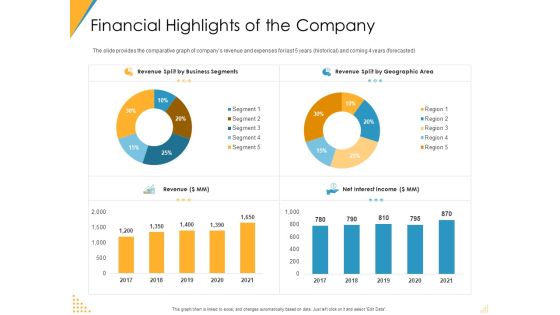
Investor Pitch Deck Post Market Financing Financial Highlights Of The Company Demonstration PDF
The slide provides the comparative graph of companys revenue and expenses for last 5 years historical and coming 4 years forecasted. Deliver an awe-inspiring pitch with this creative investor pitch deck post market financing financial highlights of the company demonstration pdf bundle. Topics like revenue, revenue split by business segments, revenue split by geographic area, net interest income can be discussed with this completely editable template. It is available for immediate download depending on the needs and requirements of the user.

Assessing Debt And Equity Fundraising Alternatives For Business Growth Assessing Debt And Survival Rate Of Startups Background PDF
This slide showcases graphs that can help organization to evaluate the survival rate of startups that raised capital through angel investors. It showcases graph of startup survival rates and survival rate of business by industry. This Assessing Debt And Equity Fundraising Alternatives For Business Growth Assessing Debt And Survival Rate Of Startups Background PDF from Slidegeeks makes it easy to present information on your topic with precision. It provides customization options, so you can make changes to the colors, design, graphics, or any other component to create a unique layout. It is also available for immediate download, so you can begin using it right away. Slidegeeks has done good research to ensure that you have everything you need to make your presentation stand out. Make a name out there for a brilliant performance.
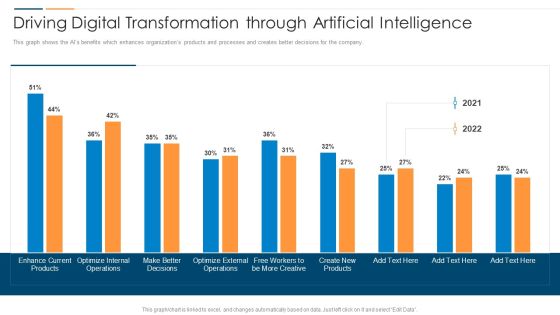
Revolution In Online Business Driving Digital Transformation Through Artificial Intelligence Template PDF
This graph shows the AIs benefits which enhances organizations products and processes and creates better decisions for the company. Deliver and pitch your topic in the best possible manner with this Revolution In Online Business Driving Digital Transformation Through Artificial Intelligence Template PDF. Use them to share invaluable insights on Enhance Current Products, Optimize Internal Operations, Make Better Decisions and impress your audience. This template can be altered and modified as per your expectations. So, grab it now.
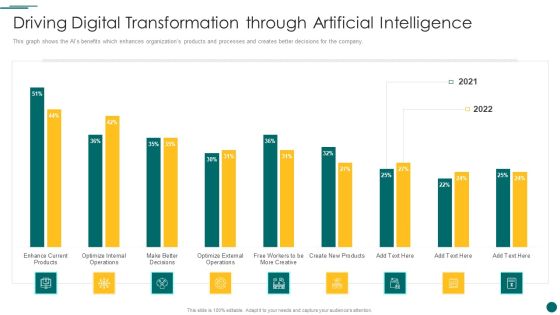
Organization Reinvention Driving Digital Transformation Through Artificial Intelligence Rules PDF
This graph shows the AIs benefits which enhances organizations products and processes and creates better decisions for the company. Deliver and pitch your topic in the best possible manner with this Organization Reinvention Driving Digital Transformation Through Artificial Intelligence Rules PDF. Use them to share invaluable insights on Enhance Current Products, Optimize External Operations, Create New Products and impress your audience. This template can be altered and modified as per your expectations. So, grab it now.

Accelerate Online Journey Now Driving Digital Transformation Through Artificial Intelligence Brochure PDF
This graph shows the AIs benefits which enhances organizations products and processes and creates better decisions for the company.Deliver and pitch your topic in the best possible manner with this Accelerate Online Journey Now Driving Digital Transformation Through Artificial Intelligence Brochure PDF Use them to share invaluable insights on Enhance Current, Products Internal, Operations, External and impress your audience. This template can be altered and modified as per your expectations. So, grab it now.
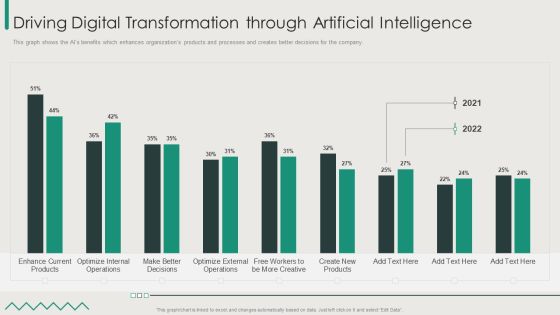
Organization Transition Driving Digital Transformation Through Artificial Intelligence Microsoft PDF
This graph shows the AIs benefits which enhances organizations products and processes and creates better decisions for the company. Deliver an awe inspiring pitch with this creative Organization Transition Driving Digital Transformation Through Artificial Intelligence Microsoft PDF bundle. Topics like Enhance Current Products, Optimize Internal Operations, 2021 To 2022 can be discussed with this completely editable template. It is available for immediate download depending on the needs and requirements of the user.
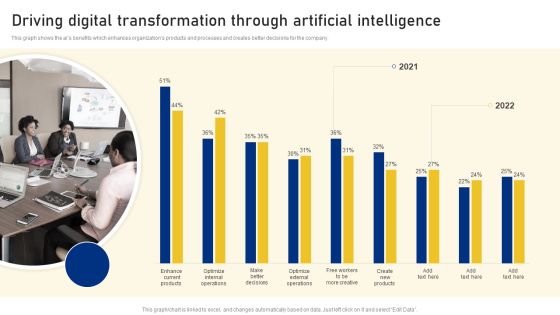
Reshaping Business In Digital Driving Digital Transformation Through Artificial Intelligence Structure PDF
This graph shows the ais benefits which enhances organizations products and processes and creates better decisions for the company. Deliver an awe inspiring pitch with this creative Reshaping Business In Digital Driving Digital Transformation Through Artificial Intelligence Structure PDF bundle. Topics like Enhance Current Products, Optimize Internal Operations, Make Better Decisions can be discussed with this completely editable template. It is available for immediate download depending on the needs and requirements of the user.

Comprehensive Business Digitization Deck Driving Digital Transformation Through Artificial Intelligence Diagrams PDF
This graph shows the AIs benefits which enhances organizations products and processes and creates better decisions for the company. Deliver and pitch your topic in the best possible manner with this comprehensive business digitization deck driving digital transformation through artificial intelligence diagrams pdf. Use them to share invaluable insights on driving digital transformation through artificial intelligence and impress your audience. This template can be altered and modified as per your expectations. So, grab it now.

Integration Of Digital Technology In Organization Driving Digital Transformation Through Artificial Intelligence Designs PDF
This graph shows the AIs benefits which enhances organizations products and processes and creates better decisions for the company.Deliver an awe inspiring pitch with this creative Integration Of Digital Technology In Organization Driving Digital Transformation Through Artificial Intelligence Designs PDF bundle. Topics like Enhance Current, Optimize Internal, External Operations can be discussed with this completely editable template. It is available for immediate download depending on the needs and requirements of the user.
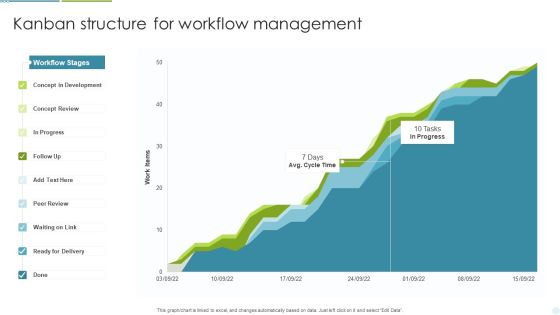
Kanban Structure For Workflow Management Ppt Inspiration Template PDF
This graph or chart is linked to excel, and changes automatically based on data. Just left click on it and select Edit Data. Pitch your topic with ease and precision using this Kanban Structure For Workflow Management Ppt Inspiration Template PDF. This layout presents information on Concept Development, Concept Review, Ready For Delivery. It is also available for immediate download and adjustment. So, changes can be made in the color, design, graphics or any other component to create a unique layout.
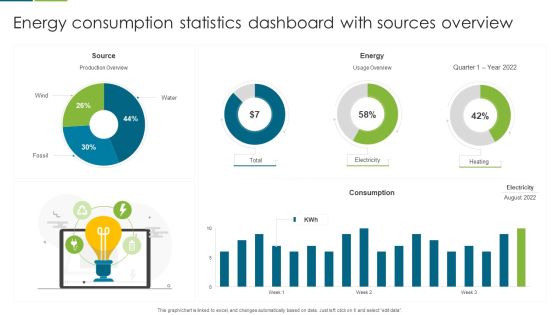
Energy Consumption Statistics Dashboard With Sources Overview Template PDF
This graph or chart is linked to excel, and changes automatically based on data. Just left click on it and select edit data. Pitch your topic with ease and precision using this Energy Consumption Statistics Dashboard With Sources Overview Template PDF. This layout presents information on Source, Energy, Consumption. It is also available for immediate download and adjustment. So, changes can be made in the color, design, graphics or any other component to create a unique layout.

Product Performance Highlights With Key Growth Drivers Ppt Pictures Design Templates PDF
This graph or chart is linked to excel, and changes automatically based on data. Just left click on it and select Edit Data. Pitch your topic with ease and precision using this Product Performance Highlights With Key Growth Drivers Ppt Pictures Design Templates PDF. This layout presents information on Product Performance, Key Growth, Projected Growth. It is also available for immediate download and adjustment. So, changes can be made in the color, design, graphics or any other component to create a unique layout.

Client Helpline Dashboard With Product Customer Satisfaction Ppt Slides Graphics Template PDF
This graph or chart is linked to excel, and changes automatically based on data. Just left click on it and select Edit Data. Pitch your topic with ease and precision using this Client Helpline Dashboard With Product Customer Satisfaction Ppt Slides Graphics Template PDF. This layout presents information on Customer Satisfaction, Product, Compare. It is also available for immediate download and adjustment. So, changes can be made in the color, design, graphics or any other component to create a unique layout.

Human Capital Metrics With Absenteeism Rate Ppt Infographic Template Ideas PDF
This graph or chart is linked to excel, and changes automatically based on data. Just left click on it and select Edit Data. Pitch your topic with ease and precision using this Human Capital Metrics With Absenteeism Rate Ppt Infographic Template Ideas PDF. This layout presents information on Overall Labor Effectiveness, OLE Department, Absenteeism. It is also available for immediate download and adjustment. So, changes can be made in the color, design, graphics or any other component to create a unique layout.
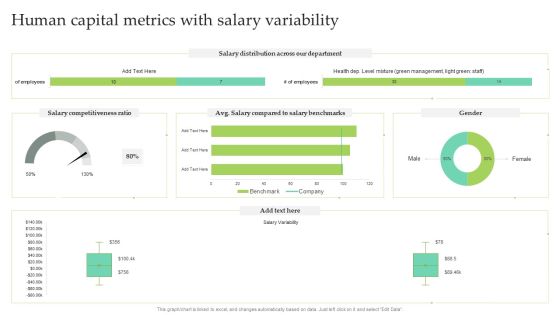
Human Capital Metrics With Salary Variability Ppt Infographic Template Designs PDF
This graph or chart is linked to excel, and changes automatically based on data. Just left click on it and select Edit Data. Pitch your topic with ease and precision using this Human Capital Metrics With Salary Variability Ppt Infographic Template Designs PDF. This layout presents information on Salary Distribution, Salary Competitiveness Ratio, Male. It is also available for immediate download and adjustment. So, changes can be made in the color, design, graphics or any other component to create a unique layout.
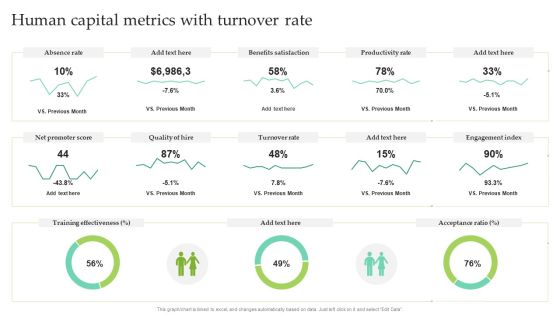
Human Capital Metrics With Turnover Rate Ppt Pictures Outline PDF
This graph or chart is linked to excel, and changes automatically based on data. Just left click on it and select Edit Data. Pitch your topic with ease and precision using this Human Capital Metrics With Turnover Rate Ppt Pictures Outline PDF. This layout presents information on Absence Rate, Benefits Satisfaction, Productivity Rate. It is also available for immediate download and adjustment. So, changes can be made in the color, design, graphics or any other component to create a unique layout.
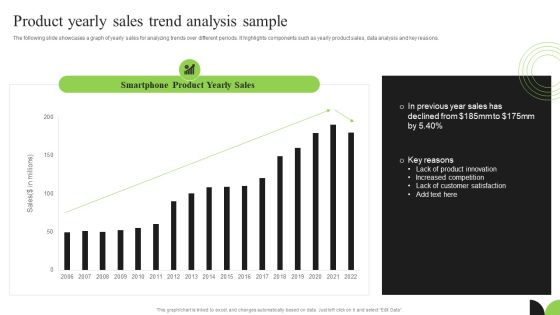
Guidebook For Executing Business Market Intelligence Product Yearly Sales Trend Analysis Sample Pictures PDF
The following slide showcases a graph of yearly sales for analyzing trends over different periods. It highlights components such as yearly product sales, data analysis and key reasons. There are so many reasons you need a Guidebook For Executing Business Market Intelligence Product Yearly Sales Trend Analysis Sample Pictures PDF. The first reason is you can not spend time making everything from scratch, Thus, Slidegeeks has made presentation templates for you too. You can easily download these templates from our website easily.

Cost Analysis For Fixing Software Glitch Inspiration PDF
This graph depicts cost to fix bugs based on different time period. It include various stages such as requirements, coding, component testing, system testing and production. Showcasing this set of slides titled Cost Analysis For Fixing Software Glitch Inspiration PDF. The topics addressed in these templates are Increase Complexity, Remembering Codes, Lack Availability Service . All the content presented in this PPT design is completely editable. Download it and make adjustments in color, background, font etc. as per your unique business setting.
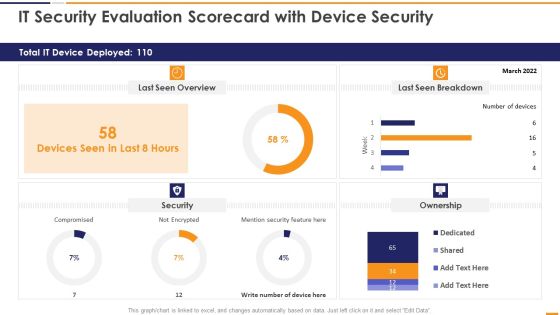
IT Security Evaluation Scorecard With Device Security Ppt Slides Good PDF
This graph or chart is linked to excel, and changes automatically based on data. Just left click on it and select Edit Data. Deliver an awe inspiring pitch with this creative IT Security Evaluation Scorecard With Device Security Ppt Slides Good PDF bundle. Topics like Total IT Device, Last Seen Overview, Last Seen Breakdown, Mention Security Feature can be discussed with this completely editable template. It is available for immediate download depending on the needs and requirements of the user.

Lime Investor Fundraising Elevator Limebike Service To Seattles Columbia City Ppt Inspiration Grid PDF
Following slide highlights the service comparison of lime bike with pronto bike to Seattles Columbia city through a graph. This is a lime investor fundraising elevator limebike service to seattles columbia city ppt inspiration grid pdf template with various stages. Focus and dispense information on three stages using this creative set, that comes with editable features. It contains large content boxes to add your information on topics like mountlake terrace, current, limebike coverage, pronto bike program coverage, store line. You can also showcase facts, figures, and other relevant content using this PPT layout. Grab it now.

Financial Software System Implementation Consideration Digital Transformation Toolkit Accounting Finance Pictures PDF
This slide shows the graph of financial software system implementation based on three parameters before utilizing it in our system which are- cost, usability and features. Deliver and pitch your topic in the best possible manner with this financial software system implementation consideration digital transformation toolkit accounting finance pictures pdf. Use them to share invaluable insights on financial software system implementation consideration and impress your audience. This template can be altered and modified as per your expectations. So, grab it now.

Hiring Agency Profile With Financial Charts Ppt Model Example PDF
This graph or chart is linked to excel, and changes automatically based on data. Just left click on it and select edit data. Pitch your topic with ease and precision using this hiring agency profile with financial charts ppt model example pdf. This layout presents information on revenue, operating income, operating margin, satisfaction rate. It is also available for immediate download and adjustment. So, changes can be made in the color, design, graphics or any other component to create a unique layout.

Chart Illustrating Manufacturing Plant Energy Consumption Statistics Slides PDF
This graph or chart is linked to excel, and changes automatically based on data. Just left click on it and select edit data. Pitch your topic with ease and precision using this Chart Illustrating Manufacturing Plant Energy Consumption Statistics Slides PDF. This layout presents information on Equipment Inefficiency, Process Heating, Energy Export. It is also available for immediate download and adjustment. So, changes can be made in the color, design, graphics or any other component to create a unique layout.
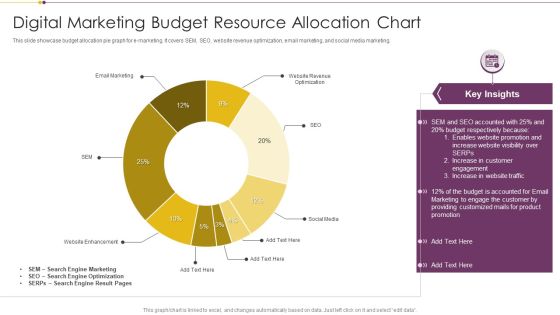
Digital Marketing Budget Resource Allocation Chart Download PDF
This slide showcase budget allocation pie graph for e marketing. It covers SEM, SEO, website revenue optimization, email marketing, and social media marketing. Pitch your topic with ease and precision using this Digital Marketing Budget Resource Allocation Chart Download PDF. This layout presents information on Search Engine Marketing, Search Engine Optimization, Budget. It is also available for immediate download and adjustment. So, changes can be made in the color, design, graphics or any other component to create a unique layout.

Chart Illustrating Consumer Journey With Lifetime Value Ppt PowerPoint Presentation File Background Images PDF
The following slide illustrates the graph of customer lifecycle value and customer lifetime with monthly data. Pitch your topic with ease and precision using this chart illustrating consumer journey with lifetime value ppt powerpoint presentation file background images pdf. This layout presents information on chart illustrating consumer journey with lifetime value. It is also available for immediate download and adjustment. So, changes can be made in the color, design, graphics or any other component to create a unique layout.

Product Market Share Chart Of Electronic Company Ppt Gallery Graphic Tips PDF
This slide shows the percentage of market share graph of electronic company products. It includes mobile phone, laptop, tablet, computer and others devices. Pitch your topic with ease and precision using this Product Market Share Chart Of Electronic Company Ppt Gallery Graphic Tips PDF. This layout presents information on Mobile Phone, Computer, Laptop, Tablet. It is also available for immediate download and adjustment. So, changes can be made in the color, design, graphics or any other component to create a unique layout.
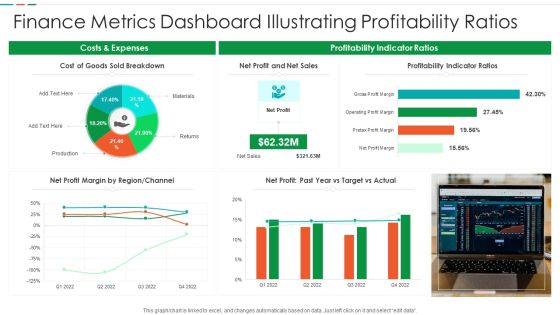
Finance Metrics Dashboard Illustrating Profitability Ratios Diagrams PDF
This graph or chart is linked to excel, and changes automatically based on data. Just left click on it and select edit data. Pitch your topic with ease and precision using this Finance Metrics Dashboard Illustrating Profitability Ratios Diagrams PDF. This layout presents information on Cost Goods Sold, Net Profit Net, Sales Profitability Indicator. It is also available for immediate download and adjustment. So, changes can be made in the color, design, graphics or any other component to create a unique layout.

Finance Metrics Dashboard Indicating Portfolio Performance Microsoft PDF
This graph or chart is linked to excel, and changes automatically based on data. Just left click on it and select edit data. Pitch your topic with ease and precision using this Finance Metrics Dashboard Indicating Portfolio Performance Microsoft PDF. This layout presents information on Portfolio Performance Portfolio, Asset Management Manager, Top 10 Assets. It is also available for immediate download and adjustment. So, changes can be made in the color, design, graphics or any other component to create a unique layout.

Finance Metrics Dashboard Indicating Short Term Assets Download PDF
This graph or chart is linked to excel, and changes automatically based on data. Just left click on it and select edit data. Pitch your topic with ease and precision using this Finance Metrics Dashboard Indicating Short Term Assets Download PDF. This layout presents information on Short Term Assets, Global Financial Performance, Revenue YTD 2022. It is also available for immediate download and adjustment. So, changes can be made in the color, design, graphics or any other component to create a unique layout.
Cash Performance Highlights With Turnover Rate Ppt Ideas Icon PDF
This graph or chart is linked to excel, and changes automatically based on data. Just left click on it and select Edit Data. Pitch your topic with ease and precision using this Cash Performance Highlights With Turnover Rate Ppt Ideas Icon PDF. This layout presents information on Working Capital, Cash Balance, Current Ratio. It is also available for immediate download and adjustment. So, changes can be made in the color, design, graphics or any other component to create a unique layout.

Financial Performance Highlights With Net Profit Margin Ppt Model Ideas PDF
This graph or chart is linked to excel, and changes automatically based on data. Just left click on it and select Edit Data. Pitch your topic with ease and precision using this Financial Performance Highlights With Net Profit Margin Ppt Model Ideas PDF. This layout presents information on Net Profit, Accounts Receivable, Accounts Payable. It is also available for immediate download and adjustment. So, changes can be made in the color, design, graphics or any other component to create a unique layout.

Weekly Sales Performance Highlights With Product Share Ppt File Information PDF
This graph or chart is linked to excel, and changes automatically based on data. Just left click on it and select Edit Data. Pitch your topic with ease and precision using this Weekly Sales Performance Highlights With Product Share Ppt File Information PDF. This layout presents information on Dashboard Summary, Weekly Sale, Product Share. It is also available for immediate download and adjustment. So, changes can be made in the color, design, graphics or any other component to create a unique layout.

Client Helpline Dashboard Performance Key Metrics Ppt Outline Deck PDF
This graph or chart is linked to excel, and changes automatically based on data. Just left click on it and select Edit Data. Pitch your topic with ease and precision using this Client Helpline Dashboard Performance Key Metrics Ppt Outline Deck PDF. This layout presents information on Key Metrics, Trend, Compare. It is also available for immediate download and adjustment. So, changes can be made in the color, design, graphics or any other component to create a unique layout.

Client Helpline Dashboard With Ticket Resolution Ppt Model Graphics Design PDF
This graph or chart is linked to excel, and changes automatically based on data. Just left click on it and select Edit Data. Pitch your topic with ease and precision using this Client Helpline Dashboard With Ticket Resolution Ppt Model Graphics Design PDF. This layout presents information on Ticket Due Times, Sourcewise Tickets, Open Tickets. It is also available for immediate download and adjustment. So, changes can be made in the color, design, graphics or any other component to create a unique layout.
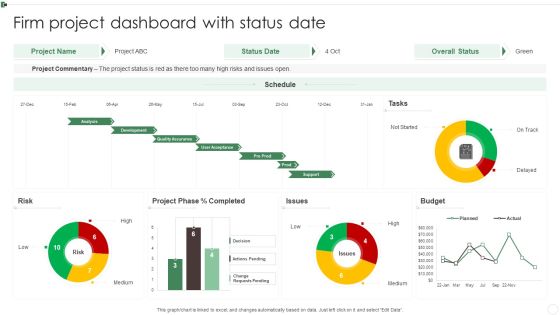
Firm Project Dashboard With Status Date Ppt Infographics Slides PDF
This graph or chart is linked to excel, and changes automatically based on data. Just left click on it and select Edit Data. Pitch your topic with ease and precision using this Firm Project Dashboard With Status Date Ppt Infographics Slides PDF. This layout presents information on Project Commentary, Budget, Project Phase, Risk. It is also available for immediate download and adjustment. So, changes can be made in the color, design, graphics or any other component to create a unique layout.
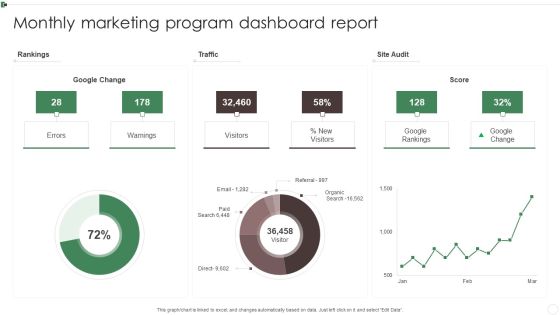
Monthly Marketing Program Dashboard Report Ppt Inspiration Information PDF
This graph or chart is linked to excel, and changes automatically based on data. Just left click on it and select Edit Data. Pitch your topic with ease and precision using this Monthly Marketing Program Dashboard Report Ppt Inspiration Information PDF. This layout presents information on Rankings, Traffic, Site Audit, Warnings. It is also available for immediate download and adjustment. So, changes can be made in the color, design, graphics or any other component to create a unique layout.
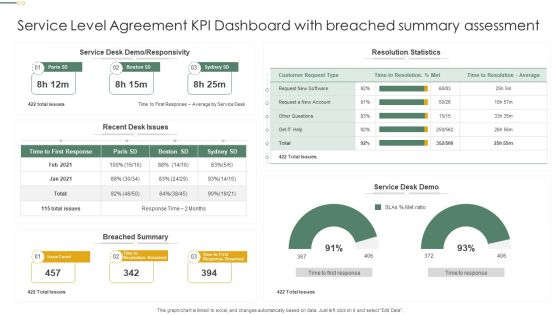
Service Level Agreement KPI Dashboard With Breached Summary Assessment Professional PDF
This graph or chart is linked to excel, and changes automatically based on data. Just left click on it and select Edit Data. Pitch your topic with ease and precision using this Service Level Agreement KPI Dashboard With Breached Summary Assessment Professional PDF. This layout presents information on Resolution Statistics, Service Desk Demo, Breached Summary. It is also available for immediate download and adjustment. So, changes can be made in the color, design, graphics or any other component to create a unique layout.
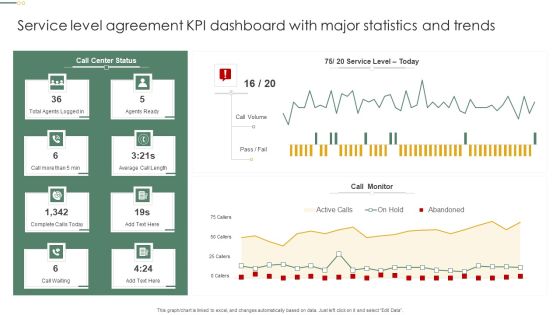
Service Level Agreement KPI Dashboard With Major Statistics And Trends Pictures PDF
This graph or chart is linked to excel, and changes automatically based on data. Just left click on it and select Edit Data. Pitch your topic with ease and precision using this Service Level Agreement KPI Dashboard With Major Statistics And Trends Pictures PDF. This layout presents information on Call Monitor, Call Volume, Agents Ready. It is also available for immediate download and adjustment. So, changes can be made in the color, design, graphics or any other component to create a unique layout.
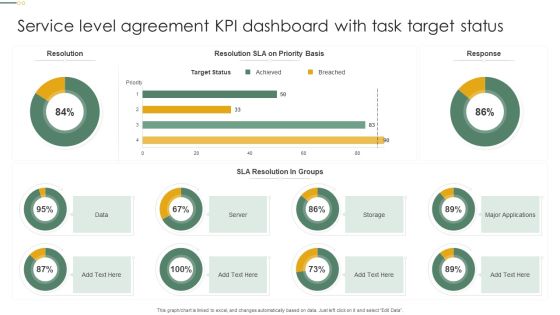
Service Level Agreement KPI Dashboard With Task Target Status Microsoft PDF
This graph or chart is linked to excel, and changes automatically based on data. Just left click on it and select Edit Data. Pitch your topic with ease and precision using this Service Level Agreement KPI Dashboard With Task Target Status Microsoft PDF. This layout presents information on Target Status, Sla Resolution, Groups, Server. It is also available for immediate download and adjustment. So, changes can be made in the color, design, graphics or any other component to create a unique layout.

Company Group Members Demographics Dashboard Overview Clipart PDF
This graph or chart is linked to excel, and changes automatically based on data. Just left click on it and select Edit Data. Pitch your topic with ease and precision using this Company Group Members Demographics Dashboard Overview Clipart PDF. This layout presents information on Headcount Office, Headcount Tenure Range, Headcount Age Range. It is also available for immediate download and adjustment. So, changes can be made in the color, design, graphics or any other component to create a unique layout.

Service SLA KPL Changes And Incidents Dashboard Ppt Inspiration Infographics PDF
This graph or chart is linked to excel, and changes automatically based on data. Just left click on it and select Edit Data. Pitch your topic with ease and precision using this Service SLA KPL Changes And Incidents Dashboard Ppt Inspiration Infographics PDF. This layout presents information on Time Spent Department, Incidents Closed, Operator Group. It is also available for immediate download and adjustment. So, changes can be made in the color, design, graphics or any other component to create a unique layout.
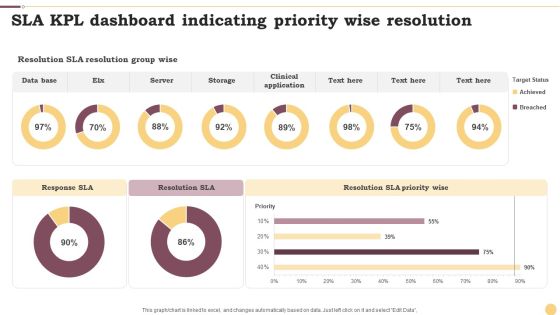
SLA KPL Dashboard Indicating Priority Wise Resolution Ppt Infographics Example File PDF
This graph or chart is linked to excel, and changes automatically based on data. Just left click on it and select Edit Data. Pitch your topic with ease and precision using this SLA KPL Dashboard Indicating Priority Wise Resolution Ppt Infographics Example File PDF. This layout presents information on Data Base, Server, Storage. It is also available for immediate download and adjustment. So, changes can be made in the color, design, graphics or any other component to create a unique layout.

SLA KPL Overview Dashboard Depicting Service Targets Ppt Slides Maker PDF
This graph or chart is linked to excel, and changes automatically based on data. Just left click on it and select Edit Data. Pitch your topic with ease and precision using this SLA KPL Overview Dashboard Depicting Service Targets Ppt Slides Maker PDF. This layout presents information on Monthly Trend, Service Target, Quarterly Trend. It is also available for immediate download and adjustment. So, changes can be made in the color, design, graphics or any other component to create a unique layout.

Kanban Structure For Product Quality Assurance Ppt Portfolio Deck PDF
This graph or chart is linked to excel, and changes automatically based on data. Just left click on it and select Edit Data. Pitch your topic with ease and precision using this Kanban Structure For Product Quality Assurance Ppt Portfolio Deck PDF. This layout presents information on Product Deployment, Quality Assurance, Product, Designing And Development. It is also available for immediate download and adjustment. So, changes can be made in the color, design, graphics or any other component to create a unique layout.

Kanban Structure To Manage Weekly Work Activities Ppt Professional Aids PDF
This graph or chart is linked to excel, and changes automatically based on data. Just left click on it and select Edit Data. Pitch your topic with ease and precision using this Kanban Structure To Manage Weekly Work Activities Ppt Professional Aids PDF. This layout presents information on Legend, Ready To Start, In Progress. It is also available for immediate download and adjustment. So, changes can be made in the color, design, graphics or any other component to create a unique layout.

Human Capital Metrics For New Hire Ppt Pictures Brochure PDF
This graph or chart is linked to excel, and changes automatically based on data. Just left click on it and select Edit Data. Pitch your topic with ease and precision using this Human Capital Metrics For New Hire Ppt Pictures Brochure PDF. This layout presents information on Active Employee Count, New Hire Count, New Hire. It is also available for immediate download and adjustment. So, changes can be made in the color, design, graphics or any other component to create a unique layout.

Organizational Workforce Re Training Program Survey Insights Themes PDF
This slide represents the graph representing the results of the survey conducted for gathering feedback of employees on reskilling program organized by the company. Pitch your topic with ease and precision using this Organizational Workforce Re Training Program Survey Insights Themes PDF. This layout presents information on Program Survey Insights, Workforce Re Training, Organizational. It is also available for immediate download and adjustment. So, changes can be made in the color, design, graphics or any other component to create a unique layout.
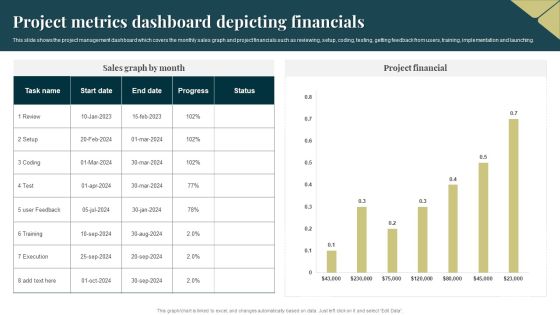
Project Metrics Dashboard Depicting Financials Pictures PDF
This slide shows the project management dashboard which covers the monthly sales graph and project financials such as reviewing, setup, coding, testing, getting feedback from users, training, implementation and launching. Pitch your topic with ease and precision using this Project Metrics Dashboard Depicting Financials Pictures PDF. This layout presents information on Execution, Project Financial. It is also available for immediate download and adjustment. So, changes can be made in the color, design, graphics or any other component to create a unique layout.
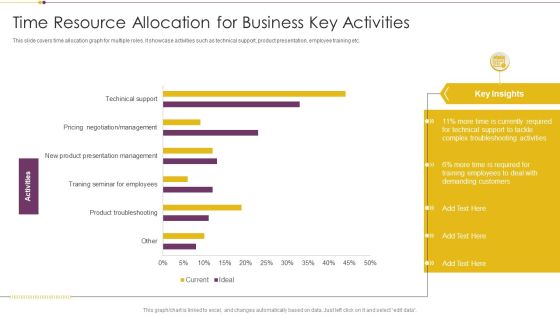
Time Resource Allocation For Business Key Activities Infographics PDF
This slide covers time allocation graph for multiple roles. It showcase activities such as technical support, product presentation, employee training etc. Pitch your topic with ease and precision using this Time Resource Allocation For Business Key Activities Infographics PDF. This layout presents information on Currently Required, Demanding Customers, Training Employees. It is also available for immediate download and adjustment. So, changes can be made in the color, design, graphics or any other component to create a unique layout.

Return On Equity Indicators To Measure Company Financial Performance Mockup PDF
This slide showcases a graph of return on equity that represents how well the firm can manage the capital invested by shareholders. Pitch your topic with ease and precision using this Return On Equity Indicators To Measure Company Financial Performance Mockup PDF. This layout presents information on Return On Equity, Key Insights, Positive Return. It is also available for immediate download and adjustment. So, changes can be made in the color, design, graphics or any other component to create a unique layout.
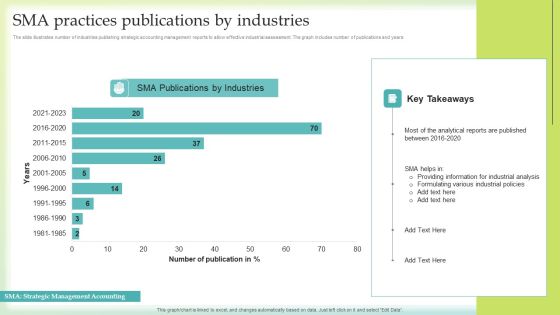
SMA Practices Publications By Industries Microsoft PDF
The slide illustrates number of industries publishing strategic accounting management reports to allow effective industrial assessment. The graph includes number of publications and years . Pitch your topic with ease and precision using this SMA Practices Publications By Industries Microsoft PDF. This layout presents information on Providing Information, Industrial Analysis, Publications Industries. It is also available for immediate download and adjustment. So, changes can be made in the color, design, graphics or any other component to create a unique layout.
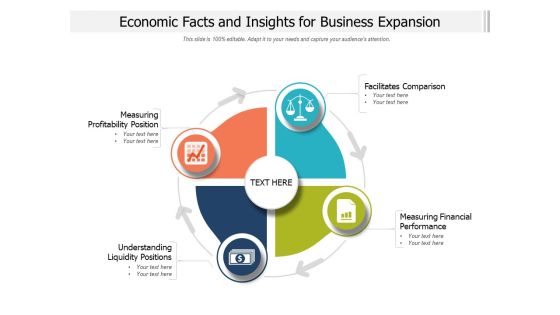
Economic Facts And Insights For Business Expansion Ppt PowerPoint Presentation Infographic Template Slide Portrait PDF
Pitch your topic with ease and precision using this economic facts and insights for business expansion ppt powerpoint presentation infographic template slide portrait pdf. This layout presents information on facilitates comparison, measuring financial performance, understanding liquidity positions, measuring profitability position. It is also available for immediate download and adjustment. So, changes can be made in the color, design, graphics or any other component to create a unique layout.

Techniques To Enhance Ecommerce Financial Management Procedure Ppt PowerPoint Presentation Complete With Slides
Our team of professional designers has created this Techniques To Enhance Ecommerce Financial Management Procedure Ppt PowerPoint Presentation Complete With Slides containing sixty five professional designs and ready content that is sure to impress your audience. Its features distinguish this presentation deck from the rest of the available in the market. It offers high quality PPT graphics with value adding images and interactive elements like bar graphs, pie charts, tables, diagrams, etc. You can easily insert your branding into these entirely customizable PowerPoint slides. With their user friendly editable design, these presentation templates are ideal for creating a last-minute yet professional presentation. Download this Techniques To Enhance Ecommerce Financial Management Procedure Ppt PowerPoint Presentation Complete With Slides for drafting dynamic and engaging designs and slides that will help you close more deals and win more business.

Product Development And Management Plan Ppt PowerPoint Presentation Complete Deck
Our team of professional designers has created this Product Development And Management Plan Ppt PowerPoint Presentation Complete Deck containing seventy two professional designs and ready content that is sure to impress your audience. Its features distinguish this presentation deck from the rest of the available in the market. It offers high-quality PPT graphics with value-adding images and interactive elements like bar graphs, pie charts, tables, diagrams, etc. You can easily insert your branding into these entirely customizable PowerPoint slides. With their user-friendly editable design, these presentation templates are ideal for creating a last-minute yet professional presentation. Download this Product Development And Management Plan Ppt PowerPoint Presentation Complete Deck for drafting dynamic and engaging designs and slides that will help you close more deals and win more business

Merchandise Launch Kickoff Playbook Ppt PowerPoint Presentation Complete Deck With Slides
Our team of professional designers has created this Merchandise Launch Kickoff Playbook Ppt PowerPoint Presentation Complete Deck With Slides containing sixty four professional designs and ready content that is sure to impress your audience. Its features distinguish this presentation deck from the rest of the available in the market. It offers high-quality PPT graphics with value-adding images and interactive elements like bar graphs, pie charts, tables, diagrams, etc. You can easily insert your branding into these entirely customizable PowerPoint slides. With their user-friendly editable design, these presentation templates are ideal for creating a last-minute yet professional presentation. Download this Merchandise Launch Kickoff Playbook Ppt PowerPoint Presentation Complete Deck With Slides for drafting dynamic and engaging designs and slides that will help you close more deals and win more business.

Effective BPM Tool For Business Process Management Ppt PowerPoint Presentation Complete Deck With Slides
Our team of professional designers has created this Effective BPM Tool For Business Process Management Ppt PowerPoint Presentation Complete Deck With Slides containing fifty one professional designs and ready content that is sure to impress your audience. Its features distinguish this presentation deck from the rest of the available in the market. It offers high-quality PPT graphics with value-adding images and interactive elements like bar graphs, pie charts, tables, diagrams, etc. You can easily insert your branding into these entirely customizable PowerPoint slides. With their user-friendly editable design, these presentation templates are ideal for creating a last-minute yet professional presentation. Download this Effective BPM Tool For Business Process Management Ppt PowerPoint Presentation Complete Deck With Slides for drafting dynamic and engaging designs and slides that will help you close more deals and win more business.

Analyzing Global Commissary Kitchen Industry Ppt PowerPoint Presentation Complete Deck With Slides
Our team of professional designers has created this Analyzing Global Commissary Kitchen Industry Ppt PowerPoint Presentation Complete Deck With Slides containing seventy seven professional designs and ready content that is sure to impress your audience. Its features distinguish this presentation deck from the rest of the available in the market. It offers high-quality PPT graphics with value-adding images and interactive elements like bar graphs, pie charts, tables, diagrams, etc. You can easily insert your branding into these entirely customizable PowerPoint slides. With their user-friendly editable design, these presentation templates are ideal for creating a last-minute yet professional presentation. Download this Analyzing Global Commissary Kitchen Industry Ppt PowerPoint Presentation Complete Deck With Slides for drafting dynamic and engaging designs and slides that will help you close more deals and win more business.

Promotion And Sales Techniques For New Service Introduction Ppt PowerPoint Presentation Complete Deck With Slides
Our team of professional designers has created this Promotion And Sales Techniques For New Service Introduction Ppt PowerPoint Presentation Complete Deck With Slides containing sixty nine professional designs and ready content that is sure to impress your audience. Its features distinguish this presentation deck from the rest of the available in the market. It offers high-quality PPT graphics with value adding images and interactive elements like bar graphs, pie charts, tables, diagrams, etc. You can easily insert your branding into these entirely customizable PowerPoint slides. With their user-friendly editable design, these presentation templates are ideal for creating a last-minute yet professional presentation. Download this Promotion And Sales Techniques For New Service Introduction Ppt PowerPoint Presentation Complete Deck With Slides for drafting dynamic and engaging designs and slides that will help you close more deals and win more business.

Guide To Online Marketing Collateral For Goods And Services Advertising Ppt PowerPoint Presentation Complete Deck With Slides
Our team of professional designers has created this Guide To Online Marketing Collateral For Goods And Services Advertising Ppt PowerPoint Presentation Complete Deck With Slides containing eighty four professional designs and ready content that is sure to impress your audience. Its features distinguish this presentation deck from the rest of the available in the market. It offers high quality PPT graphics with value adding images and interactive elements like bar graphs, pie charts, tables, diagrams, etc. You can easily insert your branding into these entirely customizable PowerPoint slides. With their user friendly editable design, these presentation templates are ideal for creating a last minute yet professional presentation. Download this Guide To Online Marketing Collateral For Goods And Services Advertising Ppt PowerPoint Presentation Complete Deck With Slides for drafting dynamic and engaging designs and slides that will help you close more deals and win more business.

Exploring Market Trends And Identifying Target Customers In The Coffee Industry Ppt PowerPoint Presentation Complete Deck With Slides
Our team of professional designers has created this Exploring Market Trends And Identifying Target Customers In The Coffee Industry Ppt PowerPoint Presentation Complete Deck With Slides containing thirteen professional designs and ready content that is sure to impress your audience. Its features distinguish this presentation deck from the rest of the available in the market. It offers high-quality PPT graphics with value-adding images and interactive elements like bar graphs, pie charts, tables, diagrams, etc. You can easily insert your branding into these entirely customizable PowerPoint slides. With their user-friendly editable design, these presentation templates are ideal for creating a last-minute yet professional presentation. Download this Exploring Market Trends And Identifying Target Customers In The Coffee Industry Ppt PowerPoint Presentation Complete Deck With Slides for drafting dynamic and engaging designs and slides that will help you close more deals and win more business.

Google Cloud Service Models Ppt PowerPoint Presentation Complete Deck With Slides
Our team of professional designers has created this Google Cloud Service Models Ppt PowerPoint Presentation Complete Deck With Slides containing nineteen professional designs and ready content that is sure to impress your audience. Its features distinguish this presentation deck from the rest of the available in the market. It offers high-quality PPT graphics with value-adding images and interactive elements like bar graphs, pie charts, tables, diagrams, etc. You can easily insert your branding into these entirely customizable PowerPoint slides. With their user-friendly editable design, these presentation templates are ideal for creating a last-minute yet professional presentation. Download this Google Cloud Service Models Ppt PowerPoint Presentation Complete Deck With Slides for drafting dynamic and engaging designs and slides that will help you close more deals and win more business.

FMEA To Determine Potential Dashboard Design Failure Mode And Effect Analysis DFMEA Ppt Show Styles PDF
This graph or chart is linked to excel, and changes automatically based on data. Just left click on it and select Edit Data. Deliver an awe inspiring pitch with this creative FMEA To Determine Potential Dashboard Design Failure Mode And Effect Analysis DFMEA Ppt Show Styles PDF bundle. Topics like Target Completion, Recommended Action, RPN Breakdown can be discussed with this completely editable template. It is available for immediate download depending on the needs and requirements of the user.

Post Initial Pubic Offering Market Pitch Deck Consolidated Income Statement Of The Company 2017 To 2021 Designs PDF
The slide provides the comparative graph of companys revenue and expenses for last 5 years historical and coming 4 years forecasted.Deliver an awe-inspiring pitch with this creative post initial pubic offering market pitch deck consolidated income statement of the company 2017 to 2021 designs pdf. bundle. Topics like interest income, total income, revenue, 2017 to 2021 can be discussed with this completely editable template. It is available for immediate download depending on the needs and requirements of the user.

5 Years Comparative Analysis Chart Of Companys Financial Position Ppt Layouts Structure PDF
This slide represents the table showing the five comparison of financial position of a company. It includes details related to income and profitability, cash flow and investments and financial position of the company. Showcasing this set of slides titled 5 Years Comparative Analysis Chart Of Companys Financial Position Ppt Layouts Structure PDF. The topics addressed in these templates are Income And Profitability, Financial Position, Balance Sheet Total. All the content presented in this PPT design is completely editable. Download it and make adjustments in color, background, font etc. as per your unique business setting.

5 Years Attrition Rate Comparative Analysis Chart Of IT Company Ppt Layouts Examples PDF
This slide represents the table showing the comparison between attrition rates and no. of employees of an IT company over the five years. It includes details related to attrition rates and no. of employees during different years. Showcasing this set of slides titled 5 Years Attrition Rate Comparative Analysis Chart Of IT Company Ppt Layouts Examples PDF. The topics addressed in these templates are Attrition Rate, No Employees, 2018 To 2022. All the content presented in this PPT design is completely editable. Download it and make adjustments in color, background, font etc. as per your unique business setting.

5 Years Comparative Analysis Chart Of Liquidity Ratios Of IT Companies Ppt Portfolio Visual Aids PDF
This slide represents the table showing comparison between current and quick ratios of two IT companies over five years. It includes details related to current and quick ratios for both companies for different years along with the average of their five years ratios. Pitch your topic with ease and precision using this 5 Years Comparative Analysis Chart Of Liquidity Ratios Of IT Companies Ppt Portfolio Visual Aids PDF. This layout presents information on Current Ratio, Average, 2018 To 2022. It is also available for immediate download and adjustment. So, changes can be made in the color, design, graphics or any other component to create a unique layout.

5 Years General Ledger Comparative Analysis Chart Report Ppt Model Slide PDF
This slide represents the report showing the comparison of the general ledger of five years of a company. It includes various assets such as cash, restricted bank, other payments, furnitures and fixtures etc. Showcasing this set of slides titled 5 Years General Ledger Comparative Analysis Chart Report Ppt Model Slide PDF. The topics addressed in these templates are Other Payment, Investments, Fixed Assets. All the content presented in this PPT design is completely editable. Download it and make adjustments in color, background, font etc. as per your unique business setting.

Steps To Conduct Competitor Analysis Compare And Contrast Framework For Competitive Sample PDF
This slide presents a compare and contrast chart for product or service comparison of own and competitors business. Its purpose is to gain quick overview of competitors offerings for product development. It showcases components such as own product contrast, competitors product contrast and similarities. The best PPT templates are a great way to save time, energy, and resources. Slidegeeks have 100 percent editable powerpoint slides making them incredibly versatile. With these quality presentation templates, you can create a captivating and memorable presentation by combining visually appealing slides and effectively communicating your message. Download Steps To Conduct Competitor Analysis Compare And Contrast Framework For Competitive Sample PDF from Slidegeeks and deliver a wonderful presentation.

5 Years Net Income Comparative Analysis Chart Of Financial Institute Ppt Show Designs PDF
This slide represents the comparison of net income of financial institute for different years. It includes details related to total revenue, gross profit, operating income and net income and ratios of the institute for different years. Showcasing this set of slides titled 5 Years Net Income Comparative Analysis Chart Of Financial Institute Ppt Show Designs PDF. The topics addressed in these templates are Income Statement, 2018 To 2022, Ratios. All the content presented in this PPT design is completely editable. Download it and make adjustments in color, background, font etc. as per your unique business setting.

5 Years Returns Comparative Analysis Chart Of Various Mutual Funds Ppt Slides Microsoft PDF
This slide covers the table representing the comparison of various mutual funds on the basis of five years return. It includes details related to names of funds, category, 1st, 3rd and 5 years returns. Showcasing this set of slides titled 5 Years Returns Comparative Analysis Chart Of Various Mutual Funds Ppt Slides Microsoft PDF. The topics addressed in these templates are Diversified Equity, Small And Midcap, Diversified Equity. All the content presented in this PPT design is completely editable. Download it and make adjustments in color, background, font etc. as per your unique business setting.
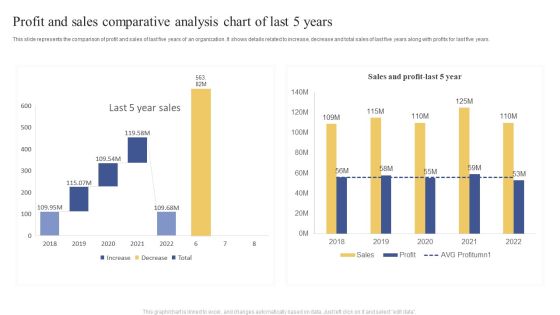
Profit And Sales Comparative Analysis Chart Of Last 5 Years Ppt Visual Aids Example 2015 PDF
This slide represents the comparison of profit and sales of last five years of an organization. It shows details related to increase, decrease and total sales of last five years along with profits for last five years. Showcasing this set of slides titled Profit And Sales Comparative Analysis Chart Of Last 5 Years Ppt Visual Aids Example 2015 PDF. The topics addressed in these templates are Last 5 Year, Sales, 2018 To 2022. All the content presented in this PPT design is completely editable. Download it and make adjustments in color, background, font etc. as per your unique business setting.

5 Years Comparative Analysis Chart Of Financial Performance In Investment Banking Sector Themes PDF
This slide shows the table representing the five years comparison between the financial performance of various banks of a country. It includes details related to financial positions of different banks in various years. Showcasing this set of slides titled 5 Years Comparative Analysis Chart Of Financial Performance In Investment Banking Sector Themes PDF. The topics addressed in these templates are Values Percentage, Bank, Year. All the content presented in this PPT design is completely editable. Download it and make adjustments in color, background, font etc. as per your unique business setting.

Five Years Comparative Analysis Chart Of Organizations Expenses And Savings Topics PDF
This slide represents the five years comparison of savings and expenses incurred by an organization during installation of software solutions. It includes details related to expenses with and without solutions, yearly and total savings. Showcasing this set of slides titled Five Years Comparative Analysis Chart Of Organizations Expenses And Savings Topics PDF. The topics addressed in these templates are Expenses Without Solution, Yearly Savings, Total Savings. All the content presented in this PPT design is completely editable. Download it and make adjustments in color, background, font etc. as per your unique business setting.

5 Years Price Comparative Analysis Chart Of Cloud Service Solutions Brochure PDF
This slide represents the table showing the five years comparison of prices incurred in installing cloud service solution in the organization. It includes details related to on-premises prices, cloud services price and savings for different years. Showcasing this set of slides titled 5 Years Price Comparative Analysis Chart Of Cloud Service Solutions Brochure PDF. The topics addressed in these templates are Cloud, Savings, 2018 To 2022. All the content presented in this PPT design is completely editable. Download it and make adjustments in color, background, font etc. as per your unique business setting.
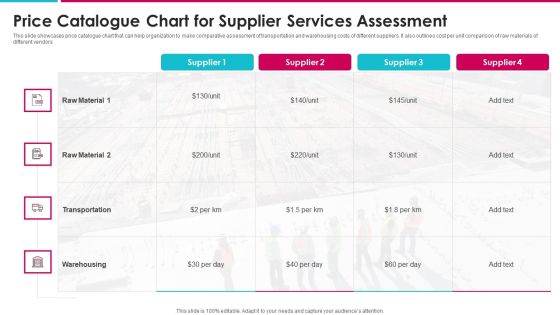
Price Catalogue Chart For Supplier Services Assessment Inspiration PDF
This slide showcases price catalogue chart that can help organization to make comparative assessment of transportation and warehousing costs of different suppliers. It also outlines cost per unit comparison of raw materials of Showcasing this set of slides titled price catalogue chart for supplier services assessment inspiration pdf. The topics addressed in these templates are price catalogue chart for supplier services assessment. All the content presented in this PPT design is completely editable. Download it and make adjustments in color, background, font etc. as per your unique business setting.

5 Years Comparative Analysis Chart Of Balance Sheet Of Organization Ppt Inspiration Slide PDF
This slider represents the five years comparison of organizations balance sheet. It includes details related to total assets and liabilities along with total equity over different years. Pitch your topic with ease and precision using this 5 Years Comparative Analysis Chart Of Balance Sheet Of Organization Ppt Inspiration Slide PDF. This layout presents information on Account Assets, Total Assets Liabilities, Total Liabilities Equity. It is also available for immediate download and adjustment. So, changes can be made in the color, design, graphics or any other component to create a unique layout.

5 Years Expenses Comparative Analysis Chart For Core Banking Solutions Ppt Portfolio Clipart Images PDF
This slide shows the table representing the five years comparison between various costs incurred in installation of core banking solutions. It includes details related to various expenses such as entry level server, increase in electricity costs etc. Pitch your topic with ease and precision using this 5 Years Expenses Comparative Analysis Chart For Core Banking Solutions Ppt Portfolio Clipart Images PDF. This layout presents information on Entry Level Server, Antivirus Server, Increase Electricity Cost. It is also available for immediate download and adjustment. So, changes can be made in the color, design, graphics or any other component to create a unique layout.

5 Years Profit And Loss Comparative Analysis Chart Of Enterprise Ppt Icon Graphics PDF
This slide represents the comparison of profit and loss of an organization for the five years. It includes details related to profit and loss from various accounts such as order fees, concession income, facility rental etc. Pitch your topic with ease and precision using this 5 Years Profit And Loss Comparative Analysis Chart Of Enterprise Ppt Icon Graphics PDF. This layout presents information on Account, 2018 To 2022, Exchange Fees. It is also available for immediate download and adjustment. So, changes can be made in the color, design, graphics or any other component to create a unique layout.

5 Years Sales And Profit Growth Comparative Analysis Chart Of Private Banks Infographics PDF
This slide shows the table representing the comparison between sales and profit growth of five years of various private banks. It includes details related to names of private banks and their five years sales growth and profit growth. Pitch your topic with ease and precision using this 5 Years Sales And Profit Growth Comparative Analysis Chart Of Private Banks Infographics PDF. This layout presents information on Private Banks, Sales Growth, Profit Growth. It is also available for immediate download and adjustment. So, changes can be made in the color, design, graphics or any other component to create a unique layout.

5 Years Technological Comparative Analysis Chart Of Service Provisioning And Operational Costs Information PDF
This slide represents the five years technological and cost based comparison for use of passive optical network. It includes details related to ONT cost, service provisioning and operational costs for five years. Pitch your topic with ease and precision using this 5 Years Technological Comparative Analysis Chart Of Service Provisioning And Operational Costs Information PDF. This layout presents information on Optical Network Termination, Service Provisioning, Operational Cost. It is also available for immediate download and adjustment. So, changes can be made in the color, design, graphics or any other component to create a unique layout.

Manufacturing Quality Assurance And Control Measures Comparative Analysis Production Scheduling Mockup PDF
This slide provides glimpse about a comparison table that helps a business organization to evaluate features of multiple production scheduling software. It includes software, description, client OS, pricing, etc. Make sure to capture your audiences attention in your business displays with our gratis customizable Manufacturing Quality Assurance And Control Measures Comparative Analysis Production Scheduling Mockup PDF. These are great for business strategies, office conferences, capital raising or task suggestions. If you desire to acquire more customers for your tech business and ensure they stay satisfied, create your own sales presentation with these plain slides.

Agile Unified Procedure It Determine Component Essentials In Essup Slides PDF
This slide provides information regarding component essential in essential unified process in terms of objective, key considerations and key competencies. This is a agile unified procedure it comparison diagrams pdf template with various stages. Focus and dispense information on three stages using this creative set, that comes with editable features. It contains large content boxes to add your information on topics like objective, key considerations, key competencies. You can also showcase facts, figures, and other relevant content using this PPT layout. Grab it now.
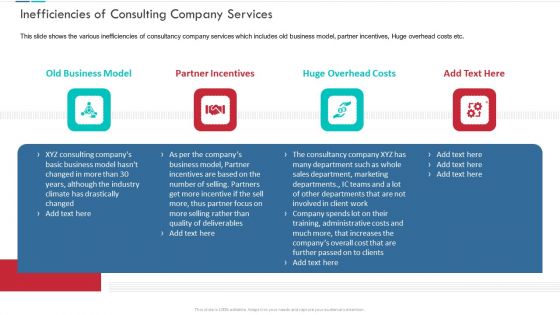
Inefficiencies Of Consulting Company Services Diagrams PDF
This slide shows the various inefficiencies of consultancy company services which includes old business model, partner incentives, Huge overhead costs etc. This is a after new business model competitor comparison graphics pdf template with various stages. Focus and dispense information on four stages using this creative set, that comes with editable features. It contains large content boxes to add your information on topics like old business model, partner incentives, huge overhead costs. You can also showcase facts, figures, and other relevant content using this PPT layout. Grab it now.
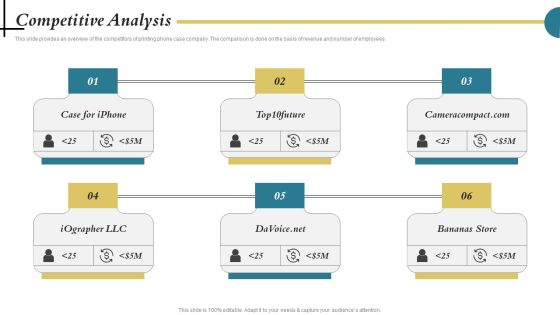
Portable Printing Company Capital Raising Deck Competitive Analysis Clipart PDF
This slide provides an overview of the competitors of printing phone case company. The comparison is done on the basis of revenue and number of employees. Slidegeeks is one of the best resources for PowerPoint templates. You can download easily and regulate Portable Printing Company Capital Raising Deck Competitive Analysis Clipart PDF for your personal presentations from our wonderful collection. A few clicks is all it takes to discover and get the most relevant and appropriate templates. Use our Templates to add a unique zing and appeal to your presentation and meetings. All the slides are easy to edit and you can use them even for advertisement purposes.

Successful CIO Transformation To Generate Company Value Five Common Challenges Faced By New CIO Elements PDF
This slide shows the five common challenges faced by new CIO in the initial days. Major challenges are related to communication, IT perception, comparison with others, understand the organization and business capabilities. This is a successful cio transformation to generate company value five common challenges faced by new cio elements pdf template with various stages. Focus and dispense information on five stages using this creative set, that comes with editable features. It contains large content boxes to add your information on topics like business, capabilities, capacities, growth, goals. You can also showcase facts, figures, and other relevant content using this PPT layout. Grab it now.

Successful CIO Transformation To Generate Company Value Addressing The Challenge Avoid Rules PDF
This slide shows the key points that new CIOs need to focus on while addressing the challenge of avoiding comparison with roles and responsibilities of previous organization. Presenting successful cio transformation to generate company value addressing the challenge avoid rules pdf to provide visual cues and insights. Share and navigate important information on six stages that need your due attention. This template can be used to pitch topics like organization, goals and priorities, vision and objectives. In addtion, this PPT design contains high resolution images, graphics, etc, that are easily editable and available for immediate download.

Chief Information Officer In Improving Organizational Value Addressing The Challenge Template PDF
This slide shows the key points that new CIOs need to focus on while addressing the challenge of avoiding comparison with roles and responsibilities of previous organization This is a Chief Information Officer In Improving Organizational Value Addressing The Challenge Template PDF template with various stages. Focus and dispense information on six stages using this creative set, that comes with editable features. It contains large content boxes to add your information on topics like Situation Of Previous Company, Members Partners, Priorities And Delivering You can also showcase facts, figures, and other relevant content using this PPT layout. Grab it now.

CIO Evolution To Improve Technology Plan For The Organization Addressing The Challenge Slides PDF
This slide shows the key points that new CIOs need to focus on while addressing the challenge of avoiding comparison with roles responsibilities of previous organization This is a CIO Evolution To Improve Technology Plan For The Organization Addressing The Challenge Slides PDF template with various stages. Focus and dispense information on six stages using this creative set, that comes with editable features. It contains large content boxes to add your information on topics like Understand Situation, Current Organization, Previous Company You can also showcase facts, figures, and other relevant content using this PPT layout. Grab it now.

Web Hosting Software Company Outline Salesforce And Other Coding Based Systems Topics PDF
This slide highlights the comparison of salesforce software with other coding-based application which includes benefits of using clicks over code application with database, workflow engine and web service API. Make sure to capture your audiences attention in your business displays with our gratis customizable Web Hosting Software Company Outline Salesforce And Other Coding Based Systems Topics PDF. These are great for business strategies, office conferences, capital raising or task suggestions. If you desire to acquire more customers for your tech business and ensure they stay satisfied, create your own sales presentation with these plain slides.

Impact Of Financial Budgeting And Assessment On Organizations Growth Mockup PDF
This slide shows the importance of proper financial planning and analysis in the success of an organization. It includes improved agility and cost reduction, operations stabilization, spots deviation and suggestion of corrective actions, enhanced cash flow and evaluation and comparison of scenarios. Persuade your audience using this Impact Of Financial Budgeting And Assessment On Organizations Growth Mockup PDF. This PPT design covers five stages, thus making it a great tool to use. It also caters to a variety of topics including Helps Evaluate, Compare scenarios, Stabilizes Operations, Provides Direction. Download this PPT design now to present a convincing pitch that not only emphasizes the topic but also showcases your presentation skills.

Compare Edge Cloud Cloud Computing And Concurrent Computing Ppt Pictures Inspiration PDF
This slide defines a comparison between edge cloud, edge computing, and cloud computing based on latency, processing power, storage capacity, and bandwidth. This is a compare edge cloud cloud computing and concurrent computing ppt pictures inspiration pdf template with various stages. Focus and dispense information on three stages using this creative set, that comes with editable features. It contains large content boxes to add your information on topics like intelligence, processing, capacity, bandwidth, networking. You can also showcase facts, figures, and other relevant content using this PPT layout. Grab it now.

Crucial Dimensions And Structure Of CIO Transformation Addressing The Challenge Avoid Summary PDF
This slide shows the key points that new CIOs need to focus on while addressing the challenge of avoiding comparison with roles responsibilities of previous organization.This is a Crucial Dimensions And Structure Of CIO Transformation Addressing The Challenge Avoid Summary PDF template with various stages. Focus and dispense information on six stages using this creative set, that comes with editable features. It contains large content boxes to add your information on topics like Current Organization, Understand Situation, Previous Organization You can also showcase facts, figures, and other relevant content using this PPT layout. Grab it now.

Rapid Application Development Vs Agile Methodology Integrating RAD Model To Simplify Introduction PDF
This slide represents a comparison between rapid application development and agile methodology based on project size, prototypes, and stages of software development. Slidegeeks is one of the best resources for PowerPoint templates. You can download easily and regulate Rapid Application Development Vs Agile Methodology Integrating RAD Model To Simplify Introduction PDF for your personal presentations from our wonderful collection. A few clicks is all it takes to discover and get the most relevant and appropriate templates. Use our Templates to add a unique zing and appeal to your presentation and meetings. All the slides are easy to edit and you can use them even for advertisement purposes.

Developing Successful Product Offering Strategy Competitor Analysis For Gaining Competitive Pictures PDF
This slide covers competitor comparison based on product or services, market share, growth, target audience, price structure, marketing strategy, customer satisfaction, strengths, weakness, etc. Find a pre designed and impeccable Developing Successful Product Offering Strategy Competitor Analysis For Gaining Competitive Pictures PDF. The templates can ace your presentation without additional effort. You can download these easy to edit presentation templates to make your presentation stand out from others. So, what are you waiting for Download the template from Slidegeeks today and give a unique touch to your presentation.

Guidebook For Executing Business Market Intelligence Introduction Of Trend Analysis Elements PDF
The following slide provides on overview of trend analysis as a method of data assessment in market intelligence. It also highlights various advantages which are measure financial performance, enable comparison and analyze liquidity. The best PPT templates are a great way to save time, energy, and resources. Slidegeeks have 100 percent editable powerpoint slides making them incredibly versatile. With these quality presentation templates, you can create a captivating and memorable presentation by combining visually appealing slides and effectively communicating your message. Download Guidebook For Executing Business Market Intelligence Introduction Of Trend Analysis Elements PDF from Slidegeeks and deliver a wonderful presentation.

Patient Financial Journey Through Revenue Cycle Ppt PowerPoint Presentation Layouts Guidelines PDF
Following slide illustrates patient financial journey. The journey is divided into two processes mainly Pre care and Post care. Presenting patient financial journey through revenue cycle ppt powerpoint presentation layouts guidelines pdf. to provide visual cues and insights. Share and navigate important information on eight stages that need your due attention. This template can be used to pitch topics like price comparison shopping, arrival and registration, financial counseling. In addtion, this PPT design contains high resolution images, graphics, etc, that are easily editable and available for immediate download.
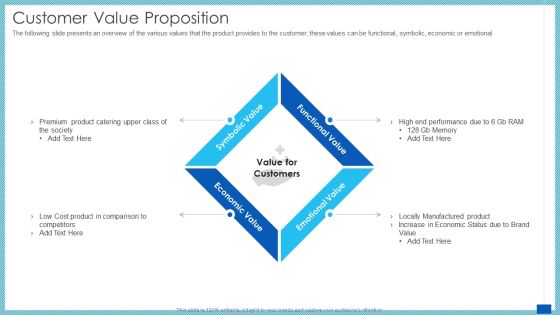
Evaluation Evolving Advanced Enterprise Development Marketing Tactics Customer Value Proposition Elements PDF
The following slide presents an overview of the various values that the product provides to the customer, these values can be functional, symbolic, economic or emotional. Presenting evaluation evolving advanced enterprise development marketing tactics customer value proposition elements pdf to provide visual cues and insights. Share and navigate important information on four stages that need your due attention. This template can be used to pitch topics like product catering, cost product in comparison to competitors, performance, functional value . In addtion, this PPT design contains high resolution images, graphics, etc, that are easily editable and available for immediate download.

Decision Support System Data Warehousing And Business Intelligence Download PDF
This slide represents the comparison between data warehousing and business intelligence and how business intelligence helps to generate useful output from raw data. Presenting Decision Support System Data Warehousing And Business Intelligence Download PDF to provide visual cues and insights. Share and navigate important information on two stages that need your due attention. This template can be used to pitch topics like Data Warehousing, Business Intelligence, Data Discovery. In addtion, this PPT design contains high resolution images, graphics, etc, that are easily editable and available for immediate download.

Best Data Migration Strategic Plan Tools For Strategies Implementation Pictures PDF
The following slide depicts some tools to execute data migration strategies. It constitutes of three tools and the basis for comparison such as usability, pros and cons security, flexibility usability etc. Presenting Best Data Migration Strategic Plan Tools For Strategies Implementation Pictures PDF to dispense important information. This template comprises three stages. It also presents valuable insights into the topics including Usability, Data Centre Migration, Data Sources. This is a completely customizable PowerPoint theme that can be put to use immediately. So, download it and address the topic impactfully.

DLT Technology Blockchain Technology Vs Bank System Ppt Summary Design Ideas PDF
This slide represents the comparison between blockchain technology and the bank system. It shows how blockchain technology is available for users 247 throughout the year. Present like a pro with DLT Technology Blockchain Technology Vs Bank System Ppt Summary Design Ideas PDF Create beautiful presentations together with your team, using our easy-to-use presentation slides. Share your ideas in real-time and make changes on the fly by downloading our templates. So whether youre in the office, on the go, or in a remote location, you can stay in sync with your team and present your ideas with confidence. With Slidegeeks presentation got a whole lot easier. Grab these presentations today.
Essential Metrics Used For Benchmark Evaluation Analysis Ideas PDF
This slide shows different metrics used for setting benchmark bases for comparison of different organizational products. It include metrics like sales revenue, gross margin and net profit margin etc. Presenting Essential Metrics Used For Benchmark Evaluation Analysis Ideas PDF to dispense important information. This template comprises five stages. It also presents valuable insights into the topics including Sales Revenue, Gross Margin, Net Profit Margin. This is a completely customizable PowerPoint theme that can be put to use immediately. So, download it and address the topic impactfully.

Business Optimizing Database Mining Tools And Software Clipart PDF
This slide provides a comparison of data mining tools including open source as well as commercial solutions to discover unsuspected undiscovered relationships amongst the data for business gains. It covers tools such as SAS Data Mining, Zoho Analytics and Teradata. Persuade your audience using this Business Optimizing Database Mining Tools And Software Clipart PDF. This PPT design covers Four stages, thus making it a great tool to use. It also caters to a variety of topics including Data Mining, Zoho Analytics, Teradata. Download this PPT design now to present a convincing pitch that not only emphasizes the topic but also showcases your presentation skills.
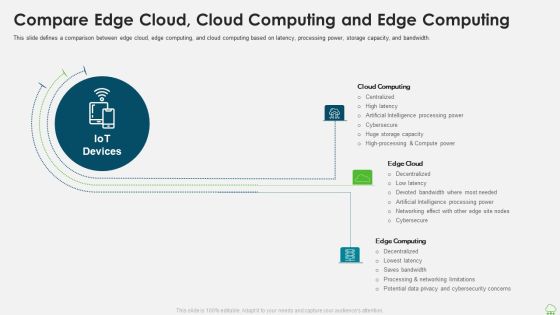
Distributed Computing IT Compare Edge Cloud Cloud Computing And Edge Computing Rules PDF
This slide defines a comparison between edge cloud, edge computing, and cloud computing based on latency, processing power, storage capacity, and bandwidth. Presenting distributed computing it compare edge cloud cloud computing and edge computing rules pdf to provide visual cues and insights. Share and navigate important information on three stages that need your due attention. This template can be used to pitch topics like storage capacity, artificial intelligence, processing and networking. In addtion, this PPT design contains high resolution images, graphics, etc, that are easily editable and available for immediate download.
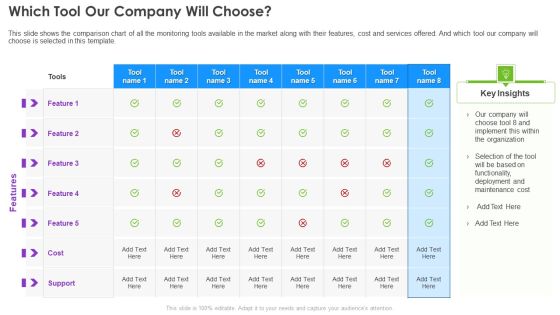
Infrastructure Supervision Which Tool Our Company Will Choose Download PDF
This slide shows the comparison chart of all the monitoring tools available in the market along with their features, cost and services offered. And which tool our company will choose is selected in this template. Deliver an awe inspiring pitch with this creative Infrastructure Supervision Which Tool Our Company Will Choose Download PDF bundle. Topics like Organization, Functionality, Deployment, Maintenance Cost can be discussed with this completely editable template. It is available for immediate download depending on the needs and requirements of the user.
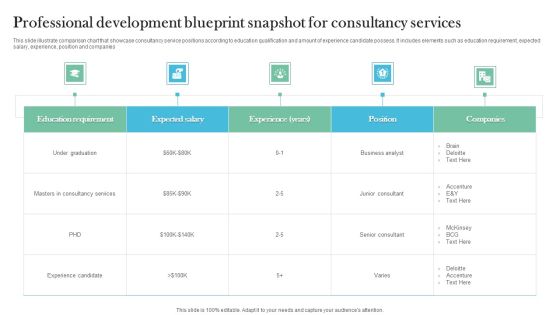
Professional Development Blueprint Snapshot For Consultancy Services Microsoft PDF
This slide illustrate comparison chart that showcase consultancy service positions according to education qualification and amount of experience candidate possess. It includes elements such as education requirement, expected salary, experience, position and companies. Pitch your topic with ease and precision using this Professional Development Blueprint Snapshot For Consultancy Services Microsoft PDF. This layout presents information on Consultancy Services, Education Requirement, Business Analyst. It is also available for immediate download and adjustment. So, changes can be made in the color, design, graphics or any other component to create a unique layout.

Selecting Suitable Solution For Service Desk Management Elements PDF
This slide illustrates comparison of service desk software. It provides information about features, deployment, trial, cloud, on premises, Gantt charts, marketing hub, asset management, service portal, change management, etc. Slidegeeks has constructed Selecting Suitable Solution For Service Desk Management Elements PDF after conducting extensive research and examination. These presentation templates are constantly being generated and modified based on user preferences and critiques from editors. Here, you will find the most attractive templates for a range of purposes while taking into account ratings and remarks from users regarding the content. This is an excellent jumping off point to explore our content and will give new users an insight into our top notch PowerPoint Templates.

Enhancing Hospital Software System Selecting Suitable Patient Appointment Scheduling Software Inspiration PDF
This slide focuses on the comparison chart of software that shows the features of software used for scheduling patient appointment such as online booking, appoint reminders, mobile friendly, etc. Deliver and pitch your topic in the best possible manner with this enhancing hospital software system selecting suitable patient appointment scheduling software inspiration pdf. Use them to share invaluable insights on selecting suitable patient appointment scheduling software and impress your audience. This template can be altered and modified as per your expectations. So, grab it now.

Integration Of Healthcare Center Administration System Selecting Suitable Patient Appointment Scheduling Software Rules PDF
This slide focuses on the comparison chart of software that shows the features of software used for scheduling patient appointment such as online booking, appoint reminders, mobile friendly, etc.Deliver and pitch your topic in the best possible manner with this Integration Of Healthcare Center Administration System Selecting Suitable Patient Appointment Scheduling Software Rules PDF Use them to share invaluable insights on Appointment Reminders, Automated Scheduling, Multi Location and impress your audience. This template can be altered and modified as per your expectations. So, grab it now.

Improve IT Service Desk Selecting Suitable Solution For Service Desk Management Rules PDF
This slide illustrates comparison of service desk software. It provides information about features, deployment, trial, cloud, on premises, Gantt charts, marketing hub, asset management, service portal, change management, etc. Deliver and pitch your topic in the best possible manner with this Improve IT Service Desk Selecting Suitable Solution For Service Desk Management Rules PDF. Use them to share invaluable insights on Incident Management, Change Management, Asset Management and impress your audience. This template can be altered and modified as per your expectations. So, grab it now.
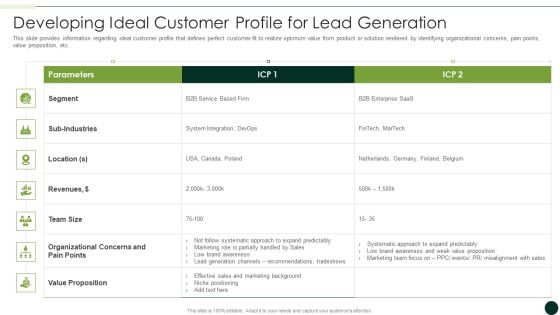
Salesman Principles Playbook Developing Ideal Customer Profile For Lead Generation Topics PDF
This slide provides information regarding ideal customer profile that defines perfect customer fit to realize optimum value from product or solution rendered by identifying organizational concerns, pain points, value proposition, etc. Deliver and pitch your topic in the best possible manner with this salesman principles playbook developing ideal customer profile for lead generation topics pdf Use them to share invaluable insights on different products price comparison chart and impress your audience. This template can be altered and modified as per your expectations. So, grab it now.

Comparative Assessment For E Reader Product Categories Information PDF
This slide showcases capability comparison chart for organization dealing in e- reader products to help customers in understanding pros and cons of each category. It includes information about price, rating, screen size, resolution, etc. Pitch your topic with ease and precision using this Comparative Assessment For E Reader Product Categories Information PDF. This layout presents information on Price, Rating, Screen Size, Storage, Resolution. It is also available for immediate download and adjustment. So, changes can be made in the color, design, graphics or any other component to create a unique layout.

Yearly Business Performance Assessment And Evaluation Dashboard Structure PDF
This slide contains annual business review of a company. It includes revenue comparison, sales assessment and profitability representation. Showcasing this set of slides titled Yearly Business Performance Assessment And Evaluation Dashboard Structure PDF. The topics addressed in these templates are Revenue Comparison, Sales, Profitability. All the content presented in this PPT design is completely editable. Download it and make adjustments in color, background, font etc. as per your unique business setting.
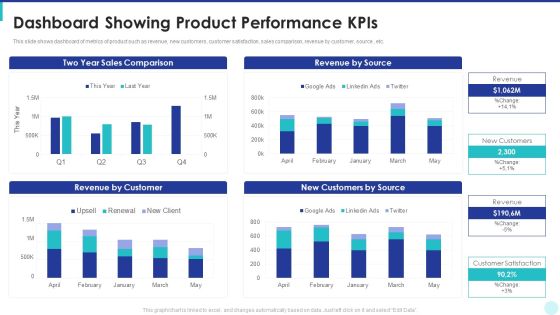
Optimization Of Product Development Life Cycle Dashboard Showing Product Performance Kpis Topics PDF
This slide shows dashboard of metrics of product such as revenue, new customers, customer satisfaction, sales comparison, revenue by customer, source , etc. Deliver an awe inspiring pitch with this creative optimization of product development life cycle dashboard showing product performance kpis topics pdf bundle. Topics like sales comparison, revenue by source, revenue by customer, customers by source can be discussed with this completely editable template. It is available for immediate download depending on the needs and requirements of the user.
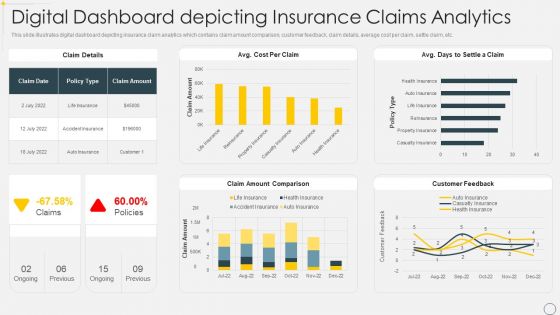
Digital Dashboard Depicting Insurance Claims Analytics Pictures PDF
This slide illustrates digital dashboard depicting insurance claim analytics which contains claim amount comparison, customer feedback, claim details, average cost per claim, settle claim, etc. Showcasing this set of slides titled Digital Dashboard Depicting Insurance Claims Analytics Pictures PDF. The topics addressed in these templates are Policy, Cost, Comparison. All the content presented in this PPT design is completely editable. Download it and make adjustments in color, background, font etc. as per your unique business setting.

Departments Of Visualization Research Sales Performance Dashboard After Visualization Sample PDF
This slide depicts the dashboard for sales performance after the implementation of visualization research based on revenue, quantity, regional sales.Deliver an awe inspiring pitch with this creative Departments Of Visualization Research Sales Performance Dashboard After Visualization Sample PDF bundle. Topics like Revenue Comparison, Quantity Comparison, Category Select can be discussed with this completely editable template. It is available for immediate download depending on the needs and requirements of the user.

Creating Successful Strategies To Enhance Customer Experience Customer Engagement Analytical Dashboard Slides PDF
This slide shows customer engagement analytical dashboard that covers total sales, total transaction, email received, links clicked, unique customer sales, sales comparison, customers name, product list, etc.Deliver an awe inspiring pitch with this creative Creating Successful Strategies To Enhance Customer Experience Customer Engagement Analytical Dashboard Slides PDF bundle. Topics like Sales Comparison, Engagement Performance, Customer Sales can be discussed with this completely editable template. It is available for immediate download depending on the needs and requirements of the user.

Developing Client Engagement Techniques Customer Engagement Analytical Dashboard Clipart PDF
This slide shows customer engagement analytical dashboard that covers total sales, total transaction, email received, links clicked, unique customer sales, sales comparison, customers name, product list, etc. Deliver an awe inspiring pitch with this creative Developing Client Engagement Techniques Customer Engagement Analytical Dashboard Clipart PDF bundle. Topics like Sales Comparison, Cumulative Email Marketing, Sales Ranking can be discussed with this completely editable template. It is available for immediate download depending on the needs and requirements of the user.

Corporate Hospitality Administration Dashboard With Occupancy Rate Guidelines PDF
This slide illustrates facts and figures related to hotel chain bookings and occupancy data. It includes visitors, occupancy rate, revenue, bookings comparison, occupancy type, etc.Pitch your topic with ease and precision using this Corporate Hospitality Administration Dashboard With Occupancy Rate Guidelines PDF. This layout presents information on Occupancy Rate, Average Daily Rate, Bookings Comparison. It is also available for immediate download and adjustment. So, changes can be made in the color, design, graphics or any other component to create a unique layout.

What Does Account Growth Look Like Pitch Deck Of Vulpine Interactive Fundraising Template Pdf
This slide provides information about some of the tactics that are used by the company in order to amplify the growth efforts along with a line graph indicating a rise in the number of followers of the company over a few years. This is a what does account growth look like pitch deck of vulpine interactive fundraising template pdf template with various stages. Focus and dispense information on six stages using this creative set, that comes with editable features. It contains large content boxes to add your information on topics like tweet evolution, growth tactics. You can also showcase facts, figures, and other relevant content using this PPT layout. Grab it now.
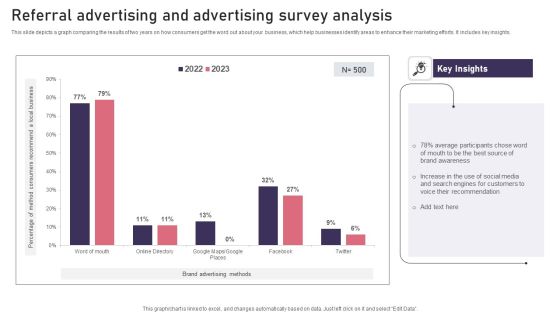
Referral Advertising And Advertising Survey Analysis Background PDF
This slide depicts a graph comparing the results of two years on how consumers get the word out about your business, which help businesses identify areas to enhance their marketing efforts. It includes key insights. Showcasing this set of slides titled Referral Advertising And Advertising Survey Analysis Background PDF. The topics addressed in these templates are Referral Advertising, Advertising Survey Analysis. All the content presented in this PPT design is completely editable. Download it and make adjustments in color, background, font etc. as per your unique business setting.
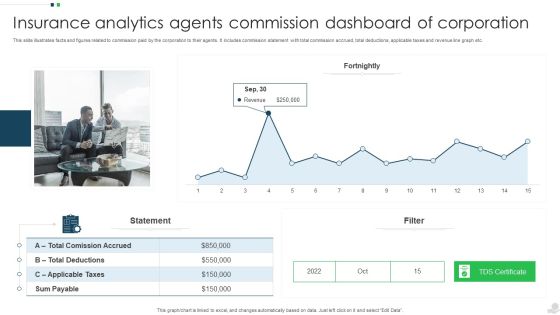
Insurance Analytics Agents Commission Dashboard Of Corporation Introduction PDF
This slide illustrates facts and figures related to commission paid by the corporation to their agents. It includes commission statement with total commission accrued, total deductions, applicable taxes and revenue line graph etc. Pitch your topic with ease and precision using this Insurance Analytics Agents Commission Dashboard Of Corporation Introduction PDF. This layout presents information on Applicable Taxes, Sum Payable, Revenue. It is also available for immediate download and adjustment. So, changes can be made in the color, design, graphics or any other component to create a unique layout.
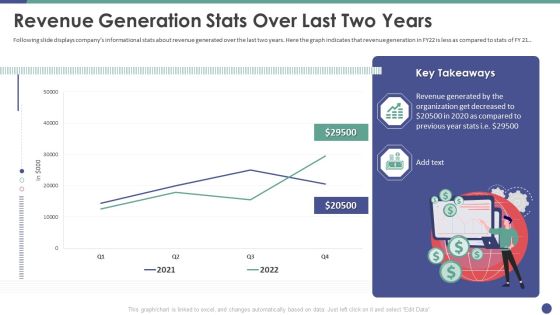
QC Engineering Revenue Generation Stats Over Last Two Years Ppt Portfolio Graphics Tutorials PDF
Following slide displays companys informational stats about revenue generated over the last two years. Here the graph indicates that revenue generation in FY22 is less as compared to stats of FY21. Deliver an awe inspiring pitch with this creative qc engineering revenue generation stats over last two years ppt portfolio graphics tutorials pdf bundle. Topics like revenue generation stats over last two years can be discussed with this completely editable template. It is available for immediate download depending on the needs and requirements of the user.

Finance Metrics Dashboard Illustrating Income And Cash Flow Template PDF
This graph or chart is linked to excel, and changes automatically based on data. Just left click on it and select edit data. Pitch your topic with ease and precision using this Finance Metrics Dashboard Illustrating Income And Cash Flow Template PDF. This layout presents information on Current Accounts Receivable, Current Account Payable, Cash End Period, Account Receivable Account. It is also available for immediate download and adjustment. So, changes can be made in the color, design, graphics or any other component to create a unique layout.
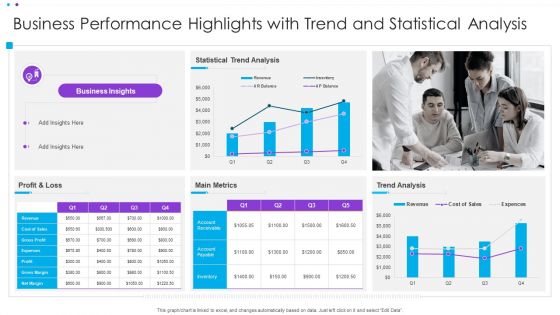
Business Performance Highlights With Trend And Statistical Analysis Ppt Infographic Template Display PDF
This graph or chart is linked to excel, and changes automatically based on data. Just left click on it and select Edit Data. Pitch your topic with ease and precision using this Business Performance Highlights With Trend And Statistical Analysis Ppt Infographic Template Display PDF. This layout presents information on Statistical Trend Analysis, Main Metrics, Profit And Loss. It is also available for immediate download and adjustment. So, changes can be made in the color, design, graphics or any other component to create a unique layout.

Strategic Market Insight Implementation Guide Product Yearly Sales Trend Analysis Sample Clipart PDF
The following slide showcases a graph of yearly sales for analyzing trends over different periods. It highlights components such as yearly product sales, data analysis and key reasons. Slidegeeks is one of the best resources for PowerPoint templates. You can download easily and regulate Strategic Market Insight Implementation Guide Product Yearly Sales Trend Analysis Sample Clipart PDF for your personal presentations from our wonderful collection. A few clicks is all it takes to discover and get the most relevant and appropriate templates. Use our Templates to add a unique zing and appeal to your presentation and meetings. All the slides are easy to edit and you can use them even for advertisement purposes.

Functioning Of Serverless Computing Impact Of Serverless Technology On Software Development Lifecycle Guidelines PDF
The purpose of the following slide is to show the impact of deploying serverless technology in the organization, the provided graph analyzes two major scenarios which are or with serverless and without serverless technology. Deliver an awe-inspiring pitch with this creative functioning of serverless computing impact of serverless technology on software development lifecycle guidelines pdf bundle. Topics like portability, cost labor, time feature, lead time, application performance, devops culture, flexbility of architecture, spped of deployment, cost of resources, speed development, flexibility scaling can be discussed with this completely editable template. It is available for immediate download depending on the needs and requirements of the user.

Process Advancement Scheme Costs Of Software Quality Improvement Topics PDF
This slide provides the glimpse about the cost of software quality data along with graph which focuses on various costs such as performance, rework, appraisal, prevention, defects, etc. This is a process advancement scheme costs of software quality improvement topics pdf template with various stages. Focus and dispense information on one stages using this creative set, that comes with editable features. It contains large content boxes to add your information on topics like cost performance, cost rework, cost appraisal, cost prevention. You can also showcase facts, figures, and other relevant content using this PPT layout. Grab it now.
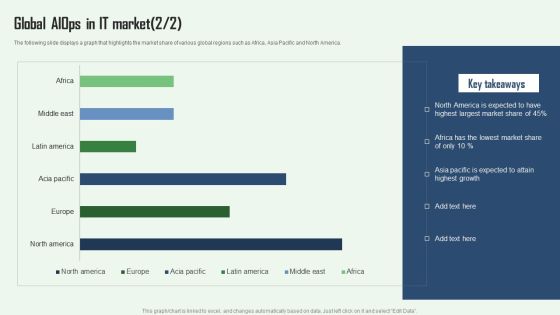
Global Aiops In IT Market Aiops Integration Summary Report Designs PDF
The following slide displays a graph that highlights the market share of various global regions such as Africa, Asia Pacific and North America. This Global Aiops In IT Market Aiops Integration Summary Report Designs PDF is perfect for any presentation, be it in front of clients or colleagues. It is a versatile and stylish solution for organizing your meetings. The Global Aiops In IT Market Aiops Integration Summary Report Designs PDF features a modern design for your presentation meetings. The adjustable and customizable slides provide unlimited possibilities for acing up your presentation. Slidegeeks has done all the homework before launching the product for you. So, do not wait, grab the presentation templates today.

Media Advertising Social Media Interaction With ROI Slides PDF
This slide shows the graph depicting the rising revenue after switching into new digital channels as compared with previous year. This Media Advertising Social Media Interaction With ROI Slides PDF is perfect for any presentation, be it in front of clients or colleagues. It is a versatile and stylish solution for organizing your meetings. The Media Advertising Social Media Interaction With ROI Slides PDF features a modern design for your presentation meetings. The adjustable and customizable slides provide unlimited possibilities for acing up your presentation. Slidegeeks has done all the homework before launching the product for you. So, do not wait, grab the presentation templates today
Six Months Business Valuation Chart Ppt Styles Icons PDF
This slide shows the 6 months graph to measure company valuation. It is representing that highest valuation of company was calculated in the month of June due to increase in sales. Pitch your topic with ease and precision using this Six Months Business Valuation Chart Ppt Styles Icons PDF. This layout presents information on Increase Sales, Company Valuation. It is also available for immediate download and adjustment. So, changes can be made in the color, design, graphics or any other component to create a unique layout.

Usage Trend Chart Of Skincare Product Market Ppt Slides Graphics Download PDF
This slide shows market trend graph of skincare product usage in four quarters. It also indicates that product A is most preferred by the customers. Pitch your topic with ease and precision using this Usage Trend Chart Of Skincare Product Market Ppt Slides Graphics Download PDF. This layout presents information on Trend Product, Skincare Product, Quarter Due. It is also available for immediate download and adjustment. So, changes can be made in the color, design, graphics or any other component to create a unique layout.
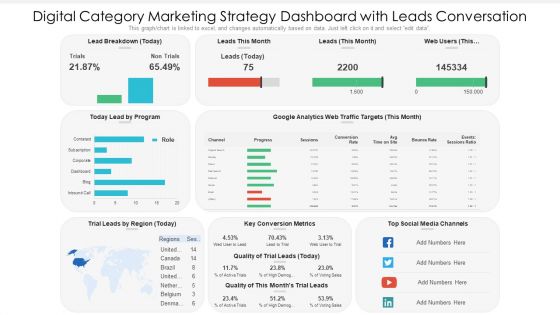
Digital Category Marketing Strategy Dashboard With Leads Conversation Ppt PowerPoint Presentation Slides Information PDF
This graph chart is linked to excel, and changes automatically based on data. Just left click on it and select edit data. Pitch your topic with ease and precision using this digital category marketing strategy dashboard with leads conversation ppt powerpoint presentation slides information pdf. This layout presents information on key conversion metrics, social media channels, lead by program. It is also available for immediate download and adjustment. So, changes can be made in the color, design, graphics or any other component to create a unique layout.
Finance Metrics Dashboard Illustrating Account Payables Icons PDF
This graph or chart is linked to excel, and changes automatically based on data. Just left click on it and select edit data. Pitch your topic with ease and precision using this Total Income Budget, Total Expenses Balance, Net Profit Quick, Ratio Current Ratio. This layout presents information on Account Payable Age, Average Creditor Days, Cash On Hand. It is also available for immediate download and adjustment. So, changes can be made in the color, design, graphics or any other component to create a unique layout.

Client Helpline Dashboard At Valet Information Dsk Ppt Gallery Slide Portrait PDF
This graph or chart is linked to excel, and changes automatically based on data. Just left click on it and select Edit Data. Pitch your topic with ease and precision using this Client Helpline Dashboard At Valet Information Dsk Ppt Gallery Slide Portrait PDF. This layout presents information on Valet Damage Claims, Valet Wait Times, Information Desk. It is also available for immediate download and adjustment. So, changes can be made in the color, design, graphics or any other component to create a unique layout.

Client Helpline Dashboard With Retention Rate Ppt Gallery Ideas PDF
This graph or chart is linked to excel, and changes automatically based on data. Just left click on it and select Edit Data. Pitch your topic with ease and precision using this Client Helpline Dashboard With Retention Rate Ppt Gallery Ideas PDF. This layout presents information on Cost per Support 2022, Total Requests, Total Revenue 2022, Avg Requests Answered. It is also available for immediate download and adjustment. So, changes can be made in the color, design, graphics or any other component to create a unique layout.

Firm KPI Dashboard With Average Click Through Rate Ppt Inspiration Sample PDF
This graph or chart is linked to excel, and changes automatically based on data. Just left click on it and select Edit Data. Pitch your topic with ease and precision using this Firm KPI Dashboard With Average Click Through Rate Ppt Inspiration Sample PDF. This layout presents information on Total Clicks, Total Impressive, Average CTR, Average Position. It is also available for immediate download and adjustment. So, changes can be made in the color, design, graphics or any other component to create a unique layout.

Firm KPI Dashboard With Schedule Performance Index Ppt Visual Aids PDF
This graph or chart is linked to excel, and changes automatically based on data. Just left click on it and select Edit Data. Pitch your topic with ease and precision using this Firm KPI Dashboard With Schedule Performance Index Ppt Visual Aids PDF. This layout presents information on Project Cost Performance, Project Planning Stage, Monitor And Control. It is also available for immediate download and adjustment. So, changes can be made in the color, design, graphics or any other component to create a unique layout.

Service Level Agreement KPI Dashboard With Current Risk Statistics Topics PDF
This graph or chart is linked to excel, and changes automatically based on data. Just left click on it and select Edit Data. Pitch your topic with ease and precision using this Service Level Agreement KPI Dashboard With Current Risk Statistics Topics PDF. This layout presents information on Current Risk SLAS, Current Breached Slas, Personal Active SLA It is also available for immediate download and adjustment. So, changes can be made in the color, design, graphics or any other component to create a unique layout.

Company Financial Performance Indicators Dashboard With Liquidity And Turnover Ratios Formats PDF
This graph or chart is linked to excel, and changes automatically based on data. Just left click on it and select Edit Data. Pitch your topic with ease and precision using this Company Financial Performance Indicators Dashboard With Liquidity And Turnover Ratios Formats PDF. This layout presents information on Cash Balance, Days Inventory Outstanding, Days Payable Outstanding. It is also available for immediate download and adjustment. So, changes can be made in the color, design, graphics or any other component to create a unique layout.
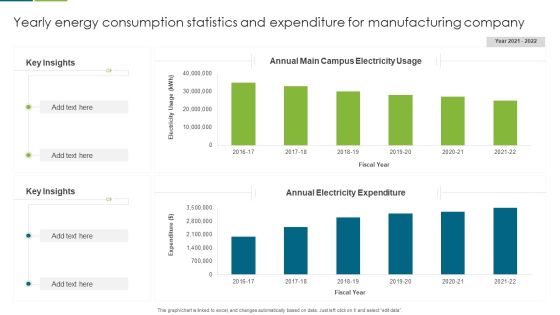
Yearly Energy Consumption Statistics And Expenditure For Manufacturing Company Guidelines PDF
This graph or chart is linked to excel, and changes automatically based on data. Just left click on it and select edit data. Pitch your topic with ease and precision using this Yearly Energy Consumption Statistics And Expenditure For Manufacturing Company Guidelines PDF. This layout presents information on Key Insights, Annual Electricity Expenditure, Annual Main Campus, Electricity Usage. It is also available for immediate download and adjustment. So, changes can be made in the color, design, graphics or any other component to create a unique layout.

SLA KPL Dashboard Illustrating Risk And Active Services Ppt Portfolio Design Inspiration PDF
This graph or chart is linked to excel, and changes automatically based on data. Just left click on it and select Edit Data. Pitch your topic with ease and precision using this SLA KPL Dashboard Illustrating Risk And Active Services Ppt Portfolio Design Inspiration PDF. This layout presents information on My Active SLAs, Database Group, Priority. It is also available for immediate download and adjustment. So, changes can be made in the color, design, graphics or any other component to create a unique layout.
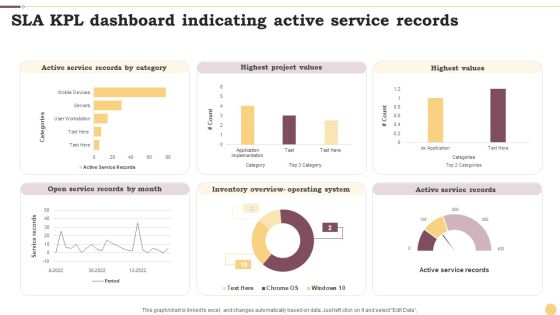
SLA KPL Dashboard Indicating Active Service Records Ppt Professional Graphics Example PDF
This graph or chart is linked to excel, and changes automatically based on data. Just left click on it and select Edit Data. Pitch your topic with ease and precision using this SLA KPL Dashboard Indicating Active Service Records Ppt Professional Graphics Example PDF. This layout presents information on Active Service Records, Highest Project Values, Highest Values. It is also available for immediate download and adjustment. So, changes can be made in the color, design, graphics or any other component to create a unique layout.

Kanban Structure To Track Proposed Active And Completed Activities Ppt Outline Slide Portrait PDF
This graph or chart is linked to excel, and changes automatically based on data. Just left click on it and select Edit Data. Pitch your topic with ease and precision using this Kanban Structure To Track Proposed Active And Completed Activities Ppt Outline Slide Portrait PDF. This layout presents information on Project Lead Time, Cycle Time, Completed. It is also available for immediate download and adjustment. So, changes can be made in the color, design, graphics or any other component to create a unique layout.

Kanban Structure With Task Count And Cycle Time Ppt Layouts Background Designs PDF
This graph or chart is linked to excel, and changes automatically based on data. Just left click on it and select Edit Data. Pitch your topic with ease and precision using this Kanban Structure With Task Count And Cycle Time Ppt Layouts Background Designs PDF. This layout presents information on Required Project Design, Project Design Approval, Construct. It is also available for immediate download and adjustment. So, changes can be made in the color, design, graphics or any other component to create a unique layout.
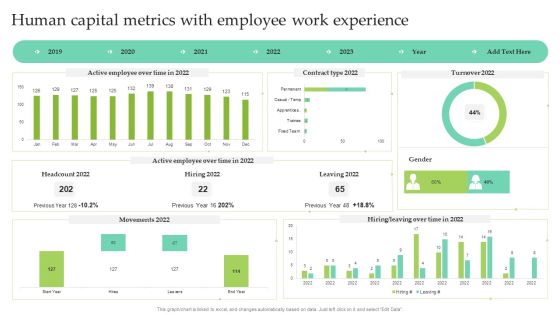
Human Capital Metrics With Employee Work Experience Ppt Show Images PDF
This graph or chart is linked to excel, and changes automatically based on data. Just left click on it and select Edit Data. Pitch your topic with ease and precision using this Human Capital Metrics With Employee Work Experience Ppt Show Images PDF. This layout presents information on Active Employee, Over Time, Contract Type 2022, Leaving 2022. It is also available for immediate download and adjustment. So, changes can be made in the color, design, graphics or any other component to create a unique layout.

Search Engine Optimization Services Dashboard With Google Ranking Ppt Gallery Demonstration PDF
This slide covers the different SEO services and the impact of them on the business. It includes the number of website visitors, Google ranking , site audit score, audience growth graph and many more things. Pitch your topic with ease and precision using this Search Engine Optimization Services Dashboard With Google Ranking Ppt Gallery Demonstration PDF. This layout presents information on Audience Growth Paid, Adwords Conversions Score. It is also available for immediate download and adjustment. So, changes can be made in the color, design, graphics or any other component to create a unique layout.

Yearly Saas Cloud Security Expenditure Analysis Ppt PowerPoint Presentation File Deck PDF
The following slide depicts the annual spending of organizations on SaaS security services to prevent data breaches. It constitutes of graph representing the varying expenditure based of the size of the company. Pitch your topic with ease and precision using this Yearly Saas Cloud Security Expenditure Analysis Ppt PowerPoint Presentation File Deck PDF. This layout presents information on Saas Investment, Employees. It is also available for immediate download and adjustment. So, changes can be made in the color, design, graphics or any other component to create a unique layout.
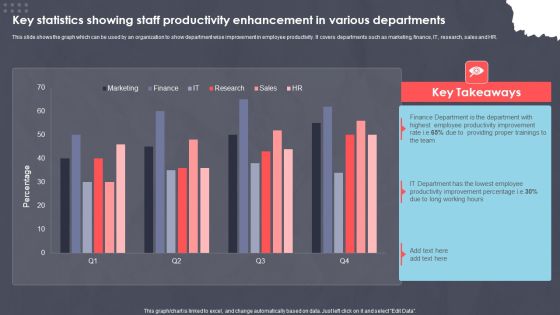
Key Statistics Showing Staff Productivity Enhancement In Various Departments Ppt PowerPoint Presentation Slides Portrait PDF
This slide shows the graph which can be used by an organization to show department wise improvement in employee productivity. It covers departments such as marketing, finance, IT, research, sales and HR. Pitch your topic with ease and precision using this Key Statistics Showing Staff Productivity Enhancement In Various Departments Ppt PowerPoint Presentation Slides Portrait PDF. This layout presents information on XXXXXXXXXXXXXXXXXXXXXXXXX. It is also available for immediate download and adjustment. So, changes can be made in the color, design, graphics or any other component to create a unique layout.

Cloud Content Delivery Network Cost Reduction Post CDN Implementation Themes PDF
This slide demonstrates the graph about how bandwidth costs are reduced by 99 percent after the implementation of the content delivery network. This Cloud Content Delivery Network Cost Reduction Post CDN Implementation Themes PDF from Slidegeeks makes it easy to present information on your topic with precision. It provides customization options, so you can make changes to the colors, design, graphics, or any other component to create a unique layout. It is also available for immediate download, so you can begin using it right away. Slidegeeks has done good research to ensure that you have everything you need to make your presentation stand out. Make a name out there for a brilliant performance.

Monthly Leads Report And Customer Relationship Management Dashboard With Revenue Information PDF
This slide illustrates graphical representation of CRM leads data. It includes revenue, open leads, won leads, cold leads, monthly leads report and leads dough nut graph etc. Pitch your topic with ease and precision using this Monthly Leads Report And Customer Relationship Management Dashboard With Revenue Information PDF. This layout presents information on Monthly Leads Report, Customer Relationship Management, Dashboard With Revenue. It is also available for immediate download and adjustment. So, changes can be made in the color, design, graphics or any other component to create a unique layout.
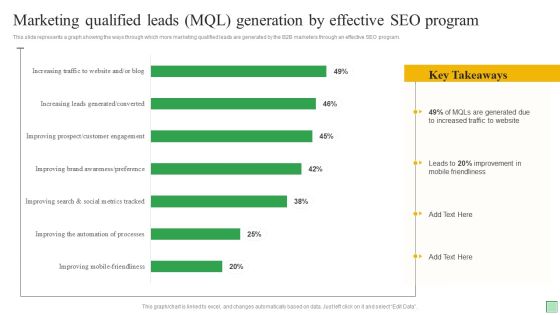
Marketing Qualified Leads MQL Generation By Effective SEO Program Ppt Slides Example Topics PDF
This slide represents a graph showing the ways through which more marketing qualified leads are generated by the B2B marketers through an effective SEO program. Pitch your topic with ease and precision using this Marketing Qualified Leads MQL Generation By Effective SEO Program Ppt Slides Example Topics PDF. This layout presents information on Mobile Friendliness, Due To Increased, Traffic To Website. It is also available for immediate download and adjustment. So, changes can be made in the color, design, graphics or any other component to create a unique layout.

Virtual Customer Healthcare Trends Among Different Generations Professional PDF
The below slide depicts the consumer trends in healthcare industry. The graph includes the data for the past two years comparing the percentage of change in the virtual visits among different generations. Pitch your topic with ease and precision using this Virtual Customer Healthcare Trends Among Different Generations Professional PDF. This layout presents information on Millennial, Baby Boomers, Seniors. It is also available for immediate download and adjustment. So, changes can be made in the color, design, graphics or any other component to create a unique layout.

Human Resource Metrics With New Hire Turnover Professional PDF
This slide showcases human resource dashboard that can help to track the KPIs that are time to fill, quality of hire, hiring source and new hire turnover. It also illustrates the performance score graph that can help to evaluate the recruitment efficiency of different HR employees. Pitch your topic with ease and precision using this Human Resource Metrics With New Hire Turnover Professional PDF. This layout presents information on Hiring Source, New Hire Turnover, Hr Employees Performance Score. It is also available for immediate download and adjustment. So, changes can be made in the color, design, graphics or any other component to create a unique layout.

Statistical Relationship Between Organic Growth Procedure And Profitability Rules PDF
This slide showcases graph depicting relationship between organic growth process and profit . It includes annual growth , annual profits , frequent , occasional and no researches etc. Pitch your topic with ease and precision using this Statistical Relationship Between Organic Growth Procedure And Profitability Rules PDF. This layout presents information on Key Insights, Frequency, Profitability. It is also available for immediate download and adjustment. So, changes can be made in the color, design, graphics or any other component to create a unique layout.
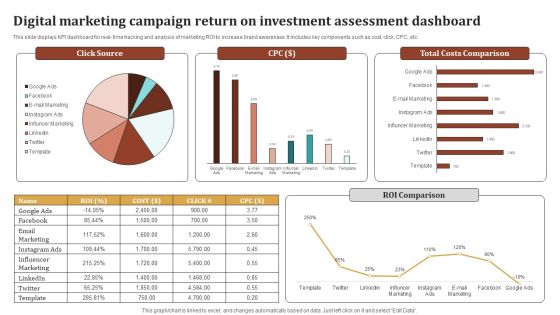
Digital Marketing Campaign Return On Investment Assessment Dashboard Ideas PDF
This slide displays KPI dashboard for real- time tracking and analysis of marketing ROI to increase brand awareness. It includes key components such as cost, click, CPC, etc. Showcasing this set of slides titled Digital Marketing Campaign Return On Investment Assessment Dashboard Ideas PDF. The topics addressed in these templates are Influencer Marketing, Email Marketing, Total Costs Comparison, Roi Comparison. All the content presented in this PPT design is completely editable. Download it and make adjustments in color, background, font etc. as per your unique business setting.

Business Performance Review Dashboard To Measure Overall Business Performance Formats PDF
The following slide highlights a comprehensive quarterly business review QBR dashboard which can be used by the organization to evaluate business performance. The metrics used for review are total revenue, new customers, gross profit, overall costs, sales comparison, sales by different products and top performing channels. Showcasing this set of slides titled Business Performance Review Dashboard To Measure Overall Business Performance Formats PDF. The topics addressed in these templates are Sales Comparison, Sales Product, High Performing. All the content presented in this PPT design is completely editable. Download it and make adjustments in color, background, font etc. as per your unique business setting.

Business Key Performance Metrics Review Dashboard Portrait PDF
The following slide shows a dashboard of sales strategy review of firm that can be used by marketing, product, finance managers for reviewing the business. It further includes KPI that are revenue, new customer, gross profit purchaser satisfaction, income comparison, sales categories and profitability. Showcasing this set of slides titled Business Key Performance Metrics Review Dashboard Portrait PDF. The topics addressed in these templates are Sales, Revenue Comparison, Profitability. All the content presented in this PPT design is completely editable. Download it and make adjustments in color, background, font etc. as per your unique business setting.

Dashboard For Strategic Evaluation Of Key Business Financials Ppt Gallery Aids PDF
This slide displays dashboard to review business performance and formulate appropriate improvement strategies. It further includes kpis such as revenue comparison, top selling categories, sales by month, customer satisfaction, etc. Showcasing this set of slides titled Dashboard For Strategic Evaluation Of Key Business Financials Ppt Gallery Aids PDF. The topics addressed in these templates are Revenue Comparison, Top Selling Categories, New Customer. All the content presented in this PPT design is completely editable. Download it and make adjustments in color, background, font etc. as per your unique business setting.
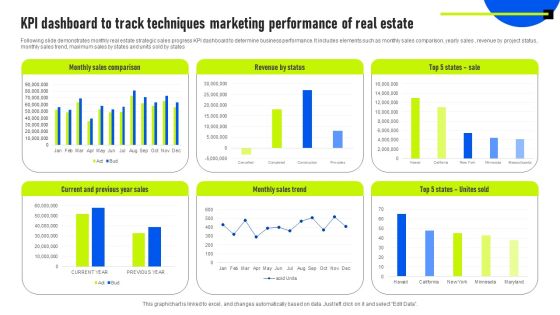
KPI Dashboard To Track Techniques Marketing Performance Of Real Estate Information PDF
Following slide demonstrates monthly real estate strategic sales progress KPI dashboard to determine business performance. It includes elements such as monthly sales comparison, yearly sales , revenue by project status, monthly sales trend, maximum sales by states and units sold by states. Showcasing this set of slides titled KPI Dashboard To Track Techniques Marketing Performance Of Real Estate Information PDF. The topics addressed in these templates are Revenue By Status, Monthly Sales Comparison, Monthly Sales Trend. All the content presented in this PPT design is completely editable. Download it and make adjustments in color, background, font etc. as per your unique business setting.

Sales Employee Representative Performance Scorecard Dashboard For Healthcare Industry Clipart PDF
This slide showcases sales performance of healthcare products which can be used by managers to evaluate business achievements. It includes key components such as monthly sales comparison, sales performance of products by different channels, sales team performance. Pitch your topic with ease and precision using this Sales Employee Representative Performance Scorecard Dashboard For Healthcare Industry Clipart PDF. This layout presents information on Monthly Sales Comparison, Revenue By Previous Year, Sales Performance, Different Products, Different Channels, Sales Team Performance . It is also available for immediate download and adjustment. So, changes can be made in the color, design, graphics or any other component to create a unique layout.
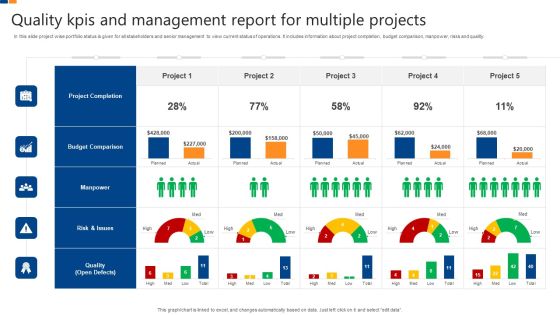
Quality Kpis And Management Report For Multiple Projects Elements PDF
In this slide project wise portfolio status is given for all stakeholders and senior management to view current status of operations. It includes information about project completion, budget comparison, manpower, risks and quality. Pitch your topic with ease and precision using this Quality Kpis And Management Report For Multiple Projects Elements PDF. This layout presents information on Project Completion, Budget Comparison, Manpower, Risks And Quality. It is also available for immediate download and adjustment. So, changes can be made in the color, design, graphics or any other component to create a unique layout.
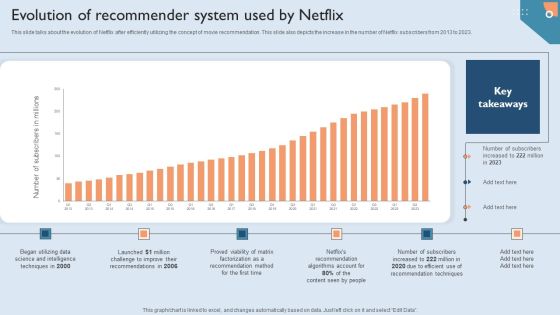
Recommendation Techniques Evolution Of Recommender System Used By Netflix Designs PDF
This slide talks about the evolution of Netflix after efficiently utilizing the concept of movie recommendation. This slide also depicts the increase in the number of Netflix subscribers from 2013 to 2023. Are you searching for a Recommendation Techniques Evolution Of Recommender System Used By Netflix Designs PDF that is uncluttered, straightforward, and original Its easy to edit, and you can change the colors to suit your personal or business branding. For a presentation that expresses how much effort you have put in, this template is ideal With all of its features, including tables, diagrams, statistics, and lists, its perfect for a business plan presentation. Make your ideas more appealing with these professional slides. Download Recommendation Techniques Evolution Of Recommender System Used By Netflix Designs PDF from Slidegeeks today.
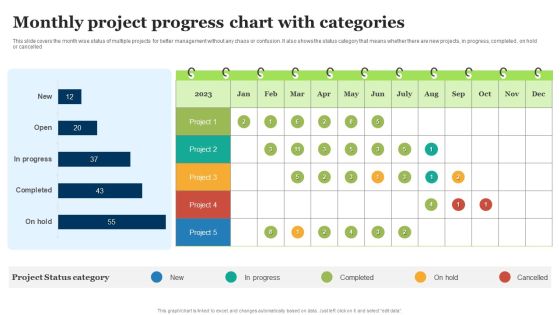
Monthly Project Progress Chart With Categories Ppt Professional Outfit PDF
This slide covers the month wise status of multiple projects for better management without any chaos or confusion. It also shows the status category that means whether there are new projects, in progress, completed , on hold or cancelled. Pitch your topic with ease and precision using this Monthly Project Progress Chart With Categories Ppt Professional Outfit PDF. This layout presents information on Project Status Category, Completed, Progress. It is also available for immediate download and adjustment. So, changes can be made in the color, design, graphics or any other component to create a unique layout.

Economic Facts And Insights Dashboard For Cash Management Ppt PowerPoint Presentation Outline Guide PDF
Pitch your topic with ease and precision using this economic facts and insights dashboard for cash management ppt powerpoint presentation outline guide pdf. This layout presents information on days sales outstanding, days inventory outstanding, days payable outstanding, accounts payable by payment target, inventory, ar turnover vs ap turnover. It is also available for immediate download and adjustment. So, changes can be made in the color, design, graphics or any other component to create a unique layout.

 Home
Home