Comparison Bar Graph

Product Pricing Table Ppt PowerPoint Presentation File Deck
This is a product pricing table ppt powerpoint presentation file deck. This is a four stage process. The stages in this process are comparison chart, comparison table, comparison matrix.
Service Marketing Example Ppt PowerPoint Presentation Styles Example File
This is a service marketing example ppt powerpoint presentation styles example file. This is a two stage process. The stages in this process are comparison chart, comparison table, comparison matrix.
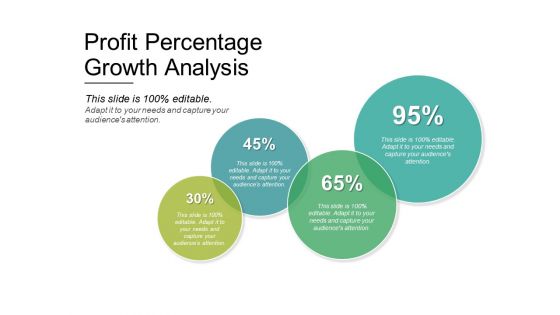
Profit Percentage Growth Analysis Ppt PowerPoint Presentation Layouts Graphics Tutorials
This is a profit percentage growth analysis ppt powerpoint presentation layouts graphics tutorials. This is a four stage process. The stages in this process are comparison chart, comparison table, comparison matrix.
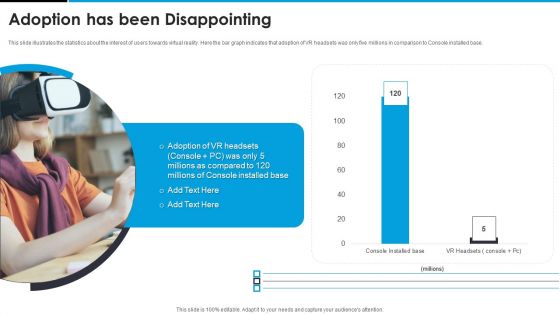
Sandbox VR Venture Capital Financing Pitch Deck Adoption Has Been Disappointing Information PDF
This slide illustrates the statistics about the interest of users towards virtual reality. Here the bar graph indicates that adoption of VR headsets was only five millions in comparison to Console installed base. Deliver an awe inspiring pitch with this creative sandbox vr venture capital financing pitch deck adoption has been disappointing information pdf bundle. Topics like adoption has been disappointing can be discussed with this completely editable template. It is available for immediate download depending on the needs and requirements of the user.
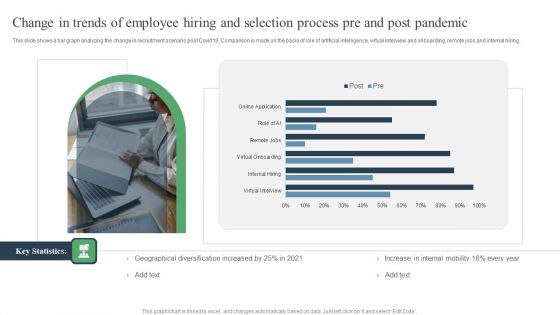
Change In Trends Of Employee Hiring And Selection Process Pre And Post Pandemic Ppt PowerPoint Presentation Images PDF
This slide shows a bar graph analyzing the change in recruitment scenario post Covid19. Comparison is made on the basis of role of artificial intelligence, virtual interview and onboarding, remote jobs and internal hiring. Showcasing this set of slides titled Change In Trends Of Employee Hiring And Selection Process Pre And Post Pandemic Ppt PowerPoint Presentation Images PDF. The topics addressed in these templates are Geographical Diversification, Internal Mobility, Virtual Onboarding. All the content presented in this PPT design is completely editable. Download it and make adjustments in color, background, font etc. as per your unique business setting.

Agile Crystal Techniques Crystal Methodology Implementation Dashboard Themes PDF
This slide represents the crystal methodology implementation dashboard by covering annual gross revenue, product type comparison, sales rep comparison and top 10 clients. Deliver an awe inspiring pitch with this creative Agile Crystal Techniques Crystal Methodology Implementation Dashboard Themes PDF bundle. Topics like Monthly Sales Trend, Sales Rep Comparison, Product Type Comparison can be discussed with this completely editable template. It is available for immediate download depending on the needs and requirements of the user.
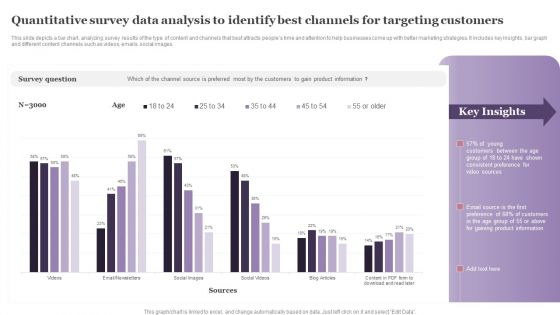
Quantitative Survey Data Analysis To Identify Best Channels For Targeting Customers Formats PDF
This slide depicts a bar chart, analyzing survey results of the type of content and channels that best attracts peoples time and attention to help businesses come up with better marketing strategies. It includes key insights, bar graph and different content channels such as videos, emails, social images. Pitch your topic with ease and precision using this Quantitative Survey Data Analysis To Identify Best Channels For Targeting Customers Formats PDF. This layout presents information on Survey Question, Young Customers, Consistent Preference. It is also available for immediate download and adjustment. So, changes can be made in the color, design, graphics or any other component to create a unique layout.
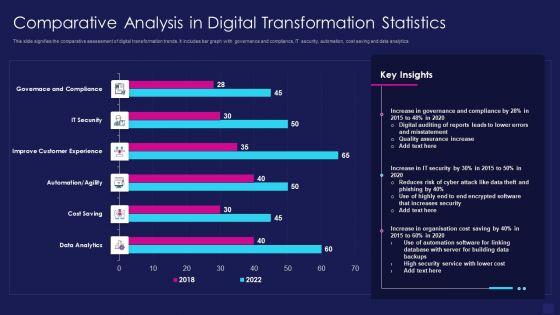
Comparative Analysis In Digital Transformation Statistics Graphics PDF
This slide signifies the comparative assessment of digital transformation trends. It includes bar graph with governance and compliance, IT security, automation, cost saving and data analytics. Showcasing this set of slides titled comparative analysis in digital transformation statistics graphics pdf. The topics addressed in these templates are data analytics, cost saving, improve customer experience. All the content presented in this PPT design is completely editable. Download it and make adjustments in color, background, font etc. as per your unique business setting.

Project Metrics Dashboard With Monthly Sales Professional PDF
This slide focuses on project management dashboard which states the progress of the project, spending on designing, developing and testing of project, monthly sales graph using bar and line chart with number of sales and referrals in 12 months. Pitch your topic with ease and precision using this Project Metrics Dashboard With Monthly Sales Professional PDF. This layout presents information on Project Progress, Project Spend, Sales Graph. It is also available for immediate download and adjustment. So, changes can be made in the color, design, graphics or any other component to create a unique layout.

Income Assessment Document Key Average Salary Given To Employees By Introduction PDF
This slide shows the average compensation structure given to the employees and has been compared with other competitive salaries. It shows the comparison by years of experience, salary by education, and average bonus rate received by the employee. Deliver and pitch your topic in the best possible manner with this Income Assessment Document Key Average Salary Given To Employees By Introduction PDF. Use them to share invaluable insights on Salary Comparison, Years Experience, Salary Comparison Education and impress your audience. This template can be altered and modified as per your expectations. So, grab it now.

Quality Improvement In Healthcare Institutions And Hospitals Ideas PDF
This slide shows a bar graph of quality improvement in healthcare institutions. Main components covered are patient satisfaction, reducing readmissions and cost savings.Showcasing this set of slides titled Quality Improvement In Healthcare Institutions And Hospitals Ideas PDF The topics addressed in these templates are Improvement Initiatives, Healthcare Institutes ,Focusing Improving All the content presented in this PPT design is completely editable. Download it and make adjustments in color, background, font etc. as per your unique business setting.
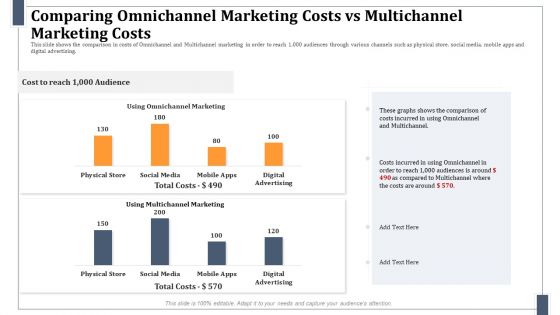
Comparing Omnichannel Marketing Costs Vs Multichannel Marketing Costs Professional PDF
This slide shows the comparison in costs of Omnichannel and Multichannel marketing in order to reach 1,000 audiences through various channels such as physical store, social media, mobile apps and digital advertising. Deliver an awe inspiring pitch with this creative comparing omnichannel marketing costs vs multichannel marketing costs professional pdf bundle. Topics like digital advertising, multichannel marketing, comparison can be discussed with this completely editable template. It is available for immediate download depending on the needs and requirements of the user.
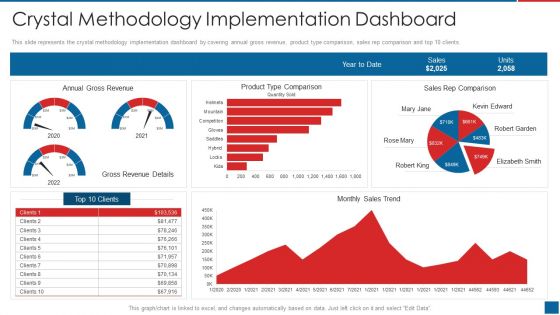
Agile Crystal Method Crystal Methodology Implementation Dashboard Pictures PDF
This slide represents the crystal methodology implementation dashboard by covering annual gross revenue, product type comparison, sales rep comparison and top 10 clients.Deliver an awe inspiring pitch with this creative Agile Crystal Method Crystal Methodology Implementation Dashboard Pictures PDF bundle. Topics like Crystal Methodology Implementation Dashboard can be discussed with this completely editable template. It is available for immediate download depending on the needs and requirements of the user.
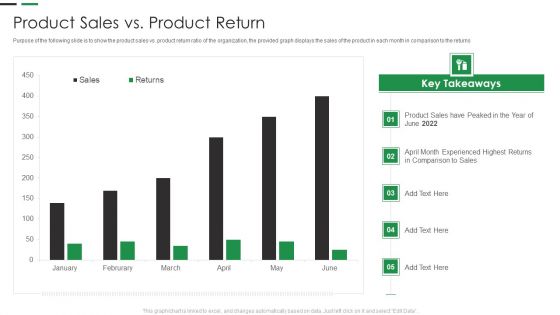
Evaluating New Commodity Impact On Market Product Sales Vs Product Return Template PDF
Purpose of the following slide is to show the product sales vs. product return ratio of the organization, the provided graph displays the sales of the product in each month in comparison to the returns Deliver an awe inspiring pitch with this creative Evaluating New Commodity Impact On Market Product Sales Vs Product Return Template PDF bundle. Topics like Experienced Highest, Returns Comparison, Key Takeaways can be discussed with this completely editable template. It is available for immediate download depending on the needs and requirements of the user.

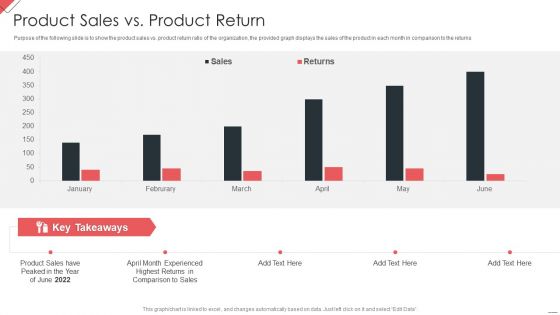
Performance Analysis Of New Product Development Product Sales Vs Product Return Infographics PDF
Purpose of the following slide is to show the product sales vs. product return ratio of the organization, the provided graph displays the sales of the product in each month in comparison to the returns. Deliver an awe inspiring pitch with this creative performance analysis of new product development product sales vs product return infographics pdf bundle. Topics like comparison, sales, returns can be discussed with this completely editable template. It is available for immediate download depending on the needs and requirements of the user.
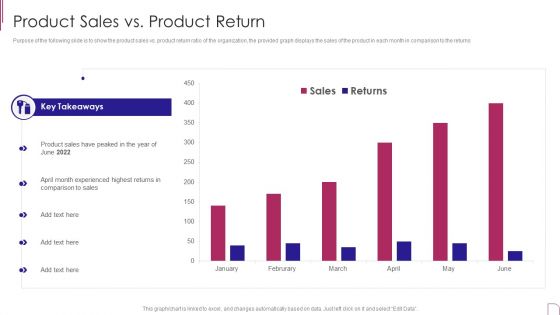
New Commodity Market Viability Review Product Sales Vs Product Return Mockup PDF
Purpose of the following slide is to show the product sales vs. product return ratio of the organization, the provided graph displays the sales of the product in each month in comparison to the returns Deliver an awe inspiring pitch with this creative New Commodity Market Viability Review Product Sales Vs Product Return Mockup PDF bundle. Topics like Product Sales, Comparison Sales, Highest Returns can be discussed with this completely editable template. It is available for immediate download depending on the needs and requirements of the user.
Yearly Product Performance Assessment Repor Product Sales Vs Product Return Information PDF
Purpose of the following slide is to show the product sales vs. product return ratio of the organization, the provided graph displays the sales of the product in each month in comparison to the returns.Deliver an awe inspiring pitch with this creative Yearly Product Performance Assessment Repor Product Sales Vs Product Return Information PDF bundle. Topics like Key Takeaways, Experienced Highest, Comparison Sales can be discussed with this completely editable template. It is available for immediate download depending on the needs and requirements of the user.

Pricing Benchmarks Analysis Dashboard For Manufacturing Company Structure PDF
This slide represents the price benchmarking comparison report of manufacturing company. It includes information related to gross and profit margin and revenue growth of all organizations along with graph showing benchmark index comparison from industry average. Pitch your topic with ease and precision using this Pricing Benchmarks Analysis Dashboard For Manufacturing Company Structure PDF. This layout presents information on Pricing Benchmarks Analysis, Dashboard For Manufacturing Company. It is also available for immediate download and adjustment. So, changes can be made in the color, design, graphics or any other component to create a unique layout.
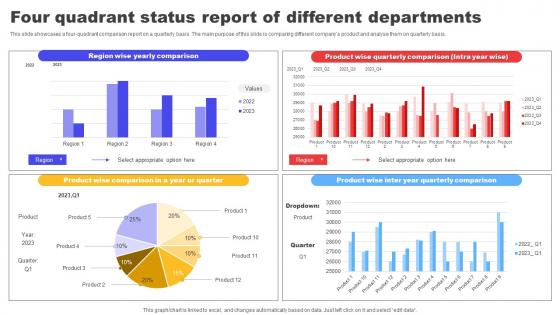
Four Quadrant Status Report Of Different Departments Clipart pdf
This slide showcases a four-quadrant comparison report on a quarterly basis. The main purpose of this slide is comparing different companys product and analyse them on quarterly basis. Pitch your topic with ease and precision using this Four Quadrant Status Report Of Different Departments Clipart pdf. This layout presents information on Region Wise,Yearly Comparison,Product Wise Compariso. It is also available for immediate download and adjustment. So, changes can be made in the color, design, graphics or any other component to create a unique layout.

Engage Customers Ppt PowerPoint Presentation Summary Portrait
This is a business structure comparison chart ppt powerpoint presentation infographic template vector. This is a three stage process. The stages in this process are business structure comparison chart.
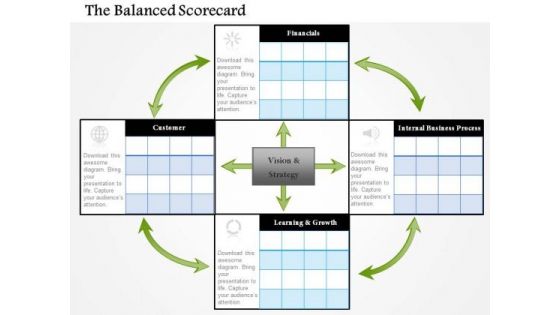
Business Framework The Balanced Scorecard PowerPoint Presentation
This business diagram displays framework for comparison chart. It contains matrix chart for comparison of four products. This diagram enables the users to create their own display of the required processes in an easy way.

Inventory Turnover Financial Ratios Chart Conversion Portrait PDF
This slide illustrates graph for inventory turnover ratio that can help company to analyze efficiency of inventory management. It showcases ratio graph comparison of 4 companies for a period of last 6 years Pitch your topic with ease and precision using this inventory turnover financial ratios chart conversion portrait pdf. This layout presents information on inventory turnover financial ratios chart conversion. It is also available for immediate download and adjustment. So, changes can be made in the color, design, graphics or any other component to create a unique layout.

Market Potential And Opportunity Size For The Company Ppt File Ideas PDF
The slide provides a the comparison graph of market size of online money transfer remittances mobile payment market. It covers the historical 2015-2020 as well as forecasted 2021-2026 data. Deliver an awe-inspiring pitch with this creative market potential and opportunity size for the company ppt file ideas pdf bundle. Topics like market potential and opportunity size for the company can be discussed with this completely editable template. It is available for immediate download depending on the needs and requirements of the user.

Software Developer Playbook Kpi Dashboard To Measure Overall Business Performance Topics PDF
This graph or chart is linked to excel, and changes automatically based on data. Just left click on it and select Edit Data. Deliver and pitch your topic in the best possible manner with this software developer playbook kpi dashboard to measure overall business performance topics pdf. Use them to share invaluable insights on revenue new customers, gross profit, customer satisfaction, sales comparison and impress your audience. This template can be altered and modified as per your expectations. So, grab it now.

Buy Side M And A Service Management Vs Consensus Revenue Forecast Introduction PDF
The graph depicts a revenue comparison between management and consensus. It shows historical 2015 to 2020 and projected revenue 2021 to 2024. There are so many reasons you need a Buy Side M And A Service Management Vs Consensus Revenue Forecast Introduction PDF. The first reason is you can not spend time making everything from scratch, Thus, Slidegeeks has made presentation templates for you too. You can easily download these templates from our website easily.

ALM Optimizing The Profit Generated By Your Assets How Much Will It Cost To Replace The Asset Microsoft PDF
In this slide we have provided you with a graph that displays the total replacement cost of multiple assets and a brief analysis of the same. Deliver an awe inspiring pitch with this creative alm optimizing the profit generated by your assets how much will it cost to replace the asset microsoft pdf bundle. Topics like replacement cost, comparison can be discussed with this completely editable template. It is available for immediate download depending on the needs and requirements of the user.

People Are Using More Phone Than Banks Virtual Currency Financing Pitch Deck Graphics PDF
The slide provides the comparison graph of number of mobile users and number of bank accounts from the year 2014 to 2021. Deliver an awe inspiring pitch with this creative people are using more phone than banks virtual currency financing pitch deck graphics pdf bundle. Topics like people are using more phone than banks can be discussed with this completely editable template. It is available for immediate download depending on the needs and requirements of the user.
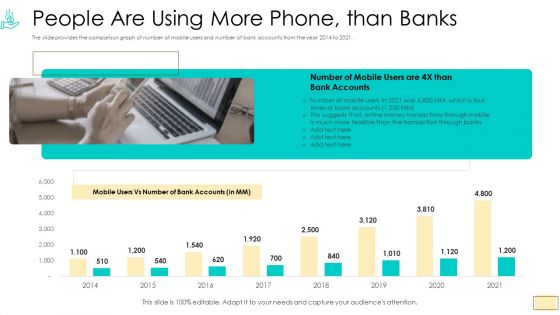
Investor Pitch Ppt For Crypto Funding People Are Using More Phone Than Banks Download PDF
The slide provides the comparison graph of number of mobile users and number of bank accounts from the year 2014 to 2021.Deliver an awe-inspiring pitch with this creative investor pitch ppt for crypto funding people are using more phone than banks download pdf. bundle. Topics like 2014 to 2021 can be discussed with this completely editable template. It is available for immediate download depending on the needs and requirements of the user.

Investor Pitch Ppt Raise Finances Crypto Initial Public Offering People Are Using More Phonethan Banks Summary PDF
The slide provides the comparison graph of number of mobile users and number of bank accounts from the year 2013 to 2021.Deliver an awe-inspiring pitch with this creative investor pitch ppt raise finances crypto initial public offering people are using more phonethan banks summary pdf. bundle. Topics like 2014 to 2021 can be discussed with this completely editable template. It is available for immediate download depending on the needs and requirements of the user.

Investor Pitch Deck To Generate Capital From Initial Currency Offering People Are Using More Phone Than Banks Clipart PDF
The slide provides the comparison graph of number of mobile users and number of bank accounts from the year 2014 to 2021.Deliver an awe-inspiring pitch with this creative investor pitch deck to generate capital from initial currency offering people are using more phone than banks clipart pdf bundle. Topics like people are using more phone than banks can be discussed with this completely editable template. It is available for immediate download depending on the needs and requirements of the user.

Russia Ukraine War Influence On Airline Sector Decrease In Flight Search History Of Users Sample PDF
This slide illustrates graph which provides details about user search history for airline bookings. It also showcases comparison of forecasted figures with actual data Deliver an awe inspiring pitch with this creative russia ukraine war influence on airline sector decrease in flight search history of users sample pdf bundle. Topics like decrease in flight search history of users can be discussed with this completely editable template. It is available for immediate download depending on the needs and requirements of the user.
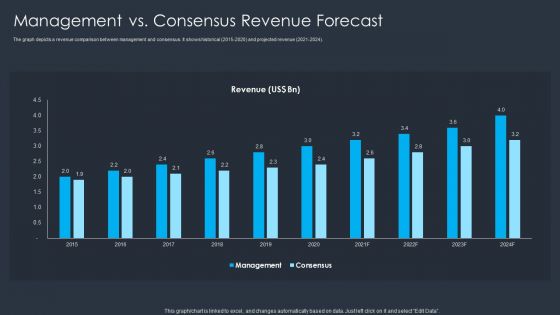
Merger And Acquisition Buying Strategy For Business Growth Management Vs Consensus Revenue Forecast Designs PDF
The graph depicts a revenue comparison between management and consensus. It shows historical 2015 to 2020 and projected revenue 2021 to 2024. Deliver and pitch your topic in the best possible manner with this Merger And Acquisition Buying Strategy For Business Growth Management Vs Consensus Revenue Forecast Designs PDF. Use them to share invaluable insights on Management, Consensus Revenue Forecast and impress your audience. This template can be altered and modified as per your expectations. So, grab it now.
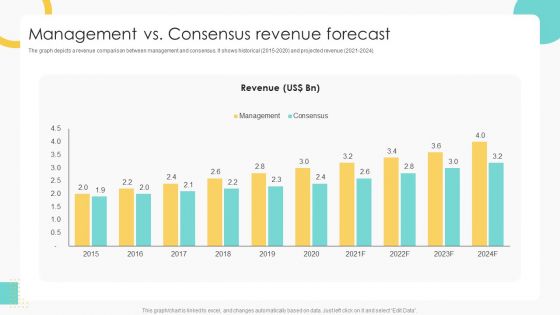
Buy Side Merger And Acquisition Pitch Book Management Vs Consensus Revenue Forecast Brochure PDF
The graph depicts a revenue comparison between management and consensus. It shows historical 2015 2020 and projected revenue 2021 2024. Deliver and pitch your topic in the best possible manner with this Buy Side Merger And Acquisition Pitch Book Management Vs Consensus Revenue Forecast Brochure PDF. Use them to share invaluable insights on Management, Consensus Revenue Forecast and impress your audience. This template can be altered and modified as per your expectations. So, grab it now.
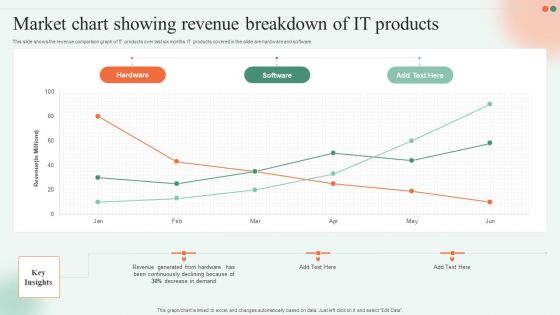
Market Chart Showing Revenue Breakdown Of IT Products Ppt File Elements PDF
This slide shows the revenue comparison graph of IT products over last six months. IT products covered in the slide are hardware and software. Pitch your topic with ease and precision using this Market Chart Showing Revenue Breakdown Of IT Products Ppt File Elements PDF. This layout presents information on Hardware, Software, Key Insights. It is also available for immediate download and adjustment. So, changes can be made in the color, design, graphics or any other component to create a unique layout.
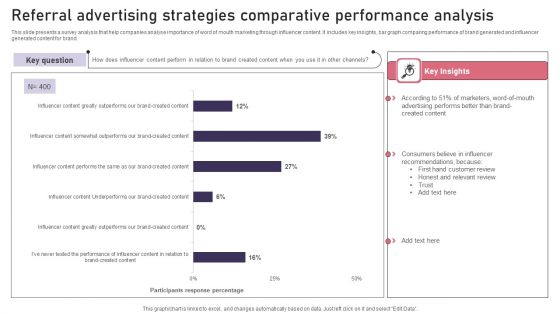
Referral Advertising Strategies Comparative Performance Analysis Diagrams PDF
This slide presents a survey analysis that help companies analyse importance of word of mouth marketing through influencer content. It includes key insights, bar graph comparing performance of brand generated and influencer generated content for brand. Showcasing this set of slides titled Referral Advertising Strategies Comparative Performance Analysis Diagrams PDF. The topics addressed in these templates are Referral Advertising, Strategies Comparative, Performance Analysis. All the content presented in this PPT design is completely editable. Download it and make adjustments in color, background, font etc. as per your unique business setting.

Business Framework Building Blocks In A Pyramid PowerPoint Presentation
This power point diagram slide has been crafted with graphic of building blocks in a pyramid shape. This PPT slide displays the concept of comparison product launch. Use this image for production and business related presentations.
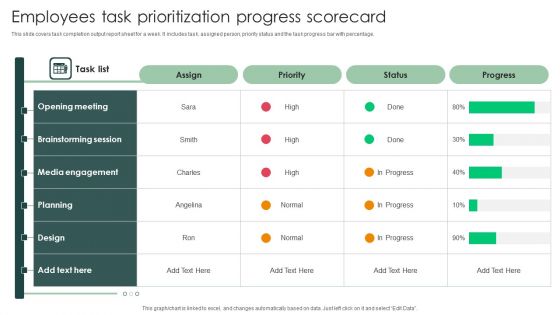
Employees Task Prioritization Progress Scorecard Download PDF
This slide covers task completion output report sheet for a week. It includes task, assigned person, priority status and the task progress bar with percentage.Pitch your topic with ease and precision using this Employees Task Prioritization Progress Scorecard Download PDF. This layout presents information on Communication Skills Development, Manager Training, Area Sales . It is also available for immediate download and adjustment. So, changes can be made in the color, design, graphics or any other component to create a unique layout.
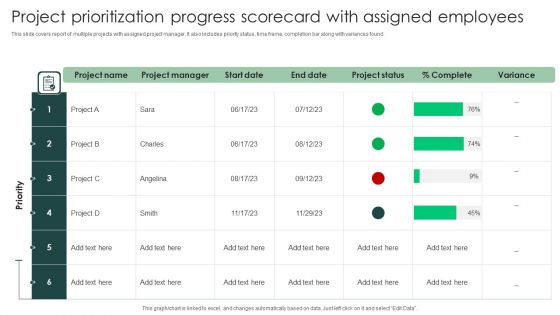
Project Prioritization Progress Scorecard With Assigned Employees Diagrams PDF
This slide covers report of multiple projects with assigned project manager. It also includes priority status, time frame, completion bar along with variances found. Pitch your topic with ease and precision using this Project Prioritization Progress Scorecard With Assigned Employees Diagrams PDF. This layout presents information on Project Prioritization, Progress Scorecard, Assigned Employees. It is also available for immediate download and adjustment. So, changes can be made in the color, design, graphics or any other component to create a unique layout.
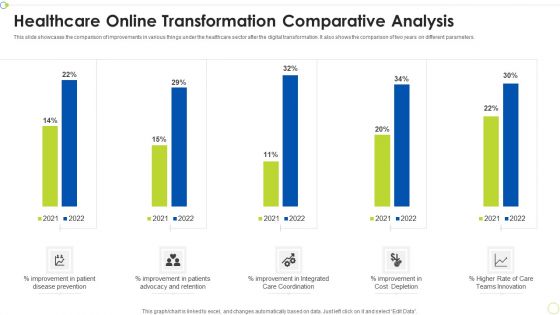
Healthcare Online Transformation Comparative Analysis Ppt PowerPoint Presentation File Sample PDF
This slide showcases the comparison of improvements in various things under the healthcare sector after the digital transformation. It also shows the comparison of two years on different parameters. Showcasing this set of slides titled Healthcare Online Transformation Comparative Analysis Ppt PowerPoint Presentation File Sample PDF. The topics addressed in these templates are Healthcare Online, Transformation, Comparative Analysis. All the content presented in this PPT design is completely editable. Download it and make adjustments in color, background, font etc. as per your unique business setting.

Dashboard Of Property Operations And Maintenance Ppt Infographic Template Objects PDF
This slide focuses on maintenance dashboard for certified reliability engineer which covers team efficiency, cumulative savings, planned maintenance, chiller performance analysis, portfolio comparison, alarm and fault diagnostics, etc. Pitch your topic with ease and precision using this Dashboard Of Property Operations And Maintenance Ppt Infographic Template Objects PDF. This layout presents information on Planned Maintenance Efficiency, Chiller Performance Analysis, Portfolio Comparison Team, Alarm And Fault. It is also available for immediate download and adjustment. So, changes can be made in the color, design, graphics or any other component to create a unique layout.

Income Assessment Document Industry Payroll Trends Ppt Pictures Deck PDF
This slide represents key statistics of employees working in US region. It shows average salary based on employee experience, education, and average bonus rate should be receive to full time employees. This slide also helps in making comparison with company compensation structure. Deliver and pitch your topic in the best possible manner with this Income Assessment Document Industry Payroll Trends Ppt Pictures Deck PDF. Use them to share invaluable insights on Salary Comparison, Years Experience, Average Annual Salary and impress your audience. This template can be altered and modified as per your expectations. So, grab it now.
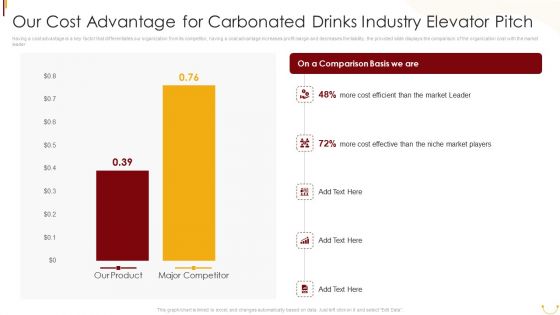
Our Cost Advantage For Carbonated Drinks Industry Elevator Pitch Ppt PowerPoint Presentation File Model PDF
Having a cost advantage is a key factor that differentiates our organization from its competitor, having a cost advantage increases profit margin and decreases the liability, the provided slide displays the comparison of the organization cost with the market leader. Deliver an awe inspiring pitch with this creative Our Cost Advantage For Carbonated Drinks Industry Elevator Pitch Ppt PowerPoint Presentation File Model PDF bundle. Topics like Comparison Basis, Our Product, Major Competitor, Niche Market Players, Market Leader can be discussed with this completely editable template. It is available for immediate download depending on the needs and requirements of the user.
Soft Drink Company Executive Report Overview Icons PDF
This slide illustrate soft drink manufacturing company overview along with its vision and mission statement. It includes elements such as company background, key facts about company, sales, revenue and cost of goods comparison etc. Pitch your topic with ease and precision using this Soft Drink Company Executive Report Overview Icons PDF. This layout presents information on Vision, Products, Financial Comparison. It is also available for immediate download and adjustment. So, changes can be made in the color, design, graphics or any other component to create a unique layout.
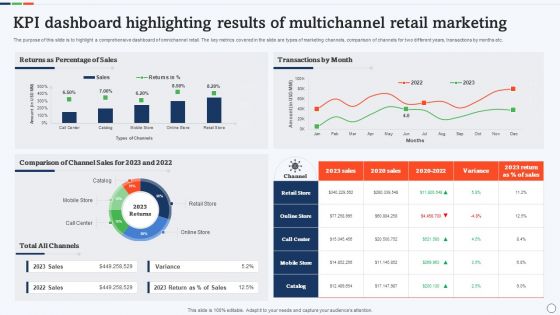
KPI Dashboard Highlighting Results Of Multichannel Retail Marketing Rules PDF
The purpose of this slide is to highlight a comprehensive dashboard of omnichannel retail. The key metrics covered in the slide are types of marketing channels, comparison of channels for two different years, transactions by months etc. Pitch your topic with ease and precision using this KPI Dashboard Highlighting Results Of Multichannel Retail Marketing Rules PDF. This layout presents information on Comparison Of Channel Sales, Percentage Of Sales, Transactions By Month. It is also available for immediate download and adjustment. So, changes can be made in the color, design, graphics or any other component to create a unique layout.
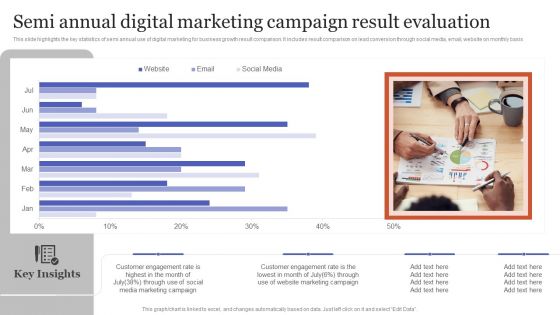
Semi Annual Digital Marketing Campaign Result Evaluation Topics PDF
This slide highlights the key statistics of semi annual use of digital marketing for business growth result comparison. It includes result comparison on lead conversion through social media, email, website on monthly basis. Pitch your topic with ease and precision using this Semi Annual Digital Marketing Campaign Result Evaluation Topics PDF. This layout presents information on Customer Engagement, Marketing Campaign, Through Social. It is also available for immediate download and adjustment. So, changes can be made in the color, design, graphics or any other component to create a unique layout.

Monthly Cost Comparative Analysis Of Advertising Expenditure Introduction PDF
This slide represents the bar graph on marketing monthly cost comparative analysis for increasing organisation revenue. It includes methods like online, catalogues, conventions, trade shows, print, radio and magazines Pitch your topic with ease and precision using this Monthly Cost Comparative Analysis Of Advertising Expenditure Introduction PDF This layout presents information on Monthly Cost Comparative Analysis Of Advertising Expenditure It is also available for immediate download and adjustment. So, changes can be made in the color, design, graphics or any other component to create a unique layout.
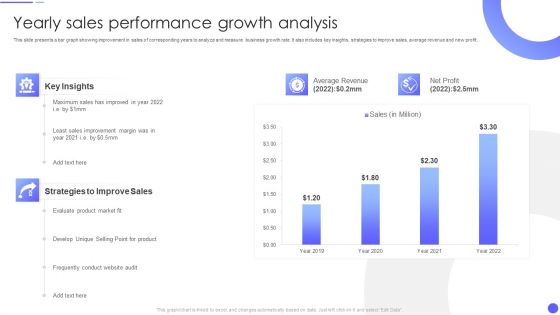
Yearly Sales Performance Growth Analysis Rules PDF
This slide presents a bar graph showing improvement in sales of corresponding years to analyze and measure business growth rate. It also includes key insights, strategies to improve sales, average revenue and new profit.Pitch your topic with ease and precision using this Yearly Sales Performance Growth Analysis Rules PDF This layout presents information on Average Revenue, Strategies To Improve, Sales Improvement It is also available for immediate download and adjustment. So, changes can be made in the color, design, graphics or any other component to create a unique layout.

Business Financial Highlights For Planning And Forecasting Background PDF
The slide shows bar graph showing actual and forecasted revenue, expenses and net profit of a company for various financial years. It is done to effectively conduct financial and investment planning for business growth and sustainability. Pitch your topic with ease and precision using this Business Financial Highlights For Planning And Forecasting Background PDF. This layout presents information on Revenue, Expenses And Costs, Net Profit. It is also available for immediate download and adjustment. So, changes can be made in the color, design, graphics or any other component to create a unique layout.

Allocation Of Funds Writing Enhancement Software Pitch Deck PPT Template
This slide presents stacked bar chart highlights areas where raised funds will be allocated. It includes areas such as reach expansion, product feature enhancement, security and communication. The Allocation Of Funds Writing Enhancement Software Pitch Deck PPT Template is a compilation of the most recent design trends as a series of slides. It is suitable for any subject or industry presentation, containing attractive visuals and photo spots for businesses to clearly express their messages. This template contains a variety of slides for the user to input data, such as structures to contrast two elements, bullet points, and slides for written information. Slidegeeks is prepared to create an impression.
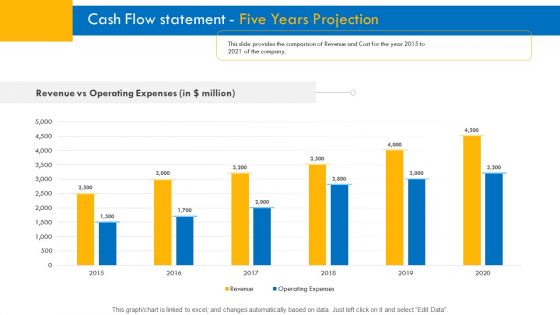
Investor Pitch Deck For Interim Financing Revenue Vs Cost Of The Company Graphics PDF
This slide provides the comparison of Revenue and Cost for the year 2015 to 2021 of the company.Deliver and pitch your topic in the best possible manner with this v. Use them to share invaluable insights on revenue vs cost of the company and impress your audience. This template can be altered and modified as per your expectations. So, grab it now.
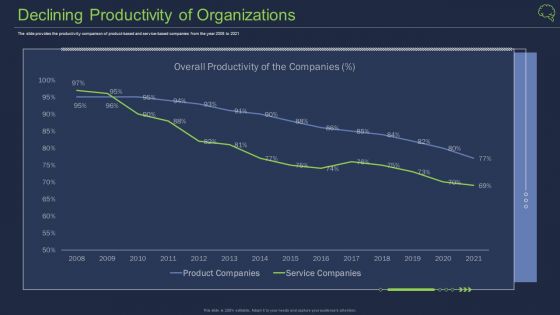
Declining Productivity Of Organizations Ppt Summary PDF
The slide provides the productivity comparison of product-based and service-based companies from the year 2008 to 2021 Deliver an awe inspiring pitch with this creative declining productivity of organizations ppt summary pdf bundle. Topics like declining productivity of organizations can be discussed with this completely editable template. It is available for immediate download depending on the needs and requirements of the user.
AIM Principles For Data Storage Application Cost Dashboard Ppt Icon Diagrams PDF
Deliver an awe inspiring pitch with this creative aim principles for data storage application cost dashboard ppt icon diagrams pdf bundle. Topics like investment, department, budget, cost, comparison can be discussed with this completely editable template. It is available for immediate download depending on the needs and requirements of the user.

Application Performance Management Application Cost Dashboard Ppt Ideas Inspiration PDF
Deliver an awe inspiring pitch with this creative application performance management application cost dashboard ppt ideas inspiration pdf bundle. Topics like investment, department, budget, cost, comparison can be discussed with this completely editable template. It is available for immediate download depending on the needs and requirements of the user.
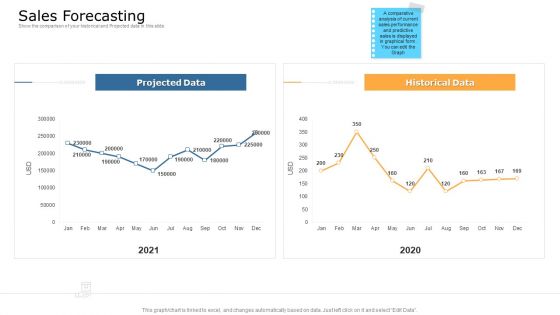
Commodity Unique Selling Proposition Sales Forecasting Diagrams PDF
Show the comparison of your historical and Projected data in this slide. Deliver and pitch your topic in the best possible manner with this commodity unique selling proposition sales forecasting diagrams pdf. Use them to share invaluable insights on sales forecasting and impress your audience. This template can be altered and modified as per your expectations. So, grab it now.
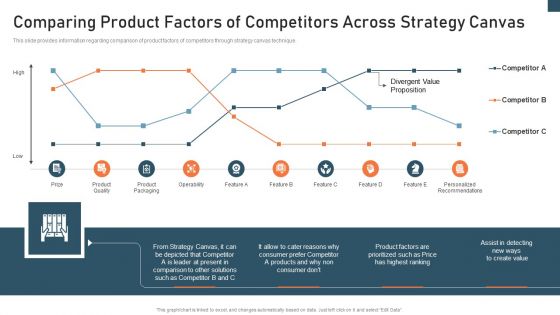
Planning And Action Playbook Comparing Product Factors Brochure PDF
This slide provides information regarding comparison of product factors of competitors through strategy canvas technique. Deliver an awe inspiring pitch with this creative planning and action playbook comparing product factors brochure pdf bundle. Topics like strategy, consumer, products can be discussed with this completely editable template. It is available for immediate download depending on the needs and requirements of the user.

Brand Valuation Scorecard With Social Selling Index Sample PDF
Deliver an awe inspiring pitch with this creative Brand Valuation Scorecard With Social Selling Index Sample PDF bundle. Topics like Content Marketing, Engagement Sources, Cms Comparison can be discussed with this completely editable template. It is available for immediate download depending on the needs and requirements of the user.
New Product Introduction In The Market Sales Dashboard Ppt PowerPoint Presentation Icon Graphics Download PDF
Presenting this set of slides with name new product introduction in the market sales dashboard ppt powerpoint presentation icon graphics download pdf. The topics discussed in these slides are top products revenue, product sale comparison 2019 2020, incremental sales campaign, cost goods sold. This is a completely editable PowerPoint presentation and is available for immediate download. Download now and impress your audience.

Monthly Planned Vs Actual Revenue Analysis Professional Pdf
This slide showcase monthly target sales with actual sales comparison with variance percentage calculation. It include monthly performance, variance, highest sales. Showcasing this set of slides titled Monthly Planned Vs Actual Revenue Analysis Professional Pdf The topics addressed in these templates are Monthly Planned, Actual Revenue Analysis All the content presented in this PPT design is completely editable. Download it and make adjustments in color, background, font etc. as per your unique business setting.

Visual Metrics For Variance Analysis Techniques And Models Mockup PDF
This slide covers the visual dashboard for Gap analysis model and method. It also contains action plan results, total problems and solution comparison function useful in analysing the gaps and loopholes in the value stream. Showcasing this set of slides titled visual metrics for variance analysis techniques and models mockup pdf. The topics addressed in these templates are total problems vs solutions, action plan results, problems vs solutions comparison. All the content presented in this PPT design is completely editable. Download it and make adjustments in color, background, font etc. as per your unique business setting.
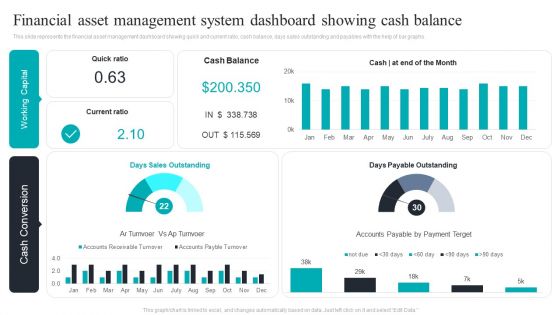
Financial Asset Management System Dashboard Showing Cash Balance Download PDF
This slide represents the financial asset management dashboard showing quick and current ratio, cash balance, days sales outstanding and payables with the help of bar graphs. Pitch your topic with ease and precision using this Financial Asset Management System Dashboard Showing Cash Balance Download PDF. This layout presents information on Financial Asset, Management System, Dashboard Showing, Cash Balance. It is also available for immediate download and adjustment. So, changes can be made in the color, design, graphics or any other component to create a unique layout.

 Home
Home