Chart Analysis

Chart Indicating Actual Vs Forecasted Gap Analysis Ppt PowerPoint Presentation Gallery Slides PDF
Presenting this set of slides with name chart indicating actual vs forecasted gap analysis ppt powerpoint presentation gallery slides pdf. The topics discussed in these slides are sales, target, revenue. This is a completely editable PowerPoint presentation and is available for immediate download. Download now and impress your audience.
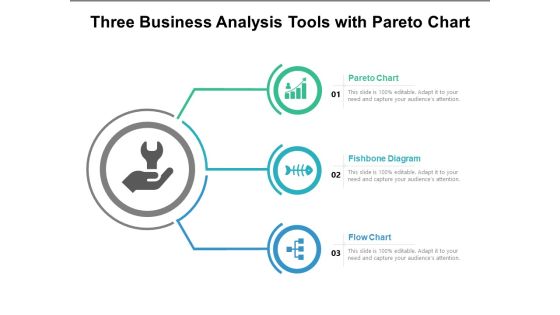
Three Business Analysis Tools With Pareto Chart Ppt PowerPoint Presentation Layouts Vector PDF
Presenting this set of slides with name three business analysis tools with pareto chart ppt powerpoint presentation layouts vector pdf. This is a three stage process. The stages in this process are pareto chart, fishbone diagram, flow chart. This is a completely editable PowerPoint presentation and is available for immediate download. Download now and impress your audience.
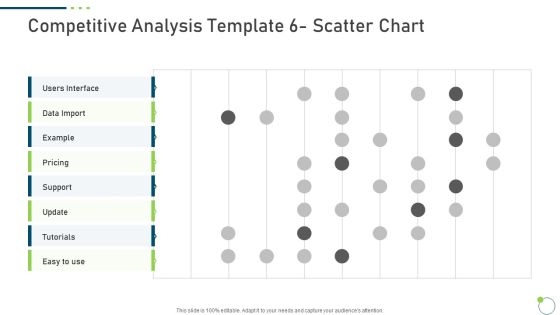
Investor Pitch Deck New Venture Capital Raising Competitive Analysis Template 6 Scatter Chart Data Sample PDF
Deliver and pitch your topic in the best possible manner with this investor pitch deck new venture capital raising competitive analysis template 6 scatter chart data sample pdf. Use them to share invaluable insights on pricing, tutorials, data import, support and impress your audience. This template can be altered and modified as per your expectations. So, grab it now.
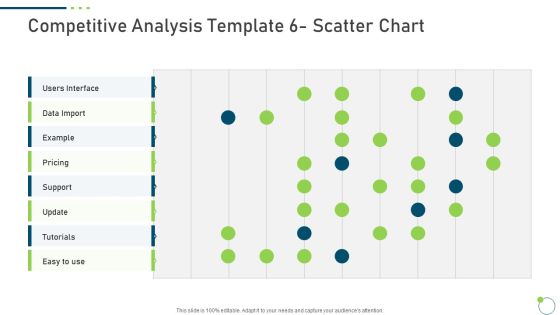
Investor Pitch Deck New Venture Capital Raising Competitive Analysis Template 6 Scatter Chart Pricing Portrait PDF
Deliver an awe inspiring pitch with this creative investor pitch deck new venture capital raising competitive analysis template 6 scatter chart pricing portrait pdf bundle. Topics like pricing, tutorials, data import, support can be discussed with this completely editable template. It is available for immediate download depending on the needs and requirements of the user.

Investor Pitch Deck New Venture Capital Raising Competitive Analysis Template 8 Matrix Chart Inspiration PDF
Deliver and pitch your topic in the best possible manner with this investor pitch deck new venture capital raising competitive analysis template 8 matrix chart inspiration pdf. Use them to share invaluable insights on price, product fidelity, service, sales and impress your audience. This template can be altered and modified as per your expectations. So, grab it now.
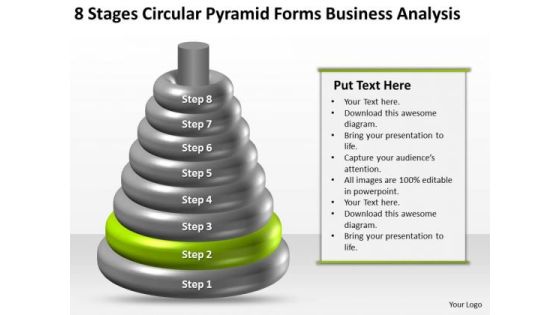
Business Diagram Chart 8 Stages Circular Pyramid Forms Analysis PowerPoint Template
We present our business diagram chart 8 stages circular pyramid forms analysis PowerPoint template.Use our Marketing PowerPoint Templates because Our PowerPoint Templates and Slides help you pinpoint your timelines. Highlight the reasons for your deadlines with their use. Download and present our Finance PowerPoint Templates because You should Throw the gauntlet with our PowerPoint Templates and Slides. They are created to take up any challenge. Download and present our Funnels PowerPoint Templates because Our PowerPoint Templates and Slides help you pinpoint your timelines. Highlight the reasons for your deadlines with their use. Download our Layers PowerPoint Templates because Our PowerPoint Templates and Slides will let your words and thoughts hit bullseye everytime. Use our Business PowerPoint Templates because Our PowerPoint Templates and Slides will effectively help you save your valuable time. They are readymade to fit into any presentation structure. Use these PowerPoint slides for presentations relating to Diagram, website, isolated, item, corporation, business, concept, sign, render, hierarchy, visual, presentation, internet, template, shadow, circle, graphic, element, simple, shape, graph, modern, illustration, www, circular, chart, number, round, web, design, growth, pyramid, set, information, conceptual, sliced, rainbow. The prominent colors used in the PowerPoint template are Green, Gray, Black.

Business Diagram Chart 8 Stages Circular Pyramid Forms Analysis Ppt PowerPoint Template
We present our business diagram chart 8 stages circular pyramid forms analysis ppt PowerPoint template.Download and present our Marketing PowerPoint Templates because You have a driving passion to excel in your field. Our PowerPoint Templates and Slides will prove ideal vehicles for your ideas. Download and present our Finance PowerPoint Templates because Our PowerPoint Templates and Slides are specially created by a professional team with vast experience. They diligently strive to come up with the right vehicle for your brilliant Ideas. Download our Funnels PowerPoint Templates because Our PowerPoint Templates and Slides come in all colours, shades and hues. They help highlight every nuance of your views. Download and present our Layers PowerPoint Templates because It can be used to Set your controls for the heart of the sun. Our PowerPoint Templates and Slides will be the propellant to get you there. Download and present our Business PowerPoint Templates because Our PowerPoint Templates and Slides will Activate the energies of your audience. Get their creative juices flowing with your words.Use these PowerPoint slides for presentations relating to Diagram, website, isolated, item, corporation, business, concept, sign, render, hierarchy, visual, presentation, internet, template, shadow, circle, graphic, element, simple, shape, graph, modern, illustration, www, circular, chart, number, round, web, design, growth, pyramid, set, information, conceptual, sliced, rainbow. The prominent colors used in the PowerPoint template are Green, Gray, Black.

Business Diagram Chart 8 Stages Circular Pyramid Forms Analysis Ppt PowerPoint Templates
We present our business diagram chart 8 stages circular pyramid forms analysis ppt PowerPoint templates.Present our Marketing PowerPoint Templates because Our PowerPoint Templates and Slides are designed to help you succeed. They have all the ingredients you need. Present our Finance PowerPoint Templates because Our PowerPoint Templates and Slides will provide you the cutting edge. Slice through the doubts in the minds of your listeners. Download our Funnels PowerPoint Templates because Our PowerPoint Templates and Slides will fulfill your every need. Use them and effectively satisfy the desires of your audience. Download our Layers PowerPoint Templates because Our PowerPoint Templates and Slides will Activate the energies of your audience. Get their creative juices flowing with your words. Use our Business PowerPoint Templates because Our PowerPoint Templates and Slides offer you the widest possible range of options.Use these PowerPoint slides for presentations relating to Diagram, website, isolated, item, corporation, business, concept, sign, render, hierarchy, visual, presentation, internet, template, shadow, circle, graphic, element, simple, shape, graph, modern, illustration, www, circular, chart, number, round, web, design, growth, pyramid, set, information, conceptual, sliced, rainbow. The prominent colors used in the PowerPoint template are Yellow, Gray, Black.

1 Flow Chart With Magnifying Glass Showing Algorithm Analysis Ppt Slide
This image slide displays flow chart with magnifying glass in hand. This image slide has been designed with graphic of flow chart and magnifying glass in executive hand. Use this image slide to express views on steps for a process in business, social and technology presentations. This image slide will enhance the quality of your presentations.

Financial Charts And Graphs For Statistical Analysis Ppt Powerpoint Presentation Show Layout
This is a financial charts and graphs for statistical analysis ppt powerpoint presentation show layout. This is a four stage process. The stages in this process are business metrics, business kpi, business dashboard.
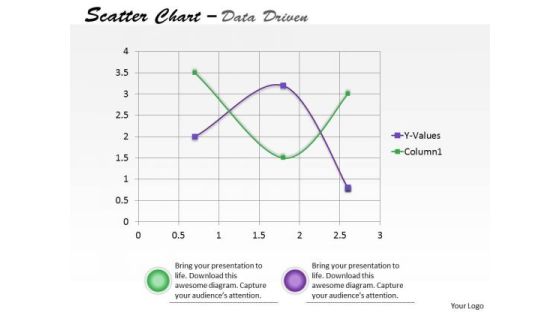
Data Analysis On Excel Driven Scatter Chart To Predict Future Movements PowerPoint Slides Templates
Our data analysis on excel driven scatter chart to predict future movements powerpoint slides Templates Enjoy Drama. They Provide Entertaining Backdrops.

Quantitative Data Analysis Driven Economic Status Line Chart PowerPoint Slides Templates
Be The Dramatist With Our quantitative data analysis driven economic status line chart powerpoint slides Templates . Script Out The Play Of Words.

Quantitative Data Analysis Driven Economic With Column Chart PowerPoint Slides Templates
Add Some Dramatization To Your Thoughts. Our quantitative data analysis driven economic with column chart powerpoint slides Templates Make Useful Props.
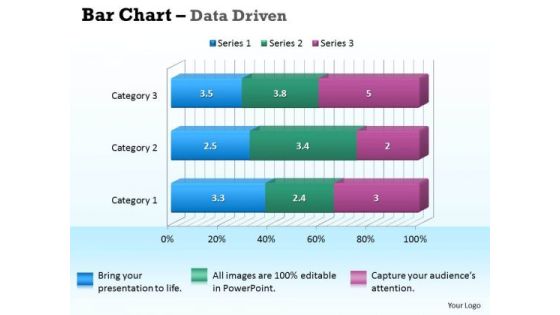
Data Analysis In Excel 3d Bar Chart For Business Information PowerPoint Templates
Our data analysis in excel 3d bar chart for business information Powerpoint Templates Deliver At Your Doorstep. Let Them In For A Wonderful Experience.
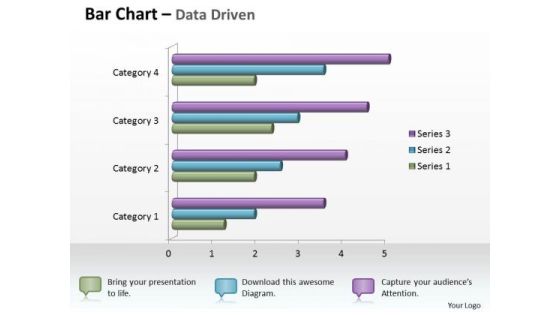
Data Analysis In Excel 3d Bar Chart For Business Statistics PowerPoint Templates
Knock On The Door To Success With Our data analysis in excel 3d bar chart for business statistics Powerpoint Templates . Be Assured Of Gaining Entry.

Data Analysis In Excel 3d Bar Chart For Business Trends PowerPoint Templates
Connect The Dots With Our data analysis in excel 3d bar chart for business trends Powerpoint Templates . Watch The Whole Picture Clearly Emerge.

Data Analysis In Excel 3d Bar Chart For Comparison Of Time Series PowerPoint Templates
Double Your Chances With Our data analysis in excel 3d bar chart for comparison of time series Powerpoint Templates . The Value Of Your Thoughts Will Increase Two-Fold.
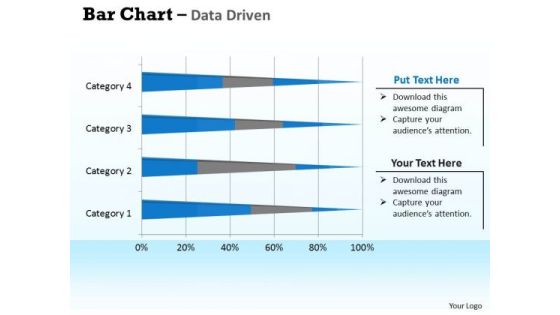
Data Analysis In Excel 3d Bar Chart For Interpretation PowerPoint Templates
Double Up Our data analysis in excel 3d bar chart for interpretation Powerpoint Templates With Your Thoughts. They Will Make An Awesome Pair.
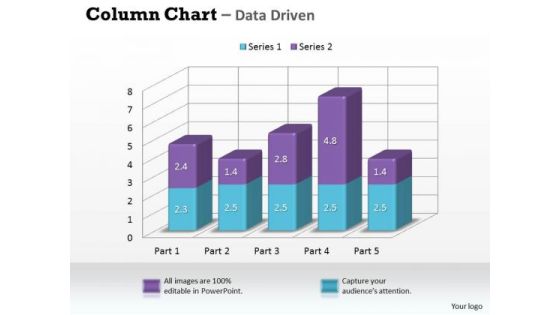
Data Analysis In Excel 3d Column Chart For Market Surveys PowerPoint Templates
Our data analysis in excel 3d column chart for market surveys Powerpoint Templates Leave No One In Doubt. Provide A Certainty To Your Views.

Data Analysis In Excel 3d Column Chart For Sets Of Information PowerPoint Templates
Double The Impact With Our data analysis in excel 3d column chart for sets of information Powerpoint Templates . Your Thoughts Will Have An Imposing Effect.

Data Analysis On Excel Driven Stock Chart For Business Growth PowerPoint Slides Templates
Add Some Dramatization To Your Thoughts. Our data analysis on excel driven stock chart for business growth powerpoint slides Templates Make Useful Props.

Data Analysis On Excel Driven Stock Chart For Market History PowerPoint Slides Templates
Draw Out The Best In You With Our data analysis on excel driven stock chart for market history powerpoint slides Templates . Let Your Inner Brilliance Come To The Surface.

Bar Chart With Magnifying Glass For Product Performance Analysis Ppt PowerPoint Presentation Gallery Example File PDF
Presenting bar chart with magnifying glass for product performance analysis ppt powerpoint presentation gallery example file pdf to dispense important information. This template comprises three stages. It also presents valuable insights into the topics including bar chart with magnifying glass for product performance analysis. This is a completely customizable PowerPoint theme that can be put to use immediately. So, download it and address the topic impactfully.

Data Analysis Icon Computer Monitor Bar Chart Ppt PowerPoint Presentation File Graphics Example PDF
Presenting this set of slides with name data analysis icon computer monitor bar chart ppt powerpoint presentation file graphics example pdf. This is a two stage process. The stages in this process are data analysis icon computer monitor bar chart. This is a completely editable PowerPoint presentation and is available for immediate download. Download now and impress your audience.
Statistical Analysis Icon With Gear Bar Chart Ppt PowerPoint Presentation Gallery Master Slide PDF
Presenting statistical analysis icon with gear bar chart ppt powerpoint presentation gallery master slide pdf to dispense important information. This template comprises three stages. It also presents valuable insights into the topics including statistical analysis icon with gear bar chart. This is a completely customizable PowerPoint theme that can be put to use immediately. So, download it and address the topic impactfully.

3d Stages Of Process Analysis 8 Concepts Cycle Spoke Chart PowerPoint Templates
We present our 3d stages of process analysis 8 concepts Cycle Spoke Chart PowerPoint templates.Present our Business PowerPoint Templates because infrastructure growth is an obvious requirement of today.inform your group on how exactly this potential is tailor made for you. Download and present our Circle Charts PowerPoint Templates because you can Unravel the desired and essential elements of your overall strategy. Present our Shapes PowerPoint Templates because Our PowerPoint Templates and Slides are specially created by a professional team with vast experience. They diligently strive to come up with the right vehicle for your brilliant Ideas. Download our Process and Flows PowerPoint Templates because you can Break it all down to Key Result Areas. Download and present our Success PowerPoint Templates because your quest has taken you well onto the path of success.Use these PowerPoint slides for presentations relating to Achieve, act, actions, around, arrows,assess, assessment, business, circle,concept, cycle, decide, decision,direction, illustration, isolated, plan,process, steps, strategy, succeed,symbol, isolated, isometric, market,motion, movement, organization, p perspective, presentation,process, processchart, recycle, report,ring, sign, step, stock. The prominent colors used in the PowerPoint template are Green dark , Gray, White. The feedback we get is that our 3d stages of process analysis 8 concepts Cycle Spoke Chart PowerPoint templates are designed by professionals The feedback we get is that our assessment PowerPoint templates and PPT Slides are Pretty. Presenters tell us our 3d stages of process analysis 8 concepts Cycle Spoke Chart PowerPoint templates are Royal. The feedback we get is that our actions PowerPoint templates and PPT Slides are Chic. PowerPoint presentation experts tell us our 3d stages of process analysis 8 concepts Cycle Spoke Chart PowerPoint templates are Nice. Customers tell us our arrows PowerPoint templates and PPT Slides are Nice.
Project Analysis Dashboard Icon With Pie Chart Ppt PowerPoint Presentation File Show PDF
Showcasing this set of slides titled project analysis dashboard icon with pie chart ppt powerpoint presentation file show pdf. The topics addressed in these templates are project analysis dashboard icon with pie chart. All the content presented in this PPT design is completely editable. Download it and make adjustments in color, background, font etc. as per your unique business setting.

Annual Product Sales Analysis With Three Column Bar Chart Ppt PowerPoint Presentation Inspiration Layouts PDF
Pitch your topic with ease and precision using this annual product sales analysis with three column bar chart ppt powerpoint presentation inspiration layouts pdf. This layout presents information on product sales, 2017 to 2020. It is also available for immediate download and adjustment. So, changes can be made in the color, design, graphics or any other component to create a unique layout.

3d Stages Of Process Analysis 8 Concepts Circular Flow Chart PowerPoint Slides
We present our 3d stages of process analysis 8 concepts Circular Flow Chart PowerPoint Slides.Use our Business PowerPoint Templates because it helps you to project your enthusiasm and single mindedness to your colleagues. Present our Circle Charts PowerPoint Templates because you should explain the process by which you intend to right it. Present our Shapes PowerPoint Templates because it outlines the process with this innovative graphic to authenticate your plan of achieving the goal of added value/profit. Present our Process and Flows PowerPoint Templates because it shows how one can contribute to the overall feeling of well-being. Download our Success PowerPoint Templates because iT outlines the entire thought process for the benefit of others. Tell it to the world with your characteristic aplomb.Use these PowerPoint slides for presentations relating to Abstract, arrow,blank, business, chart, circle, concept,connection, cycle, development,diagram, direction, element,environment, exchange, finance,financial, flow, graph, graphic, graphicpresentation, group, icon, illustration,investment, isolated, isometric, market,motion, movement, organization, p perspective, presentation,process, processchart, recycle, report,ring, sign, step, stock, success, symbol. The prominent colors used in the PowerPoint template are Blue light, Gray, White. The feedback we get is that our 3d stages of process analysis 8 concepts Circular Flow Chart PowerPoint Slides are Enchanting. The feedback we get is that our concept PowerPoint templates and PPT Slides are Clever. Presenters tell us our 3d stages of process analysis 8 concepts Circular Flow Chart PowerPoint Slides are Vintage. The feedback we get is that our blank PowerPoint templates and PPT Slides are Clever. PowerPoint presentation experts tell us our 3d stages of process analysis 8 concepts Circular Flow Chart PowerPoint Slides are Adorable. Customers tell us our concept PowerPoint templates and PPT Slides are Ultra.

Bar Chart For Facts Stats Growth And Percentage Analysis Ppt PowerPoint Presentation Styles Infographic Template
Presenting this set of slides with name bar chart for facts stats growth and percentage analysis ppt powerpoint presentation styles infographic template. This is a six stage process. The stages in this process are education, growth, pencil bar graph. This is a completely editable PowerPoint presentation and is available for immediate download. Download now and impress your audience.

Chart Of Business Function With Customers Data Analysis Ppt PowerPoint Presentation File Slides PDF
Pitch your topic with ease and precision using this chart of business function with customers data analysis ppt powerpoint presentation file slides pdf. This layout presents information on financial, business, strategy. It is also available for immediate download and adjustment. So, changes can be made in the color, design, graphics or any other component to create a unique layout.
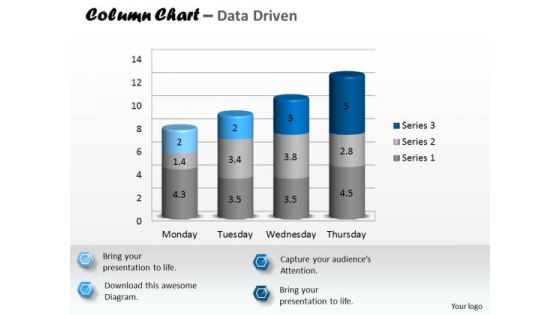
Data Analysis In Excel 3d Column Chart To Represent Information PowerPoint Templates
Rake In The Dough With

Pert Chart For System Planning And Analysis Installation Test And Conversion Ppt Powerpoint Presentation Pictures Graphics Tutorials
This is a pert chart for system planning and analysis installation test and conversion ppt powerpoint presentation pictures graphics tutorials. This is a eleven stage process. The stages in this process are pert chart, program evaluation and review technique, pert graph.
Statistical Analysis Icon With Business Charts Ppt PowerPoint Presentation Gallery File Formats PDF
Pitch your topic with ease and precision using this statistical analysis icon with business charts ppt powerpoint presentation gallery file formats pdf. This layout presents information on statistical analysis icon with business charts. It is also available for immediate download and adjustment. So, changes can be made in the color, design, graphics or any other component to create a unique layout.

Investor Pitch Deck New Venture Capital Raising Competitive Analysis Template 4 Scatter Chart Radar Chart Guidelines PDF
Deliver an awe inspiring pitch with this creative investor pitch deck new venture capital raising competitive analysis template 4 scatter chart radar chart guidelines pdf bundle. Topics like competitive analysis scatter chart or radar chart can be discussed with this completely editable template. It is available for immediate download depending on the needs and requirements of the user.
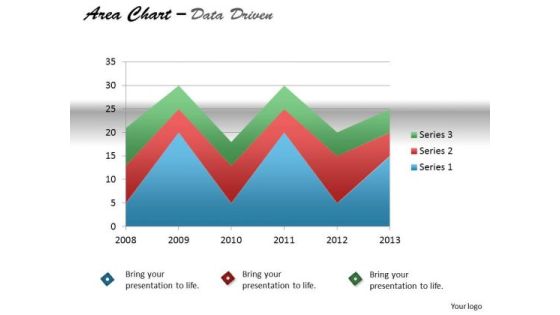
Quantitative Data Analysis Driven Display Series With Area Chart PowerPoint Slides Templates
Our quantitative data analysis driven display series with area chart powerpoint slides Templates Enjoy Drama. They Provide Entertaining Backdrops.
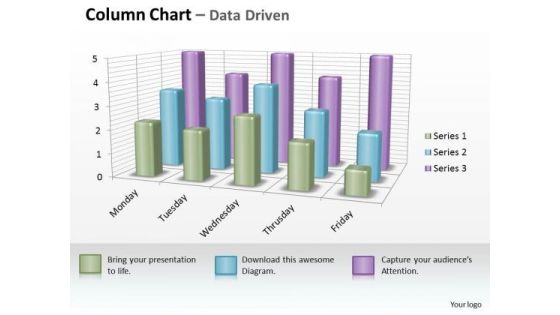
Examples Of Data Analysis Market 3d Business Inspection Procedure Chart PowerPoint Templates
However Dry Your Topic Maybe. Make It Catchy With Our examples of data analysis market 3d business inspection procedure chart Powerpoint Templates .
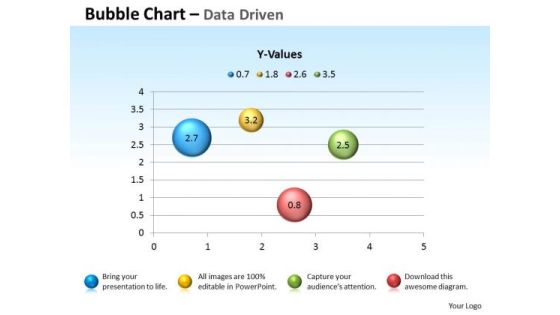
Excel Data Analysis Data Tools Data Methods Statistical Chart For Process PowerPoint Templates
Blend Your Views With Our excel data analysis data tools data methods statistical chart for process Powerpoint Templates . They Are Made For Each Other.

Data Analysis Template Driven Ineract With Stock Chart PowerPoint Slides Templates
Drive Your Passion With Our data analysis template driven ineract with stock chart powerpoint slides Templates . Steer Yourself To Achieve Your Aims.

Data Analysis Excel Driven Percentage Breakdown Pie Chart PowerPoint Slides Templates
Be A Donor Of Great Ideas. Display Your Charity On Our data analysis excel driven percentage breakdown pie chart powerpoint slides Templates.

Data Analysis On Excel Driven Stacked Area Chart PowerPoint Slides Templates
Be The Dramatist With Our data analysis on excel driven stacked area chart powerpoint slides Templates . Script Out The Play Of Words.

Examples Of Data Analysis Market 3d Business Trend Series Chart PowerPoint Templates
Duct It Through With Our examples of data analysis market 3d business trend series chart Powerpoint Templates . Your Ideas Will Reach Into Their Minds Intact.
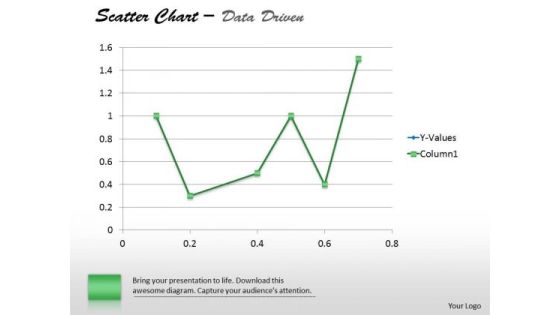
Financial Data Analysis Driven Demonstrate Statistics With Scatter Chart PowerPoint Slides Templates
Establish The Dominance Of Your Ideas. Our financial data analysis driven demonstrate statistics with scatter chart powerpoint slides Templates Will Put Them On Top.

Microsoft Excel Data Analysis 3d Change In Business Process Chart PowerPoint Templates
Double Your Chances With Our microsoft excel data analysis 3d change in business process chart Powerpoint Templates . The Value Of Your Thoughts Will Increase Two-Fold.

Data Analysis Excel Driven Multiple Series Scatter Chart PowerPoint Slides Templates
Your Listeners Will Never Doodle. Our data analysis excel driven multiple series scatter chart powerpoint slides Templates Will Hold Their Concentration.
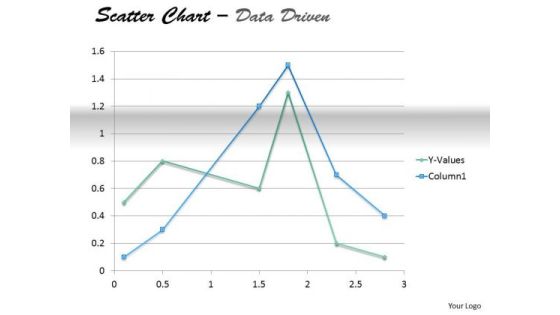
Examples Of Data Analysis Market Driven Present In Scatter Chart PowerPoint Slides Templates
Your Thoughts Will Take To Our examples of data analysis market driven present in scatter chart powerpoint slides Templates Like A Duck To Water. They Develop A Binding Affinity.

Functional Analysis Of Business Operations Clustered Bar Chart Ppt Inspiration Gallery PDF
Presenting this set of slides with name functional analysis of business operations clustered bar chart ppt inspiration gallery pdf. The topics discussed in these slides are sales in percentage, product, years. This is a completely editable PowerPoint presentation and is available for immediate download. Download now and impress your audience.
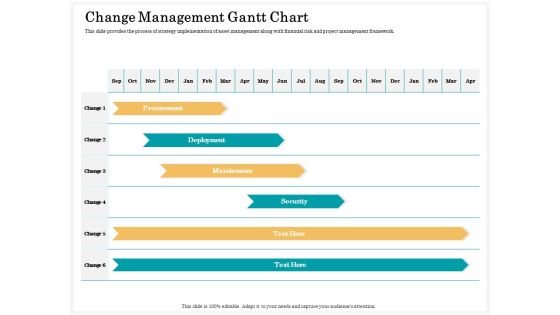
Application Life Cycle Analysis Capital Assets Change Management Gantt Chart Infographics PDF
Presenting this set of slides with name application life cycle analysis capital assets change management gantt chart infographics pdf. The topics discussed in these slides are procurement, deployment, maintenance, security. This is a completely editable PowerPoint presentation and is available for immediate download. Download now and impress your audience.
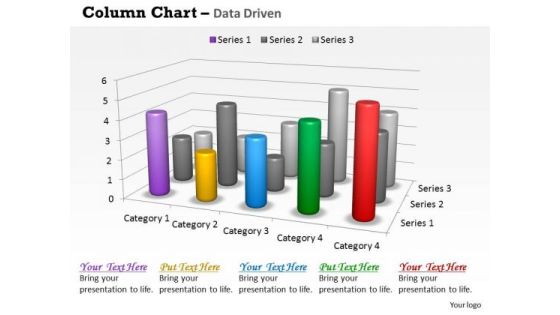
Data Analysis In Excel 3d Survey For Sales Chart PowerPoint Templates
Good Camaraderie Is A Key To Teamwork. Our data analysis in excel 3d survey for sales chart Powerpoint Templates Can Be A Cementing Force.
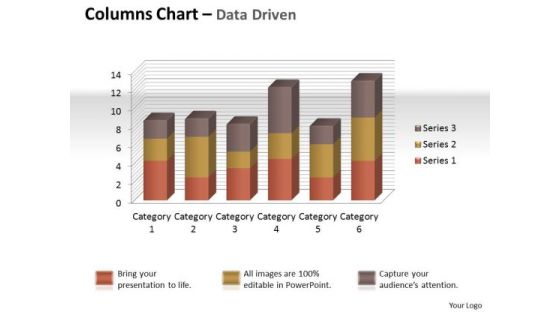
Excel Data Analysis Data Tools Data Methods Statistical Tool Chart PowerPoint Templates
Give Your Thoughts Some Durability. Coat Them With Our excel data analysis data tools data methods statistical tool chart Powerpoint Templates .
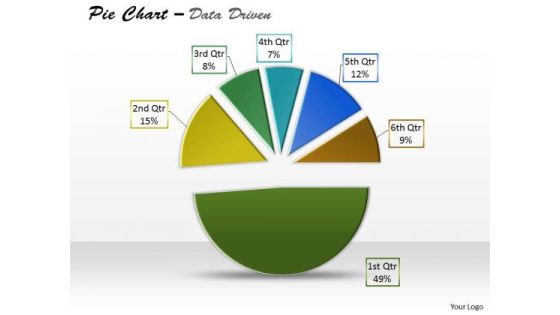
Data Analysis Template Driven Express Business Facts Pie Chart PowerPoint Slides Templates
Display Your Drive On Our data analysis template driven express business facts pie chart powerpoint slides Templates . Invigorate The Audience With Your Fervor.
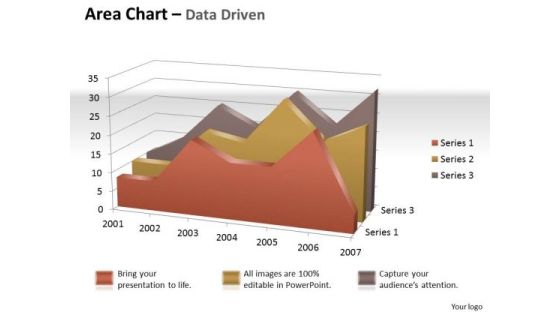
Data Analysis In Excel 3d Visual Display Of Area Chart PowerPoint Templates
Brace Yourself, Arm Your Thoughts. Prepare For The Hustle With Our data analysis in excel 3d visual display of area chart Powerpoint Templates .
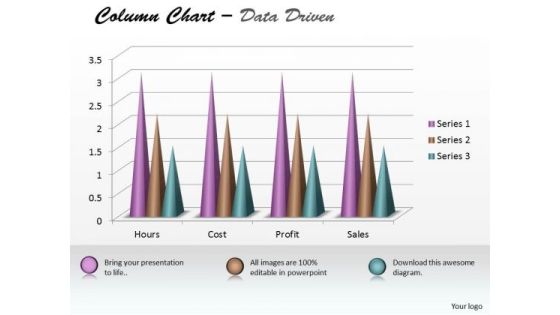
Excel Data Analysis Data Tools Data Methods Statistical Tool Survey Chart PowerPoint Templates
Analyze Ailments On Our excel data analysis data tools data methods statistical tool survey chart Powerpoint Templates . Bring Out The Thinking Doctor In You. Dock Your Thoughts With Our Excel Data Analysis . They Will Launch Them Into Orbit.

Market Research Analysis Of Housing Sector Real Estate Home Sales Chart Rules PDF
Deliver and pitch your topic in the best possible manner with this market research analysis of housing sector real estate home sales chart rules pdf. Use them to share invaluable insights on real estate home sales chart and impress your audience. This template can be altered and modified as per your expectations. So, grab it now.

Analysis Of Procedure Having 6 Stages Support Flow Chart PowerPoint Templates
We present our analysis of procedure having 6 stages support flow chart PowerPoint templates.Download and present our Leadership PowerPoint Templates because you can see In any endeavour people matter most. Use our Arrows PowerPoint Templates because you can Help your viewers automatically emphathise with your thoughts. Present our Process and Flows PowerPoint Templates because presenting your views using our innovative slides, will be assured of leaving a lasting impression. Download our Business PowerPoint Templates because you too have got the framework of your companys growth in place. Use our Circle Charts PowerPoint Templates because they will Amplify your views and plans for getting ahead and then the manner in which you intend staying ahead.Use these PowerPoint slides for presentations relating to Analysis, Analyze, Argument, Argumentation, Black, Business, Calculation, Concept, Criticism, Critique, Detection, Discussion, Dispute, Examination, Experiment, Interpretation, Interview, Know, Learning, Loupe, Magnification, Magnify, Magnifying, Operation, Problem, Procedure, Strategy, Technical, Verification. The prominent colors used in the PowerPoint template are Red, Gray, Black. People tell us our analysis of procedure having 6 stages support flow chart PowerPoint templates are Breathtaking. PowerPoint presentation experts tell us our Business PowerPoint templates and PPT Slides are No-nonsense. Presenters tell us our analysis of procedure having 6 stages support flow chart PowerPoint templates are Reminiscent. The feedback we get is that our Business PowerPoint templates and PPT Slides are Excellent. You can be sure our analysis of procedure having 6 stages support flow chart PowerPoint templates are incredible easy to use. Professionals tell us our Argument PowerPoint templates and PPT Slides are Enchanting.

Analysis Of Procedure Having 6 Stages Function Flow Chart PowerPoint Slides
We present our analysis of procedure having 6 stages function flow chart PowerPoint Slides.Use our Circle Charts PowerPoint Templates because,You can Take your team along by explaining your plans. Use our Arrows PowerPoint Templates because, You can Show them how to churn out fresh ideas. Use our Leadership PowerPoint Templates because,The Venn graphic comprising interlinking circles geometrically demonstate how various functions operating independantly, to a large extent, are essentially interdependant. Use our Business PowerPoint Templates because,Like the famed William Tell, they put aside all emotions and concentrate on the target. Use our Process and Flows PowerPoint Templates because,This slide brings grey areas to the table and explain in detail you assessment of the need for care to ensure continued smooth progress.Use these PowerPoint slides for presentations relating to analysis, analyze, argument, argumentation, black, business, calculation, concept, criticism, critique, detection, discussion, dispute, examination, experiment, interpretation, interview, know, learning, loupe, magnification, magnify, magnifying, operation, problem, procedure, strategy, technical, verification. The prominent colors used in the PowerPoint template are Yellow, Brown, Red. People tell us our analysis of procedure having 6 stages function flow chart PowerPoint Slides are Excellent. The feedback we get is that our concept PowerPoint templates and PPT Slides are Majestic. People tell us our analysis of procedure having 6 stages function flow chart PowerPoint Slides are Wonderful. Presenters tell us our black PowerPoint templates and PPT Slides are Delightful. The feedback we get is that our analysis of procedure having 6 stages function flow chart PowerPoint Slides are Enchanting. Professionals tell us our calculation PowerPoint templates and PPT Slides are designed by professionals
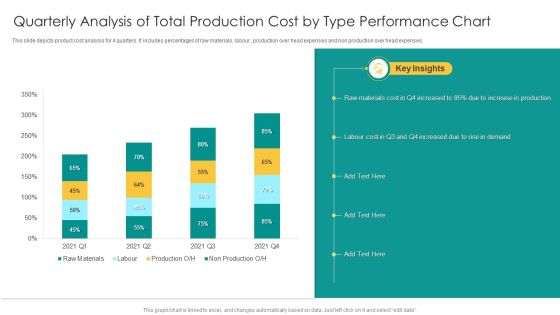
Quarterly Analysis Of Total Production Cost By Type Performance Chart Summary PDF
This slide depicts product cost analysis for 4 quarters. It includes percentages of raw materials, labour , production over head expenses and non production over head expenses. Showcasing this set of slides titled Quarterly Analysis Of Total Production Cost By Type Performance Chart Summary PDF. The topics addressed in these templates are Raw Materials Cost, Increase Production, Rise Demand. All the content presented in this PPT design is completely editable. Download it and make adjustments in color, background, font etc. as per your unique business setting.
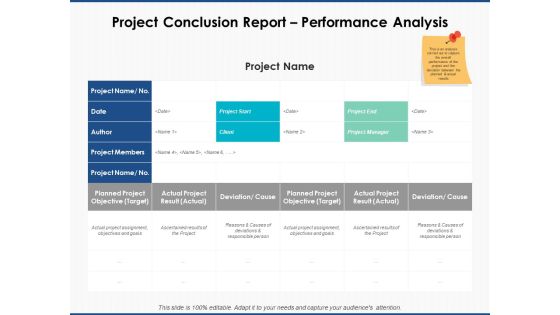
Project Conclusion Report Performance Analysis Ppt PowerPoint Presentation Diagram Graph Charts
This is a project conclusion report performance analysis ppt powerpoint presentation diagram graph charts. The topics discussed in this diagram are marketing, business, management, planning, strategy This is a completely editable PowerPoint presentation, and is available for immediate download.
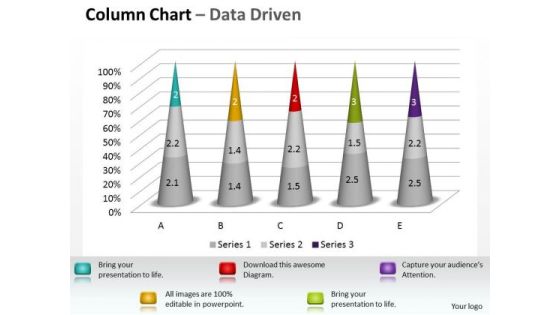
Excel Data Analysis Data Tools Data Methods Statistical Tool Survey 3d Chart PowerPoint Templates
Dumbfound Them With Our excel data analysis data tools data methods statistical tool survey 3d chart Powerpoint Templates . Your Audience Will Be Astounded With Your Ideas.
 Home
Home