Chart Analysis

Bar Chart For Website Performance Analysis Ppt PowerPoint Presentation Layouts Influencers
Presenting this set of slides with name bar chart for website performance analysis ppt powerpoint presentation layouts influencers. The topics discussed in these slides are education, growth, pencil bar graph. This is a completely editable PowerPoint presentation and is available for immediate download. Download now and impress your audience.

Innovation Analysis Process Chart Ppt PowerPoint Presentation Ideas Slide Portrait PDF
Presenting this set of slides with name innovation analysis process chart ppt powerpoint presentation ideas slide portrait pdf. This is a three stage process. The stages in this process are innovation, analyze, process. This is a completely editable PowerPoint presentation and is available for immediate download. Download now and impress your audience.
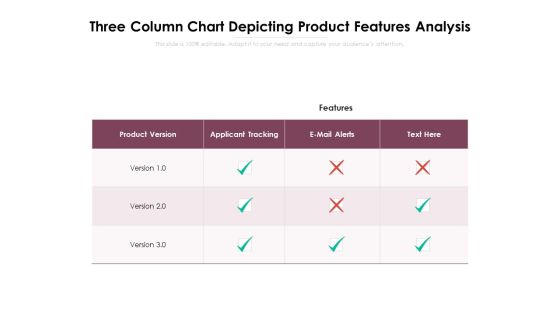
Three Column Chart Depicting Product Features Analysis Ppt PowerPoint Presentation File Slideshow PDF
Pitch your topic with ease and precision using this three column chart depicting product features analysis ppt powerpoint presentation file slideshow pdf. This layout presents information on product version, applicant tracking, e mail alerts. It is also available for immediate download and adjustment. So, changes can be made in the color, design, graphics or any other component to create a unique layout.
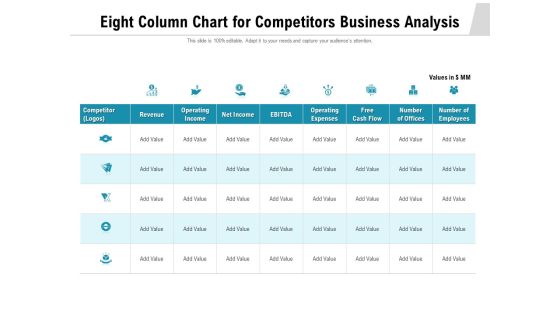
Eight Column Chart For Competitors Business Analysis Ppt PowerPoint Presentation Gallery Format PDF
Showcasing this set of slides titled eight column chart for competitors business analysis ppt powerpoint presentation gallery format pdf. The topics addressed in these templates are revenue, operating income, net income. All the content presented in this PPT design is completely editable. Download it and make adjustments in colour, background, font etc. as per your unique business setting.

Pie Chart For Marketing Expenses Analysis Ppt PowerPoint Presentation Slides Files PDF
Pitch your topic with ease and precision using this pie chart for marketing expenses analysis ppt powerpoint presentation slides files pdf. This layout presents information on sales training, print advertising, conventions, online advertising. It is also available for immediate download and adjustment. So, changes can be made in the color, design, graphics or any other component to create a unique layout.
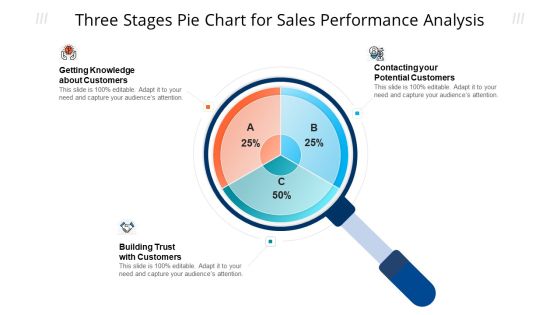
Three Stages Pie Chart For Sales Performance Analysis Ppt Model Tips PDF
Persuade your audience using this three stages pie chart for sales performance analysis ppt model tips pdf. This PPT design covers three stages, thus making it a great tool to use. It also caters to a variety of topics including potential customers, knowledge about customers, sales performance analysis. Download this PPT design now to present a convincing pitch that not only emphasizes the topic but also showcases your presentation skills.

Steps To Conduct Competitor Analysis Column Chart Ppt Model Gridlines PDF
This graph or chart is linked to excel, and changes automatically based on data. Just left click on it and select edit data. If your project calls for a presentation, then Slidegeeks is your go-to partner because we have professionally designed, easy-to-edit templates that are perfect for any presentation. After downloading, you can easily edit Steps To Conduct Competitor Analysis Column Chart Ppt Model Gridlines PDF and make the changes accordingly. You can rearrange slides or fill them with different images. Check out all the handy templates
Issues And Impact Of Failure Mode And Effects Analysis Matrix Chart For FMEA Interpretation Icons PDF
This slide provides the matrix chart of potential severity and probability of occurrence to determine the high, medium and low priorities in order to take required actions.Deliver and pitch your topic in the best possible manner with this Issues And Impact Of Failure Mode And Effects Analysis Matrix Chart For FMEA Interpretation Icons PDF. Use them to share invaluable insights on Highest Priority, Medium Priority, Severity Occurrence and impress your audience. This template can be altered and modified as per your expectations. So, grab it now.

Website Technical And Content Analysis Gantt Chart Ppt Portfolio Example PDF
This slide showcases gantt. Chart that can help organization to keep track of timeline of website content and technical auditing process. it showcases progress for a period of three days. Pitch your topic with ease and precision using this Website Technical And Content Analysis Gantt Chart Ppt Portfolio Example PDF. This layout presents information on Find Technical Errors, Identify SEO Problems, Assess Website Content. It is also available for immediate download and adjustment. So, changes can be made in the color, design, graphics or any other component to create a unique layout.

Advisory Company Pitch Deck Competitive Analysis Comparison Chart Ppt Layouts Brochure PDF
This slide provides the glimpse about the problem faced by the users since email is used for personal use which leads to problems such as no collaboration, poor productivity, and regular errors. Deliver an awe inspiring pitch with this creative advisory company pitch deck competitive analysis comparison chart ppt layouts brochure pdf bundle. Topics like e commerce, devices, email, pricing, average can be discussed with this completely editable template. It is available for immediate download depending on the needs and requirements of the user.
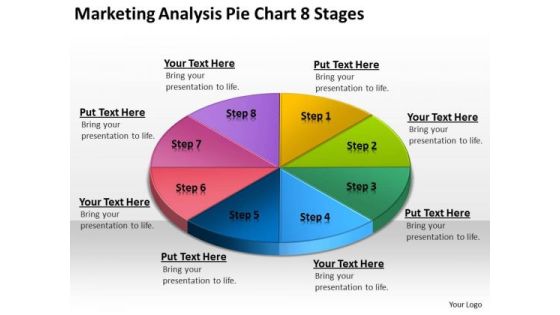
Marketing Analysis Pie Chart 8 Stages Business Plan Basics PowerPoint Templates
We present our marketing analysis pie chart 8 stages business plan basics PowerPoint templates.Download and present our Circle Charts PowerPoint Templates because Our PowerPoint Templates and Slides will Activate the energies of your audience. Get their creative juices flowing with your words. Present our Business PowerPoint Templates because Our PowerPoint Templates and Slides will let you meet your Deadlines. Use our Shapes PowerPoint Templates because Our PowerPoint Templates and Slides will effectively help you save your valuable time. They are readymade to fit into any presentation structure. Present our Signs PowerPoint Templates because You can Connect the dots. Fan expectations as the whole picture emerges. Use our Metaphors-Visual Concepts PowerPoint Templates because Our PowerPoint Templates and Slides will let your words and thoughts hit bullseye everytime.Use these PowerPoint slides for presentations relating to business, chart, circle, circular, diagram, economy, finance, framework, graph, isolated, percentage, pie chart, results, scheme, statistics, stats, strategy, success. The prominent colors used in the PowerPoint template are Yellow, Green, Blue.
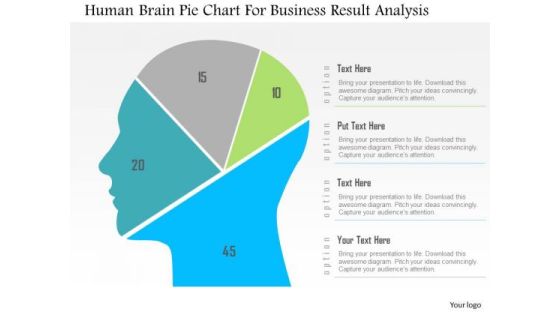
Business Diagram Human Brain Pie Chart For Business Result Analysis PowerPoint Slide
This diagram displays human face graphic divided into sections. This section can be used for data display. Use this diagram to build professional presentations for your viewers.

Competitor Analysis Comparison Chart Ppt PowerPoint Presentation Complete Deck With Slides
Share a great deal of information on the topic by deploying this Competitor Analysis Comparison Chart Ppt PowerPoint Presentation Complete Deck With Slides. Support your ideas and thought process with this prefabricated set. It includes a set of twelve slides, all fully modifiable and editable. Each slide can be restructured and induced with the information and content of your choice. You can add or remove large content boxes as well, to make this PPT slideshow more personalized. Its high-quality graphics and visuals help in presenting a well-coordinated pitch. This PPT template is also a resourceful tool to take visual cues from and implement the best ideas to help your business grow and expand. The main attraction of this well-formulated deck is that everything is editable, giving you the freedom to adjust it to your liking and choice. Changes can be made in the background and theme as well to deliver an outstanding pitch. Therefore, click on the download button now to gain full access to this multifunctional set.

Stock Photo Multicolor Pie Chart For Business Result Analysis PowerPoint Slide
Develop competitive advantage with this image which contains 3d pie chart with five steps. Use this image to define steps of business process with this image of pie chart. This image is an excellent tool to give an ideal presentation.

Gantt Chart For Monthly Tasks Analysis Ppt PowerPoint Presentation Pictures Format PDF
Our Gantt Chart PowerPoint Template is a modern and professional layout designed to create some of the vital components that help you to create timelines, roadmaps, project plans, etc. Communicate your project activity durations, milestones, tasks, subtasks, dependencies and other attributes with this content-ready PowerPoint template. Further, showcase precedence against time by employing this fully editable PowerPoint chart into your business tasks. With a single glance at this resourceful PPT layout, the audiences can get a complete overview of the tasks, duration, resources employed, and overlapping of the activities in a particular project, making it an ideal choice for project managers and leaders. Not only this, but the color scheme of this template is also such that it is sure to impress your audience, no matter which niche they belong to. Thus steer your project meetings, meetups, and conferences with this Gantt Chart PPT slide.
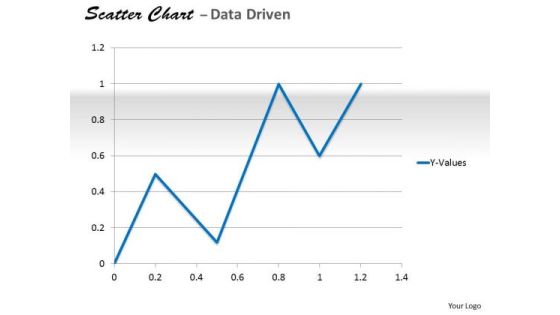
Data Analysis In Excel Analyzing Of Relationship Chart PowerPoint Templates
Delight Them With Our data analysis in excel analyzing of relationship chart Powerpoint Templates .

Data Analysis Techniques 3d In Segments Pie Chart PowerPoint Templates
Drink To The Success Of Your Campaign. Our data analysis techniques 3d in segments pie chart Powerpoint Templates Will Raise A Toast.
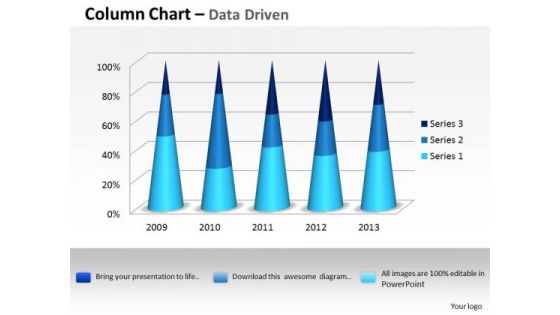
Data Analysis Excel 3d Process Variation Column Chart PowerPoint Templates
Put In A Dollop Of Our data analysis excel 3d process variation column chart Powerpoint Templates. Give Your Thoughts A Distinctive Flavor.

Data Analysis In Excel 3d Classification Of Chart PowerPoint Templates
With Our data analysis in excel 3d classification of chart Powerpoint Templates You Will Be Doubly Sure. They Possess That Stamp Of Authority.
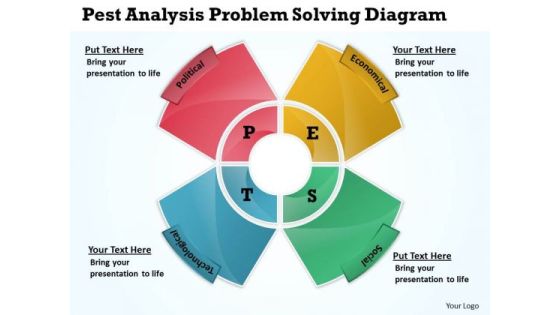
Pest Analysis Problem Solving Diagram Cycle Process Chart PowerPoint Templates
We present our pest analysis problem solving diagram Cycle Process Chart PowerPoint templates.Use our Marketing PowerPoint Templates because our Templates will enthuse your colleagues. Present our Business PowerPoint Templates because this template can project the path to sucess that you have charted. Present our Shapes PowerPoint Templates because you can spread the fruits of your efforts and elaborate your ideas on the prevention, diagnosis, control and cure of prevalent diseases. Download our Circle Charts PowerPoint Templates because you can Transmit your thoughts via our slides and proud your team to action. Present our Process and Flows PowerPoint Templates because you can Show them how you can save the day.Use these PowerPoint slides for presentations relating to Analysis, Analyze, Blackboard, Board, Business, Chalk, Chalkboard, Chart, Component, Concept, Diagram, Direction, Economic, Education, Environmental, Factors, Framework, Graph, Graphics, Illustration, Law, Leadership, Management, Market, Market, Research, Model, Operations, Pest, Political, Position, Potential. The prominent colors used in the PowerPoint template are Red, Yellow, Green. We assure you our pest analysis problem solving diagram Cycle Process Chart PowerPoint templates will get their audience's attention. Customers tell us our Chalk PowerPoint templates and PPT Slides are Graceful. The feedback we get is that our pest analysis problem solving diagram Cycle Process Chart PowerPoint templates are Multicolored. We assure you our Chart PowerPoint templates and PPT Slides are Bright. People tell us our pest analysis problem solving diagram Cycle Process Chart PowerPoint templates are Chic. We assure you our Component PowerPoint templates and PPT Slides are effectively colour coded to prioritise your plans They automatically highlight the sequence of events you desire.

Survey Analysis Gain Marketing Insights Stacked Bar Chart Information PDF
Presenting this set of slides with name survey analysis gain marketing insights stacked bar chart information pdf. The topics discussed in these slides are product 1, product 2. This is a completely editable PowerPoint presentation and is available for immediate download. Download now and impress your audience.
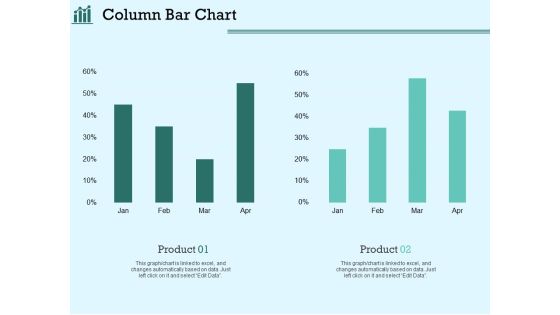
Survey Analysis Gain Marketing Insights Column Bar Chart Template PDF
Presenting this set of slides with name survey analysis gain marketing insights column bar chart template pdf. The topics discussed in these slides are product 1, product 2. This is a completely editable PowerPoint presentation and is available for immediate download. Download now and impress your audience.

Feasibility Analysis Template Different Projects Hospital Organizational Chart Download PDF
This slide provides the glimpse of the hospital organizational chart that is required to built a solid foundation and recruit qualified professionals. Presenting feasibility analysis template different projects hospital organizational chart download pdf to provide visual cues and insights. Share and navigate important information on one stages that need your due attention. This template can be used to pitch topics like hospital organizational chart. In addtion, this PPT design contains high resolution images, graphics, etc, that are easily editable and available for immediate download.

Strategic Plan To Increase Sales Volume And Revenue Market Segmentation Analysis Chart For Implementing Sales Strategy Microsoft PDF
This slide shows the Market Segmentation based on various characteristics like Geographic region, Climate, Country etc. Demographic Age, Sex, Religion etc. Psychographic Personality, Attitude, Opinions etc. and Behavioral Usage Rate, Purchase Readiness etc. which will help to categorize the target audience more effectively and implement the sales strategy. Deliver an awe inspiring pitch with this creative strategic plan to increase sales volume and revenue market segmentation analysis chart for implementing sales strategy microsoft pdf bundle. Topics like psychographic, behavioral, geographic, demographic can be discussed with this completely editable template. It is available for immediate download depending on the needs and requirements of the user.

Bar Charts For Business Performance Analysis Ppt PowerPoint Presentation Show Slideshow
This is a bar charts for business performance analysis ppt powerpoint presentation show slideshow. This is a two stage process. The stages in this process are compare, comparison of two, competitive analysis.

Business Charts For Market Statistical Analysis Ppt PowerPoint Presentation Slides Summary PDF
Presenting business charts for market statistical analysis ppt powerpoint presentation slides summary pdf to dispense important information. This template comprises three stages. It also presents valuable insights into the topics including business charts for market statistical analysis. This is a completely customizable PowerPoint theme that can be put to use immediately. So, download it and address the topic impactfully.

Business Analysis Data Charts And Reports Ppt Powerpoint Presentation Ideas Portrait
This is a business analysis data charts and reports ppt powerpoint presentation ideas portrait. This is a three stage process. The stages in this process are business metrics, business kpi, business dashboard.
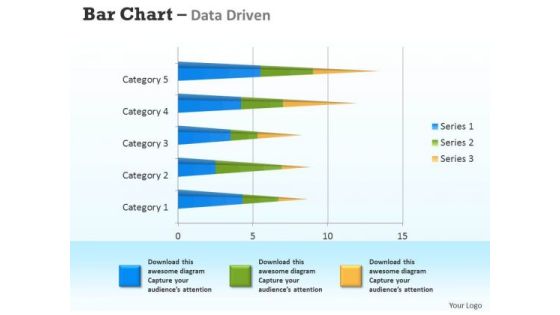
Microsoft Excel Data Analysis 3d Bar Chart For Analyzing Survey PowerPoint Templates
Connect The Dots With Our microsoft excel data analysis 3d bar chart for analyzing survey Powerpoint Templates . Watch The Whole Picture Clearly Emerge.
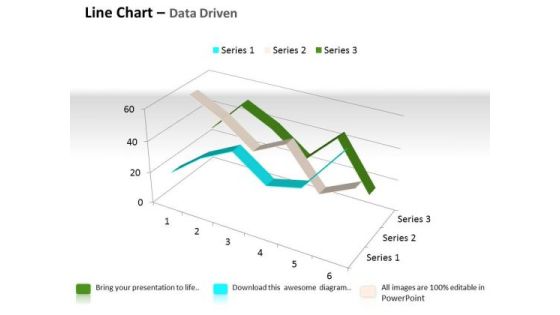
Quantitative Data Analysis 3d Line Chart For Comparison Of PowerPoint Templates
Touch Base With Our quantitative data analysis 3d line chart for comparison of Powerpoint Templates . Review Your Growth With Your Audience.

Quantitative Data Analysis 3d Pie Chart For Business Process PowerPoint Templates
Put Them On The Same Page With Our quantitative data analysis 3d pie chart for business process Powerpoint Templates . Your Team Will Sing From The Same Sheet.
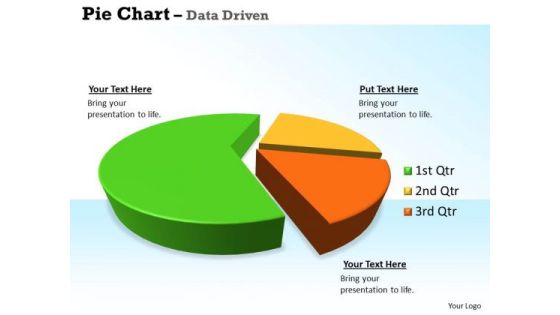
Quantitative Data Analysis 3d Pie Chart For Business Statistics PowerPoint Templates
Our quantitative data analysis 3d pie chart for business statistics Powerpoint Templates Allow You To Do It With Ease. Just Like Picking The Low Hanging Fruit.
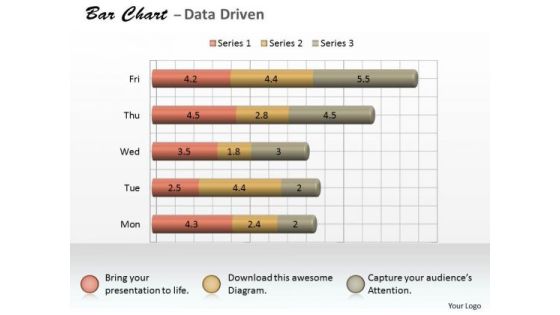
Microsoft Excel Data Analysis 3d Bar Chart As Research Tool PowerPoint Templates
Knock On The Door To Success With Our microsoft excel data analysis 3d bar chart as research tool Powerpoint Templates . Be Assured Of Gaining Entry.
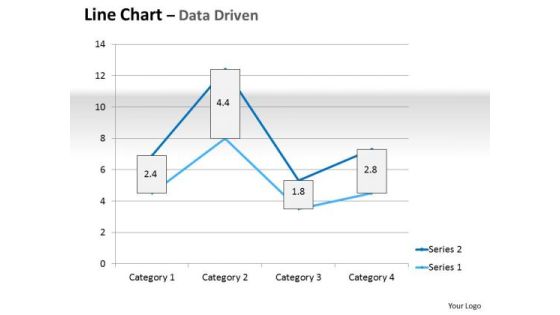
Multivariate Data Analysis Driven Line Chart Market Graph PowerPoint Slides Templates
Plan For All Contingencies With Our multivariate data analysis driven line chart market graph powerpoint slides Templates . Douse The Fire Before It Catches.
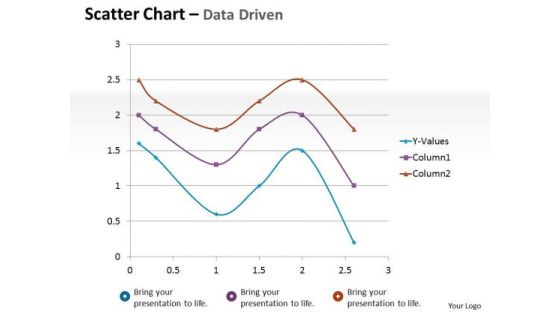
Financial Data Analysis Driven Scatter Chart Mathematical Diagram PowerPoint Slides Templates
Dominate Proceedings With Your Ideas. Our financial data analysis driven scatter chart mathematical diagram powerpoint slides Templates Will Empower Your Thoughts.
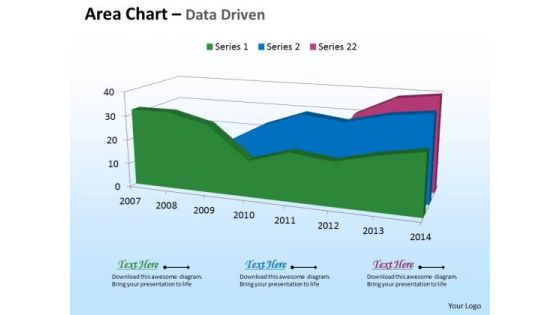
Microsoft Excel Data Analysis 3d Area Chart For Time Based PowerPoint Templates
Deliver The Right Dose With Our microsoft excel data analysis 3d area chart for time based Powerpoint Templates . Your Ideas Will Get The Correct Illumination.
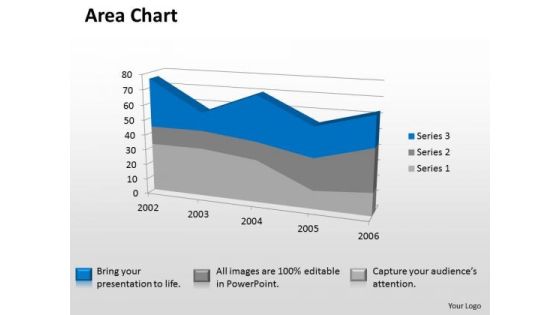
Microsoft Excel Data Analysis 3d Area Chart Showimg Change In Values PowerPoint Templates
Our microsoft excel data analysis 3d area chart showimg change in values Powerpoint Templates Deliver At Your Doorstep. Let Them In For A Wonderful Experience.
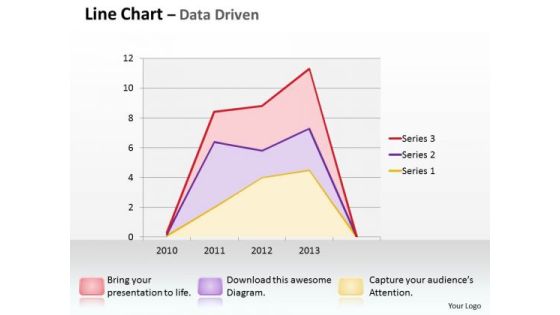
Multivariate Data Analysis Driven Line Chart Shows Revenue Trends PowerPoint Slides Templates
Good Camaraderie Is A Key To Teamwork. Our multivariate data analysis driven line chart shows revenue trends powerpoint slides Templates Can Be A Cementing Force.
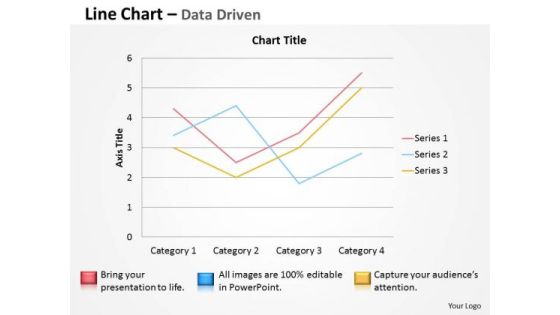
Multivariate Data Analysis Driven Line Chart To Demonstrate PowerPoint Slides Templates
Brace Yourself, Arm Your Thoughts. Prepare For The Hustle With Our multivariate data analysis driven line chart to demonstrate powerpoint slides Templates .

Bar Chart Segmentation Showing Percentage Business Analysis Ppt PowerPoint Presentation Portfolio Sample PDF
Presenting this set of slides with name bar chart segmentation showing percentage business analysis ppt powerpoint presentation portfolio sample pdf. The topics discussed in these slide is bar chart segmentation showing percentage business analysis. This is a completely editable PowerPoint presentation and is available for immediate download. Download now and impress your audience.
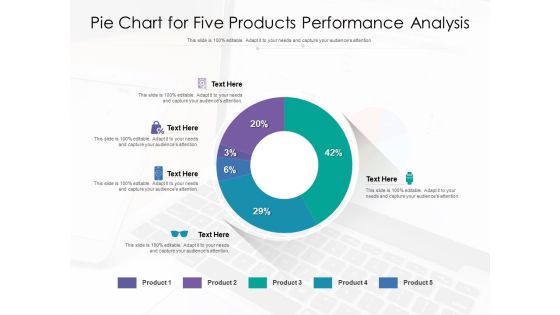
Pie Chart For Five Products Performance Analysis Ppt PowerPoint Presentation Gallery Deck PDF
Showcasing this set of slides titled pie chart for five products performance analysis ppt powerpoint presentation gallery deck pdf. The topics addressed in these templates are pie chart for five products performance analysis. All the content presented in this PPT design is completely editable. Download it and make adjustments in color, background, font etc. as per your unique business setting.
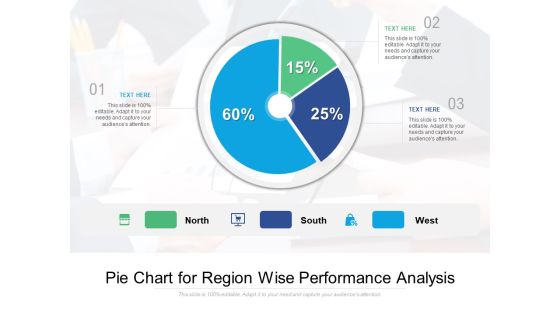
Pie Chart For Region Wise Performance Analysis Ppt PowerPoint Presentation Gallery Example PDF
Showcasing this set of slides titled pie chart for region wise performance analysis ppt powerpoint presentation gallery example pdf. The topics addressed in these templates are pie chart for region wise performance analysis. All the content presented in this PPT design is completely editable. Download it and make adjustments in color, background, font etc. as per your unique business setting.
Pie Chart Showing Online Business Sales Analysis Ppt PowerPoint Presentation File Icons PDF
Pitch your topic with ease and precision using this pie chart showing online business sales analysis ppt powerpoint presentation file icons pdf. This layout presents information on pie chart showing online business sales analysis. It is also available for immediate download and adjustment. So, changes can be made in the color, design, graphics or any other component to create a unique layout.

Financial Chart Showing Year Over Year Analysis Ppt PowerPoint Presentation Styles Design Ideas
Presenting this set of slides with name financial chart showing year over year analysis ppt powerpoint presentation styles design ideas. The topics discussed in these slide is financial chart showing year over year analysis. This is a completely editable PowerPoint presentation and is available for immediate download. Download now and impress your audience.

Data Analysis With Bar Chart In Magnifying Glass Vector Icon Ppt PowerPoint Presentation File Model PDF
Presenting this set of slides with name data analysis with bar chart in magnifying glass vector icon ppt powerpoint presentation file model pdf. This is a one stage process. The stages in this process is data analysis with bar chart in magnifying glass vector icon. This is a completely editable PowerPoint presentation and is available for immediate download. Download now and impress your audience.

Business Analysis With Pie Chart Vector Icon Ppt PowerPoint Presentation Ideas Good PDF
Presenting this set of slides with name business analysis with pie chart vector icon ppt powerpoint presentation ideas good pdf. This is a three stage process. The stages in this process are business analysis with pie chart vector icon. This is a completely editable PowerPoint presentation and is available for immediate download. Download now and impress your audience.

Benchmark Chart For Various Business Metrics Analysis Ppt PowerPoint Presentation Outline Icons PDF
Pitch your topic with ease and precision using this benchmark chart for various business metrics analysis ppt powerpoint presentation outline icons pdf. This layout presents information on benchmark chart for various business metrics analysis. It is also available for immediate download and adjustment. So, changes can be made in the color, design, graphics or any other component to create a unique layout.
Product Feature Analysis Three Column Chart Vector Icon Ppt PowerPoint Presentation Infographics Graphics Example PDF
Showcasing this set of slides titled product feature analysis three column chart vector icon ppt powerpoint presentation infographics graphics example pdf. The topics addressed in these templates are product feature analysis three column chart vector icon. All the content presented in this PPT design is completely editable. Download it and make adjustments in color, background, font etc. as per your unique business setting.
Pie Chart Showing Content Marketing Problems Analysis Ppt PowerPoint Presentation Icon Show PDF
Showcasing this set of slides titled pie chart showing content marketing problems analysis ppt powerpoint presentation icon show pdf. The topics addressed in these templates are pie chart showing content marketing problems analysis. All the content presented in this PPT design is completely editable. Download it and make adjustments in color, background, font etc. as per your unique business setting.

Benchmark Chart Depicting Two Products Performance Analysis Ppt PowerPoint Presentation Styles Icon PDF
Showcasing this set of slides titled benchmark chart depicting two products performance analysis ppt powerpoint presentation styles icon pdf. The topics addressed in these templates are benchmark chart depicting two products performance analysis All the content presented in this PPT design is completely editable. Download it and make adjustments in color, background, font etc. as per your unique business setting.

Pie Chart Showing Subsidiary Companies Progress Analysis Ppt PowerPoint Presentation Slides Example Topics PDF
Presenting this set of slides with name pie chart showing subsidiary companies progress analysis ppt powerpoint presentation slides example topics pdf. This is a four stage process. The stages in this process are pie chart showing subsidiary companies progress analysis. This is a completely editable PowerPoint presentation and is available for immediate download. Download now and impress your audience.
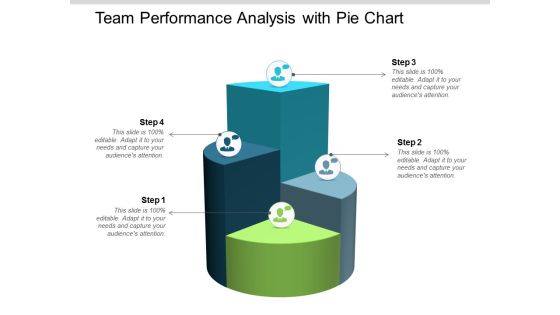
Team Performance Analysis With Pie Chart Ppt Powerpoint Presentation Infographic Template Slideshow
This is a team performance analysis with pie chart ppt powerpoint presentation infographic template slideshow. This is a four stage process. The stages in this process are team performance, member performance, group performance.
Statistical Analysis Icon With Chart And Gear On Computer Screen Ppt PowerPoint Presentation File Grid PDF
Presenting statistical analysis icon with chart and gear on computer screen ppt powerpoint presentation file grid pdf to dispense important information. This template comprises three stages. It also presents valuable insights into the topics including statistical analysis icon with chart and gear on computer screen. This is a completely customizable PowerPoint theme that can be put to use immediately. So, download it and address the topic impactfully.
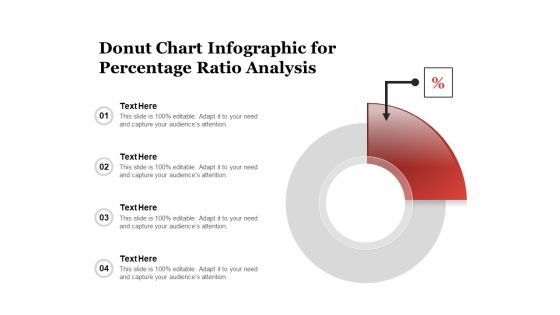
Donut Chart Infographic For Percentage Ratio Analysis Ppt PowerPoint Presentation File Graphics Example PDF
Persuade your audience using this donut chart infographic for percentage ratio analysis ppt powerpoint presentation file graphics example pdf. This PPT design covers four stages, thus making it a great tool to use. It also caters to a variety of topics including donut chart infographic for percentage ratio analysis. Download this PPT design now to present a convincing pitch that not only emphasizes the topic but also showcases your presentation skills.

Show All Analysis In Pie Chart PowerPoint Templates Ppt Backgrounds For Slides 0713
Reduce the drag with our Show All Analysis In Pie Chart PowerPoint Templates PPT Backgrounds For Slides 0713. Give more lift to your thoughts. Your thoughts will make a dramatic entry. Write the script on our Pie charts PowerPoint Templates. Our Business PowerPoint Templates enjoy drama. They provide entertaining backdrops.

Bar Chart Segmentation Illustrating Business Data Analysis Ppt PowerPoint Presentation Outline File Formats
Presenting this set of slides with name bar chart segmentation illustrating business data analysis ppt powerpoint presentation outline file formats. The topics discussed in these slides are desktop application, user experience, business target. This is a completely editable PowerPoint presentation and is available for immediate download. Download now and impress your audience.

Chart Of Retail Channels Performance Analysis Ppt PowerPoint Presentation Layouts Images PDF
Showcasing this set of slides titled chart of retail channels performance analysis ppt powerpoint presentation layouts images pdf. The topics addressed in these templates are clothing and accessories, electronics hardware, school supplies, apartment furnishings. All the content presented in this PPT design is completely editable. Download it and make adjustments in color, background, font etc. as per your unique business setting.

Competitor Analysis Table Organization Chart Ppt PowerPoint Presentation Complete Deck With Slides
Boost your confidence and team morale with this well-structured competitor analysis table organization chart ppt powerpoint presentation complete deck with slides. This prefabricated set gives a voice to your presentation because of its well-researched content and graphics. Our experts have added all the components very carefully, thus helping you deliver great presentations with a single click. Not only that, it contains a set of twelve slides that are designed using the right visuals, graphics, etc. Various topics can be discussed, and effective brainstorming sessions can be conducted using the wide variety of slides added in this complete deck. Apart from this, our PPT design contains clear instructions to help you restructure your presentations and create multiple variations. The color, format, design anything can be modified as deemed fit by the user. Not only this, it is available for immediate download. So, grab it now.

Chart For Yearly Business Performance Analysis Ppt PowerPoint Presentation Slide Download
Presenting this set of slides with name chart for yearly business performance analysis ppt powerpoint presentation slide download. The topics discussed in these slides are education, growth, pencil bar graph. This is a completely editable PowerPoint presentation and is available for immediate download. Download now and impress your audience.
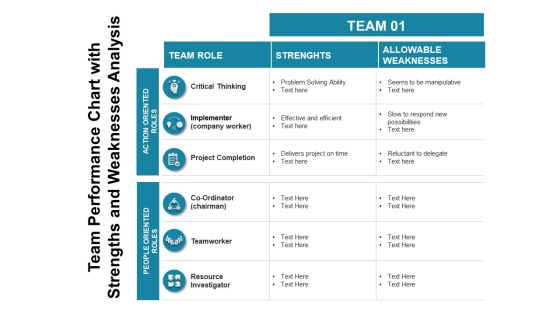
Team Performance Chart With Strengths And Weaknesses Analysis Ppt PowerPoint Presentation Inspiration Example Topics PDF
Presenting this set of slides with name team performance chart with strengths and weaknesses analysis ppt powerpoint presentation inspiration example topics pdf. The topics discussed in these slides are team role, strenghts, allowable weaknesses, critical thinking, project completion, teamworker, resource investigator. This is a completely editable PowerPoint presentation and is available for immediate download. Download now and impress your audience.

Alternative Cost Analysis Three Stages Chart Ppt PowerPoint Presentation Icon Graphics Download PDF
Presenting this set of slides with name alternative cost analysis three stages chart ppt powerpoint presentation icon graphics download pdf. The topics discussed in these slides are making choices, what to choose, opportunity cost. This is a completely editable PowerPoint presentation and is available for immediate download. Download now and impress your audience.
 Home
Home