Chart Analysis

Brand Positioning Statement Target Benefits Points For Assistance Ppt PowerPoint Presentation Diagram Graph Charts PDF
This slide provides information regarding brand positioning that portrays how Amazon functions, the target audience, showcases products benefits, point of assistance to highlight competitive advantage. Get a simple yet stunning designed Brand Positioning Statement Target Benefits Points For Assistance Ppt PowerPoint Presentation Diagram Graph Charts PDF. It is the best one to establish the tone in your meetings. It is an excellent way to make your presentations highly effective. So, download this PPT today from Slidegeeks and see the positive impacts. Our easy to edit Brand Positioning Statement Target Benefits Points For Assistance Ppt PowerPoint Presentation Diagram Graph Charts PDF can be your go to option for all upcoming conferences and meetings. So, what are you waiting for Grab this template today.

Steps For Sales Risk Management Process Ppt Diagram Graph Charts PDF
The following slide illustrates some steps to optimize sales risk administration process improving organizations overall financial performance. It includes activities such as identifying , assessing, prioritizing, treating and monitoring issues etc. The Steps For Sales Risk Management Process Ppt Diagram Graph Charts PDF is a compilation of the most recent design trends as a series of slides. It is suitable for any subject or industry presentation, containing attractive visuals and photo spots for businesses to clearly express their messages. This template contains a variety of slides for the user to input data, such as structures to contrast two elements, bullet points, and slides for written information. Slidegeeks is prepared to create an impression.

Improving Restaurant Operations Kitchen Display System Kot Handling Ppt Diagram Graph Charts PDF
Presenting this set of slides with name improving restaurant operations kitchen display system kot handling ppt diagram graph charts pdf. This is a seven stage process. The stages in this process are automatic kot generation chef , kot pops kitchen display, fifo basis, track kitchen efficiency and average preparation time, menu item, prevent risk of missing out order, single and multi, department based orders. This is a completely editable PowerPoint presentation and is available for immediate download. Download now and impress your audience.

Ppt Background Five Stages Of Successful Free Enterprise PowerPoint Charts Plan 5 Image
We present our PPT Background five stages of successful free enterprise PowerPoint charts plan 5 Image. Use our Arrows PowerPoint Templates because; examine each brilliant thought in thorough detail highlighting all the pros and cons as minutely as possible. Use our Business PowerPoint Templates because; demonstrate how they contribute to the larger melting pot. Use our Shapes PowerPoint Templates because, Business 3D Circular Puzzle:- Your business and plans for its growth consist of processes that are highly co-related. Use our Finance PowerPoint Templates because, an occasion for gifting and giving. Use our Process and Flows PowerPoint Templates because, you know your business and have a vision for it. Use these PowerPoint slides for presentations relating to 3d, arrow, background, bullet, business, chart, checkmark, chevron, diagram, drop, eps10, financial, five, glass, graphic, gray, icon, illustration, management, point, process, project, reflection, set, shadow, stage, text, transparency, vector, white. The prominent colors used in the PowerPoint template are Red, Gray, and Black

Difference Between Artificial And Augmented Intelligence Ppt PowerPoint Presentation Diagram Graph Charts PDF
This slide outlines the difference between augmented and artificial intelligence based on the factors such as the need of humans, approach, mode focus, and decision making. Here you can discover an assortment of the finest PowerPoint and Google Slides templates. With these templates, you can create presentations for a variety of purposes while simultaneously providing your audience with an eye catching visual experience. Download Difference Between Artificial And Augmented Intelligence Ppt PowerPoint Presentation Diagram Graph Charts PDF to deliver an impeccable presentation. These templates will make your job of preparing presentations much quicker, yet still, maintain a high level of quality. Slidegeeks has experienced researchers who prepare these templates and write high quality content for you. Later on, you can personalize the content by editing the Difference Between Artificial And Augmented Intelligence Ppt PowerPoint Presentation Diagram Graph Charts PDF.
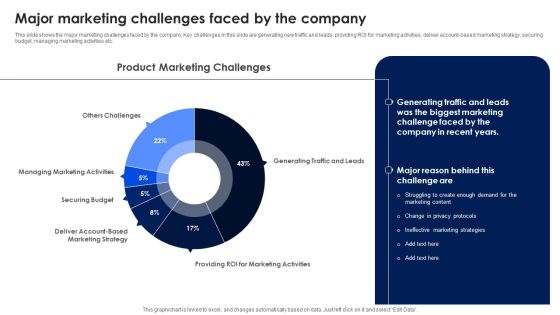
Major Marketing Challenges Faced By The Company Ppt PowerPoint Presentation Diagram Graph Charts PDF
This slide shows the major marketing challenges faced by the company. Key challenges in this slide are generating new traffic and leads, providing ROI for marketing activities, deliver account based marketing strategy, securing budget, managing marketing activities etc. Find highly impressive Major Marketing Challenges Faced By The Company Ppt PowerPoint Presentation Diagram Graph Charts PDF on Slidegeeks to deliver a meaningful presentation. You can save an ample amount of time using these presentation templates. No need to worry to prepare everything from scratch because Slidegeeks experts have already done a huge research and work for you. You need to download Major Marketing Challenges Faced By The Company Ppt PowerPoint Presentation Diagram Graph Charts PDF for your upcoming presentation. All the presentation templates are 100 percent editable and you can change the color and personalize the content accordingly. Download now.

Disadvantages Associated With Multi Brand Strategy Ppt PowerPoint Presentation Diagram Graph Charts PDF
This slide showcases disadvantages of multi brand strategy in market. Key drawbacks are consumer expectations, difficulty in brand management and overlapping of brands. Explore a selection of the finest Disadvantages Associated With Multi Brand Strategy Ppt PowerPoint Presentation Diagram Graph Charts PDF here. With a plethora of professionally designed and pre made slide templates, you can quickly and easily find the right one for your upcoming presentation. You can use our Disadvantages Associated With Multi Brand Strategy Ppt PowerPoint Presentation Diagram Graph Charts PDF to effectively convey your message to a wider audience. Slidegeeks has done a lot of research before preparing these presentation templates. The content can be personalized and the slides are highly editable. Grab templates today from Slidegeeks.

Process To Formulate Performance Marketing Campaign Ppt PowerPoint Presentation Diagram Graph Charts PDF
This slide showcases process that can help organization to formulate performance marketing campaign and run online targeted ads. Its key steps are - establish campaign objectives, determine marketing channels, run marketing campaigns and optimize campaigns Explore a selection of the finest Process To Formulate Performance Marketing Campaign Ppt PowerPoint Presentation Diagram Graph Charts PDF here. With a plethora of professionally designed and pre made slide templates, you can quickly and easily find the right one for your upcoming presentation. You can use our Process To Formulate Performance Marketing Campaign Ppt PowerPoint Presentation Diagram Graph Charts PDF to effectively convey your message to a wider audience. Slidegeeks has done a lot of research before preparing these presentation templates. The content can be personalized and the slides are highly editable. Grab templates today from Slidegeeks.
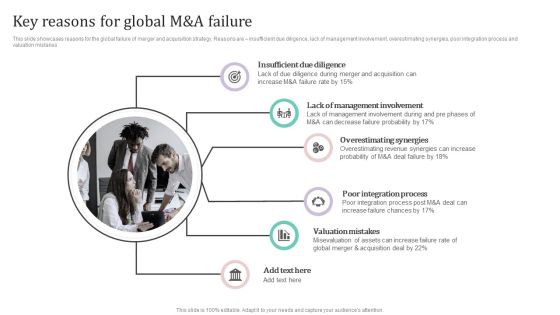
Key Reasons For Global M And A Failure Ppt PowerPoint Presentation Diagram Graph Charts PDF
This slide showcases reasons for the global failure of merger and acquisition strategy. Reasons are insufficient due diligence, lack of management involvement, overestimating synergies, poor integration process and valuation mistakes.Find highly impressive Key Reasons For Global M And A Failure Ppt PowerPoint Presentation Diagram Graph Charts PDF on Slidegeeks to deliver a meaningful presentation. You can save an ample amount of time using these presentation templates. No need to worry to prepare everything from scratch because Slidegeeks experts have already done a huge research and work for you. You need to download Key Reasons For Global M And A Failure Ppt PowerPoint Presentation Diagram Graph Charts PDF for your upcoming presentation. All the presentation templates are 100precent editable and you can change the color and personalize the content accordingly. Download now.
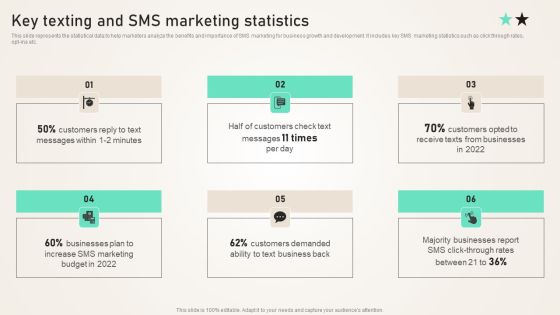
Key Texting And SMS Marketing Statistics Ppt PowerPoint Presentation Diagram Graph Charts PDF
This slide represents the statistical data to help marketers analyze the benefits and importance of SMS marketing for business growth and development. It includes key SMS marketing statistics such as click through rates, opt-ins etc. Get a simple yet stunning designed Key Texting And SMS Marketing Statistics Ppt PowerPoint Presentation Diagram Graph Charts PDF. It is the best one to establish the tone in your meetings. It is an excellent way to make your presentations highly effective. So, download this PPT today from Slidegeeks and see the positive impacts. Our easy to edit Key Texting And SMS Marketing Statistics Ppt PowerPoint Presentation Diagram Graph Charts PDF can be your go to option for all upcoming conferences and meetings. So, what are you waiting for Grab this template today.

Puzzles Illustrating 9 Steps Linear Manner Manufacturing Flow Charts PowerPoint Templates
We present our puzzles illustrating 9 steps linear manner manufacturing flow charts PowerPoint templates.Use our Business PowerPoint Templates because, A brainwave has occurred to you after review. You know just how to push the graph skyward Use our Design PowerPoint Templates because, This will helps you to explore the minutest detail of each concept and follow the trail to its conclusion. Use our Marketing PowerPoint Templates because,There are a bucketful of brilliant ideas swirling around within your group. Use our Shapes PowerPoint Templates because,You have configured your targets, identified your goals as per priority and importance. Use our Metaphor PowerPoint Templates because,you can put it up there for all to see.Use these PowerPoint slides for presentations relating to abstract, arrow, arrows, business, chart, design, development, diagram, direction, element, flow, flowchart, graph, linear, management, model, motion, organization, plan, process, program, section, segment, set, sign, solution, strategy, symbol, technology. The prominent colors used in the PowerPoint template are Green, White, Gray
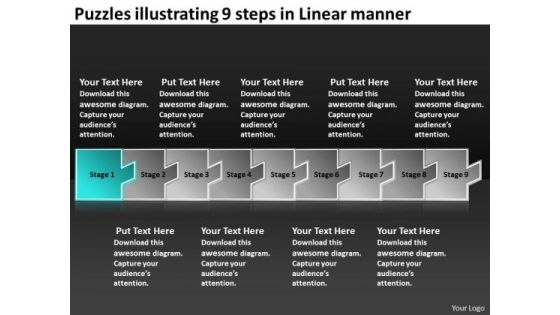
Puzzles Illustrating 9 Steps Linear Manner Creating Flow Charts PowerPoint Slides
We present our puzzles illustrating 9 steps linear manner creating flow charts PowerPoint Slides.Use our Business PowerPoint Templates because,The great Bald headed Eagle embodies your personality. The eagle eye to seize upon the smallest of oppurtunities Use our Design PowerPoint Templates because, You can Show them how to churn out fresh ideas. Use our Marketing PowerPoint Templates because,It depicts Rolling along while gathering profits along the way is the aim. Use our Shapes PowerPoint Templates because,This slide imprint them on the minds of your audience via our slides. Use our Metaphor PowerPoint Templates because,you Will surely see all making the grade.Use these PowerPoint slides for presentations relating to abstract, arrow, arrows, business, chart, design, development, diagram, direction, element, flow, flowchart, graph, linear, management, model, motion, organization, plan, process, program, section, segment, set, sign, solution, strategy, symbol, technology. The prominent colors used in the PowerPoint template are Green, White, Gray

3d Homogeneous Puzzle Flow 6 Issue Ppt Office Charts PowerPoint Templates
We present our 3d homogeneous puzzle flow 6 issue ppt office charts PowerPoint templates. Use our Business PowerPoint Templates because, Show how one can contribute to the overall feeling of wellbeing. Use our Puzzles or Jigsaws PowerPoint Templates because, you are going along well but your foresight shows that it may need a slight change in plans or direction. Use our Shapes PowerPoint Templates because, you are the star of your enlightened team. Use our Communication PowerPoint Templates because; explain your strategy to co-ordinate activities of these separate groups. Use our Process and Flows PowerPoint Templates because, Our PowerPoint templates designed for your ideas to sell. Use these PowerPoint slides for presentations relating to abstract, action, attach, box, business, center, chain, chart, color, communication, concept, connection, cube, cycle, data, diagram, flow, globe, horizontal, idea, illustration, individual, information, interaction, jigsaw, join pieces, process puzzle, relationship, shape, success. The prominent colors used in the PowerPoint template are Blue, Gray, and Black
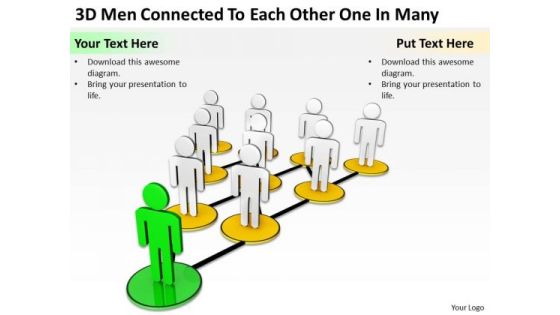
Business Charts Examples 3d Men Connected To Each Other One Many PowerPoint Templates
We present our business charts examples 3d men connected to each other one many PowerPoint templates.Download and present our People PowerPoint Templates because You are an avid believer in ethical practices. Highlight the benefits that accrue with our PowerPoint Templates and Slides. Present our Business PowerPoint Templates because They will Put the wind in your sails. Skim smoothly over the choppy waters of the market. Download and present our Shapes PowerPoint Templates because You can Be the star of the show with our PowerPoint Templates and Slides. Rock the stage with your ideas. Download our Leadership PowerPoint Templates because Our PowerPoint Templates and Slides are the chords of your song. String them along and provide the lilt to your views. Download our Network Diagrams PowerPoint Templates because our PowerPoint Templates and Slides are the string of your bow. Fire of your ideas and conquer the podium.Use these PowerPoint slides for presentations relating to agreement, background, business, businessman, communications,community, concepts, connection, contract, cooperation, crowd, discussion, commerce, figure, friendship, gathering, global, group, human, ideas,illustration, internet, job, leadership, manager, meeting, men, network,occupation, organization, organized, partnership, people, person, professional,recruitment, relationship, resources, silhouette, social, stick, strategy, symbol,team, teamwork, technology, three-dimensional, togetherness, unity. The prominent colors used in the PowerPoint template are Green, Yellow, White. Customers tell us our business charts examples 3d men connected to each other one many PowerPoint templates are readymade to fit into any presentation structure. We assure you our connection PowerPoint templates and PPT Slides are second to none. Customers tell us our business charts examples 3d men connected to each other one many PowerPoint templates will impress their bosses and teams. Use our community PowerPoint templates and PPT Slides effectively help you save your valuable time. PowerPoint presentation experts tell us our business charts examples 3d men connected to each other one many PowerPoint templates look good visually. You can be sure our connection PowerPoint templates and PPT Slides are designed by professionals

Arrows Describing 3 Methods Sequential Manner Ppt Flow Charts Vision PowerPoint Templates
We present our arrows describing 3 methods sequential manner ppt flow charts vision PowerPoint templates.Download our Marketing PowerPoint Templates because this diagram helps you to explain your strategy to co-ordinate activities of these seperate groups. Download and present our Business PowerPoint Templates because you too have got the framework of your companys growth in place. Download and present our Process and Flows PowerPoint Templates because you can Present your views on the methods using our self-explanatory templates. Use our Shapes PowerPoint Templates because this is Aesthetically designed to make a great first impression this template highlights . Download our Arrows PowerPoint Templates because this outlines the path you have in mind in order to boost sales and stay ahead of the competition enhancing your corporate reputation as you go along the road to success.Use these PowerPoint slides for presentations relating to 3d, Abstract, Around, Arrows, Blue, Border, Business, Center, Circle, Circular, Concept, Connections, Copy, Curve, Cycle, Directions, Distribution, Illustration, Management, Middle, Objects, Pieces, Plan, Pointing, Process, Recycle, Rounded, Shadows, Space, System. The prominent colors used in the PowerPoint template are Blue, Gray, Black. People tell us our arrows describing 3 methods sequential manner ppt flow charts vision PowerPoint templates are Wistful. PowerPoint presentation experts tell us our Around PowerPoint templates and PPT Slides are designed by a team of presentation professionals. Presenters tell us our arrows describing 3 methods sequential manner ppt flow charts vision PowerPoint templates are designed by professionals The feedback we get is that our Center PowerPoint templates and PPT Slides will generate and maintain the level of interest you desire. They will create the impression you want to imprint on your audience. You can be sure our arrows describing 3 methods sequential manner ppt flow charts vision PowerPoint templates are Liberated. Professionals tell us our Circle PowerPoint templates and PPT Slides are Dazzling.

Analyzing Multiple Products Offered By Company Ppt PowerPoint Presentation Diagram Graph Charts PDF
This slide provides glimpse about different products and services created by the company that are available in the market for the customers. It includes models available, reviews, price range, target customers, etc. Find a pre designed and impeccable Analyzing Multiple Products Offered By Company Ppt PowerPoint Presentation Diagram Graph Charts PDF. The templates can ace your presentation without additional effort. You can download these easy to edit presentation templates to make your presentation stand out from others. So, what are you waiting for Download the template from Slidegeeks today and give a unique touch to your presentation.

6 Benefits Of Data Augmentation In Sales Ppt Diagram Graph Charts PDF
The slide explains the benefits of data enrichment. It includes cost saving, improved customer experience, improved targeting, higher sales gain, and discard redundant data. Presenting 6 Benefits Of Data Augmentation In Sales Ppt Diagram Graph Charts PDF to dispense important information. This template comprises six stages. It also presents valuable insights into the topics including Discard Redundant Data, Improved Targeting, Enhance Customer Nurturing, Cost Saving. This is a completely customizable PowerPoint theme that can be put to use immediately. So, download it and address the topic impactfully.
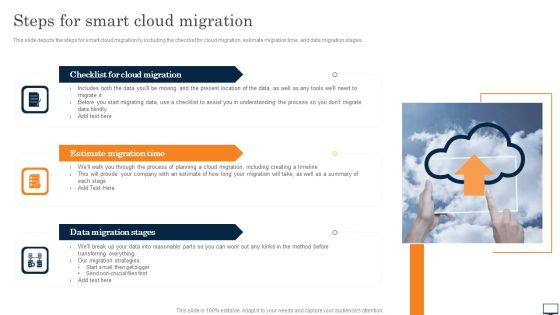
Steps For Smart Cloud Migration Ppt PowerPoint Presentation Diagram Graph Charts PDF
This slide depicts the steps for smart cloud migration by including the checklist for cloud migration, estimate migration time, and data migration stages. From laying roadmaps to briefing everything in detail, our templates are perfect for you. You can set the stage with your presentation slides. All you have to do is download these easy to edit and customizable templates. Steps For Smart Cloud Migration Ppt PowerPoint Presentation Diagram Graph Charts PDF will help you deliver an outstanding performance that everyone would remember and praise you for. Do download this presentation today.
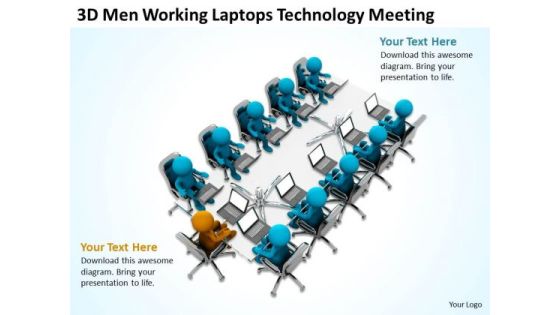
Business Charts Examples 3d Men Working Laptops Technology Meeting PowerPoint Templates
We present our business charts examples 3d men working laptops technology meeting PowerPoint templates.Download and present our Communication PowerPoint Templates because Our PowerPoint Templates and Slides have the Brilliant backdrops. Guaranteed to illuminate the minds of your audience. Download and present our Business PowerPoint Templates because Your success is our commitment. Our PowerPoint Templates and Slides will ensure you reach your goal. Present our People PowerPoint Templates because It will get your audience in sync. Download and present our Computer PowerPoint Templates because you can Break through with our PowerPoint Templates and Slides. Bring down the mental barriers of your audience. Download our Shapes PowerPoint Templates because Our PowerPoint Templates and Slides will let you Hit the right notes. Watch your audience start singing to your tune.Use these PowerPoint slides for presentations relating to 3d, Background, Business, Circle, Color, Communication, Computer, Concept, Connection, Design, Digital, Download, Education, Global, Globe, Group, Human, Ideas, Illustration, Internet, Isolated, Keyboard, Laptop, Learning, Line, Man, Mobile, Modern, Network, Notebook, Object, Office, Online, People, Person, Planet, Screen, Shape, Sphere, Study, Teaching, Technology, Three-Dimensional, University, Web, White, Work, World, Worldwide, Www. The prominent colors used in the PowerPoint template are Blue, Gray, Orange. The feedback we get is that our business charts examples 3d men working laptops technology meeting PowerPoint templates will make you look like a winner. Customers tell us our Communication PowerPoint templates and PPT Slides provide you with a vast range of viable options. Select the appropriate ones and just fill in your text. The feedback we get is that our business charts examples 3d men working laptops technology meeting PowerPoint templates effectively help you save your valuable time. Professionals tell us our Business PowerPoint templates and PPT Slides will generate and maintain the level of interest you desire. They will create the impression you want to imprint on your audience. Presenters tell us our business charts examples 3d men working laptops technology meeting PowerPoint templates help you meet deadlines which are an element of today's workplace. Just browse and pick the slides that appeal to your intuitive senses. You can be sure our Color PowerPoint templates and PPT Slides have awesome images to get your point across.

Business Flow Charts 3d Men Working On Laptop Sitting Pie PowerPoint Slides
We present our business flow charts 3d men working on laptop sitting pie PowerPoint Slides.Present our Technology PowerPoint Templates because It will mark the footprints of your journey. Illustrate how they will lead you to your desired destination. Download and present our Business PowerPoint Templates because You can Score a slam dunk with our PowerPoint Templates and Slides. Watch your audience hang onto your every word. Present our Puzzles or Jigsaws PowerPoint Templates because Our PowerPoint Templates and Slides team portray an attitude of elegance. Personify this quality by using them regularly. Download our Communication PowerPoint Templates because you can Break through with our PowerPoint Templates and Slides. Bring down the mental barriers of your audience. Download and present our Shapes PowerPoint Templates because Your success is our commitment. Our PowerPoint Templates and Slides will ensure you reach your goal.Use these PowerPoint slides for presentations relating to 3d, Blank, Business, Character, Communication, Computer, Connection, Education, Email, Empty, Global Communications, Guy, Human, Icon, Idea, Internet, Jigsaw, Laptop, Men, Mobility, People, Person, Piece, Planning, Pointing, Presentation, Public Speaker, Puppet, Puzzle, Screen, Seminar, Showing, Standing, Supported, Teaching, Technology, Tie, Web Page, White, Wireless Technology. The prominent colors used in the PowerPoint template are Blue, Red, White. The feedback we get is that our business flow charts 3d men working on laptop sitting pie PowerPoint Slides are designed to make your presentations professional. Customers tell us our Connection PowerPoint templates and PPT Slides provide great value for your money. Be assured of finding the best projection to highlight your words. The feedback we get is that our business flow charts 3d men working on laptop sitting pie PowerPoint Slides provide you with a vast range of viable options. Select the appropriate ones and just fill in your text. Professionals tell us our Character PowerPoint templates and PPT Slides will make you look like a winner. Presenters tell us our business flow charts 3d men working on laptop sitting pie PowerPoint Slides are designed by professionals You can be sure our Character PowerPoint templates and PPT Slides will impress their bosses and teams.

Risk Due Diligence For M And A Ppt Diagram Graph Charts PDF
The following slide showcases the approach and execution of due diligence for mergers and acquisitions. It depicts M and A strategy, target screening, transaction execution, integration, divestiture and key insights. Showcasing this set of slides titled Risk Due Diligence For M And A Ppt Diagram Graph Charts PDF. The topics addressed in these templates are Approach Risk, Handoff Risk, Execution Risk, Transaction Curve. All the content presented in this PPT design is completely editable. Download it and make adjustments in color, background, font etc. as per your unique business setting.
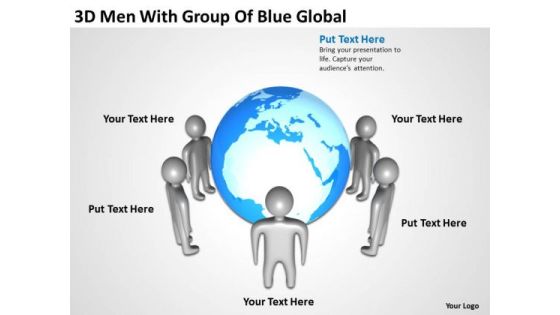
Business Charts Men With Group Of Blue Globe PowerPoint Templates Ppt Backgrounds For Slides
We present our business charts men with group of blue globe PowerPoint templates PPT backgrounds for slides.Download and present our Technology PowerPoint Templates because It will let you Set new benchmarks with our PowerPoint Templates and Slides. They will keep your prospects well above par. Use our Globe PowerPoint Templates because Our PowerPoint Templates and Slides are conceived by a dedicated team. Use them and give form to your wondrous ideas. Present our Business PowerPoint Templates because It is Aesthetically crafted by artistic young minds. Our PowerPoint Templates and Slides are designed to display your dexterity. Download our Communication PowerPoint Templates because Our PowerPoint Templates and Slides will let Your superior ideas hit the target always and everytime. Present our Internet PowerPoint Templates because Our PowerPoint Templates and Slides are specially created by a professional team with vast experience. They diligently strive to come up with the right vehicle for your brilliant Ideas. Use these PowerPoint slides for presentations relating to 3d, Abstract, America, Blue, Business, Circle, Collective, Communication, Concept, Contact, Continent, Country, Crowd, Cyber, Data, Design, Digital, Earth, Establish, Europe, Figure, Global, Globe, Group, Icon, Idea, Illustration, Internet, Isolated, Man, Map, Offer, Peace, People, Planet, Population, Render, Society, Sphere, Stand, Strong, Structure, Team, Teamwork, Tech, Technology, Unity, Web, Woman, World. The prominent colors used in the PowerPoint template are Blue, Gray, White. The feedback we get is that our business charts men with group of blue globe PowerPoint templates PPT backgrounds for slides will make you look like a winner. Customers tell us our America PowerPoint templates and PPT Slides are readymade to fit into any presentation structure. The feedback we get is that our business charts men with group of blue globe PowerPoint templates PPT backgrounds for slides are visually appealing. Professionals tell us our Blue PowerPoint templates and PPT Slides are designed by a team of presentation professionals. Presenters tell us our business charts men with group of blue globe PowerPoint templates PPT backgrounds for slides will help them to explain complicated concepts. You can be sure our Concept PowerPoint templates and PPT Slides are aesthetically designed to attract attention. We guarantee that they will grab all the eyeballs you need.
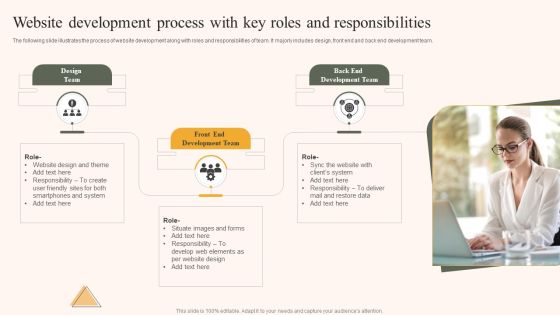
Website Development Process With Key Roles And Responsibilities Ppt Diagram Graph Charts PDF
The following slide illustrates the process of website development along with roles and responsibilities of team. It majorly includes design, front end and back end development team. Persuade your audience using this Website Development Process With Key Roles And Responsibilities Ppt Diagram Graph Charts PDF. This PPT design covers three stages, thus making it a great tool to use. It also caters to a variety of topics including Back End Development, Team, Front End, Development Team. Download this PPT design now to present a convincing pitch that not only emphasizes the topic but also showcases your presentation skills.

Business Charts Examples Lift The Word Experts PowerPoint Templates Ppt Backgrounds For Slides
We present our business charts examples lift the word experts PowerPoint templates PPT backgrounds for slides.Download our People PowerPoint Templates because Our PowerPoint Templates and Slides will let your team Walk through your plans. See their energy levels rise as you show them the way. Download our Technology PowerPoint Templates because It will get your audience in sync. Present our Business PowerPoint Templates because Our PowerPoint Templates and Slides will provide you a launch platform. Give a lift off to your ideas and send them into orbit. Download our Shapes PowerPoint Templates because Our PowerPoint Templates and Slides will bullet point your ideas. See them fall into place one by one. Download our Process and Flows PowerPoint Templates because Our PowerPoint Templates and Slides offer you the needful to organise your thoughts. Use them to list out your views in a logical sequence.Use these PowerPoint slides for presentations relating to 3d, Abstract, Business, Businessman, Character, Computer, Currency, Debt, Economy, Finance, Free, Guy, Heavy, Holding, Human, Icon, Idea, Lifting, Load, Loan, Man, Model, Money, Obligation, Overburdened, , People, Person, Picking, Pressure, Problem, Push, Ratio, Red, Render, Shoulder, Sign, Standing, Stress, Text, The experts, Up, Weight. The prominent colors used in the PowerPoint template are Red, Gray, White. People tell us our business charts examples lift the word experts PowerPoint templates PPT backgrounds for slides are specially created by a professional team with vast experience. They diligently strive to come up with the right vehicle for your brilliant Ideas. The feedback we get is that our Debt PowerPoint templates and PPT Slides look good visually. The feedback we get is that our business charts examples lift the word experts PowerPoint templates PPT backgrounds for slides provide great value for your money. Be assured of finding the best projection to highlight your words. Customers tell us our Economy PowerPoint templates and PPT Slides are effectively colour coded to prioritise your plans They automatically highlight the sequence of events you desire. People tell us our business charts examples lift the word experts PowerPoint templates PPT backgrounds for slides are the best it can get when it comes to presenting. Customers tell us our Computer PowerPoint templates and PPT Slides are specially created by a professional team with vast experience. They diligently strive to come up with the right vehicle for your brilliant Ideas.
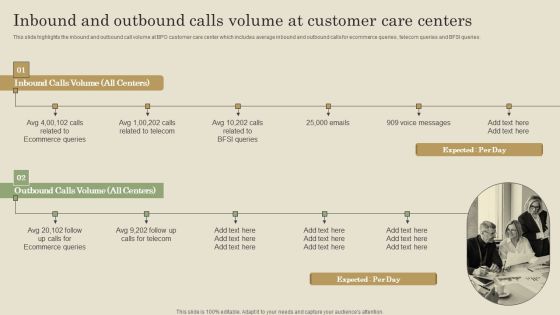
Inbound And Outbound Calls Volume At Customer Care Centers Ppt PowerPoint Presentation Diagram Graph Charts PDF
This slide highlights the inbound and outbound call volume at BPO customer care center which includes average inbound and outbound calls for ecommerce queries , telecom queries and BFSI queries. If your project calls for a presentation, then Slidegeeks is your go to partner because we have professionally designed, easy to edit templates that are perfect for any presentation. After downloading, you can easily edit Inbound And Outbound Calls Volume At Customer Care Centers Ppt PowerPoint Presentation Diagram Graph Charts PDF and make the changes accordingly. You can rearrange slides or fill them with different images. Check out all the handy templates

Highlighting Role Of Chief Strategy Officer In Corporate Growth Ppt PowerPoint Presentation Diagram Graph Charts PDF
This slide provides information regarding the importance of chief strategy officer in handling firms growth. The responsibilities of CSO include communication with CFO for capital development, identification and management of strategic risks, etc. Slidegeeks is here to make your presentations a breeze with Highlighting Role Of Chief Strategy Officer In Corporate Growth Ppt PowerPoint Presentation Diagram Graph Charts PDF With our easy to use and customizable templates, you can focus on delivering your ideas rather than worrying about formatting. With a variety of designs to choose from, you are sure to find one that suits your needs. And with animations and unique photos, illustrations, and fonts, you can make your presentation pop. So whether you are giving a sales pitch or presenting to the board, make sure to check out Slidegeeks first.
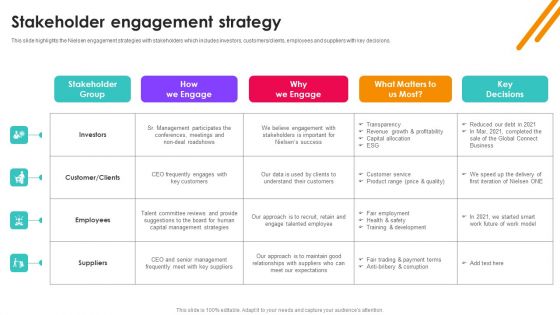
Nielsen Business Profile Stakeholder Engagement Strategy Ppt PowerPoint Presentation Diagram Graph Charts PDF
This slide highlights the Nielsen engagement strategies with stakeholders which includes investors, customers or clients, employees and suppliers with key decisions. The Nielsen Business Profile Stakeholder Engagement Strategy Ppt PowerPoint Presentation Diagram Graph Charts PDF is a compilation of the most recent design trends as a series of slides. It is suitable for any subject or industry presentation, containing attractive visuals and photo spots for businesses to clearly express their messages. This template contains a variety of slides for the user to input data, such as structures to contrast two elements, bullet points, and slides for written information. Slidegeeks is prepared to create an impression.
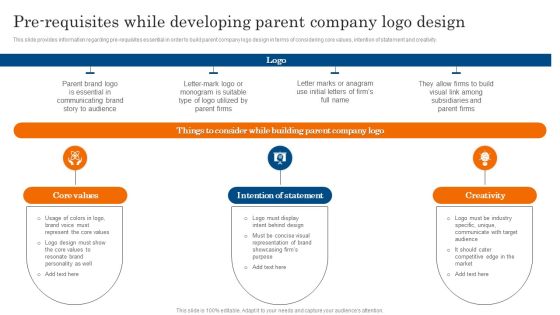
Pre Requisites While Developing Parent Company Logo Design Ppt PowerPoint Presentation Diagram Graph Charts PDF
This slide provides information regarding pre requisites essential in order to build parent company logo design in terms of considering core values, intention of statement and creativity. The Pre Requisites While Developing Parent Company Logo Design Ppt PowerPoint Presentation Diagram Graph Charts PDF is a compilation of the most recent design trends as a series of slides. It is suitable for any subject or industry presentation, containing attractive visuals and photo spots for businesses to clearly express their messages. This template contains a variety of slides for the user to input data, such as structures to contrast two elements, bullet points, and slides for written information. Slidegeeks is prepared to create an impression.

Benefits Of Using Digital Loans Platform Ppt Diagram Graph Charts PDF
This slide contains the benefits of using the platform for digitally lending money to the borrowers. It includes optimize loan cycle, consistent, easy collection of applicant data, quicker decision making, etc. Persuade your audience using this Benefits Of Using Digital Loans Platform Ppt Diagram Graph Charts PDF. This PPT design covers three stages, thus making it a great tool to use. It also caters to a variety of topics including Optimize Loan Cycle, Easy Collection, Candidate Data. Download this PPT design now to present a convincing pitch that not only emphasizes the topic but also showcases your presentation skills.

Business Flow Charts Examples Green Question Mark PowerPoint Templates Ppt Backgrounds For Slides
We present our business flow charts examples green question mark PowerPoint templates PPT backgrounds for slides.Download our People PowerPoint Templates because Our PowerPoint Templates and Slides will definately Enhance the stature of your presentation. Adorn the beauty of your thoughts with their colourful backgrounds. Download our Business PowerPoint Templates because Our PowerPoint Templates and Slides will steer your racing mind. Hit the right buttons and spur on your audience. Download and present our Shapes PowerPoint Templates because you should Whip up a frenzy with our PowerPoint Templates and Slides. They will fuel the excitement of your team. Download and present our Symbol PowerPoint Templates because Our PowerPoint Templates and Slides will let you meet your Deadlines. Download and present our Curves and Lines PowerPoint Templates because You should Ascend the ladder of success with ease. Our PowerPoint Templates and Slides will provide strong and sturdy steps.Use these PowerPoint slides for presentations relating to 3d, Abstract, Advice, Answer, Ask, Background, Bright, Business, Businessman, Career, Character, Choice, Choose, Concept, Confused, Confusion, Decision, Design, Doubt, Geometry, Green, Guy, Help, Human, Icon, Idea, Illustration, Information, Isolated, Man, Mark, Orange, Plastic, Problem, Puppet, Question, Question Mark, Risk, Sign, Solution, Stand, Support, Symbol, Think, Three, Wallpaper, White. The prominent colors used in the PowerPoint template are Green, Gray, White. The feedback we get is that our business flow charts examples green question mark PowerPoint templates PPT backgrounds for slides effectively help you save your valuable time. Customers tell us our Businessman PowerPoint templates and PPT Slides have awesome images to get your point across. The feedback we get is that our business flow charts examples green question mark PowerPoint templates PPT backgrounds for slides will help you be quick off the draw. Just enter your specific text and see your points hit home. Professionals tell us our Bright PowerPoint templates and PPT Slides provide great value for your money. Be assured of finding the best projection to highlight your words. Presenters tell us our business flow charts examples green question mark PowerPoint templates PPT backgrounds for slides are designed to make your presentations professional. You can be sure our Answer PowerPoint templates and PPT Slides will save the presenter time.
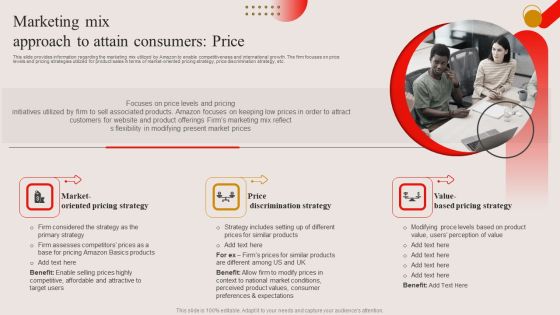
Marketing Mix Approach To Attain Consumers Price Ppt PowerPoint Presentation Diagram Graph Charts PDF
This slide provides information regarding the marketing mix utilized by Amazon to enable competitiveness and international growth. The firm focuses on price levels and pricing strategies utilized for product sales in terms of market-oriented pricing strategy, price discrimination strategy, etc. This Marketing Mix Approach To Attain Consumers Price Ppt PowerPoint Presentation Diagram Graph Charts PDF from Slidegeeks makes it easy to present information on your topic with precision. It provides customization options, so you can make changes to the colors, design, graphics, or any other component to create a unique layout. It is also available for immediate download, so you can begin using it right away. Slidegeeks has done good research to ensure that you have everything you need to make your presentation stand out. Make a name out there for a brilliant performance.
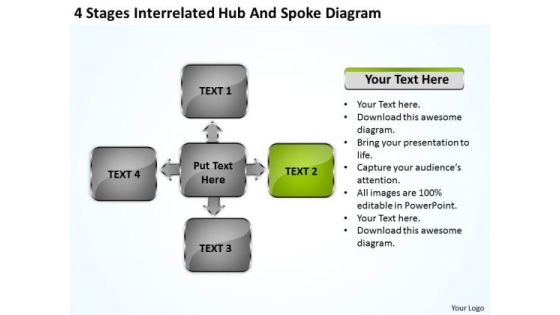
Business Flow Charts Examples Spoke Diagram Ppt PowerPoint Templates Backgrounds For Slides
We present our business flow charts examples spoke diagram ppt PowerPoint templates backgrounds for slides.Download our Technology PowerPoint Templates because Our PowerPoint Templates and Slides will give good value for money. They also have respect for the value of your time. Download and present our Process and Flows PowerPoint Templates because Your audience will believe you are the cats whiskers. Download and present our Boxes PowerPoint Templates because Our PowerPoint Templates and Slides are created with admirable insight. Use them and give your group a sense of your logical mind. Use our Business PowerPoint Templates because our PowerPoint Templates and Slides are the string of your bow. Fire of your ideas and conquer the podium. Present our Arrows PowerPoint Templates because Timeline crunches are a fact of life. Meet all deadlines using our PowerPoint Templates and Slides.Use these PowerPoint slides for presentations relating to 3d, Abstract, Algorithm, Arrow, Background, Blank, Block, Box, Business, Chain, Chart, Circle, Colorful, Concept, Connect, Connection, Corporate, Design, Diagram, Empty, Flow, Flowchart, Graph, Graphic, Hierarchy, Illustration, Information, Isolated, Management, Network, Organization, Organization, Organize, Plan, Procedure, Process, Program, Scalable, Shape, Sign, Solution, Structure, Symbol, Teamwork, Technology. The prominent colors used in the PowerPoint template are Green, Gray, Black.

Business Charts 3d Man And Puzzle With Goal PowerPoint Templates Ppt Backgrounds For Slides
We present our business charts 3d man and puzzle with goal PowerPoint templates PPT backgrounds for slides.Download our Marketing PowerPoint Templates because Our PowerPoint Templates and Slides will give you great value for your money. Be assured of finding the best projection to highlight your words. Use our Construction PowerPoint Templates because Our PowerPoint Templates and Slides will give you great value for your money. Be assured of finding the best projection to highlight your words. Present our Puzzles or Jigsaws PowerPoint Templates because Our PowerPoint Templates and Slides are Clear and concise. Use them and dispel any doubts your team may have. Use our Success PowerPoint Templates because You canTake a leap off the starting blocks with our PowerPoint Templates and Slides. They will put you ahead of the competition in quick time. Present our Symbol PowerPoint Templates because Timeline crunches are a fact of life. Meet all deadlines using our PowerPoint Templates and Slides.Use these PowerPoint slides for presentations relating to 3d, Achievement, Bridge, Built, Business, Businessman, Businessmen, Challenge, Character, Confusion, Construction, Goal, Guy, Human, Icon, Idea, Jigsaw, Last, Marketing, Men, People, Person, Piece, Puzzle, Red, Solution, Stick Figure, Structure, Success. The prominent colors used in the PowerPoint template are Blue, Gray, White. We assure you our business charts 3d man and puzzle with goal PowerPoint templates PPT backgrounds for slides will make you look like a winner. Use our Business PowerPoint templates and PPT Slides are readymade to fit into any presentation structure. We assure you our business charts 3d man and puzzle with goal PowerPoint templates PPT backgrounds for slides are readymade to fit into any presentation structure. Professionals tell us our Built PowerPoint templates and PPT Slides have awesome images to get your point across. The feedback we get is that our business charts 3d man and puzzle with goal PowerPoint templates PPT backgrounds for slides have awesome images to get your point across. You can be sure our Businessman PowerPoint templates and PPT Slides will help them to explain complicated concepts.

AMR Robot Technological Advances Impacting Amrs Hardware Ppt PowerPoint Presentation Diagram Graph Charts PDF
This slide represents the hardware technological advances impacting autonomous mobile robots, and the development of AGVs into AMRs is conceivable because of these technologies. It includes sensors, robot locomotion mechanism, batteries, manipulating equipment, and processing devices. Present like a pro with AMR Robot Technological Advances Impacting Amrs Hardware Ppt PowerPoint Presentation Diagram Graph Charts PDF Create beautiful presentations together with your team, using our easy to use presentation slides. Share your ideas in real time and make changes on the fly by downloading our templates. So whether you are in the office, on the go, or in a remote location, you can stay in sync with your team and present your ideas with confidence. With Slidegeeks presentation got a whole lot easier. Grab these presentations today.

Business Charts Examples Sitting Small Person And Red Query Mark Concept Idea PowerPoint Templates
We present our business charts examples sitting small person and red query mark concept idea PowerPoint templates.Present our People PowerPoint Templates because You should Bet on your luck with our PowerPoint Templates and Slides. Be assured that you will hit the jackpot. Present our Shapes PowerPoint Templates because You canTake a leap off the starting blocks with our PowerPoint Templates and Slides. They will put you ahead of the competition in quick time. Download and present our Business PowerPoint Templates because Our PowerPoint Templates and Slides will steer your racing mind. Hit the right buttons and spur on your audience. Use our Success PowerPoint Templates because Our PowerPoint Templates and Slides will give good value for money. They also have respect for the value of your time. Download our Marketing PowerPoint Templates because You canTake a leap off the starting blocks with our PowerPoint Templates and Slides. They will put you ahead of the competition in quick time.Use these PowerPoint slides for presentations relating to 3d, answer, ask, broker, choice,communication, confusion, education,faq, figure, find, frequently, guy, help,icon, idea, info, information,interrogation, little, man, mark, mystery,object, operator, person, problem,punctuation, query, quest, question,questionable, questionail, render,request, riddle, search, seller, sign,small, solution, support, symbol, think. The prominent colors used in the PowerPoint template are Green, Red, Black. You can be sure our business charts examples sitting small person and red query mark concept idea PowerPoint templates will generate and maintain the level of interest you desire. They will create the impression you want to imprint on your audience. Use our choice PowerPoint templates and PPT Slides are topically designed to provide an attractive backdrop to any subject. Professionals tell us our business charts examples sitting small person and red query mark concept idea PowerPoint templates look good visually. Customers tell us our communication PowerPoint templates and PPT Slides will help you be quick off the draw. Just enter your specific text and see your points hit home. Customers tell us our business charts examples sitting small person and red query mark concept idea PowerPoint templates will help you be quick off the draw. Just enter your specific text and see your points hit home. Use our choice PowerPoint templates and PPT Slides are second to none.

Business Charts 3d Man With Blue Puzzle Piece PowerPoint Templates Ppt Backgrounds For Slides
We present our business charts 3d man with blue puzzle piece PowerPoint templates PPT backgrounds for slides.Download our Construction PowerPoint Templates because Our PowerPoint Templates and Slides are effectively colour coded to prioritise your plans They automatically highlight the sequence of events you desire. Use our Puzzles or Jigsaws PowerPoint Templates because Our PowerPoint Templates and Slides will help you be quick off the draw. Just enter your specific text and see your points hit home. Use our People PowerPoint Templates because Our PowerPoint Templates and Slides will give you great value for your money. Be assured of finding the best projection to highlight your words. Present our Shapes PowerPoint Templates because It is Aesthetically crafted by artistic young minds. Our PowerPoint Templates and Slides are designed to display your dexterity. Use our Metaphors-Visual Concepts PowerPoint Templates because You can Channelise the thoughts of your team with our PowerPoint Templates and Slides. Urge them to focus on the goals you have set.Use these PowerPoint slides for presentations relating to 3d, Assistance, Business, Concept, Connection, Construction, Decision, Development, Different, Element, Finish, Finishing, Goal, Individuality, Installing, Integration, Jigsaw, Jigsaw Puzzle, Last, Link, Man, Merge, Missing, Mosaic, Pavement, Paving, Piece, Problem Solving, Puzzle, Single, Solution, Strategy, Symbol, Unique, Vacancy. The prominent colors used in the PowerPoint template are Blue, White, Gray. Use our business charts 3d man with blue puzzle piece PowerPoint templates PPT backgrounds for slides are designed by a team of presentation professionals. We assure you our Concept PowerPoint templates and PPT Slides look good visually. Use our business charts 3d man with blue puzzle piece PowerPoint templates PPT backgrounds for slides are specially created by a professional team with vast experience. They diligently strive to come up with the right vehicle for your brilliant Ideas. Customers tell us our Connection PowerPoint templates and PPT Slides are aesthetically designed to attract attention. We guarantee that they will grab all the eyeballs you need. Presenters tell us our business charts 3d man with blue puzzle piece PowerPoint templates PPT backgrounds for slides will help you be quick off the draw. Just enter your specific text and see your points hit home. PowerPoint presentation experts tell us our Business PowerPoint templates and PPT Slides have awesome images to get your point across.
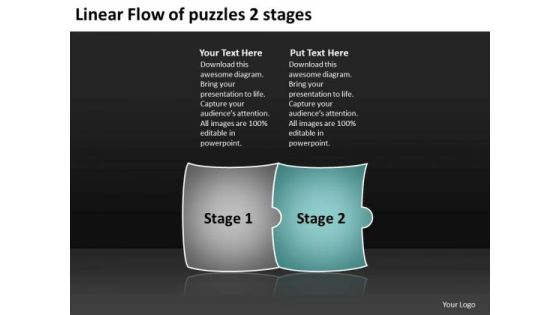
Linear Flow Of Puzzles 2 Stages Ppt Process Charts Examples PowerPoint Templates
We present our linear flow of puzzles 2 stages ppt process charts examples PowerPoint templates.Use our Arrows PowerPoint Templates because, This will helps you to explore the minutest detail of each concept and follow the trail to its conclusion. Use our Marketing PowerPoint Templates because, Customer satisfaction is a mantra of the marketplace. Building a loyal client base is an essential element of your business Use our Puzzles or Jigsaws PowerPoint Templates because,This template helps you to delve on these thoughts and brief your team on the value of your depth of understanding of the subject. Use our Process and Flows PowerPoint Templates because,This shows ideas to get the different elements of your Business to mesh and coalesce into a focused team driven by a common goal to achieve the common aim with Excellence. Use our Business PowerPoint Templates because,Like the famed William Tell, they put aside all emotions and concentrate on the target.Use these PowerPoint slides for presentations relating to Abstract, Arrow, Arrows, Business, Chart, Design, Development, Diagram, Direction, Element, Flow, Flowchart, Graph, Linear, Management, Model, Motion, Organization, Plan, Process, Program, Section, Segment, Set, Sign, Solution, Strategy, Symbol, Technology. The prominent colors used in the PowerPoint template are Green, Gray, White

Developing A Standard Data Flow Charts Ppt PowerPoint Presentation File Clipart PDF
The slide demonstrates the procedures to assist businesses in producing an efficient data flow chartspertinent to their business procedures and in visualising the information flow within the system. it covers steps such as select a system or process, categorize related business activities, draw a context dfd, review work, create child diagrams, expand processes into level 1 dfds and repeat as needed. Persuade your audience using this Developing A Standard Data Flow Charts Ppt PowerPoint Presentation File Clipart PDF. This PPT design covers seven stages, thus making it a great tool to use. It also caters to a variety of topics including Create Child Diagrams, Repeat As Needed, Review Work. Download this PPT design now to present a convincing pitch that not only emphasizes the topic but also showcases your presentation skills.
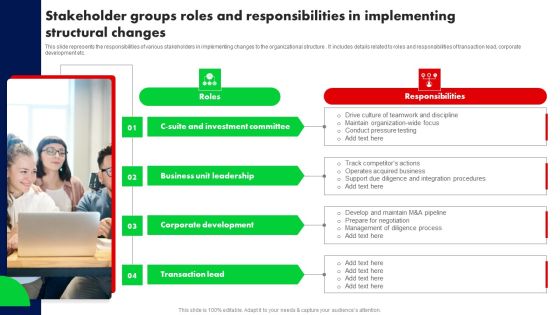
Stakeholder Groups Roles And Responsibilities In Implementing Structural Changes Ppt PowerPoint Presentation Diagram Graph Charts PDF
This slide represents the responsibilities of various stakeholders in implementing changes to the organizational structure . It includes details related to roles and responsibilities of transaction lead, corporate development etc. Retrieve professionally designed Stakeholder Groups Roles And Responsibilities In Implementing Structural Changes Ppt PowerPoint Presentation Diagram Graph Charts PDF to effectively convey your message and captivate your listeners. Save time by selecting pre made slideshows that are appropriate for various topics, from business to educational purposes. These themes come in many different styles, from creative to corporate, and all of them are easily adjustable and can be edited quickly. Access them as PowerPoint templates or as Google Slides themes. You do not have to go on a hunt for the perfect presentation because Slidegeeks got you covered from everywhere.
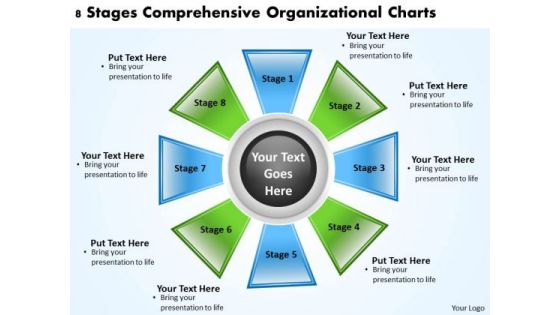
Business Process Management Diagram 8 Stages Comprehensive Organizational Charts PowerPoint Slides
We present our business process management diagram 8 stages comprehensive organizational charts PowerPoint Slides.Download and present our Marketing PowerPoint Templates because Our PowerPoint Templates and Slides will provide weight to your words. They will bring out the depth of your thought process. Download and present our Business PowerPoint Templates because Our PowerPoint Templates and Slides are created with admirable insight. Use them and give your group a sense of your logical mind. Download our Finance PowerPoint Templates because Our PowerPoint Templates and Slides are Clear and concise. Use them and dispel any doubts your team may have. Download our Process and Flows PowerPoint Templates because Our PowerPoint Templates and Slides are created by a hardworking bunch of busybees. Always flitting around with solutions gauranteed to please. Present our Shapes PowerPoint Templates because Our PowerPoint Templates and Slides will bullet point your ideas. See them fall into place one by one.Use these PowerPoint slides for presentations relating to Box, Brochure, Business, Button, Catalog, Chart, Circle, Company, Data, Design, Diagram, Direction, Document, Financial, Goals, Graph, Junction, Management, Market, Marketing, Model, Multicolored, Multiple, Navigation, Network, Options, Orange, Pie, Plan, Presentation, Process, Red, Results, Statistics, Stock, Structure, Template, Vector, Website, Wheel. The prominent colors used in the PowerPoint template are Green, Blue, Black.
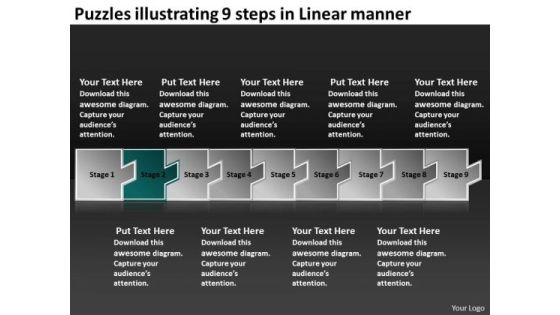
Puzzles Illustrating 9 Steps Linear Manner How To Make Flow Charts PowerPoint Slides
We present our puzzles illustrating 9 steps linear manner how to make flow charts PowerPoint Slides.Use our Business PowerPoint Templates because, You have some exciting plans to spread goodwill among the underprivileged, Expound on your ideas and show to your colleagues how they can help others and in the process increase your Brand value. Use our Design PowerPoint Templates because,The fruit of your labour is about to ripen. Use our Marketing PowerPoint Templates because, You have the ideas and plans on how to achieve success Use our Shapes PowerPoint Templates because,The Venn graphic comprising interlinking circles geometrically demonstate how various functions operating independantly, to a large extent, are essentially interdependant. Use our Metaphor PowerPoint Templates because,With the help of our Slides you can Illustrate the means to prevent or control them using our imaginative templates.Use these PowerPoint slides for presentations relating to abstract, arrow, arrows, business, chart, design, development, diagram, direction, element, flow, flowchart, graph, linear, management, model, motion, organization, plan, process, program, section, segment, set, sign, solution, strategy, symbol, technology. The prominent colors used in the PowerPoint template are Blue, White, Gray

Best Tools To Conduct Market Research Social Media Research Ppt PowerPoint Presentation Diagram Graph Charts PDF
The following slide outlines different software tools through which marketing executives can increase brand visibility on social media platforms. The tools covered in slide are Social Mention, Surveybot, Sprout Social, and Hootsuite. This Best Tools To Conduct Market Research Social Media Research Ppt PowerPoint Presentation Diagram Graph Charts PDF from Slidegeeks makes it easy to present information on your topic with precision. It provides customization options, so you can make changes to the colors, design, graphics, or any other component to create a unique layout. It is also available for immediate download, so you can begin using it right away. Slidegeeks has done good research to ensure that you have everything you need to make your presentation stand out. Make a name out there for a brilliant performance.
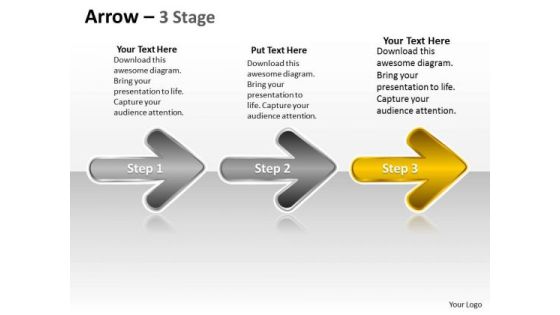
Ppt Series Of Continual Free Custom Presentation PowerPoint Charts Plan 4 Image
We present our PPT series of continual free custom presentation PowerPoint charts plan 4 Image. Use our Symbol PowerPoint Templates because, Brilliant ideas are your forte. Use our Shapes PowerPoint Templates because, Focus on each one and investigate which one would be the best fit for your needs. Use our Signs PowerPoint Templates because; Focus the light on the path to sure shot success. Use our Business PowerPoint Templates because; now imprint them on the minds of your audience via our slides. Use our Arrows PowerPoint Templates because; educate your staff on the means to provide the required support for speedy recovery. Use these PowerPoint slides for presentations relating to arrow, arrowheads, badge, banner, cerulean, colored, colorful, connection, design element, designator, directional, download, emblem, indicator, interface, internet, magenta, marker, matted, menu tool, navigation panel, next, orientation, page site, pictogram, pointer, sign. The prominent colors used in the PowerPoint template are Yellow, Gray, and White

Timeline To Run Performance Marketing Campaign Ppt PowerPoint Presentation Diagram Graph Charts PDF
This slide displays timeline that can help marketers to plan and ensure timely execution of performance marketing campaign. Key elements of this timeline are marketing activity, responsible employee and status The Timeline To Run Performance Marketing Campaign Ppt PowerPoint Presentation Diagram Graph Charts PDF is a compilation of the most recent design trends as a series of slides. It is suitable for any subject or industry presentation, containing attractive visuals and photo spots for businesses to clearly express their messages. This template contains a variety of slides for the user to input data, such as structures to contrast two elements, bullet points, and slides for written information. Slidegeeks is prepared to create an impression.
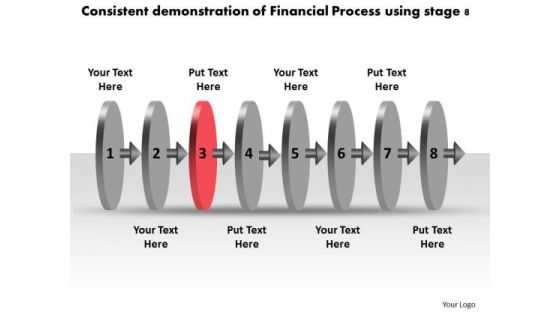
Consistent Demonstration Of Financial Process Using Stage 8 Flow Charts PowerPoint Slides
We present our consistent demonstration of financial process using stage 8 flow charts PowerPoint Slides.Use our Arrows PowerPoint Templates because,our Templates will enthuse your colleagues. Use our Marketing PowerPoint Templates because,Networking is an imperative in todays world. You need to access the views of others. Similarly you need to give access to them of your abilities Use our Business PowerPoint Templates because,You too have got the framework of your companys growth in place. Use our Process and Flows PowerPoint Templates because, Your brain is always churning out ideas like cogs in a wheel. Use our Metaphor PowerPoint Templates because,This slide represents the Tools of the Trade.Use these PowerPoint slides for presentations relating to 3d, Abstract, Around, Arrows, Blue, Border, Business, Center, Circle, Circular, Concept, Connections, Copy, Curve, Cycle, Directions, Distribution, Illustration, Management, Middle, Objects, Pieces, Plan, Pointing, Process, Recycle, Rounded, Shadows, Space, System. The prominent colors used in the PowerPoint template are Red, Gray, Black

Deployment Of Digital Twin In Retail Sector Ppt PowerPoint Presentation Diagram Graph Charts PDF
This slide describes the application of digital twin technology in the retail industry and how it can enhance the customer experience and efficient in store planning. This Deployment Of Digital Twin In Retail Sector Ppt PowerPoint Presentation Diagram Graph Charts PDF from Slidegeeks makes it easy to present information on your topic with precision. It provides customization options, so you can make changes to the colors, design, graphics, or any other component to create a unique layout. It is also available for immediate download, so you can begin using it right away. Slidegeeks has done good research to ensure that you have everything you need to make your presentation stand out. Make a name out there for a brilliant performance.
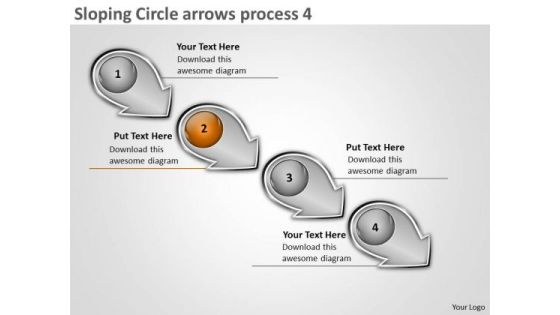
Sloping Circle Arrows Process 4 Business System Flow Charts PowerPoint Slides
We present our sloping circle arrows process 4 business system flow charts PowerPoint Slides. Use our Arrows PowerPoint Templates because; educate your listeners on the means to keep it ticking over. Use our Spheres PowerPoint Templates because, guaranteed to focus the minds of your team. Use our Symbol PowerPoint Templates because, you have analyzed the illness and know the need. Use our Marketing PowerPoint Templates because, Our PowerPoint templates give this step by step process to achieve the aim. Use our Process and Flows PowerPoint Templates because, Gears interconnected: - The Gear Train is a basic element of living and daily business. Use these PowerPoint slides for presentations relating to Arrow, Business, Circle, Circular, Collection, Connection, Cursor, Decoration, Design, Dimensional, Direction, Element, Icon, Illustration, Information, Modern, Motion, Paper, Perspective, Plastic, Pointer, Pointing, Process, Recycle, Recycling, Reflective, Set, Shape, Shiny, Sign, Symbol, Technology. The prominent colors used in the PowerPoint template are Orange, Gray, and Black

Timeline For Application Development Design Implement And Release Ppt PowerPoint Presentation Diagram Graph Charts
This is a timeline for application development design implement and release ppt powerpoint presentation diagram graph charts. This is a five stage process. The stages in this process are overlapping timeline, overlapping roadmap, overlapping linear roadmap.

Orientated Circle Arrow Process 5 What Is Flow Charts PowerPoint Slides
We present our orientated circle arrow process 5 what is flow charts PowerPoint Slides. Use our Arrows PowerPoint Templates because, you have the basic goal in mind. Use our Spheres PowerPoint Templates because, to take your team soaring to the pinnacle they crave. Use our Symbol PowerPoint Templates because, Its also been said that prevention is better than cure, either way you have a store of knowledge for sure. Use our Marketing PowerPoint Templates because, it is in your DNA to analyses possible causes to the minutest detail. Use our Process and Flows PowerPoint Templates because, you have the plans to increase the strength of your business relationships. Use these PowerPoint slides for presentations relating to Arrow, Business, Circle, Circular, Collection, Connection, Cursor, Decoration, Design, Dimensional, Direction, Element, Icon, Illustration, Information, Modern, Motion, Paper, Perspective, Plastic, Pointer, Pointing, Process, Recycle, Recycling, Reflective, Set, Shape, Shiny, Sign, Symbol, Technology. The prominent colors used in the PowerPoint template are Red, Gray, and Black

3d Interconnected Puzzle Illustrating 4 Stages Flow Charts Vision PowerPoint Templates
We present our 3d interconnected puzzle illustrating 4 stages flow charts vision PowerPoint templates.Use our Success PowerPoint Templates because, The success of your venture depends on the performance of every team member. Use our Puzzles or Jigsaws PowerPoint Templates because,This helps you to comprehend your plan to get the entire act together. Use our Shapes PowerPoint Templates because,This diagram helps in examine each brilliant thought in thorough detail highlighting all the pros and cons as minutely as possible. Use our Business PowerPoint Templates because,The fruits of your labour are beginning to show.Enlighten them on the great plans you have for their enjoyment Use our Metaphors-Visual Concepts PowerPoint Templates because,This template helps you to delve on these thoughts and brief your team on the value of your depth of understanding of the subject.Use these PowerPoint slides for presentations relating to Assembly, complete, concept, copy, finish, finished, fit, idea, interlock, jigsaw, match, metaphor, mystery, outline, patience, picture, piece, play, playing, point, pointing, problem, puzzle, quiz, skill, solution, solved, space, struggle, success, support, teamwork. The prominent colors used in the PowerPoint template are Blue, Gray, Black

Smart Grid Architectural Framework Information And Communication Technology Ppt Powerpoint Presentation Diagram Graph Charts
This is a smart grid architectural framework information and communication technology ppt powerpoint presentation diagram graph charts. This is a three stage process. The stages in this process are functional architecture, functional planning, functional designing.

Business Diagram Four Colorful Pie Charts For Data Representation Presentation Template
This diagram is designed with four colorful pie charts. Download this diagram to analyze the key points. This diagram offers a way for your audience to visually conceptualize the process.
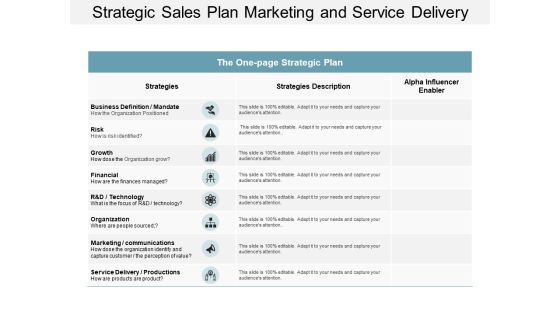
Strategic Sales Plan Marketing And Service Delivery Ppt Powerpoint Presentation Diagram Graph Charts
This is a strategic sales plan marketing and service delivery ppt powerpoint presentation diagram graph charts. This is a three stage process. The stages in this process are one page strategy, one page plan, one page approach.

Sample Process Flow Tools Diagram Powerpoint Slides
This is a sample process flow tools diagram powerpoint slides. This is a seven stage process. The stages in this process are check sheet, process flow chart, pareto analysis, control chart, scatter diagram, cause and effect diagram, histogram.

Data Collection Histograms Ppt PowerPoint Presentation Design Templates
This is a data collection histograms ppt powerpoint presentation design templates. This is a five stage process. The stages in this process are histogram, business, marketing, analysis, chart.
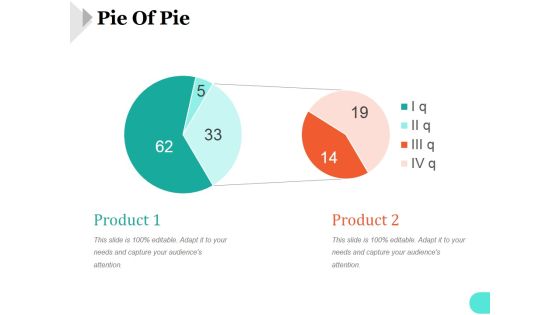
Pie Of Pie Ppt PowerPoint Presentation Visuals
This is a pie of pie ppt powerpoint presentation visuals. This is a two stage process. The stages in this process are pie chart, marketing, strategy, analysis, business.
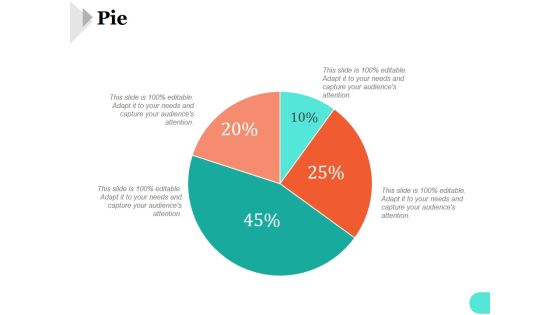
Pie Ppt PowerPoint Presentation Topics
This is a pie ppt powerpoint presentation topics. This is a four stage process. The stages in this process are pie chart, marketing, strategy, analysis, business.
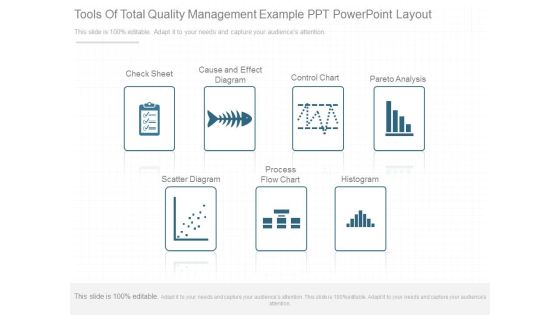
Tools Of Total Quality Management Example Ppt Powerpoint Layout
This is a tools of total quality management example ppt powerpoint layout. This is a seven stage process. The stages in this process are check sheet, cause and effect diagram, control chart, pareto analysis, scatter diagram, process flow chart, histogram.

Data Search With Various Charts To Recognize Market Trends Icon Ppt PowerPoint Presentation Infographic Template Clipart PDF
Persuade your audience using this data search with various charts to recognize market trends icon ppt powerpoint presentation infographic template clipart pdf. This PPT design covers three stages, thus making it a great tool to use. It also caters to a variety of topics including data search with various charts to recognize market trends icon. Download this PPT design now to present a convincing pitch that not only emphasizes the topic but also showcases your presentation skills.

Bar Graph Ppt PowerPoint Presentation Styles Picture
This is a bar graph ppt powerpoint presentation styles picture. This is a four stage process. The stages in this process are business, strategy, marketing, analysis, chart and graph, bar graph.

Business Model Template 2 Ppt PowerPoint Presentation Slides
This is a business model template 2 ppt powerpoint presentation slides. This is a three stage process. The stages in this process are business, pie chart, marketing, strategy, analysis.

Donut Ppt PowerPoint Presentation File Designs
This is a donut ppt powerpoint presentation file designs. This is a six stage process. The stages in this process are donut chart, marketing, strategy, analysis, business.

Portfolio Evaluation Template 2 Ppt PowerPoint Presentation Picture
This is a portfolio evaluation template 2 ppt powerpoint presentation picture. This is a five stage process. The stages in this process are business, strategy, marketing, analysis, finance, chart and graph.

Portfolio Evaluation Ppt PowerPoint Presentation Infographics Objects
This is a portfolio evaluation ppt powerpoint presentation infographics objects. This is a two stage process. The stages in this process are business, finance, bar graph, pie chart, marketing, analysis, investment.
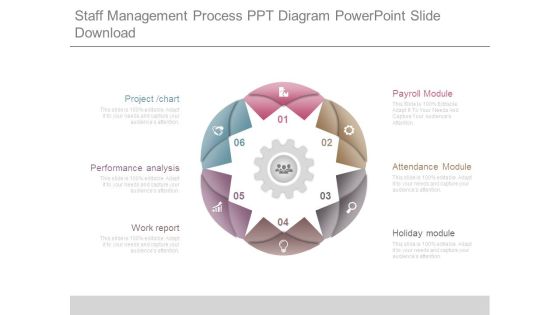
Staff Management Process Ppt Diagram Powerpoint Slide Download
This is a staff management process ppt diagram powerpoint slide download. This is a six stage process. The stages in this process are project chart, performance analysis, work report, holiday module, attendance module, payroll module.

Business Strategy Presentation Outline Ppt PowerPoint Presentation Styles Skills
This is a business strategy presentation outline ppt powerpoint presentation styles skills. This is a fifteen stage process. The stages in this process are executive summary, project timeline chart, swot analysis, focus on your strengths, annual budget.

Area Stacked Ppt PowerPoint Presentation File Design Templates
This is a area stacked ppt powerpoint presentation file design templates. This is a two stage process. The stages in this process are area chart, growth, analysis, strategy, business.
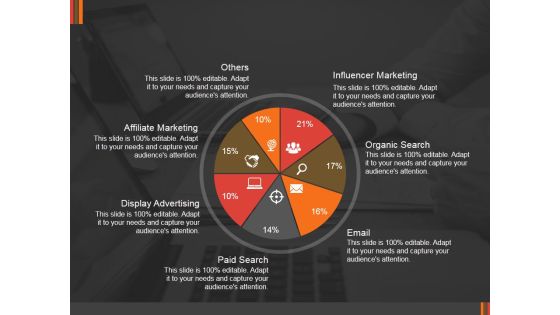
Marketing Research By Channels Ppt PowerPoint Presentation Pictures Example
This is a marketing research by channels ppt powerpoint presentation pictures example. This is a seven stage process. The stages in this process are business, pie chart, marketing, analysis, strategy, success.

Competitor Market Share And Sales Revenues Ppt PowerPoint Presentation Outline Templates
This is a competitor market share and sales revenues ppt powerpoint presentation outline templates. This is a five stage process. The stages in this process are business, line chart, marketing, analysis, strategy.

Activity Ratios Ppt PowerPoint Presentation Summary Tips
This is a activity ratios ppt powerpoint presentation summary tips. This is a two stage process. The stages in this process are finance, chart graph, marketing, planning, analysis.

Liquidity Ratios Ppt PowerPoint Presentation Inspiration Skills
This is a liquidity ratios ppt powerpoint presentation inspiration skills. This is a two stage process. The stages in this process are finance, chart graph, marketing, planning, analysis.

Portfolio Evaluation Template 1 Ppt PowerPoint Presentation Designs Download
This is a portfolio evaluation template 1 ppt powerpoint presentation designs download. This is a five stage process. The stages in this process are business, strategy, marketing, analysis, finance, chart and graph.

Area Ppt PowerPoint Presentation Background Image
This is a area ppt powerpoint presentation background image. This is a two stage process. The stages in this process are area chart, growth, management, analysis, business.

Pie Of Pie Ppt PowerPoint Presentation Topics
This is a pie of pie ppt powerpoint presentation topics. This is a two stage process. The stages in this process are pie chart, marketing, strategy, analysis, business.
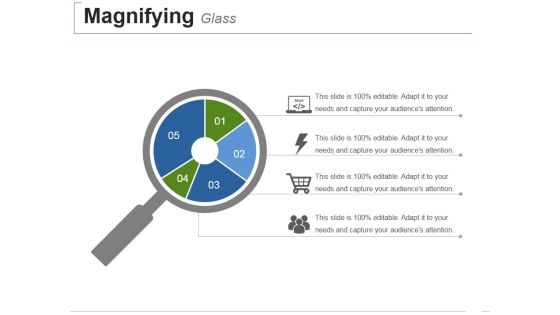
Magnifying Glass Ppt PowerPoint Presentation Styles Demonstration
This is a magnifying glass ppt powerpoint presentation styles demonstration. This is a five stage process. The stages in this process are pie chart, marketing, strategy, analysis, business.

Bar Graph Ppt PowerPoint Presentation Ideas Sample
This is a bar graph ppt powerpoint presentation ideas sample. This is a four stage process. The stages in this process are business, strategy, marketing, analysis, chart and graph, bar graph.

Swimlanes Ppt PowerPoint Presentation Professional
This is a swimlanes ppt powerpoint presentation professional. This is a eight stage process. The stages in this process are business, strategy, marketing, analysis, org chart, process.
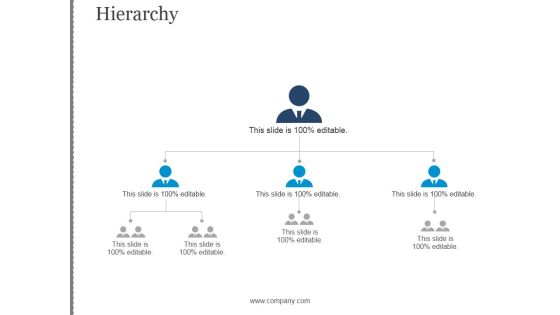
Hierarchy Ppt PowerPoint Presentation Portfolio
This is a hierarchy ppt powerpoint presentation portfolio. This is a three stage process. The stages in this process are business, strategy, marketing, analysis, flow chart.

The Improvement Pdca Cycle Ppt PowerPoint Presentation Layout
This is a the improvement pdca cycle ppt powerpoint presentation layout. This is a five stage process. The stages in this process are project charter, critical to quality tree, pareto chart, solution analysis and selection, statistical process control, mesa, risk assessment, sustainability and benefits, summary statistic, cause and effect diagram, solution implementation, project handoff.

Solution Monitoring Verification Solution Assessment Risk Severity Matrix Themes PDF
This slide shows the solution assessment criteria analysis chart whose purpose is to evaluate the options available for a particular solution based on management receptivity, degree of risk and feasibility, solution cost etc.. along with the total score of each solution. Deliver and pitch your topic in the best possible manner with this solution monitoring verification solution assessment risk severity matrix themes pdf. Use them to share invaluable insights on solution assessment criteria analysis chart and impress your audience. This template can be altered and modified as per your expectations. So, grab it now.
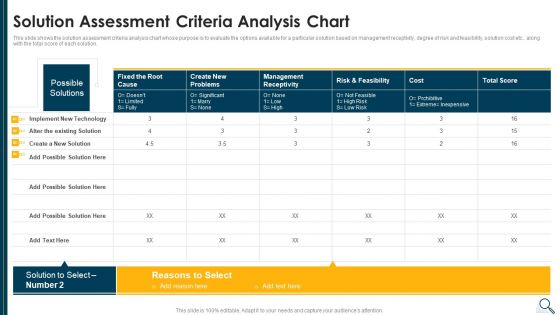
Solution Evaluation Criteria Assessment And Threat Impact Matrix Solution Assessment Criteria Themes PDF
This slide shows the solution assessment criteria analysis chart whose purpose is to evaluate the options available for a particular solution based on management receptivity, degree of risk and feasibility, solution cost etc. along with the total score of each solution. Deliver an awe inspiring pitch with this creative solution evaluation criteria assessment and threat impact matrix solution assessment criteria themes pdf bundle. Topics like solution assessment criteria analysis chart can be discussed with this completely editable template. It is available for immediate download depending on the needs and requirements of the user.

Dashboard To Impact The Performance Powerpoint Slides
This PowerPoint template graphics of meter chart. Download this PPT chart for business performance analysis. This PowerPoint slide is of great help in the business sector to make realistic presentations and provides effective way of presenting your newer thoughts.
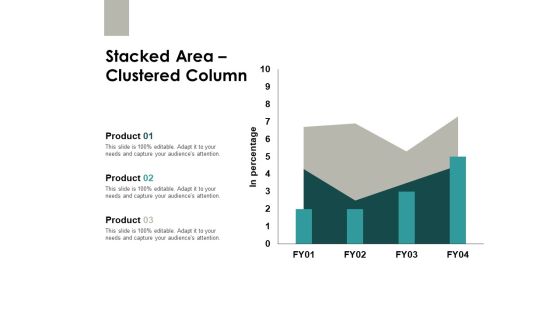
Stacked Area Clustered Column Finance Ppt PowerPoint Presentation Slides Images
This is a stacked area clustered column finance ppt powerpoint presentation slides images. This is a three stage process. The stages in this process are area chart, finance, marketing, analysis, investment.

Area Stacked Finance Ppt PowerPoint Presentation Inspiration Graphics Download
This is a area stacked finance ppt powerpoint presentation inspiration graphics download. This is a three stage process. The stages in this process are area chart, finance, marketing, analysis, investment.
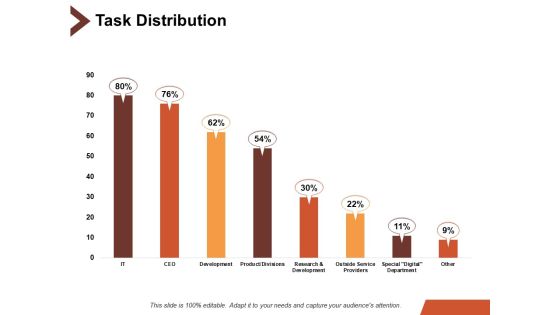
Task Distribution Ppt PowerPoint Presentation Outline Rules
This is a task distribution ppt powerpoint presentation outline rules. This is a eight stage process. The stages in this process are bar chart, finance, marketing, business, analysis.

Analyze Results Ppt PowerPoint Presentation Slide
This is a analyze results ppt powerpoint presentation slide. This is a two stage process. The stages in this process are analysis, business, marketing, finance, pie chart.
Resource Planning Vector Icon Ppt PowerPoint Presentation Slides Deck
Presenting this set of slides with name resource planning vector icon ppt powerpoint presentation slides deck. This is a three stage process. The stages in this process are skills gap analysis chart with initiatives. This is a completely editable PowerPoint presentation and is available for immediate download. Download now and impress your audience.

Mortgage Lenders Powerpoint Slide Background
This is a mortgage lenders powerpoint slide background. This is a seven stage process. The stages in this process are mortgage lenders, individual consumers, small business lenders, small insurance companies, medium insurance companies, large insurance companies, market analysis pie chart.

Quality Control Tools In Project Management And Techniques For Process Improvement Guidelines PDF
This slide focuses on the quality control tools in management project process which includes cause and effect diagrams, control charts, flow-charting, pareto analysis, inspection, scatter diagrams, runs chart, etc. that are helpful in improving the project process. Presenting quality control tools in project management and techniques for process improvement guidelines pdf to dispense important information. This template comprises five stages. It also presents valuable insights into the topics including cause and effect diagrams, control charts, flow charting, pareto analysis, inspection. This is a completely customizable PowerPoint theme that can be put to use immediately. So, download it and address the topic impactfully.

Bar Graph Ppt PowerPoint Presentation Infographic Template Background
This is a bar graph ppt powerpoint presentation infographic template background. This is a four stage process. The stages in this process are business, strategy, analysis, growth, chart and graph.

Activity Ratios Template 1 Ppt PowerPoint Presentation Portfolio Graphics
This is a activity ratios template 1 ppt powerpoint presentation portfolio graphics. This is a two stage process. The stages in this process are finance, chart graph, marketing, planning, analysis.

Activity Ratios Template 4 Ppt PowerPoint Presentation Portfolio Backgrounds
This is a activity ratios template 4 ppt powerpoint presentation portfolio backgrounds. This is a two stage process. The stages in this process are finance, chart graph, marketing, planning, analysis.

Liquidity Ratios Template Ppt PowerPoint Presentation Outline Elements
This is a liquidity ratios template ppt powerpoint presentation outline elements. This is a two stage process. The stages in this process are finance, chart graph, marketing, planning, analysis.
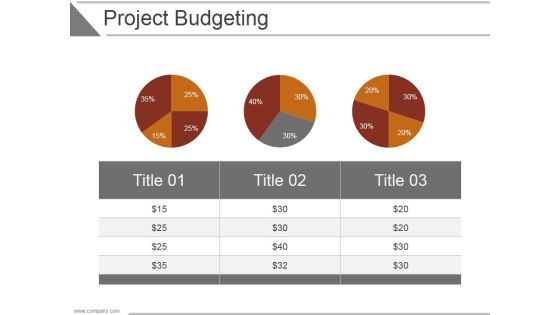
Project Budgeting Ppt PowerPoint Presentation Picture
This is a project budgeting ppt powerpoint presentation picture. This is a three stage process. The stages in this process are business, strategy, analysis, marketing, chart and graph, finance.
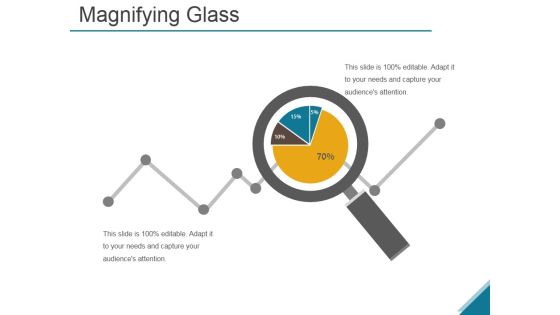
Magnifying Ppt PowerPoint Presentation Outline Maker
This is a magnifying ppt powerpoint presentation outline maker. This is a four stage process. The stages in this process are business, strategy, analysis, success, chart and graph, finance.
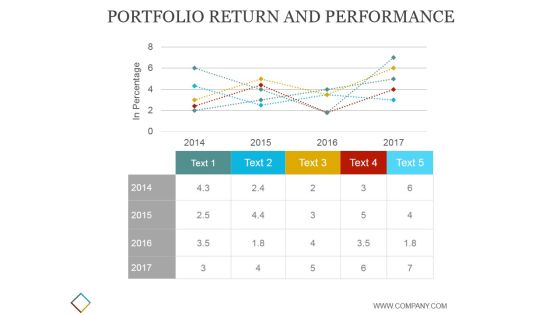
Portfolio Return And Performance Template Ppt PowerPoint Presentation Visuals
This is a portfolio return and performance template ppt powerpoint presentation visuals. This is a five stage process. The stages in this process are business, strategy, marketing, analysis, finance, chart and graph, growth.

Big Data Opportunities And Challenges Template 1 Ppt PowerPoint Presentation Infographic Template Summary
This is a big data opportunities and challenges template 1 ppt powerpoint presentation infographic template summary. This is a three stage process. The stages in this process are business, pie chart, finance, marketing, analysis, strategy.
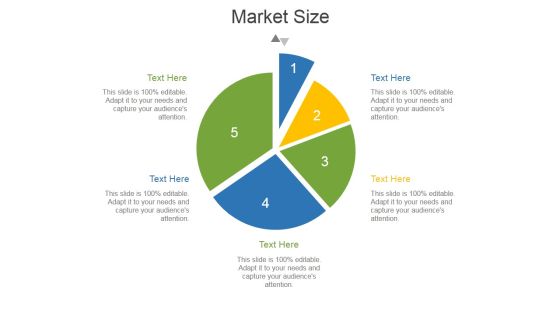
Market Size Template 3 Ppt PowerPoint Presentation Template
This is a market size template 3 ppt powerpoint presentation template. This is a five stage process. The stages in this process are pie chart, marketing, strategy, analysis, business.

Current Staff Composition Ppt PowerPoint Presentation Layouts Mockup
This is a current staff composition ppt powerpoint presentation layouts mockup. This is a five stage process. The stages in this process are business, pie chart, marketing, strategy, analysis.
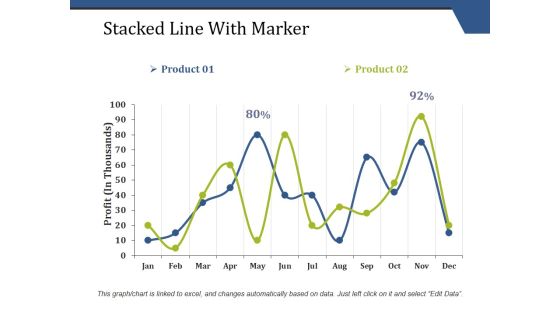
Stacked Line With Marker Ppt PowerPoint Presentation Model Background
This is a stacked line with marker ppt powerpoint presentation model background. This is a two stage process. The stages in this process are business, line chart, finance, growth, analysis.

Pie Of Pie Ppt Powerpoint Presentation Infographics Layout Ideas
This is a pie of pie ppt powerpoint presentation infographics layout ideas. This is a four stage process. The stages in this process are pie chart, marketing, business, analysis, management.
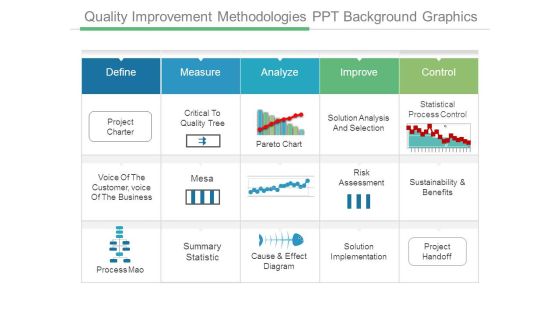
Quality Improvement Methodologies Ppt Background Graphics
This is a quality improvement methodologies ppt background graphics. This is a five stage process. The stages in this process are define, measure, analyze, improve, control, project charter, critical to quality tree, pareto chart, solution analysis and selection, statistical process control, voice of the customer, voice of the business, mesa, risk assessment, sustainability and benefits, process mao, summary statistic, cause and effect diagram, solution implementation, project handoff.

Continuous Improvement Cycle Powerpoint Show
This is a continuous improvement cycle powerpoint show. This is a five stage process. The stages in this process are define, measure, analyze, improve, control, project charter, critical to quality tree, pareto chart, solution analysis and selection, statistical process control, voice of the customer voice of the business, mesa, risk assessment, sustainability and benefits, process mao, summary statistic, cause and effect diagram, solution implementation, project handoff.

Pdca Infographic Template Powerpoint Slide Backgrounds
This is a pdca infographic template powerpoint slide backgrounds. This is a five stage process. The stages in this process are define, measure, analyze, improve, control, project charter, critical to quality tree, pareto chart, solution analysis and selection, statistical process control, voice of the customer voice of the business, mesa, risk assessment, sustainability and benefits, process mao, summary statistic, cause and effect diagram, solution implementation, project handoff.
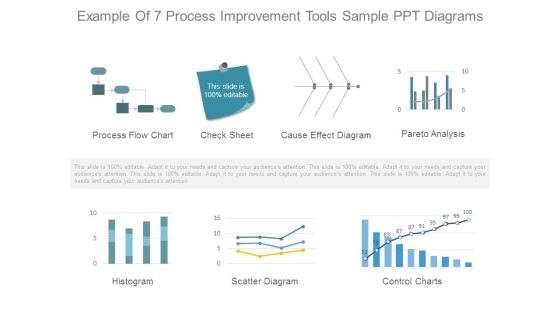
Example Of 7 Process Improvement Tools Sample Ppt Diagrams
This is a example of 7 process improvement tools sample ppt diagrams. This is a seven stage process. The stages in this process are process flow chart, check sheet, cause effect diagram, pareto analysis, histogram, scatter diagram, control charts.
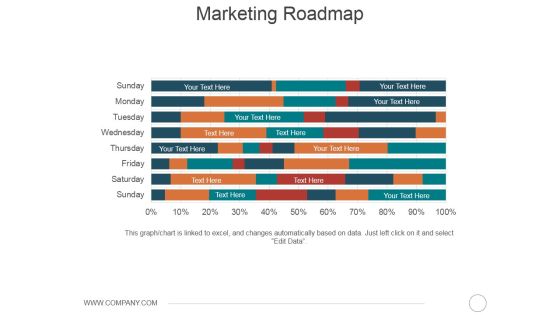
Marketing Roadmap Ppt PowerPoint Presentation Show Graphic Tips
This is a marketing roadmap ppt powerpoint presentation show graphic tips. This is a eight stage process. The stages in this process are business, marketing, strategy, analysis, bar chart.
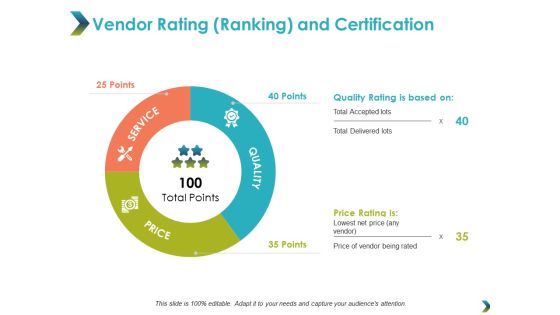
Vendor Rating Ranking And Certification Ppt Powerpoint Presentation Model Background Designs
This is a vendor rating ranking and certification ppt powerpoint presentation model background designs. This is a three stage process. The stages in this process are donut chart, finance, marketing, business, analysis.

The 5 Whys RCA For Late Deliverables Approval Summary PDF
This slide shows the 5 Whys root cause analysis chart for approval of late deliverable requests. It includes reasons for late approvals such as the absence of any team member, no assignment of duty, etc. Presenting The 5 Whys RCA For Late Deliverables Approval Summary PDF Guidelines to dispense important information. This template comprises five stages. It also presents valuable insights into the topics including Deliverables Request , Unplanned Leave, Similar Situations. This is a completely customizable PowerPoint theme that can be put to use immediately. So, download it and address the topic impactfully.

Business Diagram Lock With Missing Puzzle Piece Presentation Template
This business plan power point template has been designed with laptop and bar graph. We have also used pie chart to display business result analysis. Use this PPT for explaining result analysis and calculation process. Add this PPT in your presentations and get good comments from viewers.

Lean Project Management Ppt PowerPoint Presentation Complete Deck With Slides
This is a lean project management ppt powerpoint presentation complete deck with slides. This is a one stage process. The stages in this process are business, strategy, finance, analysis, project management, chart and graph.

Project Health Card Template 1 Ppt PowerPoint Presentation Clipart
This is a project health card template 1 ppt powerpoint presentation clipart. This is a four stage process. The stages in this process are business, strategy, marketing, analysis, success, growth, chart and graph.

Area Chat Finance Investment Ppt PowerPoint Presentation Model Information
Presenting this set of slides with name area chat finance investment ppt powerpoint presentation model information. The topics discussed in these slides are area chart, finance, marketing, analysis, investment. This is a completely editable PowerPoint presentation and is available for immediate download. Download now and impress your audience.

Doughnut Finance Marketing Ppt PowerPoint Presentation Portfolio Display
Presenting this set of slides with name doughnut finance marketing ppt powerpoint presentation portfolio display. The topics discussed in these slides are donut chart, finance, marketing, analysis, investment. This is a completely editable PowerPoint presentation and is available for immediate download. Download now and impress your audience.

Content Ppt PowerPoint Presentation Pictures Information
This is a content ppt powerpoint presentation pictures information. This is a twelve stage process. The stages in this process are risk management plan, risk assessment, risk response matrix, risk mitigation chart, risk identification, risk analysis.

Content Ppt PowerPoint Presentation Model Mockup
This is a content ppt powerpoint presentation model mockup. This is a twelve stage process. The stages in this process are risk management plan, risk assessment, risk response matrix, risk mitigation chart, risk identification, risk analysis.

Data Collection Histograms Ppt PowerPoint Presentation Icon Slides
This is a data collection histograms ppt powerpoint presentation icon slides. This is a two stage process. The stages in this process are bar chart, finance, marketing, business, analysis.

Crm Dashboard Template Ppt PowerPoint Presentation Gallery Ideas
This is a crm dashboard template ppt powerpoint presentation gallery ideas. This is a four stage process. The stages in this process are area chart, growth, strategy, business, analysis.

Portfolio Selection Allocation Template 2 Ppt PowerPoint Presentation Layouts Show
This is a portfolio selection allocation template 2 ppt powerpoint presentation layouts show. This is a six stage process. The stages in this process are business, pie chart, finance, marketing, strategy, analysis.

Hedge Fund Investment Portfolio Ppt Powerpoint Presentation Styles Pictures
This is a hedge fund investment portfolio ppt powerpoint presentation styles pictures. This is a nine stage process. The stages in this process are pie chart, percentage, marketing, business, analysis.

Pie Percentage Marketing Ppt Powerpoint Presentation Inspiration Show
This is a pie percentage marketing ppt powerpoint presentation inspiration show. This is a three stage process. The stages in this process are pie chart, percentage, marketing, business, analysis.

Barriers To Digital Transformation Ppt PowerPoint Presentation Professional Influencers
This is a barriers to digital transformation ppt powerpoint presentation professional influencers. This is a six stage process. The stages in this process are bar chart, finance, marketing, business, analysis.
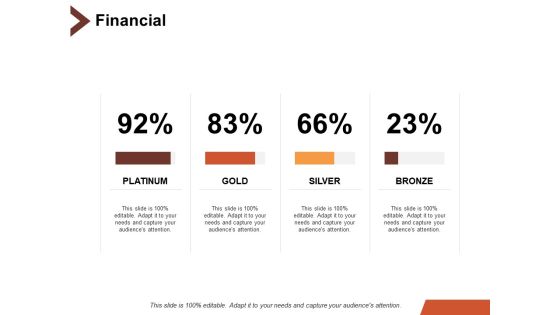
Financial Business Marketing Ppt PowerPoint Presentation Slides Aids
This is a financial business marketing ppt powerpoint presentation slides aids. This is a four stage process. The stages in this process are bar chart, finance, marketing, business, analysis.

Clustered Column Finance Ppt PowerPoint Presentation Pictures Inspiration
This is a clustered column finance ppt powerpoint presentation pictures inspiration. This is a two stage process. The stages in this process are bar chart, finance, marketing, business, analysis.

Stock Photo Golden Dollar Symbol With Pie Graph PowerPoint Slide
This Power Point template has been crafted with graphic of golden dollar symbol and pie chart on a tablet. Display the concept of financial data analysis with this image. Use this image to present financial reports in business presentations.
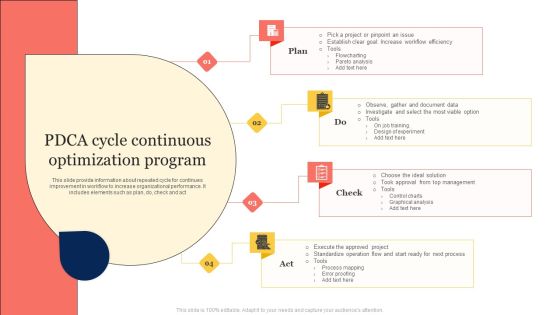
PDCA Cycle Continuous Optimization Program Portrait PDF
This slide provide information about repeated cycle for continues improvement in workflow to increase organizational performance. It includes elements such as plan, do, check and act. Presenting PDCA Cycle Continuous Optimization Program Portrait PDF to dispense important information. This template comprises four stages. It also presents valuable insights into the topics including Plan, Check, Control Charts, Graphical Analysis. This is a completely customizable PowerPoint theme that can be put to use immediately. So, download it and address the topic impactfully.

Project HRM Processes Flowchart Background PDF
This slide represents project human resource management processes flowchart illustrating tools and techniques, inputs and outputs, updates etc that shows all interrelated processes. Showcasing this set of slides titled Project HRM Processes Flowchart Background PDF. The topics addressed in these templates are Organization Chart, Networking, Analysis. All the content presented in this PPT design is completely editable. Download it and make adjustments in color, background, font etc. as per your unique business setting.

Quarterly Financial Performance Evaluation Report Template PDF
This slide showcase quarterly financial performance measurement and analysis summary charts. It highlights the revenue chart, gross profit chart, profit before tax chart, and net profit chart. Showcasing this set of slides titled Quarterly Financial Performance Evaluation Report Template PDF. The topics addressed in these templates are Revenue, Gross Profit, Profit Before Tax . All the content presented in this PPT design is completely editable. Download it and make adjustments in color, background, font etc. as per your unique business setting.
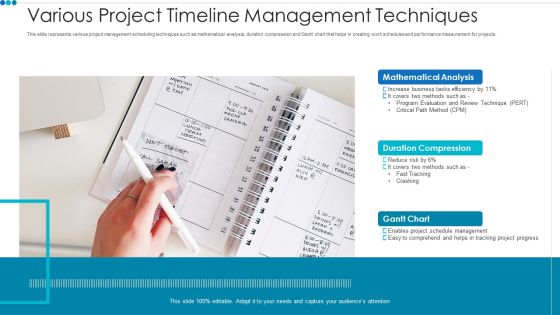
Various Project Timeline Management Techniques Professional PDF
This slide represents various project management scheduling techniques such as mathematical analysis, duration compression and Gantt chart that helps in creating work schedules and performance measurement for projects. Presenting various project timeline management techniques professional pdf to dispense important information. This template comprises three stages. It also presents valuable insights into the topics including mathematical analysis, duration compression, gantt chart. This is a completely customizable PowerPoint theme that can be put to use immediately. So, download it and address the topic impactfully.

Investor Pitch Deck For Seed Funding From Private Investor Table Of Contents Sample PDF
Presenting investor pitch deck for seed funding from private investor table of contents sample pdf. to provide visual cues and insights. Share and navigate important information on fourteen stages that need your due attention. This template can be used to pitch topics like business model of the company, market segmentation analysis chart. In addtion, this PPT design contains high resolution images, graphics, etc, that are easily editable and available for immediate download.

HR Quality Tools To Improve Process Productivity And Effectiveness Ideas PDF
The slide presents some quality tools used in HR functions which adds to the value of continuous improvement process. It includes process flow analysis, cause effect diagrams, control chart, pareto chart and scattergram. Presenting HR Quality Tools To Improve Process Productivity And Effectiveness Ideas PDF to dispense important information. This template comprises six stages. It also presents valuable insights into the topics including Control Chart, Scattergram, Process Flow Analysis, Cause Effect Diagrams. This is a completely customizable PowerPoint theme that can be put to use immediately. So, download it and address the topic impactfully.
IT Cost Assessment With KPI Dashboard To Gain Competitive Advantage Icons PDF
Showcasing this set of slides titled IT Cost Assessment With KPI Dashboard To Gain Competitive Advantage Icons PDF. The topics addressed in these templates are Actual Cost, Yearly Analysis, Breakdown Chart. All the content presented in this PPT design is completely editable. Download it and make adjustments in color, background, font etc. as per your unique business setting.

Team With Bar Graph And Teamwork
This Power Point template has been designed with graphic of 3d team forming a pie chart. In this slide team is displaying data analysis and comparison. Use this editable slide to build innovative presentation for your viewers.

Competitor Market Share And Sales Revenues Ppt PowerPoint Presentation Inspiration Gallery
This is a competitor market share and sales revenues ppt powerpoint presentation inspiration gallery. This is a four stage process. The stages in this process are line chart, growth, marketing, strategy, business, analysis.

Dashboard With Business Icons Powerpoint Slides
This PowerPoint template graphics of meter chart with business icons. Download this PPT chart to simplify business data analysis. This PowerPoint slide is of great help in the business sector to make realistic presentations and provides effective way of presenting your newer thoughts.
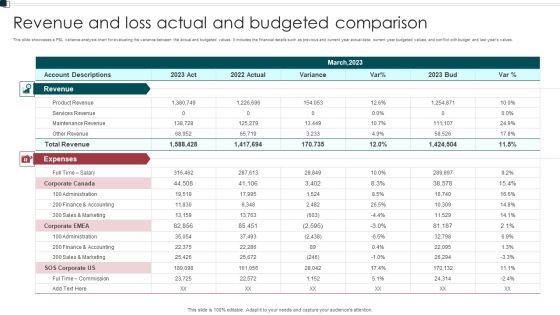
Revenue And Loss Actual And Budgeted Comparison Elements PDF
This slide showcases a P and L variance analysis chart for evaluating the variance between the actual and budgeted values. It includes the financial details such as previous and current year actual data current year budgeted values, and conflict with budget and last years values. Showcasing this set of slides titled Revenue And Loss Actual And Budgeted Comparison Elements PDF. The topics addressed in these templates are Expenses, Administration, Commission. All the content presented in this PPT design is completely editable. Download it and make adjustments in color, background, font etc. as per your unique business setting.
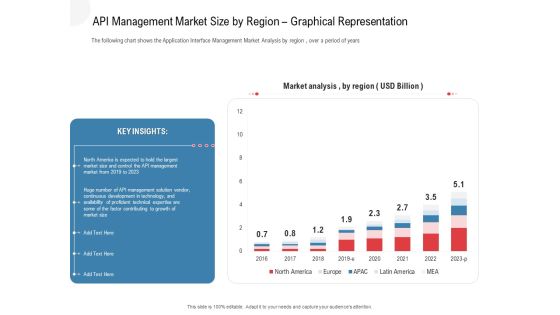
API Outline API Management Market Size By Region Graphical Representation Portrait PDF
The following chart shows the Application Interface Management Market Analysis by region, over a period of years. Deliver and pitch your topic in the best possible manner with this api outline api management market size by region graphical representation portrait pdf. Use them to share invaluable insights on market analysis by region, key insights and impress your audience. This template can be altered and modified as per your expectations. So, grab it now.

API Outline API Management Market Size By Region World Map Representation Themes PDF
The following chart shows the Application Interface Management Market Analysis by region, over a period of years. Presenting api outline api management market size by region world map representation themes pdf to provide visual cues and insights. Share and navigate important information on two stages that need your due attention. This template can be used to pitch topics like large market size in 2019, market with highest cagr for 2019 to 2021 projected. In addition, this PPT design contains high-resolution images, graphics, etc, that are easily editable and available for immediate download.

API Ecosystem API Management Market Size By Region World Map Representation Background PDF
The following chart shows the Application Interface Management Market Analysis by region , over a period of years. Presenting api ecosystem api management market size by region world map representation background pdf to provide visual cues and insights. Share and navigate important information on one stages that need your due attention. This template can be used to pitch topics like development, management, market, growth. In addtion, this PPT design contains high resolution images, graphics, etc, that are easily editable and available for immediate download.

API Management Market API Management Market Size By Region World Map Representation Guidelines PDF
The following chart shows the Application Interface Management Market Analysis by region , over a period of years. Presenting api management market api management market size by region world map representation guidelines pdf to provide visual cues and insights. Share and navigate important information on five stages that need your due attention. This template can be used to pitch topics like management, technical, security solution accounts, market with highest cagr for 2019 2021 projected. In addtion, this PPT design contains high resolution images, graphics, etc, that are easily editable and available for immediate download.

Target Market Assessment Process Roadmap Demonstration PDF
This slide represents the Gantt chart for target market analysis. It includes tasks such as conducting market research, identifying demographics, developing buyer persona, developing business strategy, etc. Showcasing this set of slides titled Target Market Assessment Process Roadmap Demonstration PDF. The topics addressed in these templates are Develop, Target Demographics, Target Market. All the content presented in this PPT design is completely editable. Download it and make adjustments in color, background, font etc. as per your unique business setting.
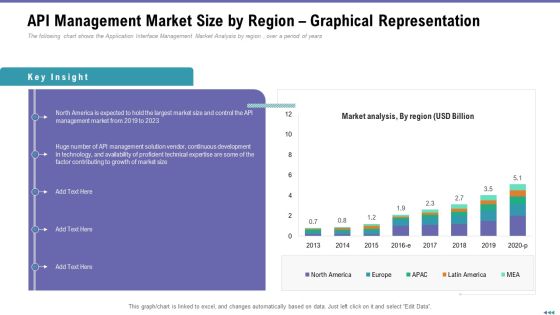
Market Viewpoint Application Programming Interface Governance API Management Market Size By Region Graphical Representation Sample PDF
The following chart shows the Application Interface Management Market Analysis by region , over a period of years. Deliver an awe inspiring pitch with this creative market viewpoint application programming interface governance api management market size by region graphical representation sample pdf bundle. Topics like proficient, technical, continuous, development, technology can be discussed with this completely editable template. It is available for immediate download depending on the needs and requirements of the user.
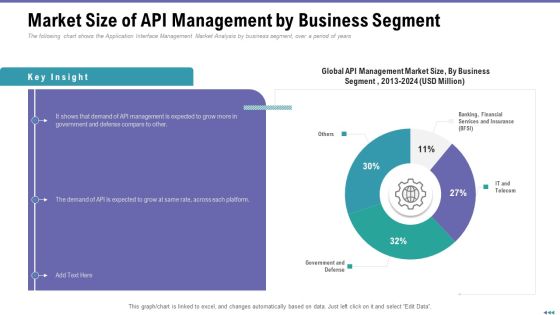
Market Viewpoint Application Programming Interface Governance Market Size Of API Management By Business Segment Structure PDF
The following chart shows the Application Interface Management Market Analysis by business segment, over a period of years. Deliver and pitch your topic in the best possible manner with this market viewpoint application programming interface governance market size of api management by business segment structure pdf. Use them to share invaluable insights on management, market, business, segment and impress your audience. This template can be altered and modified as per your expectations. So, grab it now.
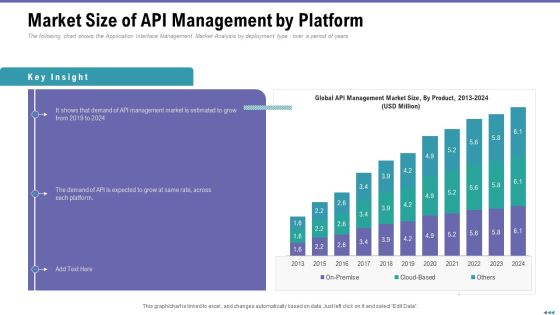
Market Viewpoint Application Programming Interface Governance Market Size Of API Management By Platform Elements PDF
The following chart shows the Application Interface Management Market Analysis by deployment type , over a period of years. Deliver an awe inspiring pitch with this creative market viewpoint application programming interface governance market size of api management by platform elements pdf bundle. Topics like market size of api management by platform can be discussed with this completely editable template. It is available for immediate download depending on the needs and requirements of the user.
API Administration Solution API Management Market Size By Region Graphical Representation Icons PDF
The following chart shows the Application Interface Management Market Analysis by region , over a period of years. Deliver an awe inspiring pitch with this creative api administration solution api management market size by region graphical representation icons pdf bundle. Topics like proficient, technical, continuous, development, technology can be discussed with this completely editable template. It is available for immediate download depending on the needs and requirements of the user.

API Ecosystem Market Size Of API Management By Business Segment Icons PDF
The following chart shows the Application Interface Management Market Analysis by business segment, over a period of years. Deliver and pitch your topic in the best possible manner with this api ecosystem market size of api management by business segment icons pdf. Use them to share invaluable insights on financial, services, insurance, management and impress your audience. This template can be altered and modified as per your expectations. So, grab it now.
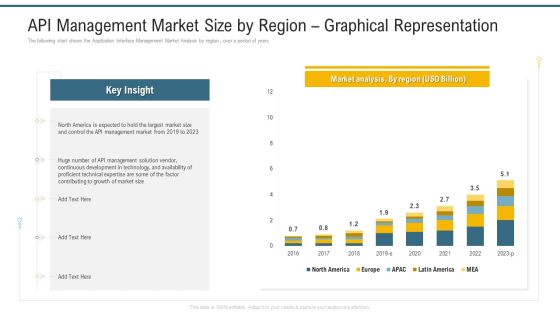
API Management Market Size By Region Graphical Representation Ppt Layouts Visuals PDF
The following chart shows the Application Interface Management Market Analysis by region , over a period of years. Deliver and pitch your topic in the best possible manner with this api management market size by region graphical representation ppt layouts visuals pdf. Use them to share invaluable insights on development in technology, growth of market size, management market and impress your audience. This template can be altered and modified as per your expectations. So, grab it now.

Market Size Of API Management By Platform Ppt Outline Design Templates PDF
The following chart shows the Application Interface Management Market Analysis by deployment type , over a period of years. Deliver and pitch your topic in the best possible manner with this market size of api management by platform ppt outline design templates pdf. Use them to share invaluable insights on management market size, product, demand and impress your audience. This template can be altered and modified as per your expectations. So, grab it now.

API Outline Market Size Of API Management By Platform Ppt Model Pictures PDF
The following chart shows the Application Interface Management Market Analysis by deployment type, over a period of years. Deliver an awe-inspiring pitch with this creative api outline market size of api management by platform ppt model pictures pdf bundle. Topics like market size of api management by platform can be discussed with this completely editable template. It is available for immediate download depending on the needs and requirements of the user.

API Outline Market Size Of API Management By Business Segment Mockup PDF
The following chart shows the Application Interface Management Market Analysis by business segment, over a period of years. Deliver and pitch your topic in the best possible manner with this api outline market size of api management by business segment mockup pdf. Use them to share invaluable insights on government and defense, it and telecom, banking, financial services and insurance, others and impress your audience. This template can be altered and modified as per your expectations. So, grab it now.

API Administration Solution Market Size Of API Management By Business Segment Sample PDF
The following chart shows the Application Interface Management Market Analysis by business segment, over a period of years. Deliver and pitch your topic in the best possible manner with this api administration solution market size of api management by business segment sample pdf. Use them to share invaluable insights on management, market, business, segment and impress your audience. This template can be altered and modified as per your expectations. So, grab it now.

API Administration Solution Market Size Of API Management By Platform Clipart PDF
The following chart shows the Application Interface Management Market Analysis by deployment type , over a period of years. Deliver an awe inspiring pitch with this creative api administration solution market size of api management by platform clipart pdf bundle. Topics like market size of api management by platform can be discussed with this completely editable template. It is available for immediate download depending on the needs and requirements of the user.

API Ecosystem API Management Market Size By Region Graphical Representation Introduction PDF
The following chart shows the Application Interface Management Market Analysis by region , over a period of years. Deliver an awe inspiring pitch with this creative api ecosystem api management market size by region graphical representation introduction pdf bundle. Topics like management, development, technical, market can be discussed with this completely editable template. It is available for immediate download depending on the needs and requirements of the user.

API Ecosystem Market Size Of API Management By Platform Portrait PDF
The following chart shows the Application Interface Management Market Analysis by deployment type , over a period of years. Deliver an awe inspiring pitch with this creative api ecosystem market size of api management by platform portrait pdf bundle. Topics like market size of api management by platform can be discussed with this completely editable template. It is available for immediate download depending on the needs and requirements of the user.
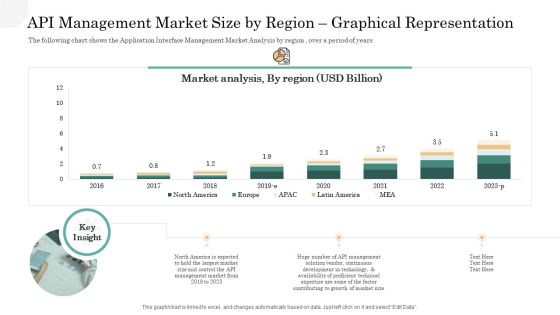
API Management Market API Management Market Size By Region Graphical Representation Ideas PDF
The following chart shows the Application Interface Management Market Analysis by region , over a period of years. Deliver an awe inspiring pitch with this creative api management market api management market size by region graphical representation ideas pdf bundle. Topics like api management market size by region graphical representation can be discussed with this completely editable template. It is available for immediate download depending on the needs and requirements of the user.

API Management Market Market Size Of API Management By Business Segment Mockup PDF
The following chart shows the Application Interface Management Market Analysis by business segment, over a period of years. Deliver an awe inspiring pitch with this creative api management market market size of api management by business segment mockup pdf bundle. Topics like government and defense, it and telecom, banking, financial services and insurance can be discussed with this completely editable template. It is available for immediate download depending on the needs and requirements of the user.

API Management Market Market Size Of API Management By Platform Professional PDF
The following chart shows the Application Interface Management Market Analysis by deployment type , over a period of years. Deliver an awe inspiring pitch with this creative api management market market size of api management by platform professional pdf bundle. Topics like market size of api management by platform can be discussed with this completely editable template. It is available for immediate download depending on the needs and requirements of the user.

Swot Analysis01 Business PowerPoint Themes And PowerPoint Slides 0811
Microsoft PowerPoint Theme and Slide with of project management buttons according swot analysis

API Outline API Management Market Size By Region Tabular Representation Elements PDF
The following chart shows the Application Interface Management Market Analysis by region , over a period of years. Deliver and pitch your topic in the best possible manner with this api outline api management market size by region tabular representation elements pdf. Use them to share invaluable insights on api management market size by region, tabular representation and impress your audience. This template can be altered and modified as per your expectations. So, grab it now.

API Administration Solution API Management Market Size By Region Tabular Representation Ppt Styles Graphics PDF
The following chart shows the Application Interface Management Market Analysis by region , over a period of years. Deliver and pitch your topic in the best possible manner with this api administration solution api management market size by region tabular representation ppt styles graphics pdf. Use them to share invaluable insights on api management market size by region tabular representation and impress your audience. This template can be altered and modified as per your expectations. So, grab it now.

API Ecosystem API Management Market Size By Region Tabular Representation Guidelines PDF
The following chart shows the Application Interface Management Market Analysis by region, over a period of years. Deliver an awe inspiring pitch with this creative api ecosystem api management market size by region tabular representation guidelines pdf bundle. Topics like api management market size by region tabular representation can be discussed with this completely editable template. It is available for immediate download depending on the needs and requirements of the user.

API Management Market API Management Market Size By Region Tabular Representation Sample PDF
The following chart shows the Application Interface Management Market Analysis by region , over a period of years. Deliver and pitch your topic in the best possible manner with this api management market api management market size by region tabular representation sample pdf. Use them to share invaluable insights on api management market size by region tabular representation and impress your audience. This template can be altered and modified as per your expectations. So, grab it now.
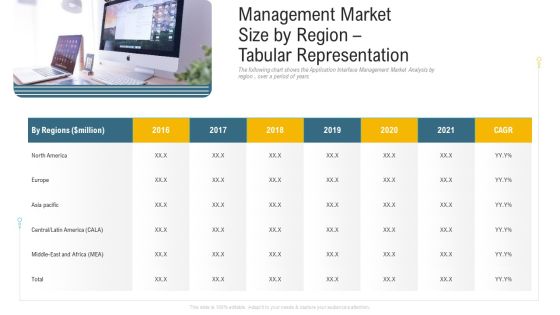
Management Market Size By Region Tabular Representation Ppt Tips PDF
The following chart shows the Application Interface Management Market Analysis by region , over a period of years. Deliver and pitch your topic in the best possible manner with this management market size by region tabular representation ppt tips pdf. Use them to share invaluable insights on management market size by region tabular representation and impress your audience. This template can be altered and modified as per your expectations. So, grab it now.
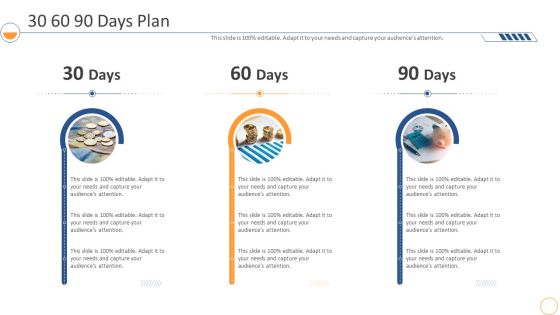
Monthly Company Performance Analysis30 60 90 Days Plan Microsoft PDF
This is a monthly company performance analysis30 60 90 days plan microsoft pdf template with various stages. Focus and dispense information on three stages using this creative set, that comes with editable features. It contains large content boxes to add your information on topics like 30 60 90 days plan. You can also showcase facts, figures, and other relevant content using this PPT layout. Grab it now.

Non-Profit Organization Agency Program Status Report Diagrams PDF
The slide displays program report of non-profit organization for financial analysis. Various pie charts included are total revenue and program expense. Showcasing this set of slides titled Non-Profit Organization Agency Program Status Report Diagrams PDF. The topics addressed in these templates are Total Revenue, Program Expense, Report Indicates. All the content presented in this PPT design is completely editable. Download it and make adjustments in color, background, font etc. as per your unique business setting.

Bar Graph For Business Growth Powerpoint Templates
This PowerPoint slide contains graphics bar chart. This slide helps to exhibit business growth analysis. Sparkling thoughts are swirling around in your head. Filter them through with this diagram slide.

Gap Selling Methodology For Sales Department Guidelines PDF
Following slide shows sales gap analysis identification chart. Purpose of this slide is to discover new opportunities and identify current issues to increase company sales. It include elements such as objective, current state, future state, gap identification, factors etc. Showcasing this set of slides titled Gap Selling Methodology For Sales Department Guidelines PDF. The topics addressed in these templates are Objective, Profitability, High Sales Staff. All the content presented in this PPT design is completely editable. Download it and make adjustments in color, background, font etc. as per your unique business setting.
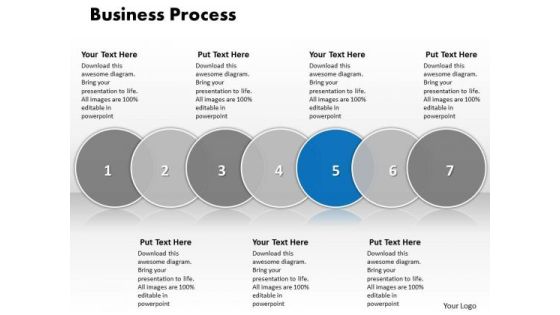
Ppt Free Business Sample Presentation PowerPoint Process Steps Templates
PPT free business sample presentation powerpoint process steps Templates-Use this circle chart to make your team understand complex processes. Constant monitoring of the processes provides you with opportunities to concentrate on the core competencies in your business and improve the standards for more effective results.-PPT free business sample presentation powerpoint process steps Templates-3, Advice, Analysis, Analyze, Answer, Area, Career, Chart, Choice, Circles, Concept, Determination, Diagram, Graph, Idea, Illustration, Intersect, Measurement, Opportunities, Options, Overlap, Overlapped, Overlapping, Passion, Passionate, Prioritize, Priority, Profession

Business Diagram 3d Lock With Pie Graph For Result Representation PowerPoint Slide
This Power Point diagram has been crafted with pie chart in shape of lock. It contains diagram of lock pie chart to compare and present data in an effective manner. Use this diagram to build professional presentations for your viewers.
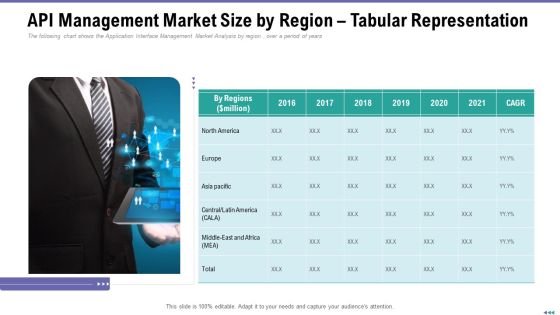
Market Viewpoint Application Programming Interface Governance API Management Market Size By Region Tabular Representation Diagrams PDF
The following chart shows the Application Interface Management Market Analysis by region , over a period of years. Presenting market viewpoint application programming interface governance api management market size by region tabular representation diagrams pdf to provide visual cues and insights. Share and navigate important information on one stages that need your due attention. This template can be used to pitch topics like api management market size by region tabular representation. In addtion, this PPT design contains high resolution images, graphics, etc, that are easily editable and available for immediate download.

API Management Market Size By Region World Map Representation Ppt Model Design Inspiration PDF
The following chart shows the Application Interface Management Market Analysis by region , over a period of years. This is a api management market size by region world map representation ppt model design inspiration pdf template with various stages. Focus and dispense information on one stage using this creative set, that comes with editable features. It contains large content boxes to add your information on topics like growth of market size, continuous development, market size. You can also showcase facts, figures, and other relevant content using this PPT layout. Grab it now.
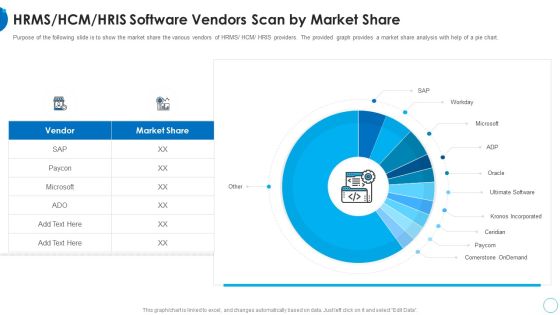
RMS HCM HRIS Software Vendors Scan By Market Share HR Change Management Tools Introduction PDF
Purpose of the following slide is to show the market share the various vendors of HRMS or HCM or HRIS providers. The provided graph provides a market share analysis with help of a pie chart. Deliver and pitch your topic in the best possible manner with this rms hcm hris software vendors scan by market share hr change management tools introduction pdf. Use them to share invaluable insights on hrms or hcm or hris software vendors scan by market share and impress your audience. This template can be altered and modified as per your expectations. So, grab it now.

Ppt Correlated Seven State Diagram Of World Concept Process PowerPoint Templates
PPT correlated seven state diagram of world concept process PowerPoint Templates-This diagram provides a graphical view of different aspects of a business plan and the relationships between them. The above template displays a layer diagram that shows an organized view of business services and processes.-PPT correlated seven state diagram of world concept process PowerPoint Templates-3, Advice, Analysis, Analyze, Answer, Area, Career, Chart, Choice, Circles, Concept, Determination, Diagram, Graph, Idea, Illustration, Intersect, Measurement, Opportunities, Options, Overlap, Overlapped, Overlapping, Passion, Passionate, Prioritize, Priority, Profession
Ppt Evaluation Of 4 Stages Involved Mechanism PowerPoint Templates
PPT evaluation of 4 stages involved mechanism PowerPoint Templates-Use this Circular diagram to show activities that are related to the business plan metrics and monitor the results to determine if the business plan is proceeding as planned. Deliver amazing presentations to mesmerize your audience using this Diagram.-PPT evaluation of 4 stages involved mechanism PowerPoint Templates-3, Advice, Analysis, Analyze, Answer, Area, Career, Chart, Choice, Circles, Concept, Determination, Diagram, Graph, Idea, Illustration, Intersect, Measurement, Opportunities, Options, Overlap, Overlapped, Overlapping, Passion, Passionate, Prioritize, Priority, Profession

Ppt Related Seven Steps Arranged In Row PowerPoint Templates
PPT related seven steps arranged in row PowerPoint Templates-This PowerPoint diagram slide shows seven circles in progressive manner. It can be used to show progressive steps. The ideas and plans are on your fingertips. Now imprint them on the minds of your audience via this slide.-PPT related seven steps arranged in row PowerPoint Templates-3, Advice, Analysis, Analyze, Answer, Area, Career, Chart, Choice, Circles, Concept, Determination, Diagram, Graph, Idea, Illustration, Intersect, Measurement, Opportunities, Options, Overlap, Overlapped, Overlapping, Passion, Passionate, Prioritize, Priority, Profession
Ppt Connected Seven Stages Of Business PowerPoint Presentation Process Templates
PPT connected seven stages of business powerpoint presentation process Templates-This diagram makes your audience understand, essential elements of your overall strategy. This image clearly defines the concept of interrelated concepts. Transmit your thoughts via this slide and prod your team to action.-PPT connected seven stages of business powerpoint presentation process Templates-3, Advice, Analysis, Analyze, Answer, Area, Career, Chart, Choice, Circles, Concept, Determination, Diagram, Graph, Idea, Illustration, Intersect, Measurement, Opportunities, Options, Overlap, Overlapped, Overlapping, Passion, Passionate, Prioritize, Priority, Profession

Ppt Correlative Seven PowerPoint Slide Numbers Of Business Process Templates
PPT correlative seven powerpoint slide numbers of business process Templates-This image has been professionally designed to emphasize distinct roles and functions you can link each layer to artifacts in your solution, such as projects, classes, and namespaces. Use this template to emphasize your views.-PPT correlative seven powerpoint slide numbers of business process Templates-3, Advice, Analysis, Analyze, Answer, Area, Career, Chart, Choice, Circles, Concept, Determination, Diagram, Graph, Idea, Illustration, Intersect, Measurement, Opportunities, Options, Overlap, Overlapped, Overlapping, Passion, Passionate, Prioritize, Priority, Profession

Ppt Correlative Seven Stages Of Business PowerPoint Presentation Process Templates
PPT correlative seven stages of business powerpoint presentation process Templates-Develop competitive advantage with our above template which identifies the major components or functional units of the design and their interdependencies. Create captivating presentations to deliver comparative and weighted arguments.-PPT correlative seven stages of business powerpoint presentation process Templates-3, Advice, Analysis, Analyze, Answer, Area, Career, Chart, Choice, Circles, Concept, Determination, Diagram, Graph, Idea, Illustration, Intersect, Measurement, Opportunities, Options, Overlap, Overlapped, Overlapping, Passion, Passionate, Prioritize, Priority, Profession
Ppt Circular Series Showing 5 Steps Involved Development 1 PowerPoint Templates
PPT circular series showing 5 steps involved development 1 PowerPoint Templates-Use this circular implementation PPT slide to represent a series of interconnected ideas. This compelling graphics can be used showing relations and interfaces among various marketing activities.-PPT circular series showing 5 steps involved development 1 PowerPoint Templates-3, Advice, Analysis, Analyze, Answer, Area, Career, Chart, Choice, Circles, Concept, Determination, Diagram, Graph, Idea, Illustration, Intersect, Measurement, Opportunities, Options, Overlap, Overlapped, Overlapping, Passion, Passionate, Prioritize, Priority, Profession

Addressing Various Food Quality Management Tools Assuring Food Quality And Hygiene Formats PDF
This slide provides information regarding various quality tools that can be used by firm in checking food and process quality such as scatter diagrams, histogram, process flow charts, pareto charts. Deliver an awe inspiring pitch with this creative addressing various food quality management tools assuring food quality and hygiene formats pdf bundle. Topics like scatter diagrams, histogram, process flow charts, pareto chart can be discussed with this completely editable template. It is available for immediate download depending on the needs and requirements of the user.

Addressing Various Food Quality Management Tools Uplift Food Production Company Quality Standards Microsoft PDF
This slide provides information regarding various quality tools that can be used by firm in checking food and process quality such as scatter diagrams, histogram, process flow charts, pareto charts. Deliver an awe inspiring pitch with this creative addressing various food quality management tools uplift food production company quality standards microsoft pdf bundle. Topics like scatter diagrams, histogram, process flow charts, pareto chart can be discussed with this completely editable template. It is available for immediate download depending on the needs and requirements of the user.
 Home
Home