Chart Analysis

Graph Charts Business PowerPoint Templates And PowerPoint Backgrounds 0711
Microsoft PowerPoint Template and Background with spreadsheet data and business charts

Business Charts Success PowerPoint Templates And PowerPoint Backgrounds 0711
Microsoft PowerPoint Template and Background with a spreadsheet data and business charts
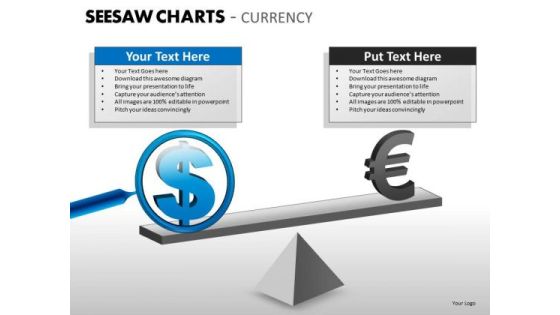
Business Framework Model Seesaw Charts Currency Business Diagram
Get The Doers Into Action. Activate Them With Our Business Framework Model Seesaw Charts Currency Business Diagram Powerpoint Templates.

Business Diagram Charts For Business Presentations Presentation Template
Emphatically define your message with our above diagram. Clarity of thought has been the key to your growth. Use this diagram to provide multiple options for taking in and making sense of information. Deliver amazing presentations to mesmerize your audience.
Business Charts PowerPoint Templates Singing Smiley Emoticon With Mike Sales
Business Charts PowerPoint templates singing smiley emoticon with mike Sales-BORED!!Want some Entertainment in Life? Here it is

Pointing Representation 3 Steps Sample Process Flow Charts PowerPoint Slides
We present our pointing representation 3 steps sample process flow charts PowerPoint Slides. Use our Symbol PowerPoint Templates because, and keep you group steady in the top bracket. Use our Business PowerPoint Templates because, Probe the minds of your colleagues, see their faces light up as they assimilate and understand the value of your suggestions. Use our Metaphor PowerPoint Templates because; Give them an overview of your capability and insight into the minute details of the overall picture highlighting the interdependence at every operational level. Use our Abstract PowerPoint Templates because, you have churned your mind and come up with effective ways and means to further refine it. Use our Process and Flows PowerPoint Templates because, Visual appeal is a priority for us. Use these PowerPoint slides for presentations relating to Collinear, Description using hands steps, Business, Collection, Connection, Cursor, Decoration, Design, Dimensional, Direction, Element, Icon, Illustration, Information, Modern, Motion, Paper, Perspective, Plastic, Pointer, Pointing, Process, Recycle, Recycling, Reflective, Set, Shape, Shiny, Sign, Symbol, Technology. The prominent colors used in the PowerPoint template are Blue, Purple, and Gray
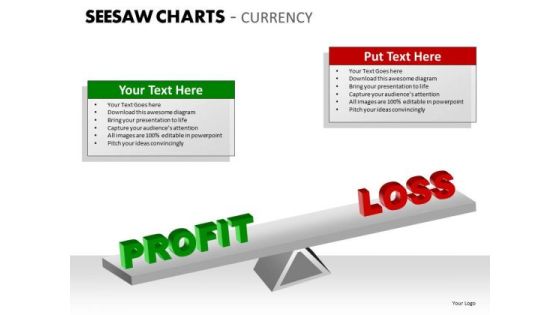
Business Framework Model Seesaw Charts Currency Strategy Diagram
Put In A Dollop Of Our Business Framework Model Seesaw Charts Currency Strategy Diagram Powerpoint Templates. Give Your Thoughts A Distinctive Flavor.
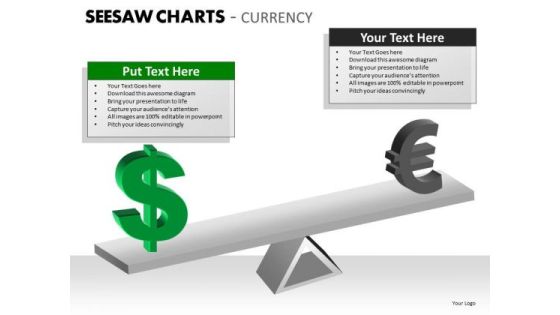
Mba Models And Frameworks Seesaw Charts Currency Business Diagram
Your Listeners Will Never Doodle. Our MBA Models And Frameworks Seesaw Charts Currency Business Diagram Powerpoint Templates Will Hold Their Concentration.
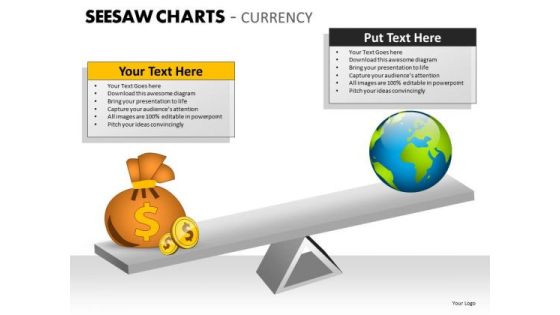
Mba Models And Frameworks Seesaw Charts Currency Marketing Diagram
Be A Donor Of Great Ideas. Display Your Charity On Our MBA Models And Frameworks Seesaw Charts Currency Marketing Diagram Powerpoint Templates.
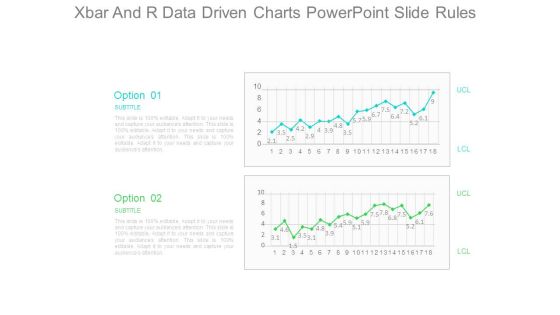
Xbar And R Data Driven Charts Powerpoint Slide Rules
This is a xbar and r data driven charts powerpoint slide rules. This is a two stage process. The stages in this process are option, subtitle, lcl, ucl.

Big Data Business Benefits Pie Charts Ppt PowerPoint Presentation Backgrounds
This is a big data business benefits pie charts ppt powerpoint presentation backgrounds. This is a four stage process. The stages in this process are business, marketing, icons, strategy, management.
Order Fulfilment And Replenishment Data Flow Charts Icon Background PDF
Showcasing this set of slides titled Order Fulfilment And Replenishment Data Flow Charts Icon Background PDF. The topics addressed in these templates are Order, Fulfilment And Replenishment, Data Flow Charts, Icon. All the content presented in this PPT design is completely editable. Download it and make adjustments in color, background, font etc. as per your unique business setting.
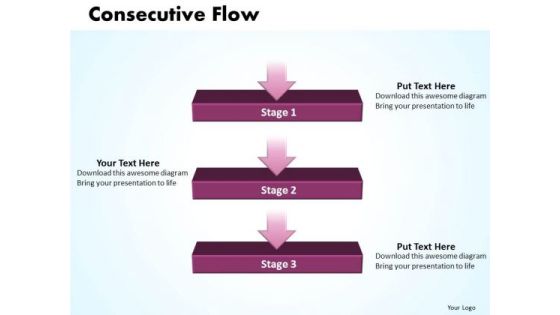
Ppt Consecutive Flow Process Charts Business PowerPoint Templates
PPT consecutive flow process charts business PowerPoint Templates-This Diagram makes information accessible throughout the organization with a collective, visible view of critical data from different perspectives and providing the tools to upcoming business scenarios and plan for change. -PPT consecutive flow process charts business PowerPoint Templates-3d, Arrow, Background, Banner, Business, Chart, Colorful, Diagram, Direction, Element, Financial, Flow, Gradient, Illustration, Isolated, Mirrored, Placeholder, Presentation, Process, Steps
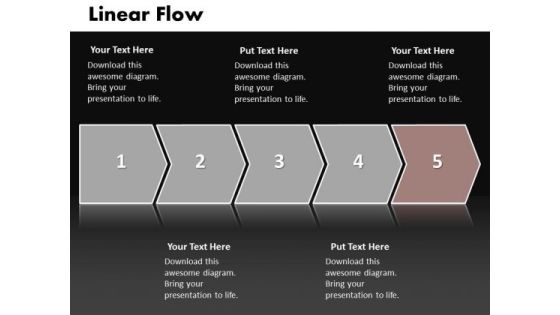
Ppt Linear Flow Process Charts 3 Stage PowerPoint Templates
PPT linear flow process charts 3 stage PowerPoint Templates-This PowerPoint diagram can be used in strategy, consulting and marketing presentations-PPT linear flow process charts 3 stage PowerPoint Templates-Advertise, Advertisement, Badge, Box, Business, Card, Collection, Column, Corporate, Costing, Counting, Design, Discount, Element, Featured, Finance, Grid, Hosting, Information, List, Message, Placard, Plan, Price, Pricing, Rectangle, Report, Round

Customizable Circle Charts Of Leading Companies Market Share Microsoft PDF
Presenting Customizable Circle Charts Of Leading Companies Market Share Microsoft PDF to dispense important information. This template comprises four stages. It also presents valuable insights into the topics including Customizable Circle, Charts Leading, Companies Market This is a completely customizable PowerPoint theme that can be put to use immediately. So, download it and address the topic impactfully.
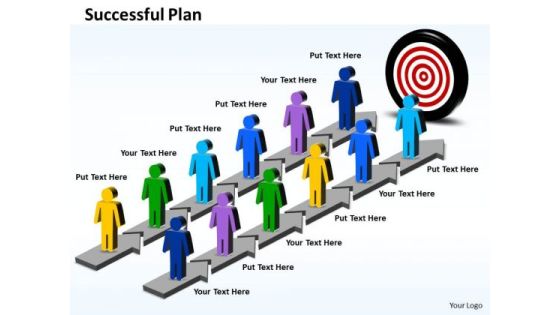
Business Charts PowerPoint Templates Parallel Steps For Successful Plan
Business Charts PowerPoint templates parallel steps for successful plan-This PowerPoint Diagram consists of the two parallel steps to reach the goal that is board. It portrays practice, procedure, proceeding, progress, progression, red tape, routine, rule, stage, step, suit, system, technique, transaction, trial, unfolding, way, wise, working.-Business Charts PowerPoint templates parallel steps for successful plan

Business Charts PowerPoint Templates Parallel Steps To Plan
Business Charts PowerPoint templates parallel steps to plan-This PowerPoint Diagram consists of the two parallel steps which further consist of five stages to reach the goal. It portrays practice, procedure, progression, routine, rule, stage, step, system, technique, way, working. This Graphical representation will help you to make your Presentation more interesting and easy to understand.-Business Charts PowerPoint templates parallel steps to plan

Business Charts PowerPoint Templates Colorful Textboxes With Alphabets Abcdefgh
Business Charts PowerPoint templates colorful textboxes with alphabets abcdefgh-This PowerPoint template shows eight stylish text boxes that are A, B, C, D, E, and F. It can be used to show grouped or related information. Use This PowerPoint diagram to represent stylish text boxes to list different approaches.-Business Charts PowerPoint templates colorful textboxes with alphabets abcdefgh

Improved Customer Service Experience Pie Charts Ppt PowerPoint Presentation Templates
This is a improved customer service experience pie charts ppt powerpoint presentation templates. This is a four stage process. The stages in this process are increased efficiency, better business decision making, improved customer experience and engagement, achieved financial savings.

Data Flow Charts For Social Media Application Icon Graphics PDF
Persuade your audience using this Data Flow Charts For Social Media Application Icon Graphics PDF. This PPT design covers three stages, thus making it a great tool to use. It also caters to a variety of topics including Data Flow Charts, Social Media Application, Icon. Download this PPT design now to present a convincing pitch that not only emphasizes the topic but also showcases your presentation skills.

Organizations Employee Creating Gantt Charts For Data Representation Download PDF
Persuade your audience using this organizations employee creating gantt charts for data representation download pdf. This PPT design covers two stages, thus making it a great tool to use. It also caters to a variety of topics including organizations employee creating gantt charts for data representation. Download this PPT design now to present a convincing pitch that not only emphasizes the topic but also showcases your presentation skills.

Charts For Portfolio Evaluation Techniques Example Ppt Presentation
This is a charts for portfolio evaluation techniques example ppt presentation. This is a five stage process. The stages in this process are peso govt debt securities, foreign govt debt securities, peso corporate debt securities, dollar corporate debt securities, equity.
Stock Photo Business Strategy Concepts Diagrams And Charts Icons Images
Acquire A Fine Balance With Our stock photo business strategy concepts diagrams and charts icons images. Your Audience Will Find You Sure Footed. Your Thoughts Will Acquire A Fine Balance. Our Holidays Will Put Them On A Good Footing.
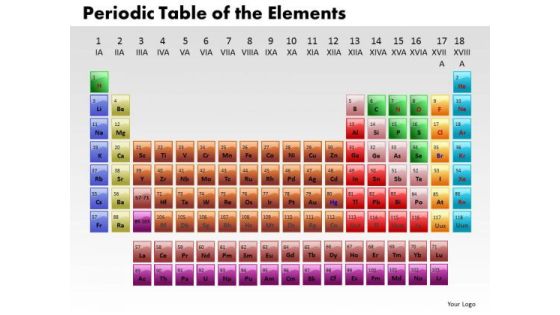
Business Circle Charts PowerPoint Templates Marketing Periodic Table Ppt Slides
Business Circle Charts PowerPoint Templates Marketing periodic table PPT Slides-Whether you manage people, projects or events this perodic table diagrams will meet your all needs. So bring the power of clear, visual communication to your everyday work.. -Business Circle Charts PowerPoint Templates Marketing periodic table PPT Slides-This template can be used for presentations relating to Actinoids, Atom, Atomic, Chemistry, Electrons, Element, Helium, Hydrogen, Lanthanoids, Liquid, Molecule, Noble, Periodic, Physics, Plutonium, Quantum, Radium, Science, Scientific, Solid, Symbol, Table
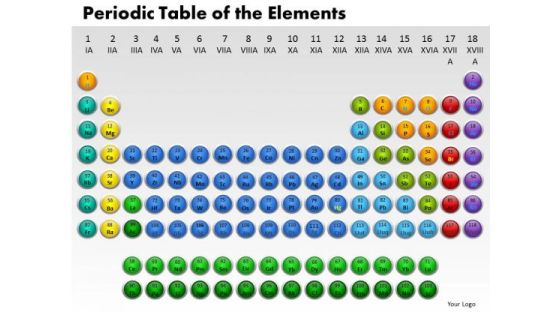
Business Circle Charts PowerPoint Templates Business Periodic Table Ppt Slides
Business Circle Charts PowerPoint Templates Business periodic table PPT Slides-Use this graphics to represent a continuing sequence of stages, tasks, or events in a circular flow and emphasize the connection between all components. -Business Circle Charts PowerPoint Templates Business periodic table PPT Slides-This template can be used for presentations relating to Actinoids, Atom, Atomic, Chemistry, Electrons, Element, Helium, Hydrogen, Lanthanoids, Liquid, Molecule, Noble, Periodic, Physics, Plutonium, Quantum, Radium, Science, Scientific, Solid, Symbol, Table

Agenda For Memcache Technology Ppt Diagram Graph Charts PDF
This is a agenda for memcache technology ppt diagram graph charts pdf template with various stages. Focus and dispense information on five stages using this creative set, that comes with editable features. It contains large content boxes to add your information on topics like benefits, implementation, business. You can also showcase facts, figures, and other relevant content using this PPT layout. Grab it now.

Google Charts Tool For Data Visualization Rules PDF
This slide depicts google charts as the tool for data visualization, which can extract data from various sources, including SQL, databases, google sheets. From laying roadmaps to briefing everything in detail, our templates are perfect for you. You can set the stage with your presentation slides. All you have to do is download these easy to edit and customizable templates. Google Charts Tool For Data Visualization Rules PDF will help you deliver an outstanding performance that everyone would remember and praise you for. Do download this presentation today.

5 Steps To Carry Out Task Flow Charting PowerPoint Templates
We present our 5 steps to carry out task flow charting PowerPoint templates.Download our Arrows PowerPoint Templates because your business and plans for its growth consist of processes that are highly co-related. Download and present our Symbol PowerPoint Templates because they are Gauranteed to focus the minds of your team. Present our Leadership PowerPoint Templates because this slide imprint them on the minds of your audience via our slides. Download and present our Process and Flows PowerPoint Templates because it demonstrates the seeds of many of our successes. Download and present our Business PowerPoint Templates because your fledgling career is in the chrysallis stage. Nurture it and watch it grow into a beautiful butterfly.Use these PowerPoint slides for presentations relating to Abstract, Arrow, Arrows, Business, Chart, Design, Development, Diagram, Direction, Element, Flow, Flowchart, Graph, Linear, Management, Model, Motion, Organization, Plan, Process, Program, Section, Segment, Set, Sign, Solution, Strategy, Symbol, Technology. The prominent colors used in the PowerPoint template are Red, Green, Yellow. Customers tell us our 5 steps to carry out task flow charting PowerPoint templates are Spiffy. The feedback we get is that our Business PowerPoint templates and PPT Slides will help them to explain complicated concepts. Professionals tell us our 5 steps to carry out task flow charting PowerPoint templates are Fabulous. People tell us our Design PowerPoint templates and PPT Slides are Luxurious. Customers tell us our 5 steps to carry out task flow charting PowerPoint templates are visually appealing. Professionals tell us our Development PowerPoint templates and PPT Slides are Stunning.
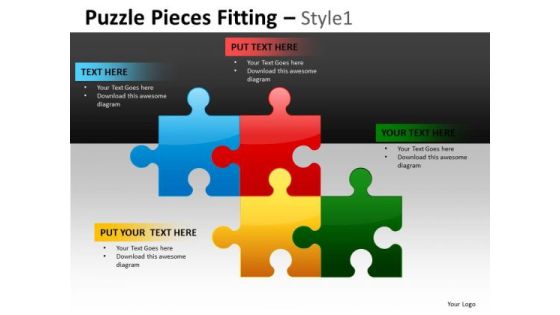
Dowload Puzzle Diagram Charts For PowerPoint Slides And Hr Ppt
Dowload Puzzle Diagram Charts for PowerPoint Slides and HR PPT-These high quality powerpoint pre-designed slides and powerpoint templates have been carefully created by our professional team to help you impress your audience. All slides have been created and are 100% editable in powerpoint. Each and every property of any graphic - color, size, orientation, shading, outline etc. can be modified to help you build an effective powerpoint presentation. Any text can be entered at any point in the powerpoint template or slide. Simply DOWNLOAD, TYPE and PRESENT!These PowerPoint designs and slide layouts can be used to in presentations relating to --Abstract, action, attach, box, business, center, chain, chart, color, communication, concept, connection, cube, cycle, data, diagram, flow, globe, horizontal, idea, illustration, individual, information, interaction, jigsaw, join, link, merge, missing, opportunity, part, piece, pieces, process, puzzle, relation, relationship, silhouette, search, shape, success, people-Dowload Puzzle Diagram Charts for PowerPoint Slides and HR PPT

Healthcare Images Ppt PowerPoint Presentation Diagram Graph Charts PDF
Persuade your audience using this Healthcare Images Ppt PowerPoint Presentation Diagram Graph Charts PDF. This PPT design covers Two stages, thus making it a great tool to use. It also caters to a variety of topics including Healthcare Images. Download this PPT design now to present a convincing pitch that not only emphasizes the topic but also showcases your presentation skills.

Business Diagram Charts On Smartphone Modern Info Graphic Presentation Template
This image slide displays charts on smartphone with modern info graphic. This image slide depicts info graphic. Use this PowerPoint template, in your presentations to express various business views on achievements and targets or population related presentations. This image slide will help you reach the target audience.

Business Charts PowerPoint Templates Four Interconnected Points Editable Sales
Business Charts PowerPoint templates four interconnected points editable Sales-This Powerpoint Diagram consists of four points connected to each other through a red Ring in the Middle. It can be used to symbolize four different Approaches which are inter-related to each other. This diagram will fit for Business Presentation

Project Context For Medical Consultancy Proposal Ppt Diagram Graph Charts PDF
Deliver and pitch your topic in the best possible manner with this project context for medical consultancy proposal ppt diagram graph charts pdf. Use them to share invaluable insights on project context for Medical Consultancy and impress your audience. This template can be altered and modified as per your expectations. So, grab it now.
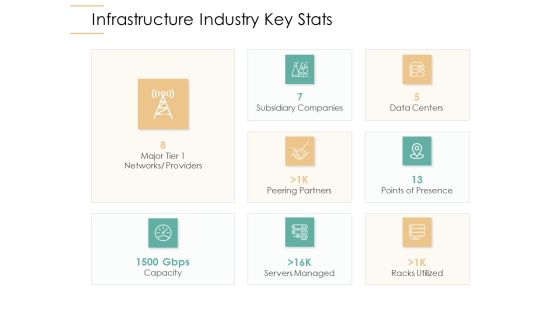
Infrastructure Strategies Infrastructure Industry Key Stats Ppt Diagram Graph Charts PDF
Deliver and pitch your topic in the best possible manner with this infrastructure strategies infrastructure industry key stats ppt diagram graph charts pdf. Use them to share invaluable insights on capacity, servers managed, racks utilized, peering partners, points of presence and impress your audience. This template can be altered and modified as per your expectations. So, grab it now.

Two Doctors Conducting Healthcare Surgery In Hospital Ppt PowerPoint Presentation Diagram Graph Charts PDF
Pitch your topic with ease and precision using this Two Doctors Conducting Healthcare Surgery In Hospital Ppt PowerPoint Presentation Diagram Graph Charts PDF. This layout presents information on Two Doctors, Conducting Healthcare, Surgery In Hospital. It is also available for immediate download and adjustment. So, changes can be made in the color, design, graphics or any other component to create a unique layout.
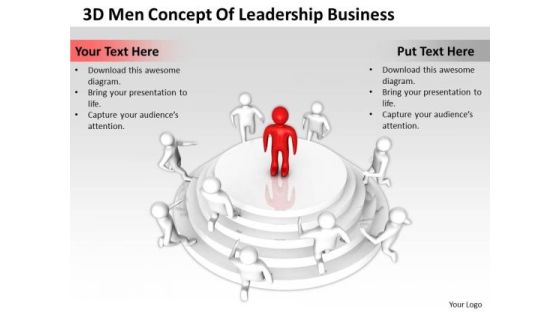
Business Charts Examples Of Leadership PowerPoint Presentations Templates
We present our business charts examples of leadership powerpoint presentations templates.Present our People PowerPoint Templates because Our PowerPoint Templates and Slides are conceived by a dedicated team. Use them and give form to your wondrous ideas. Use our Leadership PowerPoint Templates because Our PowerPoint Templates and Slides will let your team Walk through your plans. See their energy levels rise as you show them the way. Use our Business PowerPoint Templates because Our PowerPoint Templates and Slides will help you be quick off the draw. Just enter your specific text and see your points hit home. Use our Success PowerPoint Templates because Our PowerPoint Templates and Slides are effectively colour coded to prioritise your plans They automatically highlight the sequence of events you desire. Use our Marketing PowerPoint Templates because You are well armed with penetrative ideas. Our PowerPoint Templates and Slides will provide the gunpowder you need.Use these PowerPoint slides for presentations relating to 3d, business, businessman, chart, communication,concept, consultant,cooperation, dialogue, discussion, expert, expertise, figure, figurine,finance, financial, flipchart, graphic,group, growth, guy, human, icon, idea,leader, leadership, manager, meeting,men, paper, people, person, plan,pointing, present, profit, puppet, speaker,speech, team, teamwork. The prominent colors used in the PowerPoint template are Red, Gray, White. You can be sure our business charts examples of leadership powerpoint presentations templates provide great value for your money. Be assured of finding the best projection to highlight your words. Use our concept PowerPoint templates and PPT Slides are readymade to fit into any presentation structure. Professionals tell us our business charts examples of leadership powerpoint presentations templates are second to none. Customers tell us our communication PowerPoint templates and PPT Slides provide great value for your money. Be assured of finding the best projection to highlight your words. Customers tell us our business charts examples of leadership powerpoint presentations templates are the best it can get when it comes to presenting. Use our communication PowerPoint templates and PPT Slides are topically designed to provide an attractive backdrop to any subject.

Puzzle Linear Flow Process 8 Stages Charts Examples PowerPoint Templates
We present our puzzle linear flow process 8 stages charts examples PowerPoint templates.Use our Business PowerPoint Templates because, It illustrates the city with a lasting tryst with resilience. You epitomise the qualities that give your city its fame Use our Puzzles or Jigsaws PowerPoint Templates because,This shows plans to increase the strength of your business relationships. Use our Shapes PowerPoint Templates because, It unravels the process layer by layer and exposes their relevance to the core issue. Use our Boxes PowerPoint Templates because,This diagram helps you to show goal also clearly etched in your mind. Use our Success PowerPoint Templates because,IT outlines the entire thought process for the benefit of others. Tell it to the world with your characteristic aplombUse these PowerPoint slides for presentations relating to abstract, arrow, arrows, business, chart, design, development, diagram, direction, element, flow, flowchart, graph, linear, management, model, motion, organization, plan, process, program, section, segment, set, sign, solution, strategy, symbol, technology. The prominent colors used in the PowerPoint template are Purple, Pink, Red. People tell us our puzzle linear flow process 8 stages charts examples PowerPoint templates are Second to none. The feedback we get is that our design PowerPoint templates and PPT Slides are Cheerful. People tell us our puzzle linear flow process 8 stages charts examples PowerPoint templates will generate and maintain the level of interest you desire. They will create the impression you want to imprint on your audience. Presenters tell us our direction PowerPoint templates and PPT Slides are Luxuriant. The feedback we get is that our puzzle linear flow process 8 stages charts examples PowerPoint templates are Tasteful. Professionals tell us our development PowerPoint templates and PPT Slides are Magical.
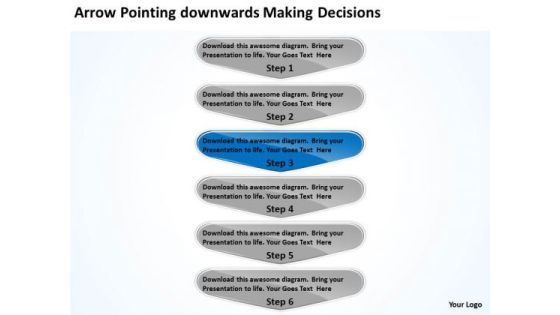
Arrow Pointing Downwards Making Decisions PowerPoint Flow Charts Slides
We present our arrow pointing downwards making decisions PowerPoint flow charts Slides.Present our Leadership PowerPoint Templates because with the help of our Slides you can Illustrate these thoughts with this slide. Download and present our Marketing PowerPoint Templates because The marketplace is the merger of your dreams and your ability. Present our Business PowerPoint Templates because profit levels have been steady over the recent past. Spread your heightened excitement to others in the room. Download our Shapes PowerPoint Templates because educate your staff on the means to provide the required support for speedy recovery. Download and present our Arrows PowerPoint Templates because this template will explain the value of its wellness to human life.Use these PowerPoint slides for presentations relating to Abstract, Arrow, Arrows, Business, Chart, Design, Development, Diagram, Direction, Element, Flow, Flowchart, Graph, Linear, Management, Model, Motion, Organization, Plan, Process, Program, Section, Segment, Set, Sign, Solution, Strategy, Symbol, Technology. The prominent colors used in the PowerPoint template are Blue, Gray, White. Customers tell us our arrow pointing downwards making decisions PowerPoint flow charts Slides are Fancy. You can be sure our Direction PowerPoint templates and PPT Slides will help you be quick off the draw. Just enter your specific text and see your points hit home. Presenters tell us our arrow pointing downwards making decisions PowerPoint flow charts Slides are Second to none. Professionals tell us our Design PowerPoint templates and PPT Slides are Ritzy. Presenters tell us our arrow pointing downwards making decisions PowerPoint flow charts Slides are Flirty. Professionals tell us our Development PowerPoint templates and PPT Slides are Delightful.

Business Charts 3d Men With Classroom Education PowerPoint Templates
We present our business charts 3d men with classroom education PowerPoint templates.Use our Education PowerPoint Templates because It can Leverage your style with our PowerPoint Templates and Slides. Charm your audience with your ability. Download and present our People PowerPoint Templates because They will bring a lot to the table. Their alluring flavours will make your audience salivate. Use our Computer PowerPoint Templates because Our PowerPoint Templates and Slides will provide weight to your words. They will bring out the depth of your thought process. Present our Communication PowerPoint Templates because You are well armed with penetrative ideas. Our PowerPoint Templates and Slides will provide the gunpowder you need. Download our Business PowerPoint Templates because It will Give impetus to the hopes of your colleagues. Our PowerPoint Templates and Slides will aid you in winning their trust.Use these PowerPoint slides for presentations relating to 3d, 3d man, audience, awards ceremony, business, business meeting, business person, business relationship, businessman, candid, chalk board, classroom, classroom environment, clock, coach, conference, congress, desk, education, event, global communications, group of people, image, instructor, learning, lecture hall, logistics, management, manager, marker board, meeting, multimedia, new, people, presentation, presenter, professor, seminar, student, synergy, teacher, teaching, team, teamwork, training, university. The prominent colors used in the PowerPoint template are Blue, Black, Gray. Professionals tell us our business charts 3d men with classroom education PowerPoint templates will make you look like a winner. The feedback we get is that our meeting PowerPoint templates and PPT Slides provide great value for your money. Be assured of finding the best projection to highlight your words. PowerPoint presentation experts tell us our business charts 3d men with classroom education PowerPoint templates are visually appealing. You can be sure our ceremony PowerPoint templates and PPT Slides will get their audience's attention. People tell us our business charts 3d men with classroom education PowerPoint templates are visually appealing. You can be sure our ceremony PowerPoint templates and PPT Slides will help them to explain complicated concepts.
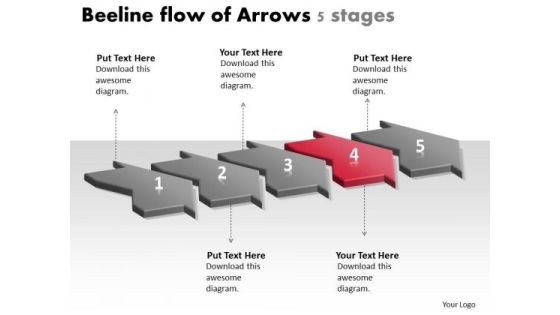
Beeline Flow Of Arrows 5 Stages Process Charts PowerPoint Slides
We present our beeline flow of arrows 5 stages process charts PowerPoint Slides.Use our Finance PowerPoint Templates because,You can Help your viewers automatically emphathise with your thoughts. Use our Process and Flows PowerPoint Templates because,We all know that alphabetical order is a time honoured concept. Use our Arrows PowerPoint Templates because,You can Focus on each one and investigate which one would be the best fit for your needs. Use our Shapes PowerPoint Templates because,You should Lay down the fundamentals to build upon. Use our Business PowerPoint Templates because, Spell out your advertising plans to increase market share. The feedback has been positive and productiveUse these PowerPoint slides for presentations relating to 3d, arrow, background, banner, business, chart, diagram, direction, element, financial, flow, gradient, illustration, isolated, marketing, mirrored, placeholder, presentation, process, steps, success, teamwork, vector. The prominent colors used in the PowerPoint template are Red, Gray, Black

Customizable Circle Charts Of Subscription Revenue Split Clipart PDF
Persuade your audience using this Customizable Circle Charts Of Subscription Revenue Split Clipart PDF This PPT design covers four stages, thus making it a great tool to use. It also caters to a variety of topics including Complete Plan, Premium Plan, Standard Plan Download this PPT design now to present a convincing pitch that not only emphasizes the topic but also showcases your presentation skills.

Customizable Circle Charts Of Marketing Expenses Split Information PDF
Persuade your audience using this Customizable Circle Charts Of Marketing Expenses Split Information PDF This PPT design covers three stages, thus making it a great tool to use. It also caters to a variety of topics including Marketing Events, Digital Marketing, Marketing Expenses Download this PPT design now to present a convincing pitch that not only emphasizes the topic but also showcases your presentation skills.
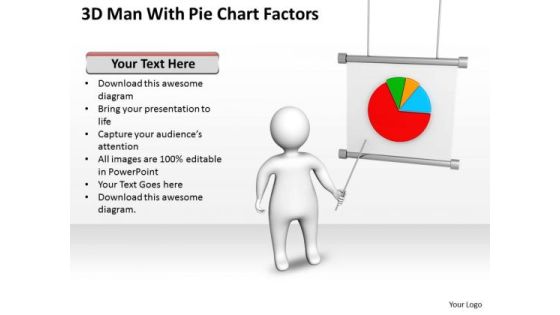
Business Charts Examples 3d Man With Pie Factors PowerPoint Slides
We present our business charts examples 3d man with pie factors PowerPoint Slides.Download and present our Finance PowerPoint Templates because Our PowerPoint Templates and Slides will definately Enhance the stature of your presentation. Adorn the beauty of your thoughts with their colourful backgrounds. Use our Arrows PowerPoint Templates because Our PowerPoint Templates and Slides are specially created by a professional team with vast experience. They diligently strive to come up with the right vehicle for your brilliant Ideas. Use our Business PowerPoint Templates because It can be used to Set your controls for the heart of the sun. Our PowerPoint Templates and Slides will be the propellant to get you there. Download our Marketing PowerPoint Templates because our PowerPoint Templates and Slides will give your ideas the shape. Download our Success PowerPoint Templates because Our PowerPoint Templates and Slides are created by a hardworking bunch of busybees. Always flitting around with solutions gauranteed to please.Use these PowerPoint slides for presentations relating to 3d, Arrow, Business, Businessman, Character, Chart, Concept, Corporate, Data, Development, Diagram, Display, Figure, Finance, Financial, Flip-Chart, Flipchart, Graph, Graphic, Green, Growth, Guy, Human, Icon, Idea, Illustration, Information, Investment, Market, Marketing, Men, Office, Part, People, Person, Pie, Presentation, Professional, Progress, Red, Reflection, Report, Shape, Shiny, Sign, Slice, Statistic, Success. The prominent colors used in the PowerPoint template are Red, Blue, Green. The feedback we get is that our business charts examples 3d man with pie factors PowerPoint Slides are designed by a team of presentation professionals. Customers tell us our Business PowerPoint templates and PPT Slides will make the presenter look like a pro even if they are not computer savvy. The feedback we get is that our business charts examples 3d man with pie factors PowerPoint Slides are topically designed to provide an attractive backdrop to any subject. Professionals tell us our Businessman PowerPoint templates and PPT Slides are aesthetically designed to attract attention. We guarantee that they will grab all the eyeballs you need. Presenters tell us our business charts examples 3d man with pie factors PowerPoint Slides will help you be quick off the draw. Just enter your specific text and see your points hit home. You can be sure our Character PowerPoint templates and PPT Slides have awesome images to get your point across.

Process Flow Of Service Desk Management Ppt PowerPoint Presentation Diagram Graph Charts PDF
The following slide illustrates process flow of service desk management. It provides information about resolution time, in-call waiting time, agent call connection, issue escalation, client notification, operations management, etc. Explore a selection of the finest Process Flow Of Service Desk Management Ppt PowerPoint Presentation Diagram Graph Charts PDF here. With a plethora of professionally designed and pre made slide templates, you can quickly and easily find the right one for your upcoming presentation. You can use our Process Flow Of Service Desk Management Ppt PowerPoint Presentation Diagram Graph Charts PDF to effectively convey your message to a wider audience. Slidegeeks has done a lot of research before preparing these presentation templates. The content can be personalized and the slides are highly editable. Grab templates today from Slidegeeks.

Deployment Of Digital Twin In Healthcare Organizations Ppt PowerPoint Presentation Diagram Graph Charts PDF
This slide represents the application of digital twin technology in healthcare institutions to improve healthcare operational efficiency and improved personalized care. Here you can discover an assortment of the finest PowerPoint and Google Slides templates. With these templates, you can create presentations for a variety of purposes while simultaneously providing your audience with an eye catching visual experience. Download Deployment Of Digital Twin In Healthcare Organizations Ppt PowerPoint Presentation Diagram Graph Charts PDF to deliver an impeccable presentation. These templates will make your job of preparing presentations much quicker, yet still, maintain a high level of quality. Slidegeeks has experienced researchers who prepare these templates and write high quality content for you. Later on, you can personalize the content by editing the Deployment Of Digital Twin In Healthcare Organizations Ppt PowerPoint Presentation Diagram Graph Charts PDF.

FDDI Architecture And Its Working Ppt PowerPoint Presentation Diagram Graph Charts PDF
This slide demonstrates the architecture and the working of FDDI, which is often implemented as a double token-passing ring inside a ring topology primary and secondary rings make up the dual ring, and the main ring carries data. Here you can discover an assortment of the finest PowerPoint and Google Slides templates. With these templates, you can create presentations for a variety of purposes while simultaneously providing your audience with an eye catching visual experience. Download FDDI Architecture And Its Working Ppt PowerPoint Presentation Diagram Graph Charts PDF to deliver an impeccable presentation. These templates will make your job of preparing presentations much quicker, yet still, maintain a high level of quality. Slidegeeks has experienced researchers who prepare these templates and write high quality content for you. Later on, you can personalize the content by editing the FDDI Architecture And Its Working Ppt PowerPoint Presentation Diagram Graph Charts PDF.

Steps To Implement Business And IT Alignment Ppt PowerPoint Presentation Diagram Graph Charts PDF
This slide represents business and information technology alignment steps. It includes identifying business drivers, creating IT vision, assessing current alignment, identifying alignment gaps, prioritizing IT initiatives, evaluating implementation options, creating implementation options, and adjusting IT strategy. Crafting an eye catching presentation has never been more straightforward. Let your presentation shine with this tasteful yet straightforward Steps To Implement Business And IT Alignment Ppt PowerPoint Presentation Diagram Graph Charts PDF template. It offers a minimalistic and classy look that is great for making a statement. The colors have been employed intelligently to add a bit of playfulness while still remaining professional. Construct the ideal Steps To Implement Business And IT Alignment Ppt PowerPoint Presentation Diagram Graph Charts PDF that effortlessly grabs the attention of your audience Begin now and be certain to wow your customers.
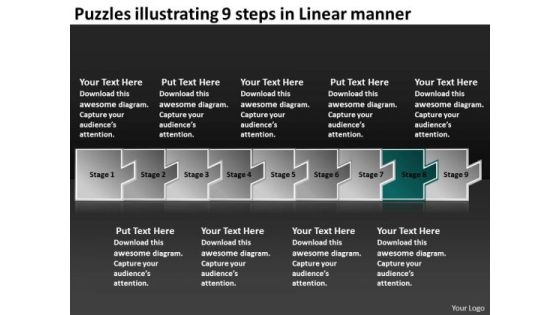
Puzzles Illustrating 9 Steps Linear Manner Flow Charting PowerPoint Templates
We present our puzzles illustrating 9 steps linear manner flow charting PowerPoint templates.Use our Business PowerPoint Templates because,Project your ideas to you colleagues and complete the full picture Use our Design PowerPoint Templates because, This is Aesthetically designed to make a great first impression this template highlights . Use our Marketing PowerPoint Templates because,It demonstrates the seeds of many of our successes. Use our Shapes PowerPoint Templates because, You are going along well but your foresight shows that it may need a slight change in plans or direction. Use our Metaphor PowerPoint Templates because,Readymade PowerPoint templates can prove best of your knowledge for your slides to show.Use these PowerPoint slides for presentations relating to abstract, arrow, arrows, business, chart, design, development, diagram, direction, element, flow, flowchart, graph, linear, management, model, motion, organization, plan, process, program, section, segment, set, sign, solution, strategy, symbol, technology. The prominent colors used in the PowerPoint template are Blue, White, Gray
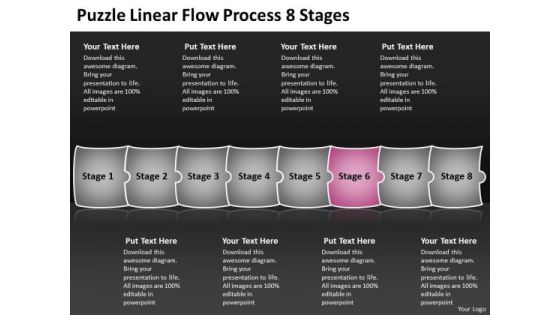
Puzzle Linear Flow Process 8 Stages Charts Office PowerPoint Templates
We present our puzzle linear flow process 8 stages charts office PowerPoint templates.Use our Business PowerPoint Templates because, A brainwave has occurred to you after review. You know just how to push the graph skyward Use our Puzzles or Jigsaws PowerPoint Templates because,If making a mark is your obsession, then let others get Obsessed with you. Use our Communication PowerPoint Templates because,They have fired the dreams of many fertile minds. Use our Shapes PowerPoint Templates because,You are the Champion of your team shall anoint. Use our Success PowerPoint Templates because,The choices you make today will determine the future growth of your enterprise. Use these PowerPoint slides for presentations relating to abstract, action, attach, box, business, center, chain, chart, communication, concept, connection, cube, cycle, data, diagram, flow, horizontal, illustration, individual, interaction, jigsaw, join, link, merge, puzzle, relation, relationship, search, shape, silhouette, success. The prominent colors used in the PowerPoint template are Pink, White, Gray
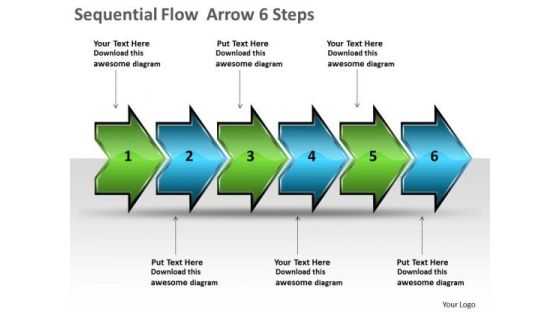
Sequential Flow Arrow 6 Steps Production Charts PowerPoint Templates
We present our sequential flow arrow 6 steps production charts PowerPoint templates. Use our Arrows PowerPoint Templates because; Use your findings to help arrive at an accurate diagnosis. Use our Business PowerPoint Templates because, Marketing Strategy Business Template: - maximizing sales of your product is the intended destination. Use our Symbol PowerPoint Templates because, explore the minutest detail of each concept and follow the trail to its conclusion. Use our Success PowerPoint Templates because, you have made significant headway in this field. Use our Shapes PowerPoint Templates because; Use our templates to emphasize your views. Use these PowerPoint slides for presentations relating to Abstract, Arrows, Blank, Business, Chart, Circle, Circular, Circulation, Concept, Conceptual, Converging, Design, Diagram, Empty, Executive, Idea, Illustration, Management, Model, Numbers, Organization, Outwards, Pointing, Procedure, Process, Relationship, Resource, Sequence, Sequential, Strata. The prominent colors used in the PowerPoint template are Green, Blue, and Black

It Devops Organization Structure Ppt PowerPoint Presentation Diagram Graph Charts PDF
This slide provides the glimpse about the 4 tier of IT organization structure which focuses on base infrastructure, higher order infrastructure, business aligned capabilities, and market facing system. Do you have an important presentation coming up Are you looking for something that will make your presentation stand out from the rest Look no further than It Devops Organization Structure Ppt PowerPoint Presentation Diagram Graph Charts PDF. With our professional designs, you can trust that your presentation will pop and make delivering it a smooth process. And with Slidegeeks, you can trust that your presentation will be unique and memorable. So why wait Grab It Devops Organization Structure Ppt PowerPoint Presentation Diagram Graph Charts PDF today and make your presentation stand out from the rest.
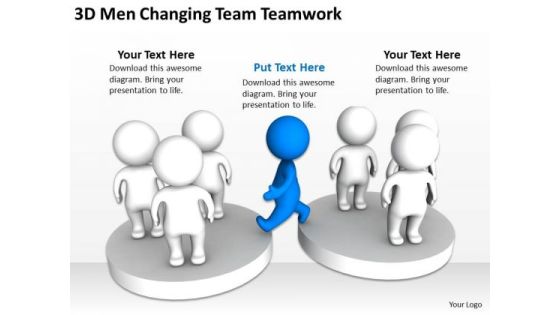
Business Charts Examples 3d Men Changing Team Teamwork PowerPoint Templates
We present our business charts examples 3d men changing team teamwork PowerPoint templates.Download and present our People PowerPoint Templates because Our PowerPoint Templates and Slides will steer your racing mind. Hit the right buttons and spur on your audience. Present our Business PowerPoint Templates because They will bring a lot to the table. Their alluring flavours will make your audience salivate. Use our Metaphors-Visual Concepts PowerPoint Templates because you should Experience excellence with our PowerPoint Templates and Slides. They will take your breath away. Present our Leadership PowerPoint Templates because Our PowerPoint Templates and Slides will let your ideas bloom. Create a bed of roses for your audience. Use our Shapes PowerPoint Templates because Our PowerPoint Templates and Slides will let you Hit the target. Go the full distance with ease and elan.Use these PowerPoint slides for presentations relating to 3d, abandon, achievement, away, betray, business, career, change, company,corporation, different, diversity, exchange, figure, graphic, group, guy, human,illustration, image, important, individuality, job, jumping, leave, male, man,organization, people, person, promotion, quit, render, rendered, side, strategy,success, successful, switch, team, teamwork, three-dimensional, white. The prominent colors used in the PowerPoint template are Blue , White, Gray. Customers tell us our business charts examples 3d men changing team teamwork PowerPoint templates look good visually. We assure you our career PowerPoint templates and PPT Slides effectively help you save your valuable time. Customers tell us our business charts examples 3d men changing team teamwork PowerPoint templates are effectively colour coded to prioritise your plans They automatically highlight the sequence of events you desire. Use our away PowerPoint templates and PPT Slides will make the presenter successul in his career/life. PowerPoint presentation experts tell us our business charts examples 3d men changing team teamwork PowerPoint templates are second to none. You can be sure our achievement PowerPoint templates and PPT Slides provide great value for your money. Be assured of finding the best projection to highlight your words.

Business Charts Marketing Sales PowerPoint Templates Ppt Backgrounds For Slides
We present our business charts marketing sales PowerPoint templates PPT backgrounds for slides.Download our Communication PowerPoint Templates because Our PowerPoint Templates and Slides will weave a web of your great ideas. They are gauranteed to attract even the most critical of your colleagues. Download our Business PowerPoint Templates because Our PowerPoint Templates and Slides will effectively help you save your valuable time. They are readymade to fit into any presentation structure. Download our Success PowerPoint Templates because You are an avid believer in ethical practices. Highlight the benefits that accrue with our PowerPoint Templates and Slides. Download and present our People PowerPoint Templates because Our PowerPoint Templates and Slides are aesthetically designed to attract attention. We gaurantee that they will grab all the eyeballs you need. Present our Shapes PowerPoint Templates because It will Raise the bar of your Thoughts. They are programmed to take you to the next level.Use these PowerPoint slides for presentations relating to 3d, Arrow, Business, Businessman, Cartoon, Character, Chart, Concept, Corporate, Data, Development, Diagram, Display, Figure, Finance, Financial, Graph, Graphic, Green, Growth, Guy, Human, Icon, Idea, Illustration, Information, Investment, Isolated, Market, Marketing, Men, Office, Part, People, Person, Pie, Presentation, Professional, Progress, Red, Reflection, Report, Shape, Shiny, Sign, Success. The prominent colors used in the PowerPoint template are Blue, Gray, White. Presenters tell us our business charts marketing sales PowerPoint templates PPT backgrounds for slides are aesthetically designed to attract attention. We guarantee that they will grab all the eyeballs you need. PowerPoint presentation experts tell us our Concept PowerPoint templates and PPT Slides will help them to explain complicated concepts. Professionals tell us our business charts marketing sales PowerPoint templates PPT backgrounds for slides are specially created by a professional team with vast experience. They diligently strive to come up with the right vehicle for your brilliant Ideas. People tell us our Cartoon PowerPoint templates and PPT Slides will make the presenter successul in his career/life. The feedback we get is that our business charts marketing sales PowerPoint templates PPT backgrounds for slides provide great value for your money. Be assured of finding the best projection to highlight your words. Customers tell us our Business PowerPoint templates and PPT Slides provide great value for your money. Be assured of finding the best projection to highlight your words.

Business Charts Examples 3d Men Connected With Arrows PowerPoint Templates
We present our business charts examples 3d men connected with arrows PowerPoint templates.Download our People PowerPoint Templates because You have gained great respect for your brilliant ideas. Use our PowerPoint Templates and Slides to strengthen and enhance your reputation. Download our Arrows PowerPoint Templates because You aspire to touch the sky with glory. Let our PowerPoint Templates and Slides provide the fuel for your ascent. Present our Leadership PowerPoint Templates because You will get more than you ever bargained for. Present our Shapes PowerPoint Templates because you can Add colour to your speech with our PowerPoint Templates and Slides. Your presentation will leave your audience speechless. Download and present our Business PowerPoint Templates because Our PowerPoint Templates and Slides will let you Leave a lasting impression to your audiences. They possess an inherent longstanding recall factor.Use these PowerPoint slides for presentations relating to 3d, arrow, background, business, circle,circular, colleagues, colors,communicate, communication,community, concept, connect,connection, connectivity, data,discussion, flow, forum, friends, gossip,gossiping, hierarchy, inform, information,internet, lead, leader, leadership, link,linked, linking, men, mouth, network,networking, people, person. The prominent colors used in the PowerPoint template are Red, White, Black. You can be sure our business charts examples 3d men connected with arrows PowerPoint templates look good visually. Use our circular PowerPoint templates and PPT Slides will help them to explain complicated concepts. Professionals tell us our business charts examples 3d men connected with arrows PowerPoint templates help you meet deadlines which are an element of today's workplace. Just browse and pick the slides that appeal to your intuitive senses. Customers tell us our circle PowerPoint templates and PPT Slides are second to none. Customers tell us our business charts examples 3d men connected with arrows PowerPoint templates will help them to explain complicated concepts. Use our communicate PowerPoint templates and PPT Slides are effectively colour coded to prioritise your plans They automatically highlight the sequence of events you desire.

Project Backlog Management Through Kanban Board Ppt PowerPoint Presentation Diagram Graph Charts PDF
This slide showcases managing project backlogs through Kanban board. It provides information about software features, project requirements, project analysis, proposal, scope, approval, timeline, resources, etc. Slidegeeks is here to make your presentations a breeze with Project Backlog Management Through Kanban Board Ppt PowerPoint Presentation Diagram Graph Charts PDF With our easy to use and customizable templates, you can focus on delivering your ideas rather than worrying about formatting. With a variety of designs to choose from, you are sure to find one that suits your needs. And with animations and unique photos, illustrations, and fonts, you can make your presentation pop. So whether you are giving a sales pitch or presenting to the board, make sure to check out Slidegeeks first.
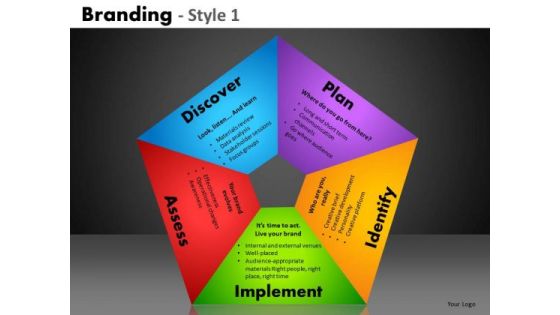
Pentagon Charts Process Diagrams PowerPoint Templates Ppt Slides
Pentagon Charts Process Diagrams PowerPoint templates PPT Slides-These high quality powerpoint pre-designed slides and powerpoint templates have been carefully created by our professional team to help you impress your audience. All slides have been created and are 100% editable in powerpoint. Each and every property of any graphic - color, size, orientation, shading, outline etc. can be modified to help you build an effective powerpoint presentation. Any text can be entered at any point in the powerpoint template or slide. Simply DOWNLOAD, TYPE and PRESENT! These PowerPoint presentation slides can be used to represent themes relating to -
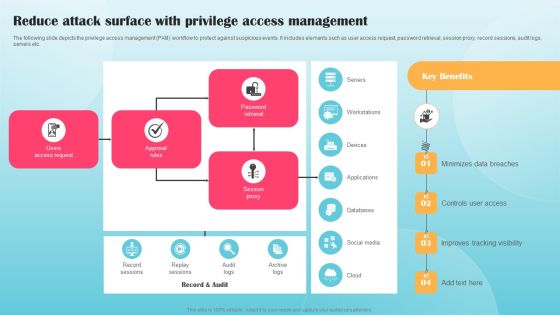
Reduce Attack Surface With Privilege Access Management Ppt PowerPoint Presentation Diagram Graph Charts PDF
The following slide depicts the privilege access management PAM workflow to protect against suspicious events. It includes elements such as user access request, password retrieval, session proxy, record sessions, audit logs, servers etc. Want to ace your presentation in front of a live audience Our Reduce Attack Surface With Privilege Access Management Ppt PowerPoint Presentation Diagram Graph Charts PDF can help you do that by engaging all the users towards you. Slidegeeks experts have put their efforts and expertise into creating these impeccable powerpoint presentations so that you can communicate your ideas clearly. Moreover, all the templates are customizable, and easy to edit and downloadable. Use these for both personal and commercial use.

Continuous Supply Planning For Smooth Functioning Ppt PowerPoint Presentation Diagram Graph Charts PDF
This slide highlights the key approaches for continuous planning for smooth business functioning which includes planning events, one integrated plan, response to opportunities and planning for quality. From laying roadmaps to briefing everything in detail, our templates are perfect for you. You can set the stage with your presentation slides. All you have to do is download these easy to edit and customizable templates. Continuous Supply Planning For Smooth Functioning Ppt PowerPoint Presentation Diagram Graph Charts PDF will help you deliver an outstanding performance that everyone would remember and praise you for. Do download this presentation today.
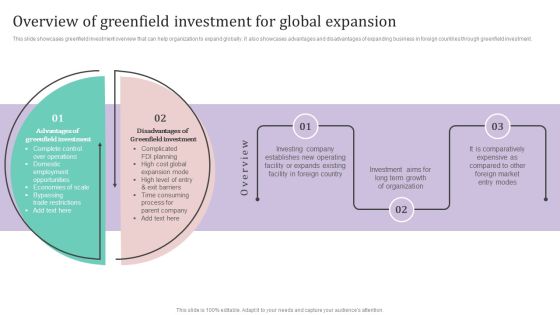
Overview Of Greenfield Investment For Global Expansion Ppt PowerPoint Presentation Diagram Graph Charts PDF
This slide showcases greenfield investment overview that can help organization to expand globally. It also showcases advantages and disadvantages of expanding business in foreign countries through greenfield investment.The best PPT templates are a great way to save time, energy, and resources. Slidegeeks have 100precent editable powerpoint slides making them incredibly versatile. With these quality presentation templates, you can create a captivating and memorable presentation by combining visually appealing slides and effectively communicating your message. Download Overview Of Greenfield Investment For Global Expansion Ppt PowerPoint Presentation Diagram Graph Charts PDF from Slidegeeks and deliver a wonderful presentation.

SCR For Market Ways To Improve Brand Ranking Ppt Diagram Graph Charts PDF
The purpose of this slide is to provide several ways in which brand ranking can be improved. Deliver and pitch your topic in the best possible manner with this SCR for market ways to improve brand ranking ppt diagram graph charts pdf. Use them to share invaluable insights on quality yet reasonably priced products, improve interaction and communication with customers, focus on online marketing and physical marketing, potential accounts and impress your audience. This template can be altered and modified as per your expectations. So, grab it now.

Business Charts Examples 3d Men Pointing Arrows Teamwork PowerPoint Templates
We present our business charts examples 3d men pointing arrows teamwork PowerPoint templates.Present our Communication PowerPoint Templates because It can be used to Set your controls for the heart of the sun. Our PowerPoint Templates and Slides will be the propellant to get you there. Download and present our Business PowerPoint Templates because you should once Tap the ingenuity of our PowerPoint Templates and Slides. They are programmed to succeed. Use our Arrows PowerPoint Templates because It can be used to Set your controls for the heart of the sun. Our PowerPoint Templates and Slides will be the propellant to get you there. Download our Symbol PowerPoint Templates because Your success is our commitment. Our PowerPoint Templates and Slides will ensure you reach your goal. Use our Shapes PowerPoint Templates because You will get more than you ever bargained for. Use these PowerPoint slides for presentations relating to 3d, Arrow, Background, Business, Circle, Circular, Colleagues, Colors, Communicate, Communication, Community, Concept, Connect, Connection, Connectivity, Data, Discussion, Flow, Forum, Friends, Gossip, Gossiping, Hierarchy, Inform, Information, Internet, Lead, Leader, Leadership, Link, Linked, Linking, Men, Mouth, Network, Networking, People, Person, Point, Render, Share, Social, Symbol, Team, Word, Workflow. The prominent colors used in the PowerPoint template are Blue, Gray, Black. The feedback we get is that our business charts examples 3d men pointing arrows teamwork PowerPoint templates are specially created by a professional team with vast experience. They diligently strive to come up with the right vehicle for your brilliant Ideas. Customers tell us our Colors PowerPoint templates and PPT Slides will make the presenter look like a pro even if they are not computer savvy. The feedback we get is that our business charts examples 3d men pointing arrows teamwork PowerPoint templates will save the presenter time. Professionals tell us our Colors PowerPoint templates and PPT Slides provide great value for your money. Be assured of finding the best projection to highlight your words. Presenters tell us our business charts examples 3d men pointing arrows teamwork PowerPoint templates will make the presenter successul in his career/life. You can be sure our Circular PowerPoint templates and PPT Slides will impress their bosses and teams.

3d Uniform Flow Arrows 8 Steps Process Charts PowerPoint Slides
We present our 3d uniform flow arrows 8 steps process charts PowerPoint Slides. Use our Business PowerPoint Templates because, Spread the light of knowledge around you, clear the doubts and enlighten the questioning minds with your brilliance and ability. Use our Arrows PowerPoint Templates because, you have the moves to sway the market. Use our Success PowerPoint Templates because, the basic stages are in place, you need to build upon them with our PowerPoint templates. Use our Signs PowerPoint Templates because, the pyramid is a symbol of the desire to reach the top in a steady manner. Use our Process and Flows PowerPoint Templates because, However there is a key aspect to be emphasized. Use these PowerPoint slides for presentations relating to abstract, arrow, arrows, business, chart, design, development, diagram, direction, element, flow, flowchart, graph, linear, management, model, motion, organization, plan, process, program, section, segment, set, sign, solution, strategy, symbol, technology. The prominent colors used in the PowerPoint template are Brown, Gray, and Black
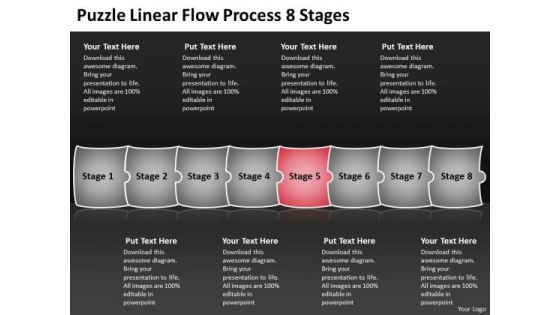
Puzzle Linear Flow Process 8 Stages Charts Samples PowerPoint Templates
We present our puzzle linear flow process 8 stages charts samples PowerPoint templates.Use our Business PowerPoint Templates because,It helps you to explain your plans in all earnest to your colleagues and raise the bar for all. Use our Puzzles or Jigsaws PowerPoint Templates because, It helps you to get your team in the desired sequence into the bracket. Use our Communication PowerPoint Templates because,You are aware of some pitfalls ahead where you need to be cautious not to overrun and avoid a stall. Use our Shapes PowerPoint Templates because,Chain reactions are the element of teamwork which add value to your efforts. Use our Success PowerPoint Templates because,IT outlines the entire thought process for the benefit of others. Tell it to the world with your characteristic aplombUse these PowerPoint slides for presentations relating to abstract, action, attach, box, business, center, chain, chart, communication, concept, connection, cube, cycle, data, diagram, flow, horizontal, illustration, individual, interaction, jigsaw, join, link, merge, puzzle, relation, relationship, search, shape, silhouette, success. The prominent colors used in the PowerPoint template are Red, White, Gray

3d Homogeneous Puzzle Flow 6 Issue System Charts PowerPoint Templates
We present our 3d homogeneous puzzle flow 6 issue system charts PowerPoint templates. Use our Business PowerPoint Templates because; illustrate your thoughts and experiences to your staff. Use our Puzzles or Jigsaws PowerPoint Templates because, which of late have been proving to be a hassle. Use our Shapes PowerPoint Templates because; Use them to help you organize the logic of your views. Use our Communication PowerPoint Templates because, Leadership Template: - Show them the way, be Captain of the ship and lead them to new shores. Use our Process and Flows PowerPoint Templates because, strengthen your relationship with your present customers and likely future ones as the occasion has an intrinsic business potential. Use these PowerPoint slides for presentations relating to abstract, action, attach, box, business, center, chain, chart, color, communication, concept, connection, cube, cycle, data, diagram, flow, globe, horizontal, idea, illustration, individual, information, interaction, jigsaw, join pieces, process puzzle, relationship, shape, success. The prominent colors used in the PowerPoint template are Blue, Gray, and Black

Market Charts Ppt PowerPoint Presentation Complete Deck With Slides
If designing a presentation takes a lot of your time and resources and you are looking for a better alternative, then this Market Charts Ppt PowerPoint Presentation Complete Deck With Slides is the right fit for you. This is a prefabricated set that can help you deliver a great presentation on the topic. All the twelve slides included in this sample template can be used to present a birds-eye view of the topic. These slides are also fully editable, giving you enough freedom to add specific details to make this layout more suited to your business setting. Apart from the content, all other elements like color, design, theme are also replaceable and editable. This helps in designing a variety of presentations with a single layout. Not only this, you can use this PPT design in formats like PDF, PNG, and JPG once downloaded. Therefore, without any further ado, download and utilize this sample presentation as per your liking.

Introduction To Switched Memory Access Ppt PowerPoint Presentation Diagram Graph Charts PDF
This slide represents the introduction to switched memory access, and a crossbar switch is installed to connect processors. Processors use shared memory in blocks, and connections between processors are made through a crossbar switch. Coming up with a presentation necessitates that the majority of the effort goes into the content and the message you intend to convey. The visuals of a PowerPoint presentation can only be effective if it supplements and supports the story that is being told. Keeping this in mind our experts created Introduction To Switched Memory Access Ppt PowerPoint Presentation Diagram Graph Charts PDF to reduce the time that goes into designing the presentation. This way, you can concentrate on the message while our designers take care of providing you with the right template for the situation.

Introduction And Benefits Of Marketing Collateral Ppt PowerPoint Presentation Diagram Graph Charts PDF
The following slide provides an overview of marketing collateral along with its positive impact on business. It showcases advantages such as standard information communication, reference material for sales, support material for conversations and campaign promotions. Present like a pro with Introduction And Benefits Of Marketing Collateral Ppt PowerPoint Presentation Diagram Graph Charts PDF Create beautiful presentations together with your team, using our easy to use presentation slides. Share your ideas in real time and make changes on the fly by downloading our templates. So whether you are in the office, on the go, or in a remote location, you can stay in sync with your team and present your ideas with confidence. With Slidegeeks presentation got a whole lot easier. Grab these presentations today.
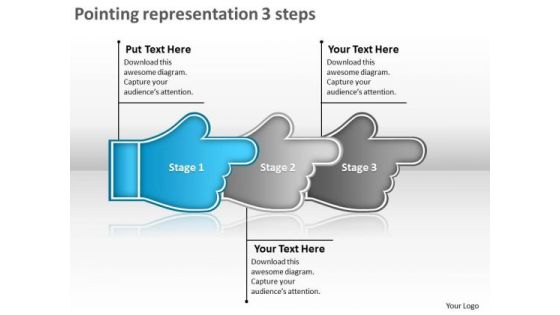
Pointing Representation 3 Steps What Is Flow Charts PowerPoint Slides
We present our pointing representation 3 steps what is flow charts PowerPoint Slides. Use our Arrows PowerPoint Templates because; have fired the dreams of many fertile minds. Use our Spheres PowerPoint Templates because, Team Efforts Business Template: - The concept and strategy is your strength. Use our Symbol PowerPoint Templates because; explain the contribution of each of the elements and how they provide impetus to the next phase. Use our Marketing PowerPoint Templates because, you have the people in place, selected the team leaders and all are raring to go. Use our Process and Flows PowerPoint Templates because, Support groups are an essential element of the ongoing struggle against cancer. Use these PowerPoint slides for presentations relating to Arrow, Business, Circle, Circular, Collection, Connection, Cursor, Decoration, Design, Dimensional, Direction, Element, Icon, Illustration, Information, Modern, Motion, Paper, Perspective, Plastic, Pointer, Pointing, Process, Recycle, Recycling, Reflective, Set, Shape, Shiny, Sign, Symbol, Technology. The prominent colors used in the PowerPoint template are Blue, Gray, and Black
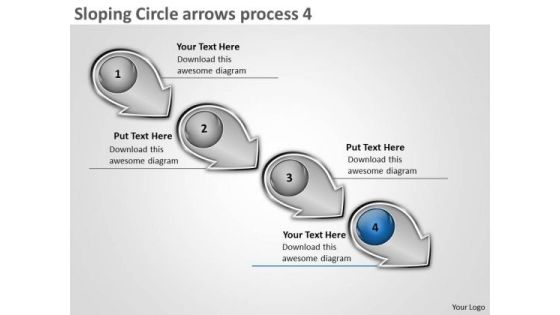
Sloping Circle Arrows Process 4 Create Flow Charts PowerPoint Slides
We present our sloping circle arrows process 4 create flow charts PowerPoint Slides. Use our Arrows PowerPoint Templates because, It is in your DNA to analyses possible causes to the minutest detail. Use our Spheres PowerPoint Templates because, Knowledge is power goes the popular saying. Use our Symbol PowerPoint Templates because; inform your team of your ideas using our illustrative slides. Use our Marketing PowerPoint Templates because; have fired the dreams of many fertile minds. Use our Process and Flows PowerPoint Templates because; Draw on its universal impact to highlight the similarities with your organizational structure and plans. Use these PowerPoint slides for presentations relating to Arrow, Business, Circle, Circular, Collection, Connection, Cursor, Decoration, Design, Dimensional, Direction, Element, Icon, Illustration, Information, Modern, Motion, Paper, Perspective, Plastic, Pointer, Pointing, Process, Recycle, Recycling, Reflective, Set, Shape, Shiny, Sign, Symbol, Technology. The prominent colors used in the PowerPoint template are Blue, Gray, and Black
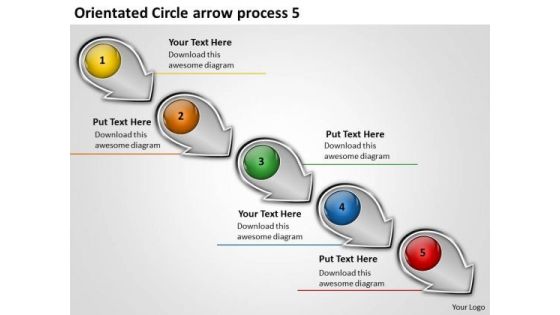
Orientated Circle Arrow Process 5 Sample Flow Charts PowerPoint Slides
We present our orientated circle arrow process 5 sample flow charts PowerPoint Slides. Use our Arrows PowerPoint Templates because, Leadership Template: - Show them the way, be Captain of the ship and lead them to new shores. Use our Spheres PowerPoint Templates because, Like your thoughts arrows are inherently precise and true. Use our Symbol PowerPoint Templates because; inform your team of your ideas using our illustrative slides. Use our Marketing PowerPoint Templates because, It is a step by step process with levels rising at every stage. Use our Process and Flows PowerPoint Templates because, Cycle Template:- Rolling along while gathering profits along the way is the aim. Use these PowerPoint slides for presentations relating to Arrow, Business, Circle, Circular, Collection, Connection, Cursor, Decoration, Design, Dimensional, Direction, Element, Icon, Illustration, Information, Modern, Motion, Paper, Perspective, Plastic, Pointer, Pointing, Process, Recycle, Recycling, Reflective, Set, Shape, Shiny, Sign, Symbol, Technology. The prominent colors used in the PowerPoint template are Red, Blue, and Green
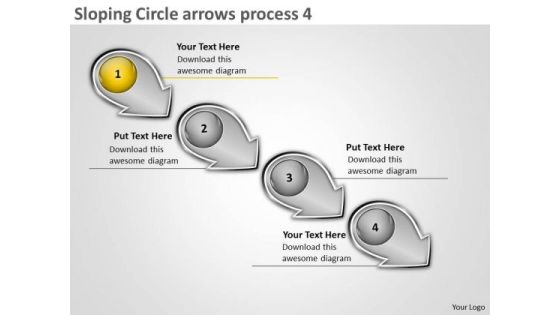
Sloping Circle Arrows Process 4 System Flow Charts PowerPoint Slides
We present our sloping circle arrows process 4 system flow charts PowerPoint Slides. Use our Arrows PowerPoint Templates because, Brilliant ideas popping up all over the place. Use our Spheres PowerPoint Templates because, one pushes the other till it all comes back full circle. Use our Symbol PowerPoint Templates because; now imprint them on the minds of your audience via our slides. Use our Marketing PowerPoint Templates because, There are so many different pieces to the puzzle. Use our Process and Flows PowerPoint Templates because, Cycle Template:- Rolling along while gathering profits along the way is the aim. Use these PowerPoint slides for presentations relating to Arrow, Business, Circle, Circular, Collection, Connection, Cursor, Decoration, Design, Dimensional, Direction, Element, Icon, Illustration, Information, Modern, Motion, Paper, Perspective, Plastic, Pointer, Pointing, Process, Recycle, Recycling, Reflective, Set, Shape, Shiny, Sign, Symbol, Technology. The prominent colors used in the PowerPoint template are Yellow, Gray, and Black

Sample Of Brochure To Promote Event Ppt PowerPoint Presentation Diagram Graph Charts PDF
This slide highlights examples of brochure used by business to provide description and guide audience about event. It purposes are provide a lot of information in a compact format, educate audience, and promote an event. This Sample Of Brochure To Promote Event Ppt PowerPoint Presentation Diagram Graph Charts PDF from Slidegeeks makes it easy to present information on your topic with precision. It provides customization options, so you can make changes to the colors, design, graphics, or any other component to create a unique layout. It is also available for immediate download, so you can begin using it right away. Slidegeeks has done good research to ensure that you have everything you need to make your presentation stand out. Make a name out there for a brilliant performance.

Data Migration Approach Ppt PowerPoint Presentation Diagram Graph Charts
Presenting this set of slides with name data migration approach ppt powerpoint presentation diagram graph charts. This is a six stage process. The stages in this process are business, management, planning, strategy, marketing. This is a completely editable PowerPoint presentation and is available for immediate download. Download now and impress your audience.
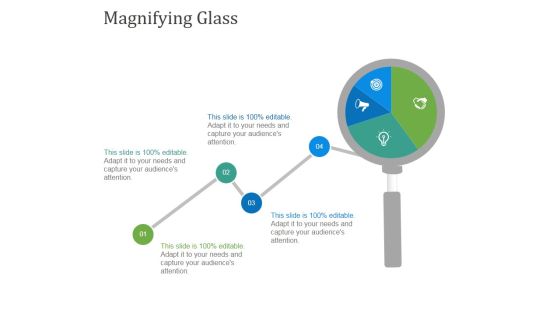
Magnifying Glass Ppt PowerPoint Presentation Diagram Graph Charts
This is a magnifying glass ppt powerpoint presentation diagram graph charts. This is a one stage process. The stages in this process are magnifying glass, planning, marketing, business, management, strategy.
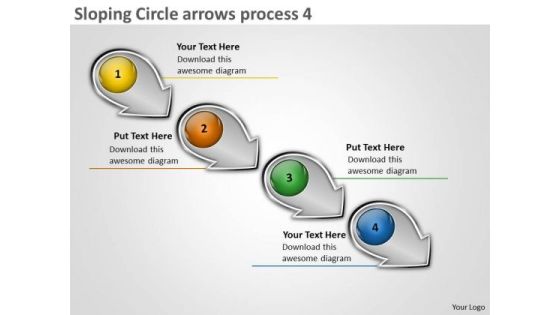
Sloping Circle Arrows Process 4 Production Flow Charts PowerPoint Templates
We present our sloping circle arrows process 4 production flow charts PowerPoint templates. Use our Arrows PowerPoint Templates because, Its also been said that prevention is better than cure, either way you have a store of knowledge for sure. Use our Spheres PowerPoint Templates because, and watch them strengthen your companys sinews. Use our Symbol PowerPoint Templates because, Sales Template:- Generation of sales is the core of any business. Use our Marketing PowerPoint Templates because, Business Process Design:- The template offers an excellent background to build up the various stages of your business process. Use our Process and Flows PowerPoint Templates because, Ideas roll along in your mind like billiard balls. Use these PowerPoint slides for presentations relating to Arrow, Business, Circle, Circular, Collection, Connection, Cursor, Decoration, Design, Dimensional, Direction, Element, Icon, Illustration, Information, Modern, Motion, Paper, Perspective, Plastic, Pointer, Pointing, Process, Recycle, Recycling, Reflective, Set, Shape, Shiny, Sign, Symbol, Technology. The prominent colors used in the PowerPoint template are Yellow, Orange, and Green
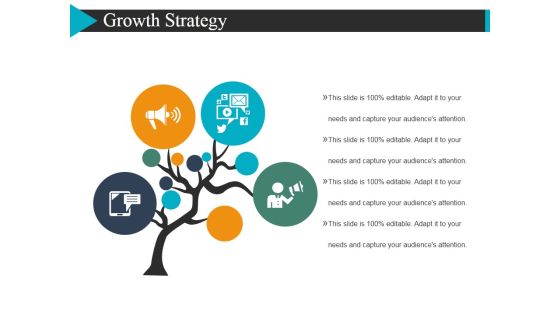
Growth Strategy Template 2 Ppt Powerpoint Presentation Diagram Graph Charts
This is a growth strategy template 2 ppt powerpoint presentation diagram graph charts. This is a four stage process. The stages in this process are tree, marketing, business, icons.

Life Cycle Charts Technology Adoption Model PowerPoint Templates
Life_Cycle_Charts_Technology_Adoption_Model_PowerPoint_templates-These high quality powerpoint pre-designed slides and powerpoint templates have been carefully created by our professional team to help you impress your audience. All slides have been created and are 100% editable in powerpoint. Each and every property of any graphic - color, size, orientation, shading, outline etc. can be modified to help you build an effective powerpoint presentation. Any text can be entered at any point in the powerpoint template or slide. Simply DOWNLOAD, TYPE and PRESENT! These PowerPoint presentation slides can be used to represent themes relating to --Alone, apart, chasm, clipart, communication, concept, couple, crack, divide, divorce, estranged, female, figure, gap, gender, graphic, illustration, isolated, isolation, issues, loneliness, love, male, man, people, problems, romance, silhouette, stick, symbol, vector, woman-Life_Cycle_Charts_Technology_Adoption_Model_PowerPoint_templates
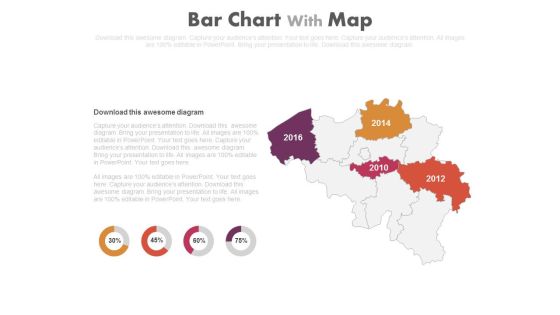
Map With Years And Percentage Charts Powerpoint Slides
This PowerPoint template displays map with years and percentage values. Our professionally designed map diagram is as an effective tool to display economic progress survey of particular areas. Above slide provide ideal backdrop to make business presentations.
Social Media Influencer Marketing Strategy Creation Icon Ppt PowerPoint Presentation Diagram Graph Charts PDF
Pitch your topic with ease and precision using this Social Media Influencer Marketing Strategy Creation Icon Ppt PowerPoint Presentation Diagram Graph Charts PDF. This layout presents information on Social Media, Influencer Marketing, Strategy Creation Icon. It is also available for immediate download and adjustment. So, changes can be made in the color, design, graphics or any other component to create a unique layout.

Business Charts 8 Stages Procedures For Monitoring And Controlling PowerPoint Slides
We present our business charts 8 stages procedures for monitoring and controlling PowerPoint Slides.Present our Circle Charts PowerPoint Templates because Our PowerPoint Templates and Slides will let your words and thoughts hit bullseye everytime. Present our Ring Charts PowerPoint Templates because Our PowerPoint Templates and Slides are created with admirable insight. Use them and give your group a sense of your logical mind. Use our Circle Charts PowerPoint Templates because It will get your audience in sync. Use our Process and Flows PowerPoint Templates because Our PowerPoint Templates and Slides will give you great value for your money. Be assured of finding the best projection to highlight your words. Download our Ring Charts PowerPoint Templates because Our PowerPoint Templates and Slides will let Your superior ideas hit the target always and everytime.Use these PowerPoint slides for presentations relating to Action, analysis, attitude, brainstorming, business, chart, classroom, concept,conceptual, conference, connection, corporate, design, diagram, direction,eight, employee, enhance, financial, formula, future, goal, graphic, guidelines,idea, link, management, market, marketing, mind, mindmap, organization,organize, plan, process, product, relation, render, solutions, strategy, success, successful, tactic, target, training, unity, vision. The prominent colors used in the PowerPoint template are Green lime, Blue, Gray.
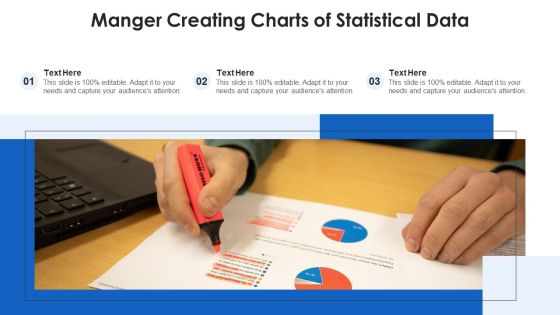
Manger Creating Charts Of Statistical Data Ppt PowerPoint Presentation File Visuals PDF
Presenting manger creating charts of statistical data ppt powerpoint presentation file visuals pdf to dispense important information. This template comprises three stages. It also presents valuable insights into the topics including manger creating charts of statistical data. This is a completely customizable PowerPoint theme that can be put to use immediately. So, download it and address the topic impactfully.

Agenda Enhancing Buyer Journey Ppt PowerPoint Presentation Diagram Graph Charts PDF
If you are looking for a format to display your unique thoughts, then the professionally designed Agenda Enhancing Buyer Journey Ppt PowerPoint Presentation Diagram Graph Charts PDF is the one for you. You can use it as a Google Slides template or a PowerPoint template. Incorporate impressive visuals, symbols, images, and other charts. Modify or reorganize the text boxes as you desire. Experiment with shade schemes and font pairings. Alter, share or cooperate with other people on your work. Download Agenda Enhancing Buyer Journey Ppt PowerPoint Presentation Diagram Graph Charts PDF and find out how to give a successful presentation. Present a perfect display to your team and make your presentation unforgettable.

Customer Voice Service Data Flow Charts Ppt PowerPoint Presentation Icon Styles PDF
This slide presents a data flow charts, which includes visual data about the inputs and outputs of entities and processes illustrating the flow of information between client voice services and data verse. it covers procedures including create project, distribute survey, respond to survey and analyse results. Presenting Customer Voice Service Data Flow Charts Ppt PowerPoint Presentation Icon Styles PDF to dispense important information. This template comprises one stages. It also presents valuable insights into the topics including Create Project, Distribute Survey, Analyze Results, Project Information. This is a completely customizable PowerPoint theme that can be put to use immediately. So, download it and address the topic impactfully.

Table Of Contents Information Security Ppt PowerPoint Presentation Diagram Graph Charts PDF
Find highly impressive Table Of Contents Information Security Ppt PowerPoint Presentation Diagram Graph Charts PDF on Slidegeeks to deliver a meaningful presentation. You can save an ample amount of time using these presentation templates. No need to worry to prepare everything from scratch because Slidegeeks experts have already done a huge research and work for you. You need to download Table Of Contents Information Security Ppt PowerPoint Presentation Diagram Graph Charts PDF for your upcoming presentation. All the presentation templates are 100 percent editable and you can change the color and personalize the content accordingly. Download now.

Use Cases Of Cloud Access Security Broker Ppt PowerPoint Presentation Diagram Graph Charts PDF
Find highly impressive Use Cases Of Cloud Access Security Broker Ppt PowerPoint Presentation Diagram Graph Charts PDF on Slidegeeks to deliver a meaningful presentation. You can save an ample amount of time using these presentation templates. No need to worry to prepare everything from scratch because Slidegeeks experts have already done a huge research and work for you. You need to download Use Cases Of Cloud Access Security Broker Ppt PowerPoint Presentation Diagram Graph Charts PDF for your upcoming presentation. All the presentation templates are 100 percent editable and you can change the color and personalize the content accordingly. Download now.

Agenda SDN Security Architecture Ppt PowerPoint Presentation Diagram Graph Charts PDF
Do you have an important presentation coming up Are you looking for something that will make your presentation stand out from the rest Look no further than Agenda SDN Security Architecture Ppt PowerPoint Presentation Diagram Graph Charts PDF. With our professional designs, you can trust that your presentation will pop and make delivering it a smooth process. And with Slidegeeks, you can trust that your presentation will be unique and memorable. So why wait Grab Agenda SDN Security Architecture Ppt PowerPoint Presentation Diagram Graph Charts PDF today and make your presentation stand out from the rest

E Learning Playbook Roadmap Ppt PowerPoint Presentation Diagram Graph Charts PDF
This is a E Learning Playbook Roadmap Ppt PowerPoint Presentation Diagram Graph Charts PDF template with various stages. Focus and dispense information on four stages using this creative set, that comes with editable features. It contains large content boxes to add your information on topics like Puzzle. You can also showcase facts, figures, and other relevant content using this PPT layout. Grab it now.

Collecting Consumer Qualitative Data For Personalized Marketing Ppt PowerPoint Presentation Diagram Graph Charts PDF
This slide showcases consumer qualitative data that can be collected to formulate personalized marketing campaign. It also shows ways to collect data from different sources Do you have an important presentation coming up Are you looking for something that will make your presentation stand out from the rest Look no further than Collecting Consumer Qualitative Data For Personalized Marketing Ppt PowerPoint Presentation Diagram Graph Charts PDF. With our professional designs, you can trust that your presentation will pop and make delivering it a smooth process. And with Slidegeeks, you can trust that your presentation will be unique and memorable. So why wait Grab Collecting Consumer Qualitative Data For Personalized Marketing Ppt PowerPoint Presentation Diagram Graph Charts PDF today and make your presentation stand out from the rest.
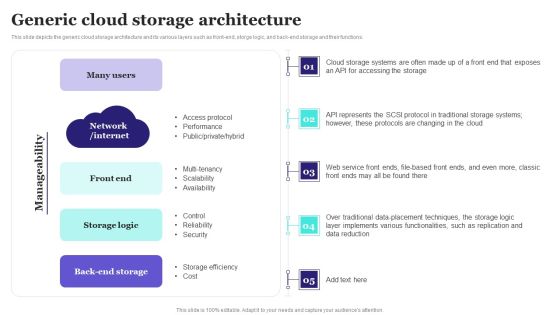
Generic Cloud Storage Architecture Ppt PowerPoint Presentation Diagram Graph Charts PDF
This slide depicts the generic cloud storage architecture and its various layers such as front end, storge logic, and back-end storage and their functions. Crafting an eye catching presentation has never been more straightforward. Let your presentation shine with this tasteful yet straightforward Generic Cloud Storage Architecture Ppt PowerPoint Presentation Diagram Graph Charts PDF template. It offers a minimalistic and classy look that is great for making a statement. The colors have been employed intelligently to add a bit of playfulness while still remaining professional. Construct the ideal Generic Cloud Storage Architecture Ppt PowerPoint Presentation Diagram Graph Charts PDF that effortlessly grabs the attention of your audience Begin now and be certain to wow your customers.

Customer Support Improvement Strategic Plan Table Of Contents Ppt PowerPoint Presentation Diagram Graph Charts PDF
From laying roadmaps to briefing everything in detail, our templates are perfect for you. You can set the stage with your presentation slides. All you have to do is download these easy to edit and customizable templates. Customer Support Improvement Strategic Plan Table Of Contents Ppt PowerPoint Presentation Diagram Graph Charts PDF will help you deliver an outstanding performance that everyone would remember and praise you for. Do download this presentation today.

Cloud Computing For Hosting Network Server Ppt Diagram Graph Charts PDF
Persuade your audience using this Cloud Computing For Hosting Network Server Ppt Diagram Graph Charts PDF. This PPT design covers four stages, thus making it a great tool to use. It also caters to a variety of topics including Cloud Computing, Hosting Network Server. Download this PPT design now to present a convincing pitch that not only emphasizes the topic but also showcases your presentation skills.

Table Of Contents Customer Support Improvement Strategic Plan Ppt PowerPoint Presentation Diagram Graph Charts PDF
Coming up with a presentation necessitates that the majority of the effort goes into the content and the message you intend to convey. The visuals of a PowerPoint presentation can only be effective if it supplements and supports the story that is being told. Keeping this in mind our experts created Table Of Contents Customer Support Improvement Strategic Plan Ppt PowerPoint Presentation Diagram Graph Charts PDF to reduce the time that goes into designing the presentation. This way, you can concentrate on the message while our designers take care of providing you with the right template for the situation.

Introduction To Cloud Storage Ppt PowerPoint Presentation Diagram Graph Charts PDF
This slide depicts the introduction to cloud storage, including its features such as being cost-effective, flexible, available, and its management by third party vendors. This modern and well arranged Introduction To Cloud Storage Ppt PowerPoint Presentation Diagram Graph Charts PDF provides lots of creative possibilities. It is very simple to customize and edit with the Powerpoint Software. Just drag and drop your pictures into the shapes. All facets of this template can be edited with Powerpoint no extra software is necessary. Add your own material, put your images in the places assigned for them, adjust the colors, and then you can show your slides to the world, with an animated slide included.

Data Center Relocation Benefits To The Company Ppt PowerPoint Presentation Diagram Graph Charts PDF
The following slide shows the benefits of data center relocation to the company such as increase in overall data center efficiency, reduction in data center expenses and increase in overall data security. Slidegeeks is here to make your presentations a breeze with Data Center Relocation Benefits To The Company Ppt PowerPoint Presentation Diagram Graph Charts PDF With our easy to use and customizable templates, you can focus on delivering your ideas rather than worrying about formatting. With a variety of designs to choose from, you are sure to find one that suits your needs. And with animations and unique photos, illustrations, and fonts, you can make your presentation pop. So whether you are giving a sales pitch or presenting to the board, make sure to check out Slidegeeks first.

Presenting Deals And Offers To Lure Prospects Ppt PowerPoint Presentation Diagram Graph Charts PDF
The following slide showcases deals and offers which can be presented by marketers to lure more customers. It provides information about email marketing sequence, news events, holidays, seasons, etc. Slidegeeks is here to make your presentations a breeze with Presenting Deals And Offers To Lure Prospects Ppt PowerPoint Presentation Diagram Graph Charts PDF With our easy to use and customizable templates, you can focus on delivering your ideas rather than worrying about formatting. With a variety of designs to choose from, you are sure to find one that suits your needs. And with animations and unique photos, illustrations, and fonts, you can make your presentation pop. So whether you are giving a sales pitch or presenting to the board, make sure to check out Slidegeeks first.

Analyzing Different Fulfillment Options Utilized By Sellers Ppt PowerPoint Presentation Diagram Graph Charts PDF
This slide provides information regarding the assessment of fulfillment options utilized by sellers. Two fulfillment options used by sellers include fulfillment by Amazon and Merchant along with their feasibility. Slidegeeks is one of the best resources for PowerPoint templates. You can download easily and regulate Analyzing Different Fulfillment Options Utilized By Sellers Ppt PowerPoint Presentation Diagram Graph Charts PDF for your personal presentations from our wonderful collection. A few clicks is all it takes to discover and get the most relevant and appropriate templates. Use our Templates to add a unique zing and appeal to your presentation and meetings. All the slides are easy to edit and you can use them even for advertisement purposes.

Latest And Emerging Trends In SMS Marketing Ppt PowerPoint Presentation Diagram Graph Charts PDF
This slide represents the SMS marketing trends to help brand in communicating its business values in diverse manner and to break market boundaries. It includes details related to emerging SMS marketing trends such as RCS messaging, conversational marketing etc. Present like a pro with Latest And Emerging Trends In SMS Marketing Ppt PowerPoint Presentation Diagram Graph Charts PDF Create beautiful presentations together with your team, using our easy to use presentation slides. Share your ideas in real time and make changes on the fly by downloading our templates. So whether you are in the office, on the go, or in a remote location, you can stay in sync with your team and present your ideas with confidence. With Slidegeeks presentation got a whole lot easier. Grab these presentations today.

Business Diagram Six Pie Charts For Result Representation And Percentage Presentation Template
Display the concept of result analysis in your business presentation. This PPT slide contains the graphic of six pie charts. Use this PPT slide for your business and marketing data related presentations.
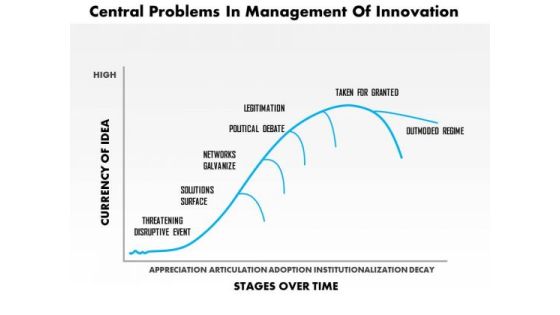
Business Framework Central Problems In Management Of Innovation PowerPoint Presentation
This business framework PPT has been crafted with graphic of analysis chart. This chart is displaying the curve of analysis for central problem in management of innovation. Use this diagram slide and display problems in form of analysis.

Application Of End User Computing In Manufacturing Ppt PowerPoint Presentation Diagram Graph Charts PDF
This slide explains the use cases of end user computing in manufacturing and how it will improve the feedback processes, Kanban process and analysis of the work center. Do you have to make sure that everyone on your team knows about any specific topic I yes, then you should give Application Of End User Computing In Manufacturing Ppt PowerPoint Presentation Diagram Graph Charts PDF a try. Our experts have put a lot of knowledge and effort into creating this impeccable Application Of End User Computing In Manufacturing Ppt PowerPoint Presentation Diagram Graph Charts PDF. You can use this template for your upcoming presentations, as the slides are perfect to represent even the tiniest detail. You can download these templates from the Slidegeeks website and these are easy to edit. So grab these today.
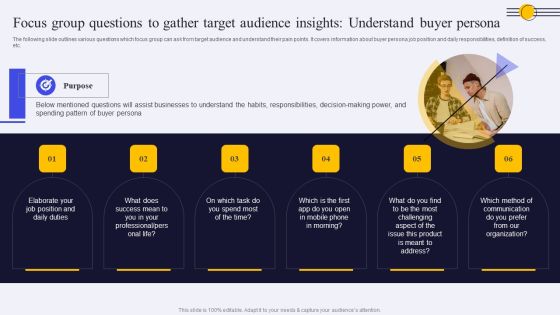
Focus Group Questions To Gather Target Audience Insights Understand Buyer Persona Ppt PowerPoint Presentation Diagram Graph Charts PDF
The following slide outlines various questions which focus group can ask from target audience and understand their pain points. It covers information about buyer persona job position and daily responsibilities, definition of success, etc. Do you have to make sure that everyone on your team knows about any specific topic I yes, then you should give Focus Group Questions To Gather Target Audience Insights Understand Buyer Persona Ppt PowerPoint Presentation Diagram Graph Charts PDF a try. Our experts have put a lot of knowledge and effort into creating this impeccable Focus Group Questions To Gather Target Audience Insights Understand Buyer Persona Ppt PowerPoint Presentation Diagram Graph Charts PDF. You can use this template for your upcoming presentations, as the slides are perfect to represent even the tiniest detail. You can download these templates from the Slidegeeks website and these are easy to edit. So grab these today.

Brief Introduction To Structural Change Management For Effective Business Procedures Ppt PowerPoint Presentation Diagram Graph Charts PDF
This slide represents the overview of the changes implemented in the management hierarchy and teams of the enterprise. It includes details related to types of structural changes such as mergers and acquisitions, creation of new teams or departments etc. Want to ace your presentation in front of a live audience Our Brief Introduction To Structural Change Management For Effective Business Procedures Ppt PowerPoint Presentation Diagram Graph Charts PDF can help you do that by engaging all the users towards you. Slidegeeks experts have put their efforts and expertise into creating these impeccable powerpoint presentations so that you can communicate your ideas clearly. Moreover, all the templates are customizable, and easy to edit and downloadable. Use these for both personal and commercial use.

Business Circle Charts PowerPoint Templates Marketing Financial Planning Process Ppt Slides
Business Circle Charts PowerPoint Templates Marketing Financial Planning Process PPT Slides-This circle chart can be used in business, education and economic presentations to help the audience visualize the content better, or to find flaws in a financial planning process.-Business Circle Charts PowerPoint Templates Marketing Financial Planning Process PPT Slides-This template can be used for presentations relating to Abstract, Action, Business, Chart, Commerce, Competitor, Components, Concept, Conceptual, Design, Diagram, Executive, Financial, Goals, Guide, Guidelines, Hierarchy, Icon, Idea, Illustration, Manage, Management, Marketing, Mind, Mission, Model, Operations, Organization, Performance, Plan, Planning, Process

3d Diverging 11 Stages Of Single Process Ppt Charts And Diagrams PowerPoint Templates
We present our 3d diverging 11 stages of single process ppt Charts and Diagrams PowerPoint templates.Use our Circle Charts PowerPoint Templates because it is a step by step process with levels rising at every stage. Use our Arrows PowerPoint Templates because this PPt slide can educate your listeners on the relevance and importance of each one as per your plan and how they all contribute as you strive to hit the Bullseye. Download our Business PowerPoint Templates because The foundation of the structure of your business is resilient and dependable. Convey this confidence to your colleagues and assure them of a great and enduring future. Download our Shapes PowerPoint Templates because others naturally tend to follow in the path blazed by you. Present our Flow Charts PowerPoint Templates because our PowerPoint templates designed for your ideas to sell.Use these PowerPoint slides for presentations relating to advice, analysis, analyze, background, blank, business, center, central, chalk, component, concept, connection, core, counter, deploy, diagram, distribute, draw, education, element, exchange, flow, gather, industry, input, join, link, management, manager, output, people, person, plan, process, reaction, strategy, support, surround, teamwork. The prominent colors used in the PowerPoint template are Yellow, Green, Blue. Customers tell us our 3d diverging 11 stages of single process ppt Charts and Diagrams PowerPoint templates are Liberated. PowerPoint presentation experts tell us our analyze PowerPoint templates and PPT Slides are Ultra. People tell us our 3d diverging 11 stages of single process ppt Charts and Diagrams PowerPoint templates are topically designed to provide an attractive backdrop to any subject. People tell us our background PowerPoint templates and PPT Slides will help you be quick off the draw. Just enter your specific text and see your points hit home. Customers tell us our 3d diverging 11 stages of single process ppt Charts and Diagrams PowerPoint templates are Fashionable. People tell us our center PowerPoint templates and PPT Slides are Enchanting.
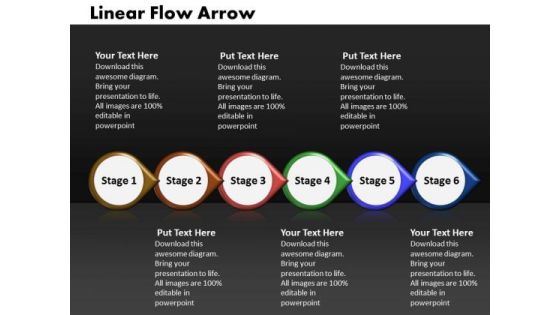
Ppt Linear Flow Process Charts Arrow-6 Power Point Stage PowerPoint Templates
PPT linear flow process charts arrow-6 power point stage PowerPoint Templates-Analyze the six success factors of your business with this linear business chart for Microsoft PowerPoint presentations-PPT linear flow process charts arrow-6 power point stage PowerPoint Templates-Abstract, Arrow, Arrow Chart, Business, Design, Development, Diagram, Direction, Element, Flow, Flow Chart, Flow Diagram, Flowchart, Graph, Linear, Management, Model, Motion, Organization, Plan, Process, Process Arrows, Process Chart, Process Diagram, Process Flow, Program, Section, Segment, Set, Sign, Solution, Strategy, Symbol, Technology

Project Communication System Data Flow Charts Ppt PowerPoint Presentation Gallery Background Images PDF
This slide displays communication system processes within the framework of a data flow charts to analyse interactions, processing, and data flow before creating the network. it includes components such as project requestor, management, vendors, current system examination and models. Presenting Project Communication System Data Flow Charts Ppt PowerPoint Presentation Gallery Background Images PDF to dispense important information. This template comprises six stages. It also presents valuable insights into the topics including Project Requestor, Management, Vendors. This is a completely customizable PowerPoint theme that can be put to use immediately. So, download it and address the topic impactfully.
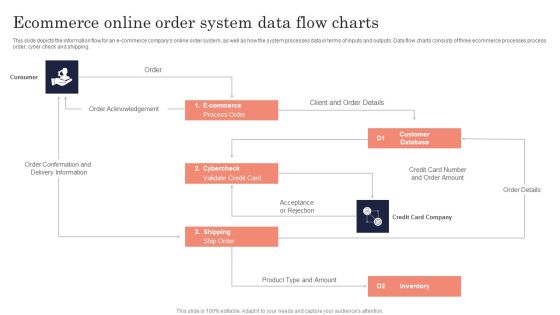
Ecommerce Online Order System Data Flow Charts Ppt PowerPoint Presentation File Slides PDF
This slide depicts the information flow for an e-commerce companys online order system, as well as how the system processes data in terms of inputs and outputs. Data flow charts consists of three ecommerce processes process order, cyber check and shipping. Presenting Ecommerce Online Order System Data Flow Charts Ppt PowerPoint Presentation File Slides PDF to dispense important information. This template comprises two stages. It also presents valuable insights into the topics including Customer, Database Inventory, Cybercheck. This is a completely customizable PowerPoint theme that can be put to use immediately. So, download it and address the topic impactfully.

Sales Management Data Flow Charts Ppt PowerPoint Presentation File Slide Portrait PDF
This slide displays data flow charts illustrating the flow of information and where it is stored in relation to sales management system procedures. it covers four procedures accessory list, accessory increment, supplier classification, and shipping list verification. Persuade your audience using this Sales Management Data Flow Charts Ppt PowerPoint Presentation File Slide Portrait PDF. This PPT design covers three stages, thus making it a great tool to use. It also caters to a variety of topics including Deficit List, Buying List, Accessory Stock List. Download this PPT design now to present a convincing pitch that not only emphasizes the topic but also showcases your presentation skills.
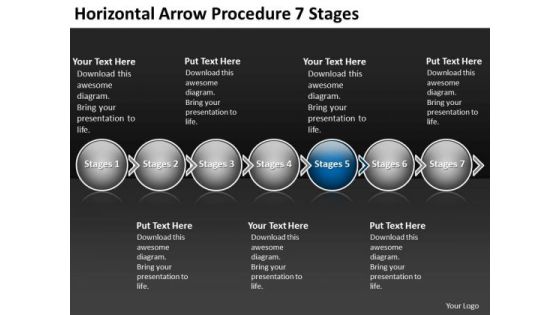
Horizontal Arrow Procedure 7 Stages Business Make Flow Charts PowerPoint Templates
We present our horizontal arrow procedure 7 stages business make flow charts PowerPoint templates. Use our Leadership PowerPoint Templates because, discuss each one and slowly but surely move up the pyramid narrowing down to the best and most success oriented project. Use our Arrows PowerPoint Templates because, this template with an image of helps you chart the course of your presentation. Use our Circle Charts PowerPoint Templates because, Illuminate the spiritual brilliance of Jesus and shower the love for mankind he showed even while being crucified. Use our Process and Flows PowerPoint Templates because; Show them how to persistently hit bulls eye. Use our Shapes PowerPoint Templates because, Now use this slide to bullet point your views. Use these PowerPoint slides for presentations relating to Arrow, business, circle, circular, collection, connection, cursor, decoration, design, dimensional, direction, element, icon, illustration, information, modern, motion, perspective, pointing, process, recycle, recycling, reflective, shape, shiny, sign, symbol, technology. The prominent colors used in the PowerPoint template are Blue navy, Gray, White

Insurance Claims Data Flow Charts Ppt PowerPoint Presentation File Formats PDF
This slide illustrates the process of a policyholder making a formal request to an insurance company for compensation for a covered loss or policy event in context of a data flow charts. It consists of three procedures collecting and analysing claim data, figuring out reimbursement, and sending client complaints. Persuade your audience using this Insurance Claims Data Flow Charts Ppt PowerPoint Presentation File Formats PDF. This PPT design covers three stages, thus making it a great tool to use. It also caters to a variety of topics including Insured Client, Claim Status, Account Database. Download this PPT design now to present a convincing pitch that not only emphasizes the topic but also showcases your presentation skills.

Level 1 Data Flow Charts For ATM System Ppt PowerPoint Presentation Gallery Visual Aids PDF
Presenting Level 1 Data Flow Charts For ATM System Ppt PowerPoint Presentation Gallery Visual Aids PDF to dispense important information. This template comprises two stages. It also presents valuable insights into the topics including Payment Card Reader, User Keypad, Control System, Printout Dispenser. This is a completely customizable PowerPoint theme that can be put to use immediately. So, download it and address the topic impactfully.

Data Flow Charts For Sale Order Processing System Ppt PowerPoint Presentation File Introduction PDF
Persuade your audience using this Data Flow Charts For Sale Order Processing System Ppt PowerPoint Presentation File Introduction PDF. This PPT design covers three stages, thus making it a great tool to use. It also caters to a variety of topics including Consumer, Faulty Orders, Billing Details. Download this PPT design now to present a convincing pitch that not only emphasizes the topic but also showcases your presentation skills.

Employee Management System Data Flow Charts Ppt PowerPoint Presentation File Clipart Images PDF
Persuade your audience using this Employee Management System Data Flow Charts Ppt PowerPoint Presentation File Clipart Images PDF. This PPT design covers three stages, thus making it a great tool to use. It also caters to a variety of topics including Accounting Department, Human Resource Department, Employee. Download this PPT design now to present a convincing pitch that not only emphasizes the topic but also showcases your presentation skills.

3d Arrow Flow Diagram Diverging 7 Steps Charts And Diagrams PowerPoint Templates
We present our 3d arrow flow diagram diverging 7 steps Charts and Diagrams PowerPoint templates.Use our Arrows PowerPoint Templates because you can Adorn them with your ideas and thoughts. Download and present our Business PowerPoint Templates because you are ready to flap your wings and launch off. All poised are you to touch the sky with glory. Download our Shapes PowerPoint Templates because all elements of the venture are equally critical. Use our Circle Charts PowerPoint Templates because you can Grab the attention of your team with this eye catching template signifying . Download and present our Flow Charts PowerPoint Templates because you have the right arrows in your quiver.Use these PowerPoint slides for presentations relating to 3d, abstract, arrow, art, background, blank, business, chart, circle, concept, connection, cycle, development, diagram, direction, element, environment, exchange, finance, flow, graph, graphic, group, icon, illustration, investment, isolated, isometric, market, motion, movement, organization, passive income, perspective, presentation, process, process chart, recycle, report, ring, sign, step, stock, success, symbol, teamwork, text, vector. The prominent colors used in the PowerPoint template are Yellow, Green, Blue. Customers tell us our 3d arrow flow diagram diverging 7 steps Charts and Diagrams PowerPoint templates are Adorable. PowerPoint presentation experts tell us our arrow PowerPoint templates and PPT Slides are specially created by a professional team with vast experience. They diligently strive to come up with the right vehicle for your brilliant Ideas. People tell us our 3d arrow flow diagram diverging 7 steps Charts and Diagrams PowerPoint templates are Great. People tell us our arrow PowerPoint templates and PPT Slides are Tranquil. Customers tell us our 3d arrow flow diagram diverging 7 steps Charts and Diagrams PowerPoint templates provide great value for your money. Be assured of finding the best projection to highlight your words. People tell us our business PowerPoint templates and PPT Slides are Graceful.
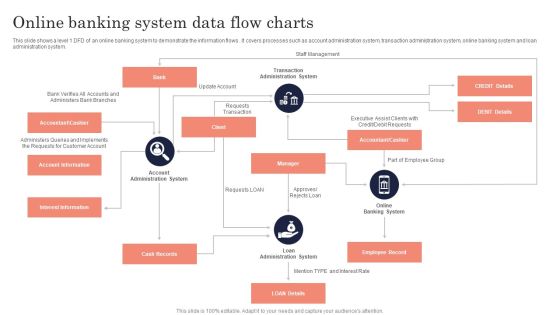
Online Banking System Data Flow Charts Ppt PowerPoint Presentation File Layout Ideas PDF
this slide shows a level 1 dfd of an online banking system to demonstrate the information flows. it covers processes such as account administration system, transaction administration system, online banking system and loan administration system. Persuade your audience using this Online Banking System Data Flow Charts Ppt PowerPoint Presentation File Layout Ideas PDF. This PPT design covers four stages, thus making it a great tool to use. It also caters to a variety of topics including Transaction Administration System, Accountant, Cashier, Employee Record. Download this PPT design now to present a convincing pitch that not only emphasizes the topic but also showcases your presentation skills.
Securities Trading Platform Data Flow Charts Ppt PowerPoint Presentation Gallery Icons PDF
This Slides displays a thorough data flow chartsthat graphically illustrates the operations of a securities trading platform, as well as the sources and recipients of the information. It includes five processes such as open account, verify transaction, deposit cash, withdraw cash and place order. Presenting Securities Trading Platform Data Flow Charts Ppt PowerPoint Presentation Gallery Icons PDF to dispense important information. This template comprises six stages. It also presents valuable insights into the topics including Account, Transaction, Consumer Service Assistant, Client. This is a completely customizable PowerPoint theme that can be put to use immediately. So, download it and address the topic impactfully.
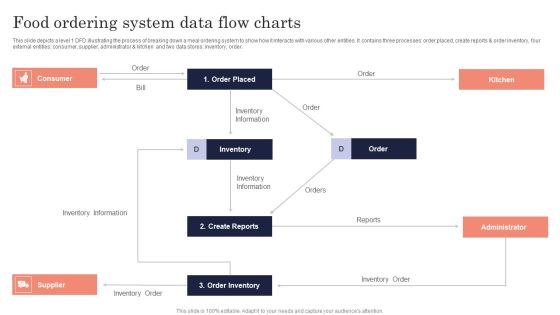
Food Ordering System Data Flow Charts Ppt PowerPoint Presentation File Pictures PDF
This slide depicts a level 1 DFD illustrating the process of breaking down a meal ordering system to show how it interacts with various other entities. It contains three processes order placed, create reports and order inventory, four external entities consumer, supplier, administrator and kitchen and two data stores inventory, order. Presenting Food Ordering System Data Flow Charts Ppt PowerPoint Presentation File Pictures PDF to dispense important information. This template comprises one stages. It also presents valuable insights into the topics including Consumer, Order Placed, Administrator, Inventory. This is a completely customizable PowerPoint theme that can be put to use immediately. So, download it and address the topic impactfully.

Social Media Response Data Flow Charts Ppt PowerPoint Presentation Gallery Background Designs PDF
This slide features a social media dfd flowchart to suggest the appropriate response to social media mentions. it consists of three stages including review, evaluation, and response. Persuade your audience using this Social Media Response Data Flow Charts Ppt PowerPoint Presentation Gallery Background Designs PDF. This PPT design covers three stages, thus making it a great tool to use. It also caters to a variety of topics including Review, Evaluate, Response, Comment Or Post. Download this PPT design now to present a convincing pitch that not only emphasizes the topic but also showcases your presentation skills.

7 Stages Comprehensive Organizational Charts Business Plan Cover Page PowerPoint Slides
We present our 7 stages comprehensive organizational charts business plan cover page PowerPoint Slides.Use our Business PowerPoint Templates because Our PowerPoint Templates and Slides help you meet the demand of the Market. Just browse and pick the slides that appeal to your intuitive senses. Present our Arrows PowerPoint Templates because You have a driving passion to excel in your field. Our PowerPoint Templates and Slides will prove ideal vehicles for your ideas. Download our Circle Charts PowerPoint Templates because You are well armed with penetrative ideas. Our PowerPoint Templates and Slides will provide the gunpowder you need. Download and present our Process and Flows PowerPoint Templates because It will let you Set new benchmarks with our PowerPoint Templates and Slides. They will keep your prospects well above par. Download and present our Flow Charts PowerPoint Templates because It can be used to Set your controls for the heart of the sun. Our PowerPoint Templates and Slides will be the propellant to get you there.Use these PowerPoint slides for presentations relating to Act, arrow, blue, business, chart, check, circle, concept, control, cycle, design, development, diagram, do, engineering, evaluate, flow, flow-chart, flowchart, graphic,green, idea, infographic, iterative, life, life-cycle, lifecycle, management, method, model, pdca, plan, process, quality, research, schema,software, spiral, step, strategy, success, system, vector, white, work, workflow . The prominent colors used in the PowerPoint template are Orange, Gray, Black.

Business Charts PowerPoint Templates Simple 4 Stage Circular Process Editable Sales
Business Charts PowerPoint templates simple 4 stage circular process editable Sales-This PowerPoint Diagram consists of four animated Process tables of Different Colors. It can be used to symbolize four different Approaches or four distinct techniques. It consists of single color slide as well. This diagram will fit for Business Presentations.

Charts Breakdown Of Data Parts As Whole 5 Stages Ppt Mini Business Plan PowerPoint Templates
We present our charts breakdown of data parts as whole 5 stages ppt mini business plan PowerPoint templates.Use our Business PowerPoint Templates because Your ideas provide food for thought. Our PowerPoint Templates and Slides will help you create a dish to tickle the most discerning palate. Download and present our Ring Charts PowerPoint Templates because You are well armed with penetrative ideas. Our PowerPoint Templates and Slides will provide the gunpowder you need. Download and present our Process and Flows PowerPoint Templates because Our PowerPoint Templates and Slides will let you Illuminate the road ahead to Pinpoint the important landmarks along the way. Present our Shapes PowerPoint Templates because Our PowerPoint Templates and Slides will let you Hit the target. Go the full distance with ease and elan. Download our Flow Charts PowerPoint Templates because It can Conjure up grand ideas with our magical PowerPoint Templates and Slides. Leave everyone awestruck by the end of your presentation.Use these PowerPoint slides for presentations relating to Chart, pentagon, flow, vector, circular, breakdown, round, hexagon, shape, around, symbol, movement, cyclic, isolated, square, vibrant, triangle, refresh,sign, rotation, glossy, circle, ring, element, abstract, cycle, circulation, illustration, section, direction, motion, set, circles, circular flow. The prominent colors used in the PowerPoint template are Purple, White, Gray.
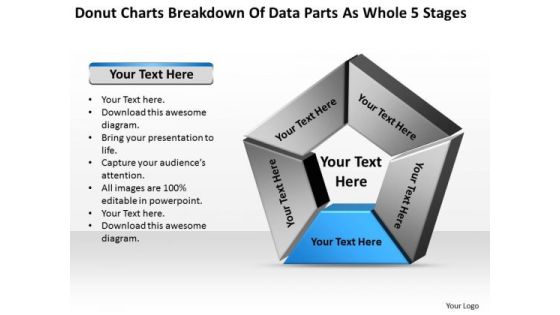
Charts Breakdown Of Data Parts As Whole 5 Stages Personal Business Plan PowerPoint Slides
We present our charts breakdown of data parts as whole 5 stages personal business plan PowerPoint Slides.Present our Business PowerPoint Templates because Our PowerPoint Templates and Slides will provide you the cutting edge. Slice through the doubts in the minds of your listeners. Use our Ring Charts PowerPoint Templates because Our PowerPoint Templates and Slides will Activate the energies of your audience. Get their creative juices flowing with your words. Use our Process and Flows PowerPoint Templates because Our PowerPoint Templates and Slides are designed to help you succeed. They have all the ingredients you need. Download our Shapes PowerPoint Templates because Our PowerPoint Templates and Slides will provide you the cutting edge. Slice through the doubts in the minds of your listeners. Present our Flow Charts PowerPoint Templates because Our PowerPoint Templates and Slides will Embellish your thoughts. They will help you illustrate the brilliance of your ideas.Use these PowerPoint slides for presentations relating to Chart, pentagon, flow, vector, circular, breakdown, round, hexagon, shape, around, symbol, movement, cyclic, isolated, square, vibrant, triangle, refresh,sign, rotation, glossy, circle, ring, element, abstract, cycle, circulation, illustration, section, direction, motion, set, circles, circular flow. The prominent colors used in the PowerPoint template are Blue, Gray, White.
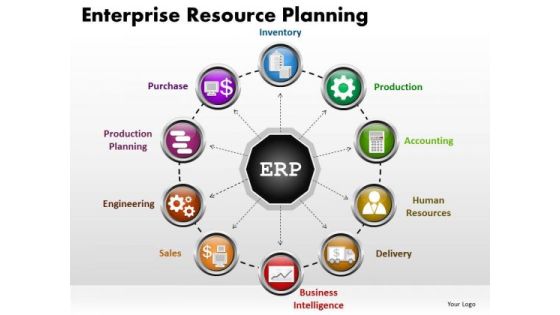
Business Circle Charts PowerPoint Templates Strategy Enterprise Resource Planning Ppt Slides
Business Circle Charts PowerPoint Templates Strategy Enterprise Resource Planning PPT Slides-This circle chart shows various interrelated circles can be used for factors involved in stragey enterprise resource planning-Business Circle Charts PowerPoint Templates Strategy Enterprise Resource Planning PPT Slides-This template can be used for presentations relating to 3d, Arrow, Blueprint, Business, Circle, Cleverness, Commerce, Company, Competence, Concept, Constructive, Corporate, Create, Creative, Creativity, Decision, Design, Develop, Device, Discover, Earn, Enterprise, Finance, Goal, Idea, Imaginative, Ingenious, Innovative, Inspiration, Inspire, Inventive, Job, Management, Market
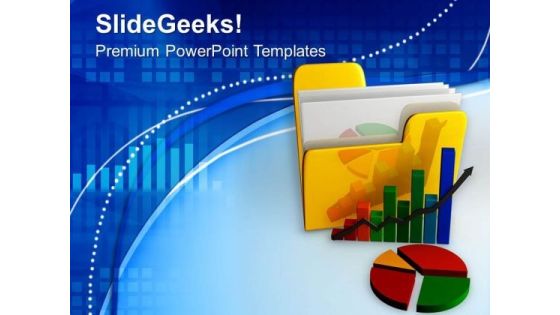
Image Of Folder And Charts PowerPoint Templates Ppt Backgrounds For Slides 0713
Touch base with our Image Of Folder And Charts PowerPoint Templates PPT Backgrounds For Slides. Review your growth with your audience. Take a deep dive with our Pie Charts PowerPoint Templates. Get into the nitty-gritty of it all. Plan your storyboard with our Process and Flows PowerPoint Templates. Give an outline to the solutions you have.
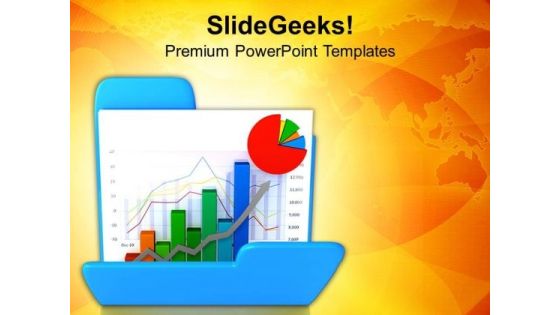
Growth Charts And Put Them In Security PowerPoint Templates Ppt Backgrounds For Slides 0713
Be your own editor with our Growth Charts And Put Them In Security PowerPoint Templates PPT Backgrounds For Slides. Align your thoughts as per your wishes. Land the idea with our Pie Charts PowerPoint Templates. Help it grow with your thoughts. Cover the compass with our Arrows PowerPoint Templates. Your ideas will be acceptable to all.
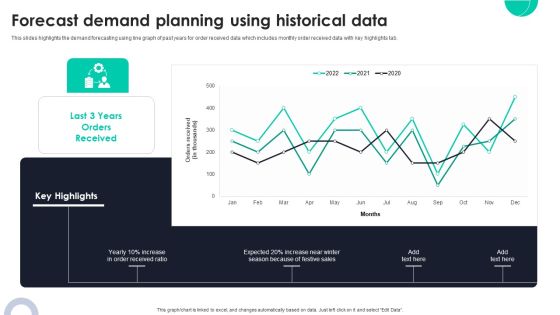
Forecast Demand Planning Using Historical Data Ppt PowerPoint Presentation Diagram Graph Charts PDF
This slides highlights the demand forecasting using line graph of past years for order received data which includes monthly order received data with key highlights tab. Crafting an eye catching presentation has never been more straightforward. Let your presentation shine with this tasteful yet straightforward Forecast Demand Planning Using Historical Data Ppt PowerPoint Presentation Diagram Graph Charts PDF template. It offers a minimalistic and classy look that is great for making a statement. The colors have been employed intelligently to add a bit of playfulness while still remaining professional. Construct the ideal Forecast Demand Planning Using Historical Data Ppt PowerPoint Presentation Diagram Graph Charts PDF that effortlessly grabs the attention of your audience. Begin now and be certain to wow your customers.

Arrows Graphical View Of Different Aspects Arrow Charts And Diagrams PowerPoint Templates
We present our arrows graphical view of different aspects arrow Charts and Diagrams PowerPoint templates.Download our Business PowerPoint Templates because the great Bald headed Eagle embodies your personality. the eagle eye to seize upon the smallest of opportunities. Download our Arrows PowerPoint Templates because it helps you to get your team in the desired sequence into the bracket. Download our Shapes PowerPoint Templates because the graphic is a symbol of growth and success. Present our Flow Charts PowerPoint Templates because this helps you to comprehend your plan to get the entire act together. Download and present our Process and Flows PowerPoint Templates because it can illustrate your chain of ideas focusing on that aspect or resource in order to enhance the quality of your product.Use these PowerPoint slides for presentations relating to Arrow, Business, Button, Chart, Circle, Company, Cross, Data, Design, Diagram, Direction, Document, Financial, Management, Marketing, Multiple, Plan, Presentation, Process, Results, Sphere, Template, Website, Wheel. The prominent colors used in the PowerPoint template are Blue, White, Gray. Presenters tell us our arrows graphical view of different aspects arrow Charts and Diagrams PowerPoint templates are Exuberant. We assure you our Cross PowerPoint templates and PPT Slides are Amazing. Presenters tell us our arrows graphical view of different aspects arrow Charts and Diagrams PowerPoint templates are the best it can get when it comes to presenting. Use our Circle PowerPoint templates and PPT Slides are Graceful. We assure you our arrows graphical view of different aspects arrow Charts and Diagrams PowerPoint templates are Second to none. You can be sure our Circle PowerPoint templates and PPT Slides are Delightful.

Famous Technology Trends Charts With Multichannel Analytics Ppt PowerPoint Presentation Ideas Graphics Tutorials PDF
Pitch your topic with ease and precision using this famous technology trends charts with multichannel analytics ppt powerpoint presentation ideas graphics tutorials pdf. This layout presents information on multichannel analytics, content marketing, paid media, social media marketing, email marketing . It is also available for immediate download and adjustment. So, changes can be made in the color, design, graphics or any other component to create a unique layout.

7 Stages Comprehensive Organizational Charts What Is Business Plan PowerPoint Slides
We present our 7 stages comprehensive organizational charts what is business plan PowerPoint Slides.Download our Circle Charts PowerPoint Templates because You can Connect the dots. Fan expectations as the whole picture emerges. Present our Business PowerPoint Templates because It can be used to Set your controls for the heart of the sun. Our PowerPoint Templates and Slides will be the propellant to get you there. Download and present our Process and Flows PowerPoint Templates because Our PowerPoint Templates and Slides will embellish your thoughts. See them provide the desired motivation to your team. Download and present our Shapes PowerPoint Templates because You have the co-ordinates for your destination of success. Let our PowerPoint Templates and Slides map out your journey. Download and present our Arrows PowerPoint Templates because It can Bubble and burst with your ideas.Use these PowerPoint slides for presentations relating to Act, arrow, blue, business, chart, check, circle, concept, control, cycle, design, development, diagram, do, engineering, evaluate, flow, flow-chart, flowchart, graphic,green, idea, infographic, iterative, life, life-cycle, lifecycle, management, method, model, pdca, plan, process, quality, research, schema,software, spiral, step, strategy, success, system, vector, white, work, workflow . The prominent colors used in the PowerPoint template are Pink, Gray, Black.
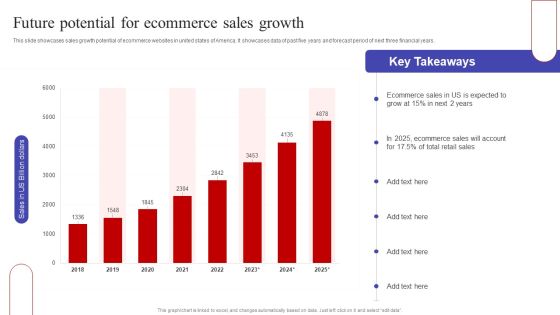
Future Potential For Ecommerce Sales Growth Ppt PowerPoint Presentation Diagram Graph Charts PDF
This slide showcases sales growth potential of ecommerce websites in united states of America. It showcases data of past five years and forecast period of next three financial years. Here you can discover an assortment of the finest PowerPoint and Google Slides templates. With these templates, you can create presentations for a variety of purposes while simultaneously providing your audience with an eye catching visual experience. Download Future Potential For Ecommerce Sales Growth Ppt PowerPoint Presentation Diagram Graph Charts PDF to deliver an impeccable presentation. These templates will make your job of preparing presentations much quicker, yet still, maintain a high level of quality. Slidegeeks has experienced researchers who prepare these templates and write high quality content for you. Later on, you can personalize the content by editing the Future Potential For Ecommerce Sales Growth Ppt PowerPoint Presentation Diagram Graph Charts PDF.

8 Stages Diverging Arrows Organizational Workflow Model Ppt Charts And PowerPoint Slides
We present our 8 stages diverging arrows organizational workflow model ppt Charts and PowerPoint Slides.Download and present our Arrows PowerPoint Templates because you should Demonstrate how you think out of the box. Use our Business PowerPoint Templates because watch the excitement levels rise as they realise their worth. Download our Flow Charts PowerPoint Templates because you will be able to Highlight these individual targets and the paths to their achievement. Present our Shapes PowerPoint Templates because you can take it along a sure fire road to good profit. Download and present our Process and Flows PowerPoint Templates because it helps you to display your ideas and thoughts.Use these PowerPoint slides for presentations relating to Arrows, Business, Chart, Cyclic, Data, Diagram, Financial, Goal, Graph, Illustration, Info, Information, Marketing, Model, Option, Part, Pie, Presentation, Process, Result, Sphere, Statistics. The prominent colors used in the PowerPoint template are Pink, White, Gray. PowerPoint presentation experts tell us our 8 stages diverging arrows organizational workflow model ppt Charts and PowerPoint Slides will make the presenter look like a pro even if they are not computer savvy. The feedback we get is that our Graph PowerPoint templates and PPT Slides provide you with a vast range of viable options. Select the appropriate ones and just fill in your text.

Colorful Diverging Of 5 Processes Linear Flow Charts And Networks PowerPoint Templates
We present our colorful diverging of 5 processes linear flow Charts and Networks PowerPoint templates.Download and present our Arrows PowerPoint Templates because there are a bucketful of brilliant ideas swirling around within your group. Present our Marketing PowerPoint Templates because you have a handle on all the targets, a master of the game, the experienced and consummate juggler. Use our Shapes PowerPoint Templates because you have a great training programme in mind to upgrade the skills of your staff. Use our Success PowerPoint Templates because you have come up with a brilliant breakthrough idea. you can also visualise the interest it will generate. Present our Flow Charts PowerPoint Templates because the atmosphere in the worplace is electric.Use these PowerPoint slides for presentations relating to abstract, array, background, beautiful, board, child, cluster, color, colorful, data, divergent, dream, fashion, fate, flower, future, group, illustration, information, isolated, matrix, music, paint, pop, round, server, style, toy, wheel. The prominent colors used in the PowerPoint template are Blue, Red, Purple. Customers tell us our colorful diverging of 5 processes linear flow Charts and Networks PowerPoint templates are Wistful. PowerPoint presentation experts tell us our cluster PowerPoint templates and PPT Slides are Vintage. People tell us our colorful diverging of 5 processes linear flow Charts and Networks PowerPoint templates are Festive. People tell us our background PowerPoint templates and PPT Slides are Bright. Customers tell us our colorful diverging of 5 processes linear flow Charts and Networks PowerPoint templates are Nifty. People tell us our cluster PowerPoint templates and PPT Slides are Ritzy.
Web Analytics Icons Computer Screen With Data Charts Ppt PowerPoint Presentation Ideas Outline
This is a web analytics icons computer screen with data charts ppt powerpoint presentation ideas outline. This is a four stage process. The stages in this process are digital analytics, digital dashboard, marketing.

Information Technology Expenditure Summary Dashboard Ppt PowerPoint Presentation Diagram Graph Charts PDF
The following slide showcases the cyber security expense overview to better allocate budget. It includes elements such as IT cost, revenue, security incidents, services down, issue status summary, total business hours lost etc. This Information Technology Expenditure Summary Dashboard Ppt PowerPoint Presentation Diagram Graph Charts PDF from Slidegeeks makes it easy to present information on your topic with precision. It provides customization options, so you can make changes to the colors, design, graphics, or any other component to create a unique layout. It is also available for immediate download, so you can begin using it right away. Slidegeeks has done good research to ensure that you have everything you need to make your presentation stand out. Make a name out there for a brilliant performance.

Comparison Of Social Media Platforms To Run Online Ads Ppt PowerPoint Presentation Diagram Graph Charts PDF
This slide showcases comparative assessment of social media channels which can help marketers to identify ideal platform for running ad campaigns. Its key components are platform, worldwide users, user demographics, B2B and B2C Slidegeeks is here to make your presentations a breeze with Comparison Of Social Media Platforms To Run Online Ads Ppt PowerPoint Presentation Diagram Graph Charts PDF With our easy to use and customizable templates, you can focus on delivering your ideas rather than worrying about formatting. With a variety of designs to choose from, you are sure to find one that suits your needs. And with animations and unique photos, illustrations, and fonts, you can make your presentation pop. So whether you are giving a sales pitch or presenting to the board, make sure to check out Slidegeeks first.

Gold Charts With Copy Space Marketing PowerPoint Themes And PowerPoint Slides 0311
Microsoft PowerPoint Theme and Slide with gold charts

Gold Charts With Copy Space Marketing PowerPoint Templates And PowerPoint Backgrounds 0311
Microsoft PowerPoint Template and Background with gold charts
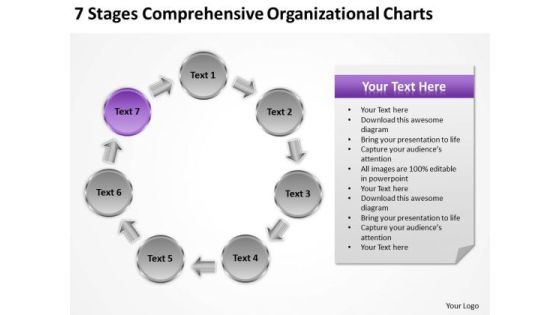
Stages Comprehensive Organizational Charts Ppt Putting Business Plan Together PowerPoint Slides
We present our stages comprehensive organizational charts ppt putting business plan together PowerPoint Slides.Present our Circle Charts PowerPoint Templates because You can Score a slam dunk with our PowerPoint Templates and Slides. Watch your audience hang onto your every word. Download our Arrows PowerPoint Templates because Our PowerPoint Templates and Slides will let you Clearly mark the path for others to follow. Present our Shapes PowerPoint Templates because Our PowerPoint Templates and Slides will provide you the cutting edge. Slice through the doubts in the minds of your listeners. Use our Business PowerPoint Templates because It will let you Set new benchmarks with our PowerPoint Templates and Slides. They will keep your prospects well above par. Present our Process and Flows PowerPoint Templates because Our PowerPoint Templates and Slides will provide weight to your words. They will bring out the depth of your thought process.Use these PowerPoint slides for presentations relating to administrative, analyze, arrow, blue, business, button, change, charter, company, concept, conceptual, control, corporate, design, development, dmaic, enterprise, focus, improve, improvement, industry, information, informative, label, lean, management, manufacturing, measure, measurement, message, methodology, office, performance, process, productive, productivity, profitability, project, quality, sigma, six, symbol, text, words. The prominent colors used in the PowerPoint template are Blue, Gray, Black.
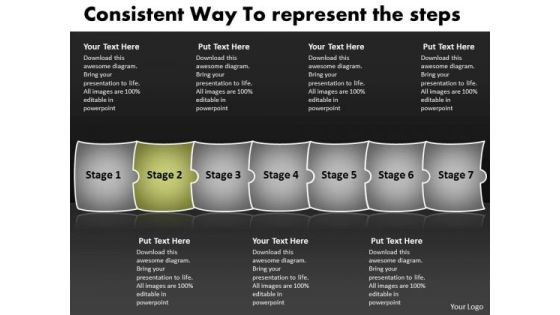
Consistent Way To Represent The Steps Business Flow Charts PowerPoint Slides
We present our consistent way to represent the steps business flow charts PowerPoint Slides.Use our Marketing PowerPoint Templates because,To achieve sureshot success you need to come together at the right time, place and manner. Use our Success PowerPoint Templates because,Your quest has taken you well onto the path of success. Use our Business PowerPoint Templates because,A lot of dissimilar elements needing to gel to strike the deal. Use our Process and Flows PowerPoint Templates because,you can Break it all down to Key Result Areas. Use our Abstract PowerPoint Templates because,It have all to represent to your viewers.Use these PowerPoint slides for presentations relating to Abstract, Arrow, Arrows, Business, Chart, Design, Development, Diagram, Direction, Element, Flow, Flowchart, Graph, Linear, Management, Model, Motion, Organization, Plan, Process, Program, Section, Segment, Set, Sign, Solution, Strategy, Symbol, Technology. The prominent colors used in the PowerPoint template are Green, Gray, White

Business Charts Presenting Pie Marketing PowerPoint Templates Ppt Backgrounds For Slides
We present our business charts presenting pie marketing PowerPoint templates PPT backgrounds for slides.Present our Finance PowerPoint Templates because Our PowerPoint Templates and Slides offer you the widest possible range of options. Present our Business PowerPoint Templates because you can Break through with our PowerPoint Templates and Slides. Bring down the mental barriers of your audience. Use our Success PowerPoint Templates because Your ideas provide food for thought. Our PowerPoint Templates and Slides will help you create a dish to tickle the most discerning palate. Download and present our Marketing PowerPoint Templates because Timeline crunches are a fact of life. Meet all deadlines using our PowerPoint Templates and Slides. Use our Arrows PowerPoint Templates because Our PowerPoint Templates and Slides will give you great value for your money. Be assured of finding the best projection to highlight your words. Use these PowerPoint slides for presentations relating to 3d, Arrow, Business, Businessman, Cartoon, Character, Chart, Concept, Corporate, Data, Development, Diagram, Display, Figure, Finance, Financial, Graph, Graphic, Green, Growth, Guy, Human, Icon, Idea, Illustration, Information, Investment, Isolated, Market, Marketing, Men, Office, Part, People, Person, Pie, Presentation, Professional, Progress, Red, Reflection, Report, Shape, Shiny, Sign, Success. The prominent colors used in the PowerPoint template are Green, Red, White. Presenters tell us our business charts presenting pie marketing PowerPoint templates PPT backgrounds for slides are designed to make your presentations professional. PowerPoint presentation experts tell us our Concept PowerPoint templates and PPT Slides are topically designed to provide an attractive backdrop to any subject. Professionals tell us our business charts presenting pie marketing PowerPoint templates PPT backgrounds for slides are designed by a team of presentation professionals. People tell us our Concept PowerPoint templates and PPT Slides are designed by a team of presentation professionals. The feedback we get is that our business charts presenting pie marketing PowerPoint templates PPT backgrounds for slides help you meet deadlines which are an element of today's workplace. Just browse and pick the slides that appeal to your intuitive senses. Customers tell us our Chart PowerPoint templates and PPT Slides provide you with a vast range of viable options. Select the appropriate ones and just fill in your text.
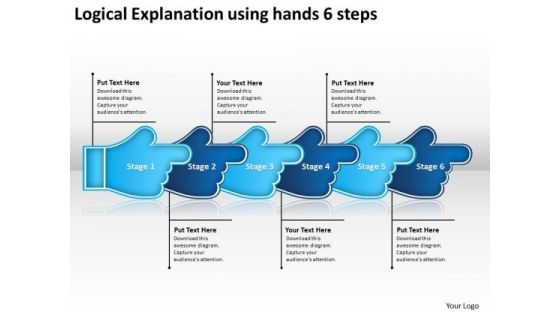
Logical Explanation Using Hands 6 Steps Sample Process Flow Charts PowerPoint Slides
We present our logical explanation using hands 6 steps sample process flow charts PowerPoint Slides. Use our Symbol PowerPoint Templates because, Leadership Template:- Show them the way, be Captain of the ship and lead them to new shores. Use our Business PowerPoint Templates because, Marketing Strategy Business Template:- maximizing sales of your product is the intended destination. Use our Metaphor PowerPoint Templates because, Amplify on your views and plans for getting ahead and then the manner in which you intend staying ahead. Use our Abstract PowerPoint Templates because; Refine them all as you take them through the numerous filtering stages of the funnel of your quality control process. Use our Process and Flows PowerPoint Templates because, one pushes the other till it all comes back full circle. Use these PowerPoint slides for presentations relating to Collinear, Description using hands steps, Business, Collection, Connection, Cursor, Decoration, Design, Dimensional, Direction, Element, Icon, Illustration, Information, Modern, Motion, Paper, Perspective, Plastic, Pointer, Pointing, Process, Recycle, Recycling, Reflective, Set, Shape, Shiny, Sign, Symbol, Technology. The prominent colors used in the PowerPoint template are Blue, Blue navy, Gray
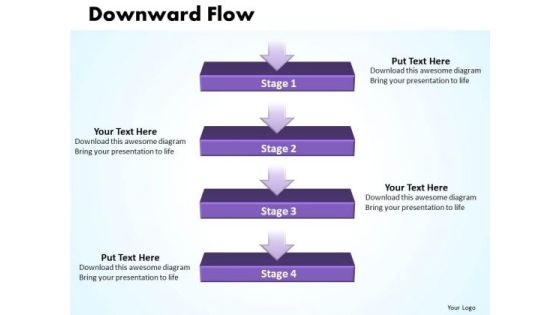
Ppt Linear Flow Process Charts 4 Power Point Stage PowerPoint Templates
PPT linear flow process charts 4 power point stage PowerPoint Templates-This Four State Diagram is a significant modeling technique for analyzing and constructing information processes.-PPT linear flow process charts 4 power point stage PowerPoint Templates-Advertise, Advertisement, Badge, Box, Business, Card, Collection, Column, Corporate, Costing, Counting, Design, Discount, Element, Featured, Finance, Grid, Hosting, Information, List, Message, Placard, Plan, Price, Pricing, Rectangle, Report, Round
HR Services Icon With Analytics Technology And Charts Ppt Outline Demonstration
Showcasing this set of slides titled hr services icon with analytics technology and charts ppt outline demonstration. The topics addressed in these templates are hr services icon with analytics technology and charts. All the content presented in this PPT design is completely editable. Download it and make adjustments in color, background, font etc. as per your unique business setting.

Data Flow Charts For Social Media Application Icons Ppt PowerPoint Presentation Gallery Slide Portrait PDF
Presenting Data Flow Charts For Social Media Application Icons Ppt PowerPoint Presentation Gallery Slide Portrait PDF to dispense important information. This template comprises three stages. It also presents valuable insights into the topics including Data Flow Charts, Social Media Application, Icons. This is a completely customizable PowerPoint theme that can be put to use immediately. So, download it and address the topic impactfully.
Sales Performance Report With Charts And Graphs Ppt PowerPoint Presentation Icon Master Slide PDF
Presenting sales performance report with charts and graphs ppt powerpoint presentation icon master slide pdf to dispense important information. This template comprises three stages. It also presents valuable insights into the topics including sales performance report with charts and graphs. This is a completely customizable PowerPoint theme that can be put to use immediately. So, download it and address the topic impactfully.
Mobile Tab Icon With Business Charts And Reports Ppt PowerPoint Presentation Slides Example File PDF
Presenting mobile tab icon with business charts and reports ppt powerpoint presentation slides example file pdf to dispense important information. This template comprises three stages. It also presents valuable insights into the topics including mobile tab icon with business charts and reports. This is a completely customizable PowerPoint theme that can be put to use immediately. So, download it and address the topic impactfully.
Financial Reports And Charts On Computer Screen Vector Icon Microsoft PDF
Presenting financial reports and charts on computer screen vector icon microsoft pdf to dispense important information. This template comprises three stages. It also presents valuable insights into the topics including financial reports and charts on computer screen vector icon. This is a completely customizable PowerPoint theme that can be put to use immediately. So, download it and address the topic impactfully.

Computer Screen With Business Data Charts Ppt Powerpoint Presentation Show Vector
This is a computer screen with business data charts ppt powerpoint presentation show vector. This is a four stage process. The stages in this process are business metrics, business kpi, business dashboard.

Data Statistics Charts And Key Performance Indicators Ppt Powerpoint Presentation Layouts Guide
This is a data statistics charts and key performance indicators ppt powerpoint presentation layouts guide. This is a four stage process. The stages in this process are business metrics, business kpi, business dashboard.
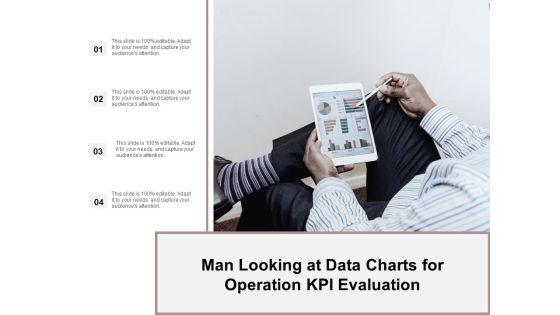
Man Looking At Data Charts For Operation Kpi Evaluation Ppt Powerpoint Presentation Ideas Demonstration
This is a man looking at data charts for operation kpi evaluation ppt powerpoint presentation ideas demonstration. This is a four stage process. The stages in this process are business metrics, business kpi, business dashboard.
HR Services Icon With Analytics Technology And Charts Ppt PowerPoint Presentation Inspiration Format Ideas PDF
Pitch your topic with ease and precision using this hr services icon with analytics technology and charts ppt powerpoint presentation inspiration format ideas pdf. This layout presents information on hr services icon with analytics technology and charts. It is also available for immediate download and adjustment. So, changes can be made in the color, design, graphics or any other component to create a unique layout.
Finance Team With Data Charts Vector Icon Ppt PowerPoint Presentation Summary Microsoft PDF
Persuade your audience using this finance team with data charts vector icon ppt powerpoint presentation summary microsoft pdf. This PPT design covers three stages, thus making it a great tool to use. It also caters to a variety of topics including finance team with data charts vector icon. Download this PPT design now to present a convincing pitch that not only emphasizes the topic but also showcases your presentation skills.

Business Circle Charts PowerPoint Templates Business Enterprise Resource Planning Ppt Slides
Business Circle Charts PowerPoint Templates Business Enterprise Resource Planning PPT Slides-A wonderful graphics to make a PowerPoint presentation on Enterprise Resource Planning-Business Circle Charts PowerPoint Templates Business Enterprise Resource Planning PPT Slides-This template can be used for presentations relating to 3d, Arrow, Blueprint, Business, Circle, Cleverness, Commerce, Company, Competence, Concept, Constructive, Corporate, Create, Creative, Creativity, Decision, Design, Develop, Device, Discover, Earn, Enterprise, Finance, Goal, Idea, Imaginative, Ingenious, Innovative, Inspiration, Inspire, Inventive, Job, Management, Market
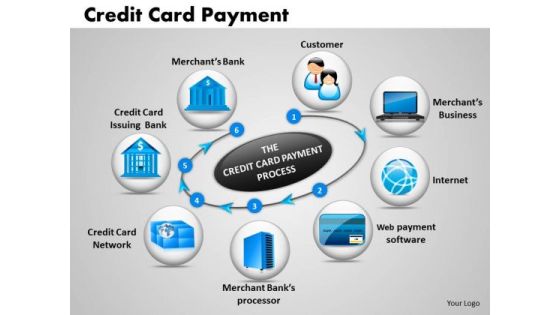
Business Circle Charts PowerPoint Templates Business Credit Card Payment Ppt Slides
Business Circle Charts PowerPoint Templates Business Credit Card Payment PPT Slides-This PowerPoint diagram shows Circles representing related points in an idea. You can also use it as credit card payment slide-Business Circle Charts PowerPoint Templates Business Credit Card Payment PPT Slides-This template can be used for presentations relating to Account, Bank, Business, Buy, Buying, Cards, Cash, Chips, Close-Up, Commerce, Credit, Credits, Date, Ecommerce, Expiration, Expire, Expired, Finance, Financial, Gold, Limit, Macro, Master, Money, Now, Online, Order, Paid, Pay, Paying, Payment
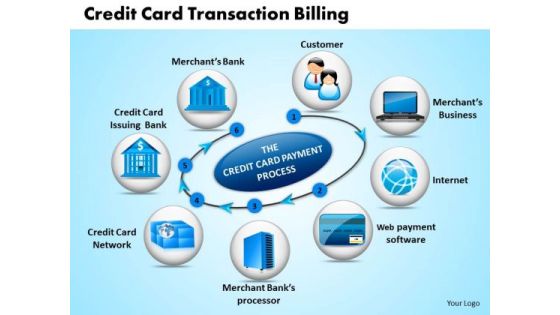
Business Circle Charts PowerPoint Templates Business Credit Card Transaction Billing Ppt Slides
Business Circle Charts PowerPoint Templates Business credit card transaction billing PPT Slides-This PowerPoint diagram shows Circles representing related points in an idea. You can also use it as credit card transaction slide-Business Circle Charts PowerPoint Templates Business credit card transaction billing PPT Slides-This template can be used for presentations relating to Account, Bank, Business, Buy, Buying, Cards, Cash, Chips, Close-Up, Commerce, Credit, Credits, Date, Ecommerce, Expiration, Expire, Expired, Finance, Financial, Gold, Limit, Macro, Master, Money, Now, Online, Order, Paid, Pay, Paying, Payment

Business Circle Charts PowerPoint Templates Business Periodic Table Of Elements Ppt Slides
Business Circle Charts PowerPoint Templates Business periodic table of elements PPT Slides-Use this graphic to represent a continuing sequence of stages, tasks, or events in a circular flow and emphasize the connection between all components. -Business Circle Charts PowerPoint Templates Business periodic table of elements PPT Slides-This template can be used for presentations relating to Actinoids, Atom, Atomic, Chemistry, Electrons, Element, Helium, Hydrogen, Lanthanoids, Liquid, Molecule, Noble, Periodic, Physics, Plutonium, Quantum, Radium, Science, Scientific, Solid, Symbol, Table

Graphical Representation Of Research IT Google Charts Tool For Data Visualization Introduction PDF
This slide depicts google charts as the tool for data visualization, which can extract data from various sources, including SQL, databases, google sheets. This is a graphical representation of research it google charts tool for data visualization introduction pdf template with various stages. Focus and dispense information on five stages using this creative set, that comes with editable features. It contains large content boxes to add your information on topics like dynamic, databases, sources, technology. You can also showcase facts, figures, and other relevant content using this PPT layout. Grab it now.
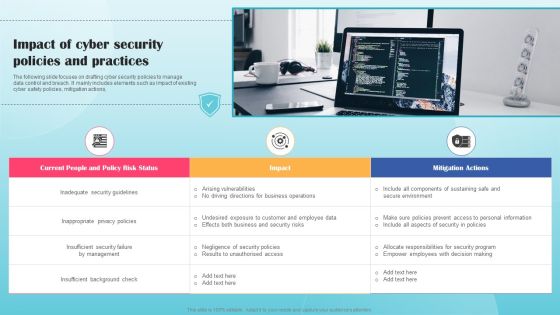
Impact Of Cyber Security Policies And Practices Ppt PowerPoint Presentation Diagram Graph Charts PDF
The following slide focuses on drafting cyber security policies to manage data control and breach. It mainly includes elements such as impact of existing cyber safety policies, mitigation actions, Presenting this PowerPoint presentation, titled Impact Of Cyber Security Policies And Practices Ppt PowerPoint Presentation Diagram Graph Charts PDF, with topics curated by our researchers after extensive research. This editable presentation is available for immediate download and provides attractive features when used. Download now and captivate your audience. Presenting this Impact Of Cyber Security Policies And Practices Ppt PowerPoint Presentation Diagram Graph Charts PDF. Our researchers have carefully researched and created these slides with all aspects taken into consideration. This is a completely customizable Impact Of Cyber Security Policies And Practices Ppt PowerPoint Presentation Diagram Graph Charts PDF that is available for immediate downloading. Download now and make an impact on your audience. Highlight the attractive features available with our PPTs.

Departments Of Visualization Research Google Charts Tool For Data Visualization Themes PDF
This slide depicts google charts as the tool for data visualization, which can extract data from various sources, including SQL, databases, google sheets.This is a Departments Of Visualization Research Google Charts Tool For Data Visualization Themes PDF template with various stages. Focus and dispense information on five stages using this creative set, that comes with editable features. It contains large content boxes to add your information on topics like Popular Free Alternative, Create Dynamic Data, Including SQL Databases You can also showcase facts, figures, and other relevant content using this PPT layout. Grab it now.

Branches For Visualization Research And Development Google Charts Tool For Data Elements PDF
This slide depicts google charts as the tool for data visualization, which can extract data from various sources, including SQL, databases, google sheets. Do you have an important presentation coming up Are you looking for something that will make your presentation stand out from the rest Look no further than Branches For Visualization Research And Development Google Charts Tool For Data Elements PDF. With our professional designs, you can trust that your presentation will pop and make delivering it a smooth process. And with Slidegeeks, you can trust that your presentation will be unique and memorable. So why wait Grab Branches For Visualization Research And Development Google Charts Tool For Data Elements PDF today and make your presentation stand out from the rest.
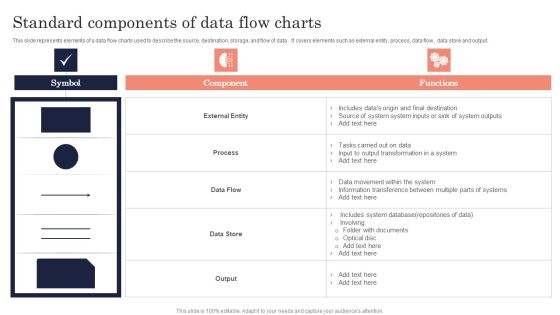
Standard Components Of Data Flow Charts Ppt PowerPoint Presentation File Pictures PDF
this slide represents elements of a data flow charts used to describe the source, destination, storage, and flow of data. it covers elements such as external entity, process, data flow, data store and output. Showcasing this set of slides titled Standard Components Of Data Flow Charts Ppt PowerPoint Presentation File Pictures PDF. The topics addressed in these templates are Symbol, Component, Functions. All the content presented in this PPT design is completely editable. Download it and make adjustments in color, background, font etc. as per your unique business setting.

7 Stages Diverging Arrows Schematic Diagram Charts And Networks PowerPoint Slides
We present our 7 stages diverging arrows schematic diagram Charts and Networks PowerPoint Slides.Download and present our Marketing PowerPoint Templates because different personalities, different abilities but formidable together. Download and present our Shapes PowerPoint Templates because you have to coordinate and motivate your team. Download and present our Arrows PowerPoint Templates because our templates illustrates your ability. Download and present our Business PowerPoint Templates because everybody knows The world over it is a priority for many. Along with it there are so many oppurtunities waiting to be utilised. Use our Process and Flows PowerPoint Templates because they pinpoint the core values of your organisation.Use these PowerPoint slides for presentations relating to Arrows, Business, Chart, Cyclic, Data, Diagram, Financial, Goal, Graph, Illustration, Info, Information, Marketing, Model, Option, Part, Pie, Presentation, Process, Result, Sphere, Statistics. The prominent colors used in the PowerPoint template are White, Gray, Black. The feedback we get is that our 7 stages diverging arrows schematic diagram Charts and Networks PowerPoint Slides help you meet deadlines which are an element of today's workplace. Just browse and pick the slides that appeal to your intuitive senses. People tell us our Data PowerPoint templates and PPT Slides are Cheerful. Presenters tell us our 7 stages diverging arrows schematic diagram Charts and Networks PowerPoint Slides look good visually. Use our Data PowerPoint templates and PPT Slides are Wonderful. Use our 7 stages diverging arrows schematic diagram Charts and Networks PowerPoint Slides are Youthful. Use our Diagram PowerPoint templates and PPT Slides are Upbeat.

7 Stages Diverging Arrows Schematic Diagram Ppt Charts And Networks PowerPoint Slide
We present our 7 stages diverging arrows schematic diagram ppt Charts and Networks PowerPoint Slide.Use our Marketing PowerPoint Templates because you can Break it all down to Key Result Areas. Use our Shapes PowerPoint Templates because this diagram is designed to help your audience to develop their thoughts along the way. Use our Arrows PowerPoint Templates because this slide illuminates the spiritual brilliance of Jesus and showers the love for mankind he showed even while being crucified. Use our Business PowerPoint Templates because you can Lead your flock steadily to greater heights. Look around at the vast potential of achievement around you. Use our Process and Flows PowerPoint Templates because you can Highlight the key components of your entire manufacturing/ business process.Use these PowerPoint slides for presentations relating to Arrows, Business, Chart, Cyclic, Data, Diagram, Financial, Goal, Graph, Illustration, Info, Information, Marketing, Model, Option, Part, Pie, Presentation, Process, Result, Sphere, Statistics. The prominent colors used in the PowerPoint template are Blue, Gray, Black. The feedback we get is that our 7 stages diverging arrows schematic diagram ppt Charts and Networks PowerPoint Slide are Fashionable. People tell us our Data PowerPoint templates and PPT Slides are Perfect. Presenters tell us our 7 stages diverging arrows schematic diagram ppt Charts and Networks PowerPoint Slide will make the presenter successul in his career/life. Use our Goal PowerPoint templates and PPT Slides are Bold. Use our 7 stages diverging arrows schematic diagram ppt Charts and Networks PowerPoint Slide are Spiffy. Use our Financial PowerPoint templates and PPT Slides are Functional.
Icons Deploying Digital Twin Technology To Enhance Operational Efficiency Ppt PowerPoint Presentation Diagram Graph Charts PDF
Introducing our well designed Icons Deploying Digital Twin Technology To Enhance Operational Efficiency Ppt PowerPoint Presentation Diagram Graph Charts PDF set of slides. The slide displays editable icons to enhance your visual presentation. The icons can be edited easily. So customize according to your business to achieve a creative edge. Download and share it with your audience.

7 Stages Diverging Arrows Schematic Diagram Charts And Networks PowerPoint Slide
We present our 7 stages diverging arrows schematic diagram Charts and Networks PowerPoint Slide.Download our Marketing PowerPoint Templates because you can Be the cynosure of all eyes with our template depicting . Use our Shapes PowerPoint Templates because you know your business and have a vision for it. Present our Arrows PowerPoint Templates because you have the process in your head, our template design showing will illuminate your thoughts. Use our Business PowerPoint Templates because profit levels have been steady over the recent past. Spread your heightened excitement to others in the room. Use our Process and Flows PowerPoint Templates because this diagram depicts the essence of this chain reaction like sequence of events.Use these PowerPoint slides for presentations relating to Arrows, Business, Chart, Cyclic, Data, Diagram, Financial, Goal, Graph, Illustration, Info, Information, Marketing, Model, Option, Part, Pie, Presentation, Process, Result, Sphere, Statistics. The prominent colors used in the PowerPoint template are Green, Gray, Black. The feedback we get is that our 7 stages diverging arrows schematic diagram Charts and Networks PowerPoint Slide are Handsome. People tell us our Diagram PowerPoint templates and PPT Slides will help you be quick off the draw. Just enter your specific text and see your points hit home. Presenters tell us our 7 stages diverging arrows schematic diagram Charts and Networks PowerPoint Slide are Precious. Use our Diagram PowerPoint templates and PPT Slides are Beautiful. Use our 7 stages diverging arrows schematic diagram Charts and Networks PowerPoint Slide are Nifty. Use our Diagram PowerPoint templates and PPT Slides are Exuberant.

Marketing Mix For Global Expansion Ppt PowerPoint Presentation Diagram Graph Charts PDF
This slide showcases marketing mix that can help organization to plan and manage promotion for global expansion. Its key elements are product, price, place and promotion.If you are looking for a format to display your unique thoughts, then the professionally designed Marketing Mix For Global Expansion Ppt PowerPoint Presentation Diagram Graph Charts PDF is the one for you. You can use it as a Google Slides template or a PowerPoint template. Incorporate impressive visuals, symbols, images, and other charts. Modify or reorganize the text boxes as you desire. Experiment with shade schemes and font pairings. Alter, share or cooperate with other people on your work. Download Marketing Mix For Global Expansion Ppt PowerPoint Presentation Diagram Graph Charts PDF and find out how to give a successful presentation. Present a perfect display to your team and make your presentation unforgettable.

Overview Of Non Fungible Tokens Ppt PowerPoint Presentation Diagram Graph Charts PDF
This slide depicts the overview of non-fungible tokens these are secure tokens that confirm the ownership of one-of-a-kind goods as a blockchain asset. If you are looking for a format to display your unique thoughts, then the professionally designed Overview Of Non Fungible Tokens Ppt PowerPoint Presentation Diagram Graph Charts PDF is the one for you. You can use it as a Google Slides template or a PowerPoint template. Incorporate impressive visuals, symbols, images, and other charts. Modify or reorganize the text boxes as you desire. Experiment with shade schemes and font pairings. Alter, share or cooperate with other people on your work. Download Overview Of Non Fungible Tokens Ppt PowerPoint Presentation Diagram Graph Charts PDF and find out how to give a successful presentation. Present a perfect display to your team and make your presentation unforgettable.
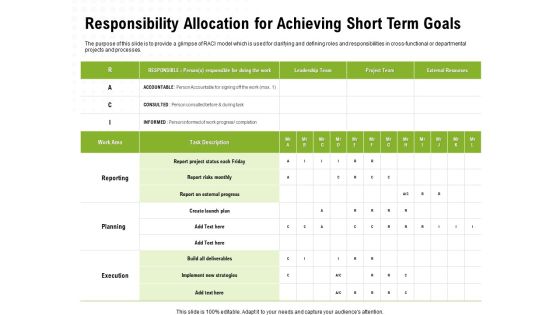
Strategic Growth Technique Responsibility Allocation For Achieving Short Term Goals Ppt Diagram Graph Charts PDF
Presenting this set of slides with name strategic growth technique responsibility allocation for achieving short term goals ppt diagram graph charts pdf. The topics discussed in these slides are implement, strategies, leadership team, external resources. This is a completely editable PowerPoint presentation and is available for immediate download. Download now and impress your audience.

Business Charts PowerPoint Templates 4 Reasons You Should Buy From Circular Process Tables Sales
Business Charts PowerPoint templates 4 reasons you should buy from circular process tables Sales-This PowerPoint Diagram consists of four animated Process tables of Different Colors. It can be used to symbolize four different Approaches or four distinct techniques. It consists of single color slide as well. This diagram will fit for Business Presentations.

New Technology Adoption Curve Charts Ppt PowerPoint Presentation Inspiration Structure PDF
Pitch your topic with ease and precision using this new technology adoption curve charts ppt powerpoint presentation inspiration structure pdf. This layout presents information on new technology, adoption curve, abandonment of current technology. It is also available for immediate download and adjustment. So, changes can be made in the color, design, graphics or any other component to create a unique layout.

3d Homogeneous Puzzle Flow 6 Issue How To Make Charts PowerPoint Templates
We present our 3d homogeneous puzzle flow 6 issues how to make charts PowerPoint templates. Use our Business PowerPoint Templates because, Vision Ave Future St Template: - There was a vision of a desired destination and the best road to take to reach that goal. Use our Puzzles or Jigsaws PowerPoint Templates because, and keep you group steady in the top bracket. Use our Shapes PowerPoint Templates because, this one depicts the popular chart. Use our Communication PowerPoint Templates because; Break it all down to Key Result Areas. Use our Process and Flows PowerPoint Templates because, Our Template designs are State of the Art. Use these PowerPoint slides for presentations relating to abstract, action, attach, box, business, center, chain, chart, color, communication, concept, connection, cube, cycle, data, diagram, flow, globe, horizontal, idea, illustration, individual, information, interaction, jigsaw, join pieces, process puzzle, relationship, shape, success. The prominent colors used in the PowerPoint template are Blue, Gray, and Black
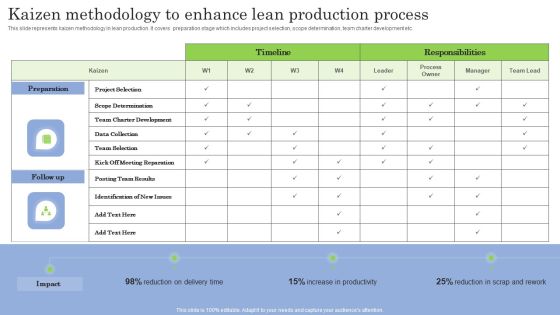
Kaizen Methodology To Enhance Lean Production Process Ppt PowerPoint Presentation Diagram Graph Charts PDF
This slide represents kaizen methodology in lean production. It covers preparation stage which includes project selection, scope determination, team charter development etc. Crafting an eye catching presentation has never been more straightforward. Let your presentation shine with this tasteful yet straightforward Kaizen Methodology To Enhance Lean Production Process Ppt PowerPoint Presentation Diagram Graph Charts PDF template. It offers a minimalistic and classy look that is great for making a statement. The colors have been employed intelligently to add a bit of playfulness while still remaining professional. Construct the ideal Kaizen Methodology To Enhance Lean Production Process Ppt PowerPoint Presentation Diagram Graph Charts PDF that effortlessly grabs the attention of your audience. Begin now and be certain to wow your customers.

Agenda Strategic FM Services Ppt PowerPoint Presentation Diagram Graph Charts PDF
Find a pre designed and impeccable Agenda Strategic FM Services Ppt PowerPoint Presentation Diagram Graph Charts PDF. The templates can ace your presentation without additional effort. You can download these easy to edit presentation templates to make your presentation stand out from others. So, what are you waiting for Download the template from Slidegeeks today and give a unique touch to your presentation.

Lady Plucking Flowers From Agriculture Farm Ppt PowerPoint Presentation Diagram Graph Charts PDF
Presenting this set of slides with name lady plucking flowers from agriculture farm ppt powerpoint presentation diagram graph charts pdf. This is a one stage process. The stage in this process is lady plucking flowers from agriculture farm. This is a completely editable PowerPoint presentation and is available for immediate download. Download now and impress your audience.

How Big Data Is Stored And Processe Ppt PowerPoint Presentation Diagram Graph Charts PDF
Presenting How Big Data Is Stored And Processe Ppt PowerPoint Presentation Diagram Graph Charts PDF to provide visual cues and insights. Share and navigate important information on four stages that need your due attention. This template can be used to pitch topics like Relational Databases, Big Data, Cloud Solutions. In addtion, this PPT design contains high resolution images, graphics, etc, that are easily editable and available for immediate download.
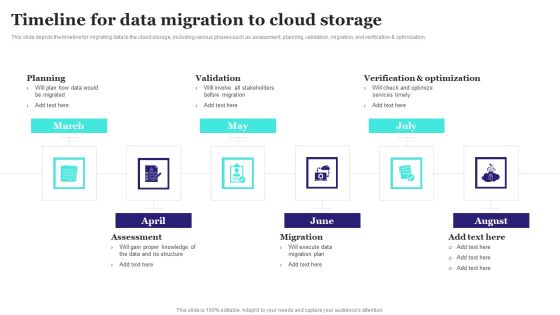
Timeline For Data Migration To Cloud Storage Ppt PowerPoint Presentation Diagram Graph Charts PDF
This slide depicts the timeline for migrating data to the cloud storage, including various phases such as assessment, planning, validation, migration, and verification and optimization. Do you have an important presentation coming up Are you looking for something that will make your presentation stand out from the rest Look no further than Timeline For Data Migration To Cloud Storage Ppt PowerPoint Presentation Diagram Graph Charts PDF. With our professional designs, you can trust that your presentation will pop and make delivering it a smooth process. And with Slidegeeks, you can trust that your presentation will be unique and memorable. So why wait Grab Timeline For Data Migration To Cloud Storage Ppt PowerPoint Presentation Diagram Graph Charts PDF today and make your presentation stand out from the rest.

7 Stages Diverging Arrows Schematic Diagram Ppt Charts And Networks PowerPoint Slides
We present our 7 stages diverging arrows schematic diagram ppt Charts and Networks PowerPoint Slides.Download our Marketing PowerPoint Templates because Our PowerPoint Templates and Slides are Clear and concise. Use them and dispel any doubts your team may have. Download and present our Shapes PowerPoint Templates because You can Connect the dots. Fan expectations as the whole picture emerges. Present our Arrows PowerPoint Templates because this Slide offers an excellent background to build up the various stages of your business process. Use our Business PowerPoint Templates because you have analysed many global markets and come up with possibilities. Highlight the pros and cons of other likely business oppurtunities. Download and present our Process and Flows PowerPoint Templates because spreading the light of knowledge around you will clear the doubts and enlighten the questioning minds with your brilliance and ability.Use these PowerPoint slides for presentations relating to Arrows, Business, Chart, Cyclic, Data, Diagram, Financial, Goal, Graph, Illustration, Info, Information, Marketing, Model, Option, Part, Pie, Presentation, Process, Result, Sphere, Statistics. The prominent colors used in the PowerPoint template are Yellow, Gray, Black. The feedback we get is that our 7 stages diverging arrows schematic diagram ppt Charts and Networks PowerPoint Slides are Breathtaking. People tell us our Graph PowerPoint templates and PPT Slides are Splendid. Presenters tell us our 7 stages diverging arrows schematic diagram ppt Charts and Networks PowerPoint Slides are Functional. Use our Graph PowerPoint templates and PPT Slides will make the presenter successul in his career/life. Use our 7 stages diverging arrows schematic diagram ppt Charts and Networks PowerPoint Slides are visually appealing. Use our Graph PowerPoint templates and PPT Slides are Dynamic.
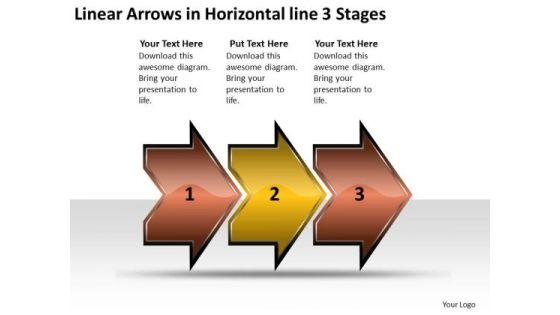
Linear Arrows Horizontal 3 Stages Sample Flow Charts Vision PowerPoint Slides
We present our linear arrows horizontal 3 stages sample flow charts vision PowerPoint Slides.Use our Arrows PowerPoint Templates because,It is Inspired by the indelible Olympic logo this graphic exemplifies the benefits of teamwork. Use our Shapes PowerPoint Templates because,You can blaze a brilliant trail from point to point. Use our Signs PowerPoint Templates because,You have configured your targets, identified your goals as per priority and importance. Use our Business PowerPoint Templates because,Everybody knows The world over it is a priority for many. Along with it there are so many oppurtunities waiting to be utilised Use our Process and Flows PowerPoint Templates because,Clarity of thought has been the key to your growth.Use these PowerPoint slides for presentations relating to abstract, arrow, arrows, business, chart, design, development, diagram, direction, element, flow, flowchart, graph, linear, management, model, motion, organization, plan, process, program, section, segment, set, sign, solution, strategy, symbol, technology. The prominent colors used in the PowerPoint template are Brown, Yellow, Black. People tell us our linear arrows horizontal 3 stages sample flow charts vision PowerPoint Slides are the best it can get when it comes to presenting. The feedback we get is that our arrows PowerPoint templates and PPT Slides provide you with a vast range of viable options. Select the appropriate ones and just fill in your text. People tell us our linear arrows horizontal 3 stages sample flow charts vision PowerPoint Slides are Ritzy. Presenters tell us our business PowerPoint templates and PPT Slides will make the presenter look like a pro even if they are not computer savvy. The feedback we get is that our linear arrows horizontal 3 stages sample flow charts vision PowerPoint Slides are Multicolored. Professionals tell us our design PowerPoint templates and PPT Slides are Elevated.
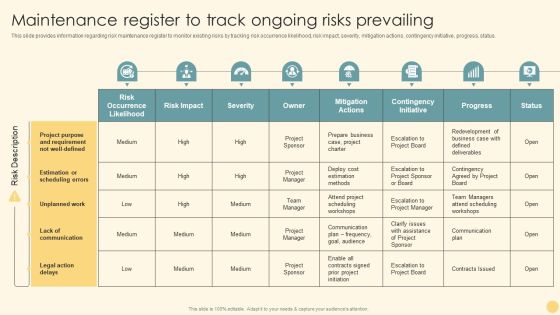
Maintenance Register To Track Ongoing Risks Prevailing Ppt PowerPoint Presentation Diagram Graph Charts PDF
This slide provides information regarding risk maintenance register to monitor existing risks by tracking risk occurrence likelihood, risk impact, severity, mitigation actions, contingency initiative, progress, status. Want to ace your presentation in front of a live audience Our Maintenance Register To Track Ongoing Risks Prevailing Ppt PowerPoint Presentation Diagram Graph Charts PDF can help you do that by engaging all the users towards you. Slidegeeks experts have put their efforts and expertise into creating these impeccable powerpoint presentations so that you can communicate your ideas clearly. Moreover, all the templates are customizable, and easy to edit and downloadable. Use these for both personal and commercial use.

Cost For Setting Billing System Structure Ppt PowerPoint Presentation Diagram Graph Charts PDF
Following slides provide information about total cost requirements to install and operate customer billing system. It include costs such as purchasing, implementing, maintaining, hiring, training etc. Crafting an eye catching presentation has never been more straightforward. Let your presentation shine with this tasteful yet straightforward Cost For Setting Billing System Structure Ppt PowerPoint Presentation Diagram Graph Charts PDF template. It offers a minimalistic and classy look that is great for making a statement. The colors have been employed intelligently to add a bit of playfulness while still remaining professional. Construct the ideal Cost For Setting Billing System Structure Ppt PowerPoint Presentation Diagram Graph Charts PDF that effortlessly grabs the attention of your audience. Begin now and be certain to wow your customers.
 Home
Home