Change Management Infographics
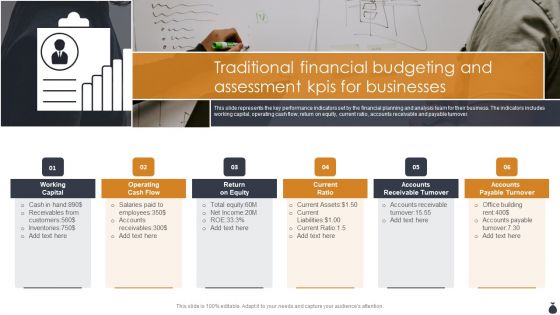
Traditional Financial Budgeting And Assessment Kpis For Businesses Infographics PDF
This slide represents the key performance indicators set by the financial planning and analysis team for their business. The indicators includes working capital, operating cash flow, return on equity, current ratio, accounts receivable and payable turnover. Presenting Traditional Financial Budgeting And Assessment Kpis For Businesses Infographics PDF to dispense important information. This template comprises six stages. It also presents valuable insights into the topics including Working Capital, Operating Cash Flow, Current Ratio. This is a completely customizable PowerPoint theme that can be put to use immediately. So, download it and address the topic impactfully.
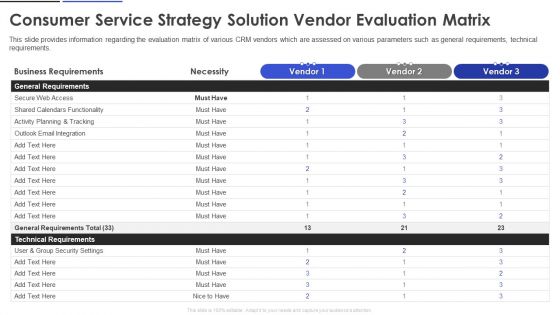
Consumer Service Strategy Solution Vendor Evaluation Matrix Infographics PDF
This slide provides information regarding the evaluation matrix of various CRM vendors which are assessed on various parameters such as general requirements, technical requirements. Deliver and pitch your topic in the best possible manner with this Consumer Service Strategy Solution Vendor Evaluation Matrix Infographics PDF. Use them to share invaluable insights on Secure Web Access, Technical Requirements, Business Requirements and impress your audience. This template can be altered and modified as per your expectations. So, grab it now.

Internal Organizational Communication Tools Comparison Matrix Infographics PDF
This slide showcases an internal workplace communication tools comparison assessment to choose the best tools for communication. It includes elements such as tools name, description, pros, cons and examples. Showcasing this set of slides titled Internal Organizational Communication Tools Comparison Matrix Infographics PDF. The topics addressed in these templates are Internal Newsletters, Instant Messaging, Intranet. All the content presented in this PPT design is completely editable. Download it and make adjustments in color, background, font etc. as per your unique business setting.
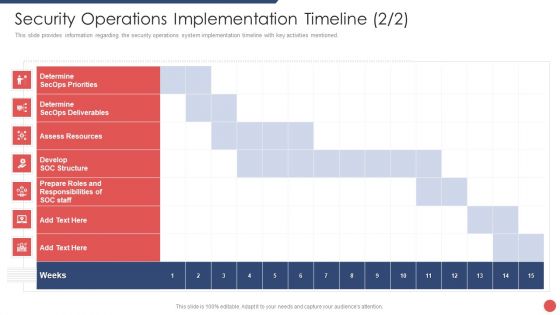
Security Functioning Centre Security Operations Implementation Timeline Infographics PDF
This slide provides information regarding the security operations system implementation timeline with key activities mentioned. Deliver and pitch your topic in the best possible manner with this security functioning centre security operations implementation timeline infographics pdf. Use them to share invaluable insights on assess resources, roles and responsibilities, priorities and impress your audience. This template can be altered and modified as per your expectations. So, grab it now.
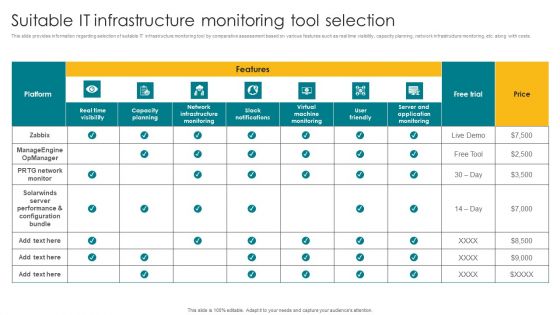
Suitable IT Infrastructure Monitoring Tool Selection Infographics PDF
This slide provides information regarding selection of suitable IT infrastructure monitoring tool by comparative assessment based on various features such as real time visibility, capacity planning, network infrastructure monitoring, etc. along with costs. Get a simple yet stunning designed Suitable IT Infrastructure Monitoring Tool Selection Infographics PDF. It is the best one to establish the tone in your meetings. It is an excellent way to make your presentations highly effective. So, download this PPT today from Slidegeeks and see the positive impacts. Our easy to edit Suitable IT Infrastructure Monitoring Tool Selection Infographics PDF can be your go to option for all upcoming conferences and meetings. So, what are you waiting for Grab this template today.
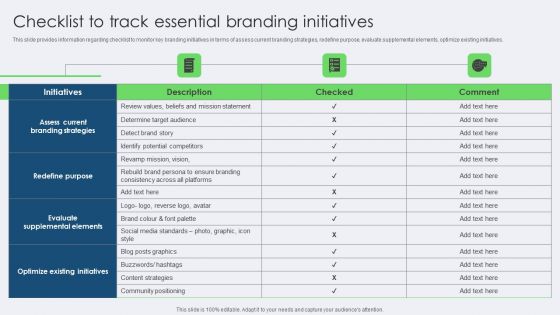
Checklist To Track Essential Branding Initiatives Infographics PDF
This slide provides information regarding checklist to monitor key branding initiatives in terms of assess current branding strategies, redefine purpose, evaluate supplemental elements, optimize existing initiatives. Do you have to make sure that everyone on your team knows about any specific topic I yes, then you should give Checklist To Track Essential Branding Initiatives Infographics PDF a try. Our experts have put a lot of knowledge and effort into creating this impeccable Checklist To Track Essential Branding Initiatives Infographics PDF. You can use this template for your upcoming presentations, as the slides are perfect to represent even the tiniest detail. You can download these templates from the Slidegeeks website and these are easy to edit. So grab these today.
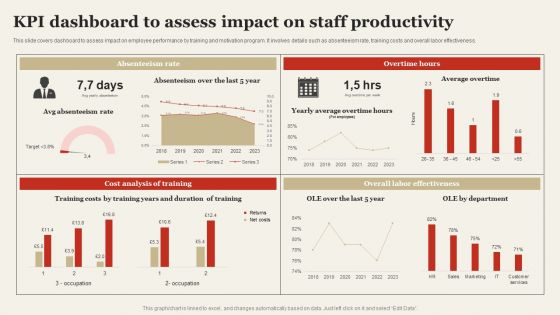
KPI Dashboard To Assess Impact On Staff Productivity Infographics PDF
This slide covers dashboard to assess impact on employee performance by training and motivation program. It involves details such as absenteeism rate, training costs and overall labor effectiveness. Make sure to capture your audiences attention in your business displays with our gratis customizable KPI Dashboard To Assess Impact On Staff Productivity Infographics PDF. These are great for business strategies, office conferences, capital raising or task suggestions. If you desire to acquire more customers for your tech business and ensure they stay satisfied, create your own sales presentation with these plain slides.

Failure Modes And Effects Responsible Technology Governance Manual Infographics Pdf
This slide provides information regarding failure modes and effects analysis overview FMEA as a responsible tech approach which aids designers and engineers in developing resilient systems. The approach is beneficial for technology developers, quality analysts, etc. Are you in need of a template that can accommodate all of your creative concepts This one is crafted professionally and can be altered to fit any style. Use it with Google Slides or PowerPoint. Include striking photographs, symbols, depictions, and other visuals. Fill, move around, or remove text boxes as desired. Test out color palettes and font mixtures. Edit and save your work, or work with colleagues. Download Failure Modes And Effects Responsible Technology Governance Manual Infographics Pdf and observe how to make your presentation outstanding. Give an impeccable presentation to your group and make your presentation unforgettable.

Target Market Assessment For Food Processing Company Infographics PDF
This slide covers target audience analysis of healthy food manufacturing company. It includes analysis details such as key demographics, psychographics, challenges, preferred channels, and preferred content type. Persuade your audience using this Target Market Assessment For Food Processing Company Infographics PDF. This PPT design covers five stages, thus making it a great tool to use. It also caters to a variety of topics including Key Psychographics, Preferred Channels, Key Demographics. Download this PPT design now to present a convincing pitch that not only emphasizes the topic but also showcases your presentation skills.

Manufacturing Product Quality Assessment With Scorecard Rating Infographics PDF
This slide provides a scorecard rating to evaluate the quality of a finished good of a manufacturing industry. It provides score to the product on the basis of surface finish, preservative application, product packaging and labelling etc. Showcasing this set of slides titled Manufacturing Product Quality Assessment With Scorecard Rating Infographics PDF. The topics addressed in these templates are Characteristics, Preservative Application, Product Labeling. All the content presented in this PPT design is completely editable. Download it and make adjustments in color, background, font etc. as per your unique business setting
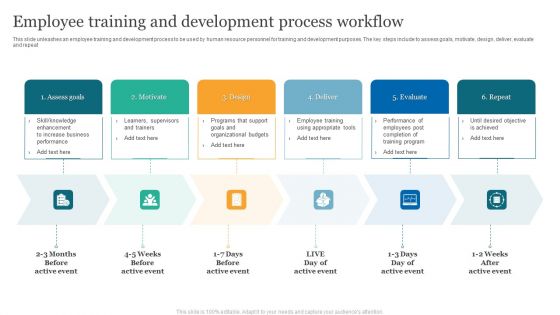
Employee Training And Development Process Workflow Infographics PDF
This slide unleashes an employee training and development process to be used by human resource personnel for training and development purposes. The key steps include to assess goals, motivate, design, deliver, evaluate and repeat. Presenting Employee Training And Development Process Workflow Infographics PDF to dispense important information. This template comprises Six stages. It also presents valuable insights into the topics includingLearners, Supervisors And Trainers, Programs That Support Goals. This is a completely customizable PowerPoint theme that can be put to use immediately. So, download it and address the topic impactfully.

Quality Assurance Testing Process Pdca Cycle Ppt Infographics Images PDF
The slide showcases a defined cycle of quality assurance approach called pdca cycle which enables to ensure that the organizations procedures are routinely assessed and enhanced. it involves phases like plan, do, check and act. presenting Quality Assurance Testing Process Pdca Cycle Ppt Infographics Images PDF to dispense important information. this template comprises four stages. it also presents valuable insights into the topics including Act, Plan, Check, Do, Process Development. this is a completely customizable powerpoint theme that can be put to use immediately. so, download it and address the topic impactfully.
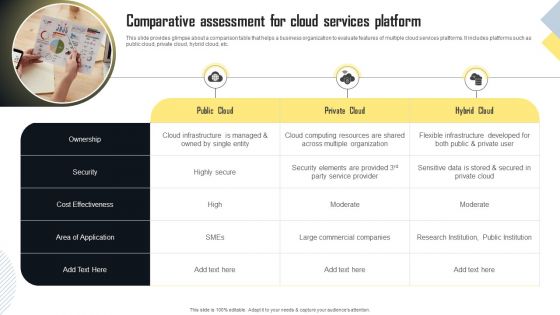
Comparative Assessment For Cloud Services Platform Infographics PDF
This slide provides glimpse about a comparison table that helps a business organization to evaluate features of multiple cloud services platforms. It includes platforms such as public cloud, private cloud, hybrid cloud, etc. Slidegeeks is one of the best resources for PowerPoint templates. You can download easily and regulate Comparative Assessment For Cloud Services Platform Infographics PDF for your personal presentations from our wonderful collection. A few clicks is all it takes to discover and get the most relevant and appropriate templates. Use our Templates to add a unique zing and appeal to your presentation and meetings. All the slides are easy to edit and you can use them even for advertisement purposes.
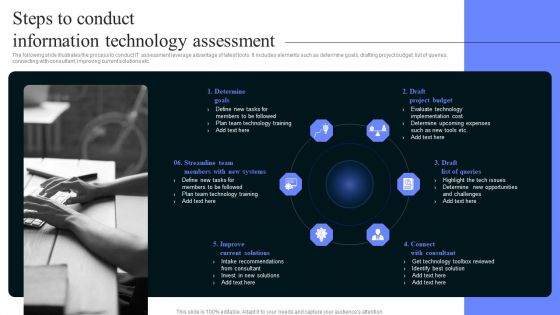
Steps To Conduct Information Technology Assessment Infographics PDF
The following slide illustrates the process to conduct IT assessment leverage advantage of latest tools. It includes elements such as determine goals, drafting project budget, list of queries, connecting with consultant, improving current solutions etc. Persuade your audience using this Steps To Conduct Information Technology Assessment Infographics PDF. This PPT design covers six stages, thus making it a great tool to use. It also caters to a variety of topics including Determine Goals, Draft Project Budget, Draft List Quer. Download this PPT design now to present a convincing pitch that not only emphasizes the topic but also showcases your presentation skills.
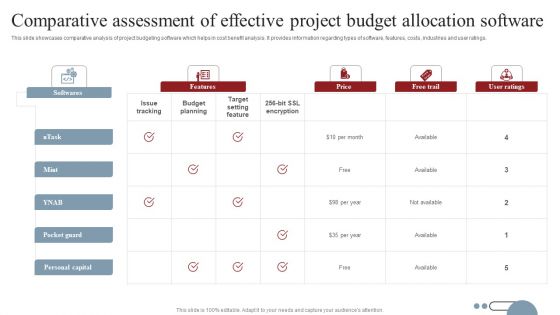
Comparative Assessment Of Effective Project Budget Allocation Software Infographics PDF
This slide showcases comparative analysis of project budgeting software which helps in cost benefit analysis. It provides information regarding types of software, features, costs, industries and user ratings. Showcasing this set of slides titled Comparative Assessment Of Effective Project Budget Allocation Software Infographics PDF. The topics addressed in these templates are Budget Planning, Target Setting Feature, Issue Tracking. All the content presented in this PPT design is completely editable. Download it and make adjustments in color, background, font etc. as per your unique business setting.
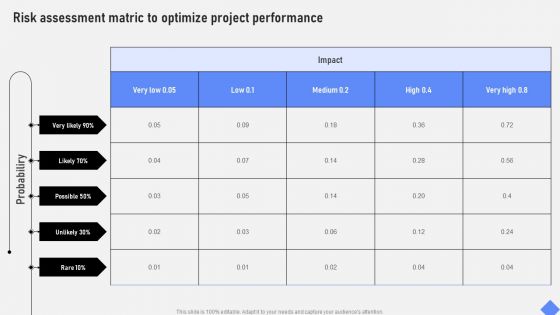
Risk Assessment Matric To Optimize Project Performance Infographics PDF
Slidegeeks has constructed Risk Assessment Matric To Optimize Project Performance Infographics PDF after conducting extensive research and examination. These presentation templates are constantly being generated and modified based on user preferences and critiques from editors. Here, you will find the most attractive templates for a range of purposes while taking into account ratings and remarks from users regarding the content. This is an excellent jumping off point to explore our content and will give new users an insight into our top notch PowerPoint Templates.
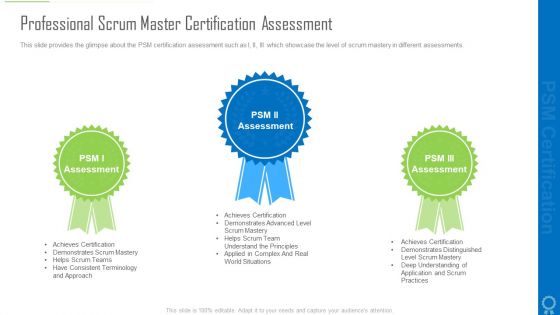
Professional Scrum Master Certification Assessment Ppt Infographics Tips PDF
This slide provides the glimpse about the PSM certification assessment such as I, II, III which showcase the level of scrum mastery in different assessments. This is a professional scrum master certification assessment ppt infographics tips pdf template with various stages. Focus and dispense information on three stages using this creative set, that comes with editable features. It contains large content boxes to add your information on topics like professional scrum master certification assessment. You can also showcase facts, figures, and other relevant content using this PPT layout. Grab it now.
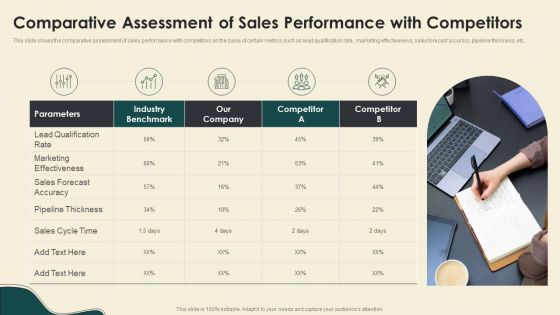
Comparative Assessment Of Sales Performance With Competitors Infographics PDF
This slide shows the comparative assessment of sales performance with competitors on the basis of certain metrics such as lead qualification rate, marketing effectiveness, sales forecast accuracy, pipeline thickness, etc. Presenting Comparative Assessment Of Sales Performance With Competitors Infographics PDF to provide visual cues and insights. Share and navigate important information on five stages that need your due attention. This template can be used to pitch topics like Industry Benchmark, Marketing Effectiveness, Sales Forecast Accuracy. In addtion, this PPT design contains high resolution images, graphics, etc, that are easily editable and available for immediate download.
Three Step Policy Tracking And Assessment Framework Infographics PDF
This slide showcases three phase monitoring and evaluation framework for the company to ensure realization of planned output. It includes stages such as design, delivery and review. Persuade your audience using this Three Step Policy Tracking And Assessment Framework Infographics PDF. This PPT design covers Three stages, thus making it a great tool to use. It also caters to a variety of topics including Three Step Policy, Tracking, Assessment Framework. Download this PPT design now to present a convincing pitch that not only emphasizes the topic but also showcases your presentation skills.

Corporate Governance Framework Addressing Sustainability Issues Ppt Infographics Graphics PDF
This slide comprises of a corporate governance framework developed to find a solution oriented approach to address the sustainability issues of a business. It is inclusive of the three important elements of the said framework, viz, corporate responsibility, corporate citizenship and corporate governance. Presenting Corporate Governance Framework Addressing Sustainability Issues Ppt Infographics Graphics PDF to dispense important information. This template comprises one stages. It also presents valuable insights into the topics including Corporate Responsibility, Corporate Citizenship, Risks Assessment. This is a completely customizable PowerPoint theme that can be put to use immediately. So, download it and address the topic impactfully.
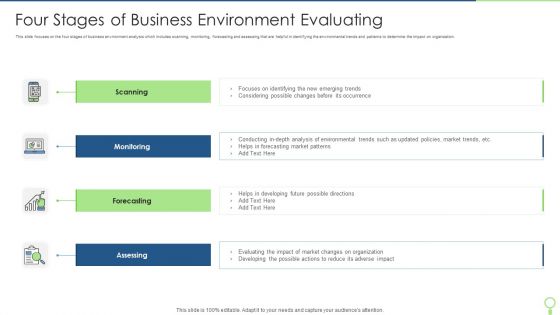
Four Stages Of Business Environment Evaluating Infographics PDF
This slide focuses on the four stages of business environment analysis which includes scanning, monitoring, forecasting and assessing that are helpful in identifying the environmental trends and patterns to determine the impact on organization. Persuade your audience using this Four Stages Of Business Environment Evaluating Infographics PDF. This PPT design covers four stages, thus making it a great tool to use. It also caters to a variety of topics including Monitoring, Scanning, Forecasting. Download this PPT design now to present a convincing pitch that not only emphasizes the topic but also showcases your presentation skills.
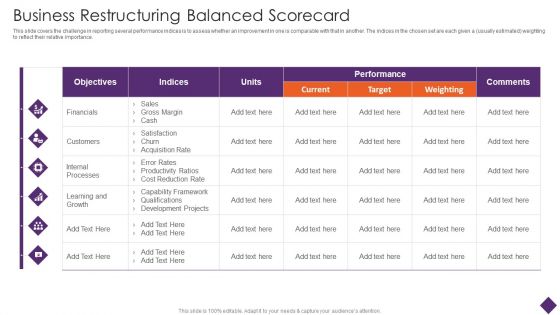
Business Restructuring Business Restructuring Balanced Scorecard Ppt Infographics Skills PDF
This slide covers the challenge in reporting several performance indices is to assess whether an improvement in one is comparable with that in another. The indices in the chosen set are each given a usually estimated weighting to reflect their relative importance. Deliver and pitch your topic in the best possible manner with this Business Restructuring Business Restructuring Balanced Scorecard Ppt Infographics Skills PDF. Use them to share invaluable insights on Objectives Financials Customers, Internal Processes Units and impress your audience. This template can be altered and modified as per your expectations. So, grab it now.

Monthly Work Schedule With Activities And Outcomes Infographics PDF
The following slide highlight the monthly work plan with activities and outcomes. It showcases activities which includes budget planning, employee hiring, project initiation, work review and quality assessment. Persuade your audience using this Monthly Work Schedule With Activities And Outcomes Infographics PDF. This PPT design covers three stages, thus making it a great tool to use. It also caters to a variety of topics including Outcomes, Activities, Budget Planning, Efficient Budget Allocation. Download this PPT design now to present a convincing pitch that not only emphasizes the topic but also showcases your presentation skills.

Three Major Mining Challenges In Data Migration Infographics PDF
The following slide highlights the three major profiling challenges in data migration depicting key headings which includes data identification and restoration, stakeholder mapping and cleansing process and timeline to assess the major challenges faced by organization in data profiling process Persuade your audience using this three major mining challenges in data migration infographics pdf . This PPT design covers three stages, thus making it a great tool to use. It also caters to a variety of topics including data identification and restoration, stakeholder mapping, cleansing process and timeline . Download this PPT design now to present a convincing pitch that not only emphasizes the topic but also showcases your presentation skills.

Key Capabilities And Skills In Business Analysis Infographics PDF
This slide covers key competencies required for business analysis to assess candidates and efficiently structure resource pool for future tasks. This consists of analytical thinking, behavioural characteristics, business knowledge and interaction skills. Presenting Key Capabilities And Skills In Business Analysis Infographics PDF to dispense important information. This template comprises four stages. It also presents valuable insights into the topics including Analytical Thinking, Behavioural Characteristics, Business Knowledge. This is a completely customizable PowerPoint theme that can be put to use immediately. So, download it and address the topic impactfully.

Security Training Program Frameworks Ppt Infographics Show PDF
This slide outlines the criteria, describes possible positions that could be subject to instruction, instruction information sources, and metrics to assess training success in those control areas.This is a security training program frameworks ppt infographics show pdf. template with various stages. Focus and dispense information on one stage using this creative set, that comes with editable features. It contains large content boxes to add your information on topics like build and maintain a secure network and systems, protect cardholder data. You can also showcase facts, figures, and other relevant content using this PPT layout. Grab it now.

Workplace Safety Enhancement Strategy To Reduce Accidents Infographics PDF
This slide depicts the step wise process used for improving safety in a workplace of an organization. It includes the following steps Identifying business need, planning, implementing and monitoring. Persuade your audience using this Workplace Safety Enhancement Strategy To Reduce Accidents Infographics PDF. This PPT design covers four stages, thus making it a great tool to use. It also caters to a variety of topics including Access Employees, Conduct Assessment, Safety Improvement. Download this PPT design now to present a convincing pitch that not only emphasizes the topic but also showcases your presentation skills.
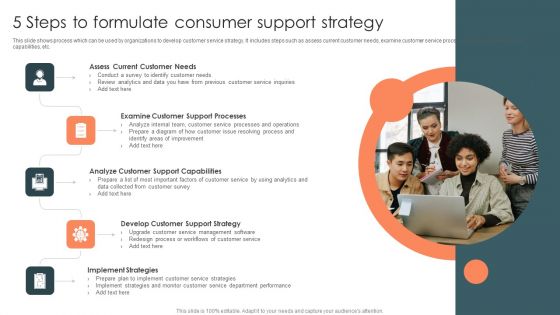
5 Steps To Formulate Consumer Support Strategy Infographics PDF
This slide shows process which can be used by organizations to develop customer service strategy. It includes steps such as assess current customer needs, examine customer service process, analyze customer service capabilities, etc. Presenting 5 Steps To Formulate Consumer Support Strategy Infographics PDF to dispense important information. This template comprises Five stages. It also presents valuable insights into the topics including Formulate Consumer, Support Strategy. This is a completely customizable PowerPoint theme that can be put to use immediately. So, download it and address the topic impactfully.

Guideline To Develop Successful Global Communication Strategy Infographics PDF
This slide contains tips to develop global communication strategy for maximizing business profits. It includes tips such as business communication strategy assessment, determine key performers, identify objectives and communicate success to customers. Presenting Guideline To Develop Successful Global Communication Strategy Infographics PDF to dispense important information. This template comprises four stages. It also presents valuable insights into the topics including Assessment, Determine Key Performers, Communicate Success, Identify Objectives. This is a completely customizable PowerPoint theme that can be put to use immediately. So, download it and address the topic impactfully.
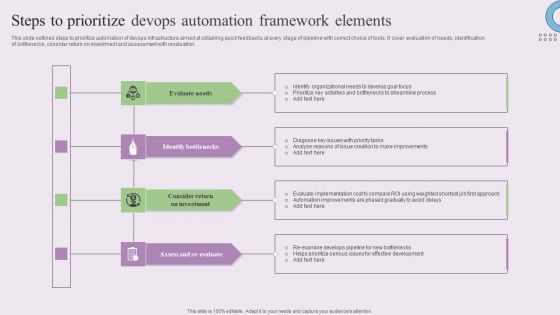
Steps To Prioritize Devops Automation Framework Elements Infographics PDF
This slide outlines steps to prioritize automation of devops infrastructure aimed at obtaining quick feedbacks at every stage of pipeline with correct choice of tools. It cover evaluation of needs, identification of bottlenecks, consider return on investment and assessment with revaluation. Presenting Steps To Prioritize Devops Automation Framework Elements Infographics PDF to dispense important information. This template comprises four stages. It also presents valuable insights into the topics including Evaluate Needs, Identify Bottlenecks, Consider Return Investment . This is a completely customizable PowerPoint theme that can be put to use immediately. So, download it and address the topic impactfully.
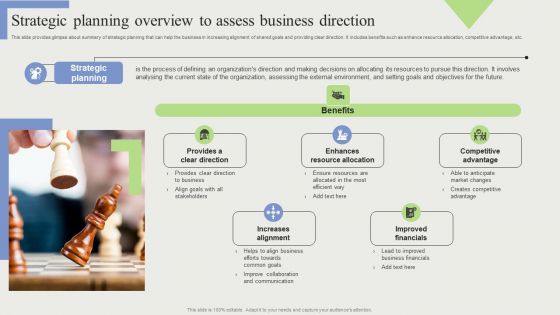
Strategic Planning Overview To Assess Business Direction Infographics PDF
This slide provides glimpse about summary of strategic planning that can help the business in increasing alignment of shared goals and providing clear direction. It includes benefits such as enhance resource allocation, competitive advantage, etc. Slidegeeks is here to make your presentations a breeze with Strategic Planning Overview To Assess Business Direction Infographics PDF With our easy-to-use and customizable templates, you can focus on delivering your ideas rather than worrying about formatting. With a variety of designs to choose from, you are sure to find one that suits your needs. And with animations and unique photos, illustrations, and fonts, you can make your presentation pop. So whether you are giving a sales pitch or presenting to the board, make sure to check out Slidegeeks first
Online Money Transfer Cost Analysis Sheet Ppt Infographics Icon PDF
The following slide highlights the cost assessment sheet to minimize future expense. It includes elements such as name of service providers, amount transfer, fee charged from sender and recipient etc. Showcasing this set of slides titled Online Money Transfer Cost Analysis Sheet Ppt Infographics Icon PDF. The topics addressed in these templates are Service Provider, Amount Transferred, Total Cost. All the content presented in this PPT design is completely editable. Download it and make adjustments in color, background, font etc. as per your unique business setting.

Feasibility Analysis Critical Prior Project Initiation Infographics PDF
This slide provides information regarding feasibility assessment focusing to analyze project competency based on operational, technology, schedule, economic proficiency. Take your projects to the next level with our ultimate collection of Feasibility Analysis Critical Prior Project Initiation Infographics PDF. Slidegeeks has designed a range of layouts that are perfect for representing task or activity duration, keeping track of all your deadlines at a glance. Tailor these designs to your exact needs and give them a truly corporate look with your own brand colors they will make your projects stand out from the rest.
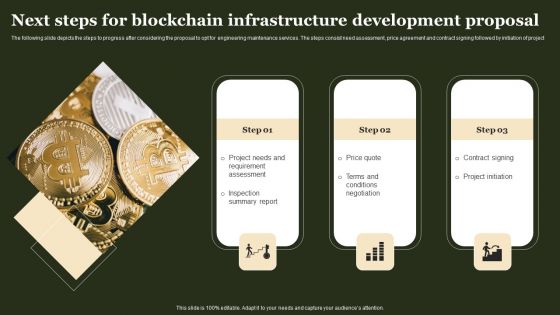
Next Steps For Blockchain Infrastructure Development Proposal Infographics PDF
The following slide depicts the steps to progress after considering the proposal to opt for engineering maintenance services. The steps consist need assessment, price agreement and contract signing followed by initiation of project Take your presentations to the next level with our Next Steps For Blockchain Infrastructure Development Proposal Infographics PDF template. With its sleek design and seamless editing features, this single-slide PPT template is a game-changer for professionals who want to make an impact. Impress your audience with stunning visuals and engaging content that will capture their attention from start to finish. Get your hands on our template and elevate your presentations to new heights.

Steps To Achieve Greater Cyber Risk Prevention Infographics PDF
The slide showcases the steps to follow to become resilient to cyber security attacks. It covers steps like system hygiene, develop a plan, map out risk profile, assess and measure, mitigate risk, cyber insurance and get started. Presenting Steps To Achieve Greater Cyber Risk Prevention Infographics PDF to dispense important information. This template comprises seven stages. It also presents valuable insights into the topics including Systema Hygiene, Develop A Plan, Mitigate Risk. This is a completely customizable PowerPoint theme that can be put to use immediately. So, download it and address the topic impactfully.
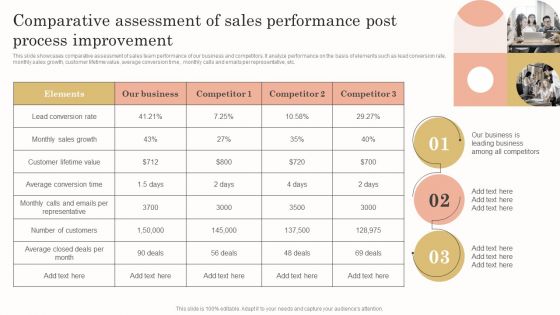
Comparative Assessment Of Sales Performance Post Process Improvement Infographics PDF
This slide showcases comparative assessment of sales team performance of our business and competitors. It analyze performance on the basis of elements such as lead conversion rate, monthly sales growth, customer lifetime value, average conversion time , monthly calls and emails per representative, etc. Want to ace your presentation in front of a live audience Our Comparative Assessment Of Sales Performance Post Process Improvement Infographics PDF can help you do that by engaging all the users towards you. Slidegeeks experts have put their efforts and expertise into creating these impeccable powerpoint presentations so that you can communicate your ideas clearly. Moreover, all the templates are customizable, and easy to edit and downloadable. Use these for both personal and commercial use.

Financial Assessment Growth In Revenues Across Amazon Infographics PDF
This slide provides information regarding the financial analysis of Amazon in terms of growth in revenues. The firm focused on launching offerings across various markets in order to increase sales and better conversions. Slidegeeks is here to make your presentations a breeze with Financial Assessment Growth In Revenues Across Amazon Infographics PDF With our easy to use and customizable templates, you can focus on delivering your ideas rather than worrying about formatting. With a variety of designs to choose from, you are sure to find one that suits your needs. And with animations and unique photos, illustrations, and fonts, you can make your presentation pop. So whether you are giving a sales pitch or presenting to the board, make sure to check out Slidegeeks first.
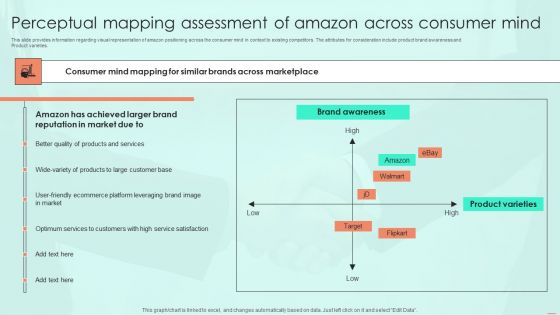
Perceptual Mapping Assessment Of Amazon Across Consumer Mind Infographics PDF
This slide provides information regarding visual representation of amazon positioning across the consumer mind in context to existing competitors. The attributes for consideration include product brand awareness and Product varieties. Slidegeeks is here to make your presentations a breeze with Perceptual Mapping Assessment Of Amazon Across Consumer Mind Infographics PDF With our easy to use and customizable templates, you can focus on delivering your ideas rather than worrying about formatting. With a variety of designs to choose from, you are sure to find one that suits your needs. And with animations and unique photos, illustrations, and fonts, you can make your presentation pop. So whether you are giving a sales pitch or presenting to the board, make sure to check out Slidegeeks first
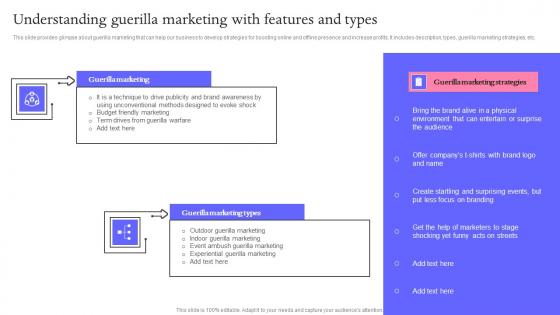
Understanding Guerilla Buzz Marketing Techniques For Engaging Infographics Pdf
This slide provides glimpse about guerilla marketing that can help our business to develop strategies for boosting online and offline presence and increase profits. It includes description, types, guerilla marketing strategies, etc. Are you in need of a template that can accommodate all of your creative concepts This one is crafted professionally and can be altered to fit any style. Use it with Google Slides or PowerPoint. Include striking photographs, symbols, depictions, and other visuals. Fill, move around, or remove text boxes as desired. Test out color palettes and font mixtures. Edit and save your work, or work with colleagues. Download Understanding Guerilla Buzz Marketing Techniques For Engaging Infographics Pdf and observe how to make your presentation outstanding. Give an impeccable presentation to your group and make your presentation unforgettable.

Open System Architecture For Anti Money Laundering Infographics PDF
This slide showcases open system architecture for anti-money laundering. It provides details about data source, watch list, check processing, case investigation, user interface, event sources, transaction and event bus, etc. Are you in need of a template that can accommodate all of your creative concepts This one is crafted professionally and can be altered to fit any style. Use it with Google Slides or PowerPoint. Include striking photographs, symbols, depictions, and other visuals. Fill, move around, or remove text boxes as desired. Test out color palettes and font mixtures. Edit and save your work, or work with colleagues. Download Open System Architecture For Anti Money Laundering Infographics PDF and observe how to make your presentation outstanding. Give an impeccable presentation to your group and make your presentation unforgettable.
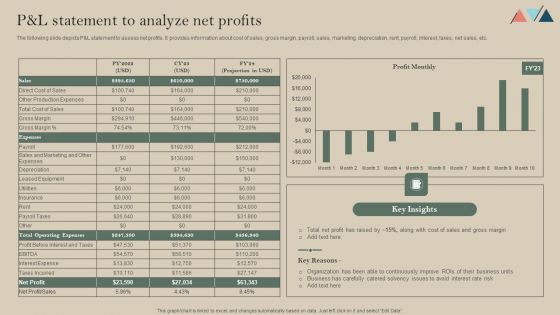
Pand L Statement To Analyze Net Profits Infographics PDF
The following slide depicts P and L statement to assess net profits. It provides information about cost of sales, gross margin, payroll, sales, marketing, depreciation, rent, payroll, interest, taxes, net sales, etc. Slidegeeks has constructed Pand L Statement To Analyze Net Profits Infographics PDF after conducting extensive research and examination. These presentation templates are constantly being generated and modified based on user preferences and critiques from editors. Here, you will find the most attractive templates for a range of purposes while taking into account ratings and remarks from users regarding the content. This is an excellent jumping-off point to explore our content and will give new users an insight into our top-notch PowerPoint Templates.
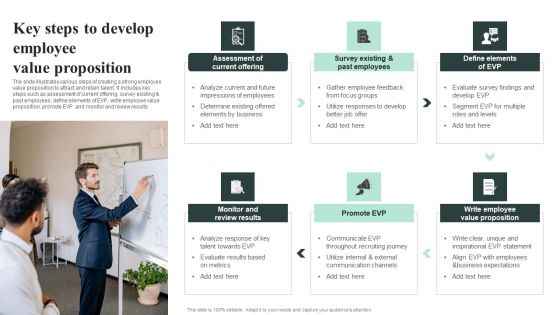
Key Steps To Develop Employee Value Proposition Infographics PDF
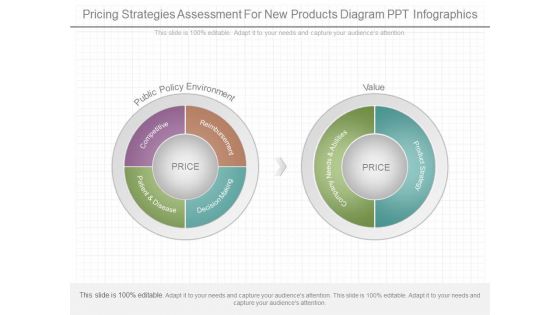
Pricing Strategies Assessment For New Products Diagram Ppt Infographics
This is a pricing strategies assessment for new products diagram ppt infographics. This is a two stage process. The stages in this process are public policy environment, competitive, patient and disease, decision making, reimbursement, value, company needs and abilities, product strategy.
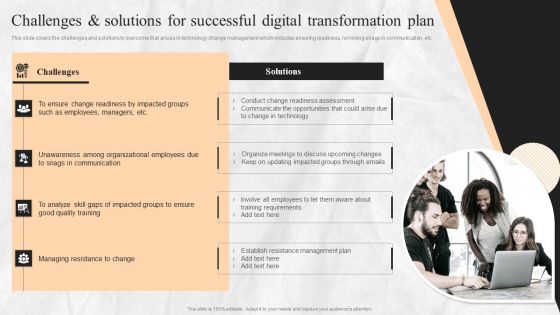
Digital Transition Plan For Managing Business Challenges And Solutions For Successful Digital Transformation Plan Infographics PDF
This slide covers the challenges and solutions to overcome that arises in technology change management which includes ensuring readiness, removing snags in communication, etc. Create an editable Digital Transition Plan For Managing Business Challenges And Solutions For Successful Digital Transformation Plan Infographics PDF that communicates your idea and engages your audience. Whether you are presenting a business or an educational presentation, pre-designed presentation templates help save time. Digital Transition Plan For Managing Business Challenges And Solutions For Successful Digital Transformation Plan Infographics PDF is highly customizable and very easy to edit, covering many different styles from creative to business presentations. Slidegeeks has creative team members who have crafted amazing templates. So, go and get them without any delay.
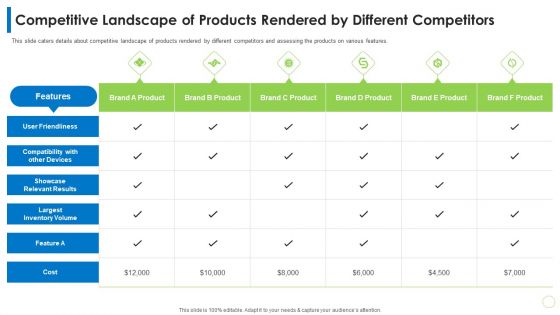
Pitch Deck PPT For Commodity Competitive Landscape Of Products Rendered By Different Competitors Ppt Infographics Infographics PDF
This slide caters details about competitive landscape of products rendered by different competitors and assessing the products on various features. Deliver and pitch your topic in the best possible manner with this pitch deck ppt for commodity competitive landscape of products rendered by different competitors ppt infographics infographics pdf. Use them to share invaluable insights on user friendliness, compatibility with other devices, showcase relevant results, largest inventory volume and impress your audience. This template can be altered and modified as per your expectations. So, grab it now.

Pricing In Device Based Model Layered Pricing Strategy For Managed Services Infographics Pdf
The following slide provides an overview of the pricing in Per Device based model, this slides provides multiple brackets in which device based pricing is provided. Are you searching for a Pricing In Device Based Model Layered Pricing Strategy For Managed Services Infographics Pdf that is uncluttered, straightforward, and original Its easy to edit, and you can change the colors to suit your personal or business branding. For a presentation that expresses how much effort you have put in, this template is ideal With all of its features, including tables, diagrams, statistics, and lists, its perfect for a business plan presentation. Make your ideas more appealing with these professional slides. Download Pricing In Device Based Model Layered Pricing Strategy For Managed Services Infographics Pdf from Slidegeeks today.
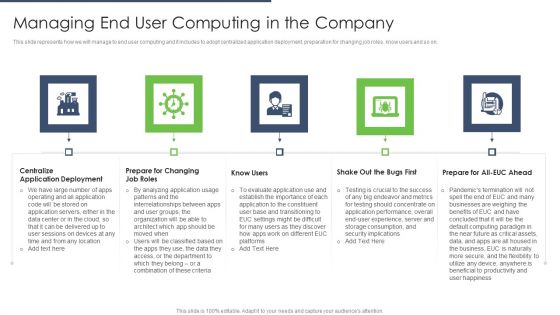
End User Computing Managing End User Computing In The Company Infographics PDF
This slide represents how we will manage to end user computing and it includes to adopt centralized application deployment, preparation for changing job roles, know users and so on.Presenting End User Computing Managing End User Computing In The Company Infographics PDF to provide visual cues and insights. Share and navigate important information on five stages that need your due attention. This template can be used to pitch topics like Application Deployment, Prepare For Changing, Evaluate Application. In addtion, this PPT design contains high resolution images, graphics, etc, that are easily editable and available for immediate download.
Flexible Body Structure Of Martial Art Trainer Icon Ppt PowerPoint Presentation Infographics Infographic Template PDF
Pitch your topic with ease and precision using this flexible body structure of martial art trainer icon ppt powerpoint presentation infographics infographic template pdf. This layout presents information on flexible body structure of martial art trainer icon. It is also available for immediate download and adjustment. So, changes can be made in the color, design, graphics or any other component to create a unique layout.
Find Answer For Different Type Of Business Query Icon Ppt PowerPoint Presentation Infographics Infographic Template PDF
Pitch your topic with ease and precision using this find answer for different type of business query icon ppt powerpoint presentation infographics infographic template pdf. This layout presents information on find answers for different type of business query icon. It is also available for immediate download and adjustment. So, changes can be made in the color, design, graphics or any other component to create a unique layout.

Top Ten Slide For Online Sales Funnel Software Ppt PowerPoint Presentation Infographics Infographic Template PDF
Pitch your topic with ease and precision using this Top Ten Slide For Online Sales Funnel Software Ppt PowerPoint Presentation Infographics Infographic Template PDF. This layout presents information on Top Ten Slide For Online Sales Funnel Software. It is also available for immediate download and adjustment. So, changes can be made in the color, design, graphics or any other component to create a unique layout.
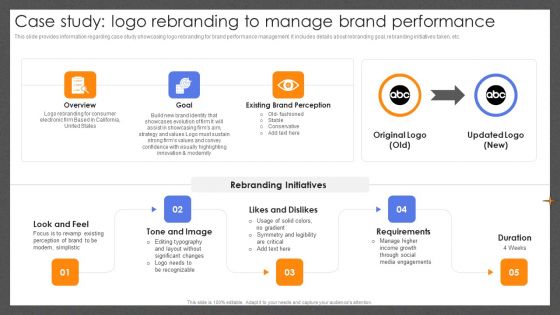
Guide For Effective Brand Case Study Logo Rebranding To Manage Brand Performance Infographics PDF
This slide provides information regarding case study showcasing logo rebranding for brand performance management. It includes details about rebranding goal, rebranding initiatives taken, etc. Crafting an eye-catching presentation has never been more straightforward. Let your presentation shine with this tasteful yet straightforward Guide For Effective Brand Case Study Logo Rebranding To Manage Brand Performance Infographics PDF template. It offers a minimalistic and classy look that is great for making a statement. The colors have been employed intelligently to add a bit of playfulness while still remaining professional. Construct the ideal Guide For Effective Brand Case Study Logo Rebranding To Manage Brand Performance Infographics PDF that effortlessly grabs the attention of your audience Begin now and be certain to wow your customers.
Three Months New Technical Officer Manager Plan Ppt Icon Infographics PDF
This slide shows 3 months plan for new chief technical officer to make improvements in technical side. It includes 30 60 90 days activities like getting familiar to employees, monitoring progress and making reports. Pitch your topic with ease and precision using this Three Months New Technical Officer Manager Plan Ppt Icon Infographics PDF. This layout presents information on First 30 Days, 30 60 Days,60 90 Days. It is also available for immediate download and adjustment. So, changes can be made in the color, design, graphics or any other component to create a unique layout.
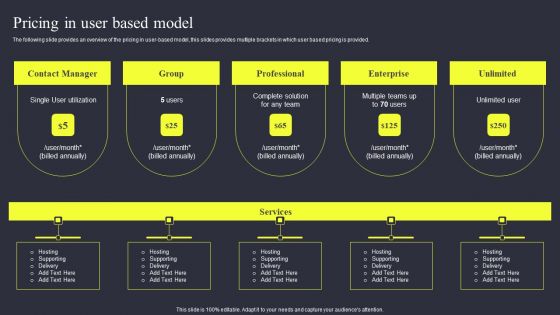
Strategies To Enhance Managed Service Business Pricing In User Based Model Infographics PDF
The following slide provides an overview of the pricing in user-based model, this slides provides multiple brackets in which user based pricing is provided. Present like a pro with Strategies To Enhance Managed Service Business Pricing In User Based Model Infographics PDF Create beautiful presentations together with your team, using our easy to use presentation slides. Share your ideas in real time and make changes on the fly by downloading our templates. So whether you are in the office, on the go, or in a remote location, you can stay in sync with your team and present your ideas with confidence. With Slidegeeks presentation got a whole lot easier. Grab these presentations today.

HR Manager Assessing Employee Competency And Skill Set Ppt PowerPoint Presentation Visual Aids Infographics PDF
Presenting hr manager assessing employee competency and skill set ppt powerpoint presentation visual aids infographics pdf to dispense important information. This template comprises one stages. It also presents valuable insights into the topics including hr manager assessing employee competency and skill set. This is a completely customizable PowerPoint theme that can be put to use immediately. So, download it and address the topic impactfully.

Business Manager Assessing Client Portfolio Metrics On Screen Ppt PowerPoint Presentation Infographics Display PDF
Presenting this set of slides with name business manager assessing client portfolio metrics on screen ppt powerpoint presentation infographics display pdf. This is a three stage process. The stages in this process are business manager assessing client portfolio metrics on screen. This is a completely editable PowerPoint presentation and is available for immediate download. Download now and impress your audience.
Icon For Effective Knowledge Transfer Plan Process Between Manager And Employee Infographics PDF
Presenting icon for effective knowledge transfer plan process between manager and employee infographics pdf to dispense important information. This template comprises four stages. It also presents valuable insights into the topics including icon for effective knowledge transfer plan process between manager and employee. This is a completely customizable PowerPoint theme that can be put to use immediately. So, download it and address the topic impactfully.
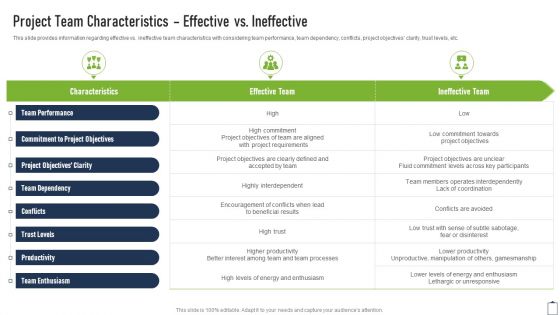
Project Team Characteristics Effective Vs Ineffective Project Managers Playbook Infographics PDF
This slide provides information regarding effective vs. ineffective team characteristics with considering team performance, team dependency, conflicts, project objectives clarity, trust levels, etc. Deliver an awe inspiring pitch with this creative Project Team Characteristics Effective Vs Ineffective Project Managers Playbook Infographics PDF bundle. Topics like Highly Interdependent, Encouragement Conflicts, Unproductive Manipulation can be discussed with this completely editable template. It is available for immediate download depending on the needs and requirements of the user.
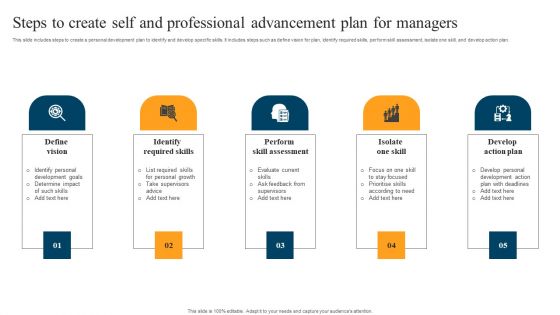
Steps To Create Self And Professional Advancement Plan For Managers Infographics PDF
This slide includes steps to create a personal development plan to identify and develop specific skills. It includes steps such as define vision for plan, identify required skills, perform skill assessment, isolate one skill, and develop action plan. Presenting Steps To Create Self And Professional Advancement Plan For Managers Infographics PDF to dispense important information. This template comprises five stages. It also presents valuable insights into the topics including Identify Required Skills, Perform Skill Assessment, Isolate One Skill. This is a completely customizable PowerPoint theme that can be put to use immediately. So, download it and address the topic impactfully.

Managing E Commerce Business Accounting Reviewing Financial Positions From Balance Sheet Infographics PDF
The following slide illustrates reviewing financial position through balance sheet. It provides information about current assets, inventory, cash, depreciation, current liabilities, borrowings, accounts payable, etc. Retrieve professionally designed Managing E Commerce Business Accounting Reviewing Financial Positions From Balance Sheet Infographics PDF to effectively convey your message and captivate your listeners. Save time by selecting pre made slideshows that are appropriate for various topics, from business to educational purposes. These themes come in many different styles, from creative to corporate, and all of them are easily adjustable and can be edited quickly. Access them as PowerPoint templates or as Google Slides themes. You do not have to go on a hunt for the perfect presentation because Slidegeeks got you covered from everywhere.
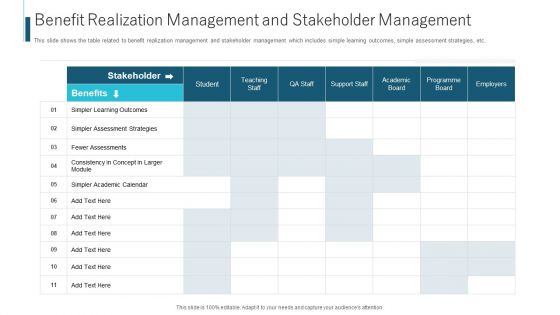
Benefit Realization Management And Stakeholder Management Ppt Infographic Template Outline PDF
This slide shows the table related to benefit realization management and stakeholder management which includes simple learning outcomes, simple assessment strategies, etc. Deliver an awe-inspiring pitch with this creative benefit realization management and stakeholder management ppt infographic template outline pdf. bundle. Topics like teaching staff, qa staff, support staff, academic board, programme board can be discussed with this completely editable template. It is available for immediate download depending on the needs and requirements of the user.

 Home
Home