Change Management Infographics

Strategic Model To Manage Overall IT Spending Infographics PDF
This slide provides information regarding the strategic cost prioritization model deployed by IT department in order to assess scores on various parameters such as IT control, strategic value, cost and benefit, impact on customer, and investment required, etc. Find highly impressive Strategic Model To Manage Overall IT Spending Infographics PDF on Slidegeeks to deliver a meaningful presentation. You can save an ample amount of time using these presentation templates. No need to worry to prepare everything from scratch because Slidegeeks experts have already done a huge research and work for you. You need to download Strategic Model To Manage Overall IT Spending Infographics PDF for your upcoming presentation. All the presentation templates are 100 percent editable and you can change the color and personalize the content accordingly. Download now

Monthly Steps For Agile PM Infographics PDF
This template covers monthly project management in agile manner which includes stakeholders insights , feature planning, project development, sprint review and validation of project. Pitch your topic with ease and precision using this Monthly Steps For Agile PM Infographics PDF. This layout presents information on Project Development, Requirements, Organizational. It is also available for immediate download and adjustment. So, changes can be made in the color, design, graphics or any other component to create a unique layout.
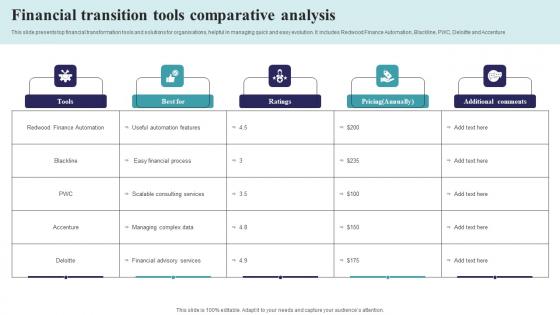
Financial Transition Tools Comparative Analysis Infographics Pdf
This slide presents top financial transformation tools and solutions for organisations, helpful in managing quick and easy evolution. It includes Redwood Finance Automation, Blackline, PWC, Deloitte and Accenture Pitch your topic with ease and precision using this Financial Transition Tools Comparative Analysis Infographics Pdf This layout presents information on Redwood Finance Automation, Financial Process It is also available for immediate download and adjustment. So, changes can be made in the color, design, graphics or any other component to create a unique layout.

Sales Budget Deficit Assessment Sheet Infographics PDF
The following slide illustrates the process to evaluate budget variances to review actual VS projected cost. It includes elements such as collect data, assess gap, compile management report, adjusts forecast etc. Pitch your topic with ease and precision using this Sales Budget Deficit Assessment Sheet Infographics PDF. This layout presents information on Collect Data, Assess Gap, Adjusts Forecast. It is also available for immediate download and adjustment. So, changes can be made in the color, design, graphics or any other component to create a unique layout.

Stage Gate Project Administration Summary Infographics Pdf
The following slide depicts the overview of project to track progress at each stage. It includes key elements such as stage status, gate content status, consenter, accomplishment date, start date, due date, expected outcome, duration etc. Pitch your topic with ease and precision using this Stage Gate Project Administration Summary Infographics Pdf. This layout presents information on Stage Status, Gate Consent Status, Date Accomplishment. It is also available for immediate download and adjustment. So, changes can be made in the color, design, graphics or any other component to create a unique layout.

Television Commercial Campaign Development Process Infographics Pdf
This slide illustrates five steps action plan for television advertisement proposal to get maximum returns. It includes steps such as project kickoff, set campaign budget, select channel, choose timing and execute campaign Pitch your topic with ease and precision using this Television Commercial Campaign Development Process Infographics Pdf. This layout presents information on Project Kickoff, Campaign Budget, Select Channel. It is also available for immediate download and adjustment. So, changes can be made in the color, design, graphics or any other component to create a unique layout.

ERRC Create Framework For Hotel Infographics Pdf
This slide provides a ERRC strategy framework for a hotel business which helps to build customer loyalty via value generation and cost elimination. Key components are eliminate, reduce, raise and create. Pitch your topic with ease and precision using this ERRC Create Framework For Hotel Infographics Pdf. This layout presents information on Eliminate, Reduce, Raise. It is also available for immediate download and adjustment. So, changes can be made in the color, design, graphics or any other component to create a unique layout.

Fiscal Framework Effective Evaluation Process Infographics Pdf
This slide presents financial structure evaluation process, that helps in gradual identification of errors committed and to solve organisational distress. It includes analysing balance sheet, evaluating income statement, checking cash flow statement and analysing financial ratio. Pitch your topic with ease and precision using this Fiscal Framework Effective Evaluation Process Infographics Pdf. This layout presents information on Analyse Balance Sheet, Analyse Financial Ratio, Check Cash Flow Statement. It is also available for immediate download and adjustment. So, changes can be made in the color, design, graphics or any other component to create a unique layout.
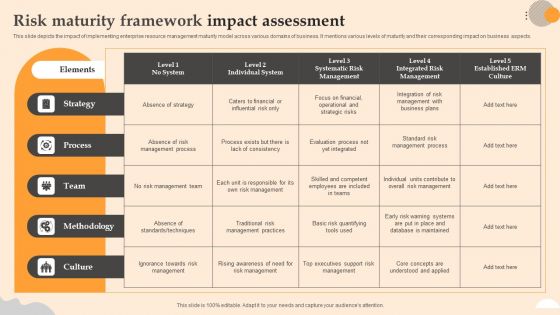
Risk Maturity Framework Impact Assessment Infographics PDF
This slide depicts the impact of implementing enterprise resource management maturity model across various domains of business. It mentions various levels of maturity and their corresponding impact on business aspects. Showcasing this set of slides titled Risk Maturity Framework Impact Assessment Infographics PDF. The topics addressed in these templates are Methodology, Team, Strategy. All the content presented in this PPT design is completely editable. Download it and make adjustments in color, background, font etc. as per your unique business setting.

Intelligent Process Automation Latest Technology Infographics Pdf
This slide presents smart process automation technologies that are highly used in industries, helpful in making operations effective and productive. It includes artificial intelligence, collaborative tools, semantic software systems and augmented intelligence. Pitch your topic with ease and precision using this Intelligent Process Automation Latest Technology Infographics Pdf. This layout presents information on Artificial Intelligence, Machine Learning, Semantic Software Systems, Collaborative Robots. It is also available for immediate download and adjustment. So, changes can be made in the color, design, graphics or any other component to create a unique layout.
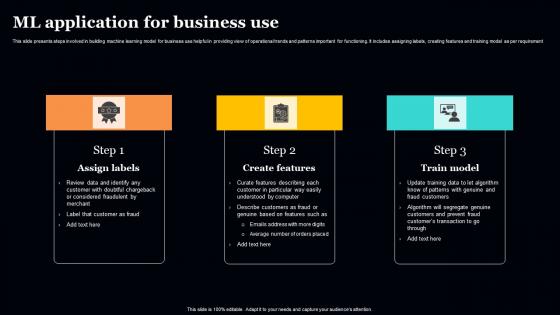
ML Application For Business Use Infographics Pdf
This slide presents steps involved in building machine learning model for business use helpful in providing view of operational trends and patterns important for functioning. It includes assigning labels, creating features and training model as per requirement. Pitch your topic with ease and precision using this ML Application For Business Use Infographics Pdf. This layout presents information on Assign Labels, Create Features, Train Model. It is also available for immediate download and adjustment. So, changes can be made in the color, design, graphics or any other component to create a unique layout.

Consumer Support Service Escalation Procedure Infographics Pdf
This slide showcase escalation process to get informed about escalated case status every step of the way. It includes elements such as service level agreement, major issue and exceptional circumstances. Pitch your topic with ease and precision using this Consumer Support Service Escalation Procedure Infographics Pdf. This layout presents information on Consumer Support, Service Escalation Procedure, Service Level Agreement. It is also available for immediate download and adjustment. So, changes can be made in the color, design, graphics or any other component to create a unique layout.
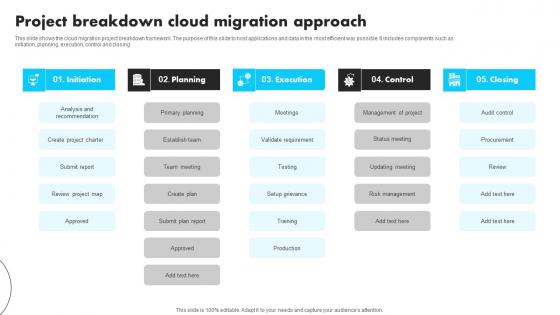
Project Breakdown Cloud Migration Approach Infographics Pdf
This slide shows the cloud migration project breakdown framework. The purpose of this slide to host applications and data in the most efficient way possible. It includes components such as initiation, planning, execution, control and closing Pitch your topic with ease and precision using this Project Breakdown Cloud Migration Approach Infographics Pdf This layout presents information on Initiation, Planning, Execution, Review Project It is also available for immediate download and adjustment. So, changes can be made in the color, design, graphics or any other component to create a unique layout.
Icon To Manage Client Attrition Through Retention Infographics PDF
Pitch your topic with ease and precision using this Icon To Manage Client Attrition Through Retention Infographics PDF. This layout presents information on Icon To Manage Client, Attrition Through Retention. It is also available for immediate download and adjustment. So, changes can be made in the color, design, graphics or any other component to create a unique layout.

Employee Financial Challenges With Solutions Infographics PDF
Following slide provides insight about various financial challenges faced by employee which can be used by managers to increase employee engagement rate. It includes elements such as pain points, impact on employees, solutions and results. Pitch your topic with ease and precision using this Employee Financial Challenges With Solutions Infographics PDF. This layout presents information on Error In Salary Payment, Compensation And Bonus, Low Financial Knowledge, Difficulty In Bill Payment. It is also available for immediate download and adjustment. So, changes can be made in the color, design, graphics or any other component to create a unique layout.
Supplier Performance Assessment Form Icon Infographics PDF
Pitch your topic with ease and precision using this Supplier Performance Assessment Form Icon Infographics PDF. This layout presents information on Supplier Performance, Assessment Form Icon. It is also available for immediate download and adjustment. So, changes can be made in the color, design, graphics or any other component to create a unique layout.
Data Processing Cloud Services Icon Infographics PDF
Pitch your topic with ease and precision using this Data Processing Cloud Services Icon Infographics PDF. This layout presents information on Security Compliance, Monitor Visibility, Authentication. It is also available for immediate download and adjustment. So, changes can be made in the color, design, graphics or any other component to create a unique layout.
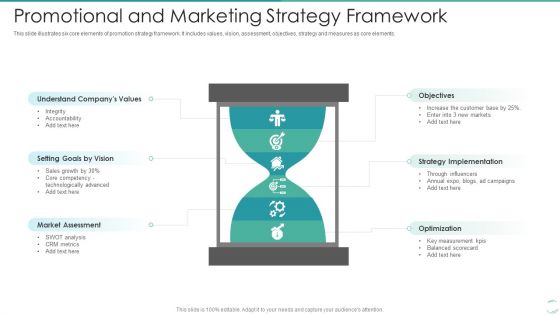
Promotional And Marketing Strategy Framework Infographics PDF
This slide illustrates six core elements of promotion strategy framework. It includes values, vision, assessment, objectives, strategy and measures as core elements. Pitch your topic with ease and precision using this Promotional And Marketing Strategy Framework Infographics PDF. This layout presents information on Strategy Implementation, Optimization, Market Assessment. It is also available for immediate download and adjustment. So, changes can be made in the color, design, graphics or any other component to create a unique layout.
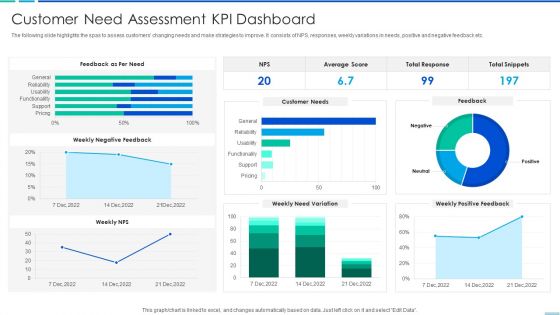
Customer Need Assessment Kpi Dashboard Infographics PDF
The following slide highlights the spas to assess customers changing needs and make strategies to improve. It consists of NPS, responses, weekly variations in needs, positive and negative feedback etc. Showcasing this set of slides titled customer need assessment kpi dashboard infographics pdf. The topics addressed in these templates are customer need assessment kpi dashboard. All the content presented in this PPT design is completely editable. Download it and make adjustments in color, background, font etc. as per your unique business setting.

Employee Payment Services Implementation Process Infographics PDF
This slide illustrates steps of payroll system implementation. It covers six steps such as data gathering, system configuration, system testing, employee training etc. Pitch your topic with ease and precision using this employee payment services implementation process infographics pdf. This layout presents information on employee payment services implementation process. It is also available for immediate download and adjustment. So, changes can be made in the color, design, graphics or any other component to create a unique layout.
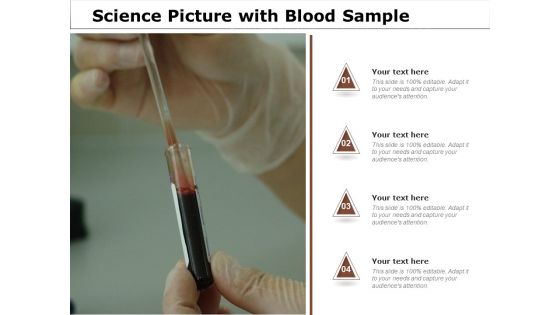
Science Picture With Blood Sample Ppt PowerPoint Presentation Infographics Infographics PDF
Pitch your topic with ease and precision using this science picture with blood sample ppt powerpoint presentation infographics infographics pdf. This layout presents information on science picture with blood sample. It is also available for immediate download and adjustment. So, changes can be made in the color, design, graphics or any other component to create a unique layout.
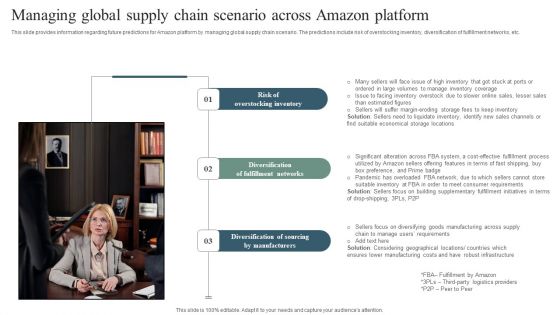
Managing Global Supply Chain Scenario Across Amazon Platform Infographics PDF
This slide provides information regarding future predictions for Amazon platform by managing global supply chain scenario. The predictions include risk of overstocking inventory, diversification of fulfillment networks, etc. Present like a pro with Managing Global Supply Chain Scenario Across Amazon Platform Infographics PDF Create beautiful presentations together with your team, using our easy-to-use presentation slides. Share your ideas in real-time and make changes on the fly by downloading our templates. So whether you are in the office, on the go, or in a remote location, you can stay in sync with your team and present your ideas with confidence. With Slidegeeks presentation got a whole lot easier. Grab these presentations today.

VID Managing End User Computing In The Company Infographics PDF
This slide represents how we will manage to end user computing and it includes to adopt centralized application deployment, preparation for changing job roles, know users and so on.Presenting VID Managing End User Computing In The Company Infographics PDF to provide visual cues and insights. Share and navigate important information on five stages that need your due attention. This template can be used to pitch topics like Security Implications, Application Performance, Endeavor And Metrics. In addtion, this PPT design contains high resolution images, graphics, etc, that are easily editable and available for immediate download.
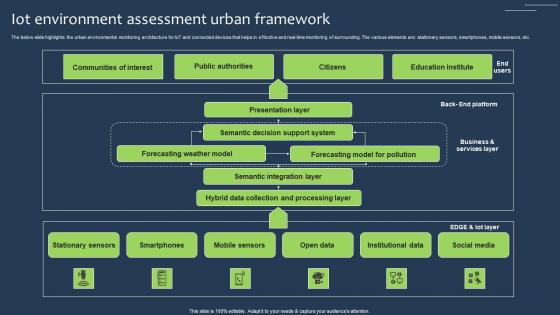
IOT Environment Assessment Urban Framework Infographics Pdf
The below slide highlights the urban environmental monitoring architecture for IoT and connected devices that helps in effective and real-time monitoring of surrounding. The various elements are stationary sensors, smartphones, mobile sensors, etc. Showcasing this set of slides titled IOT Environment Assessment Urban Framework Infographics Pdf The topics addressed in these templates are Communities Of Interest, Public Authorities, Education Institute All the content presented in this PPT design is completely editable. Download it and make adjustments in color, background, font etc. as per your unique business setting.
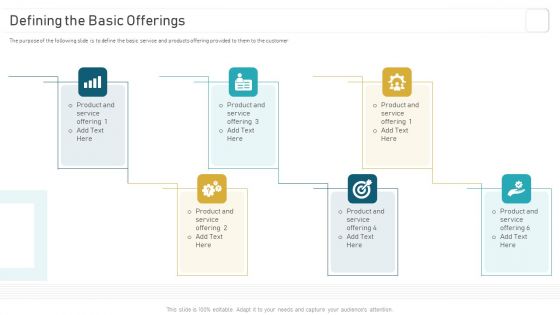
Deploying And Managing Recurring Defining The Basic Offerings Infographics PDF
The purpose of the following slide is to define the basic service and products offering provided to them to the customer Present like a pro with Deploying And Managing Recurring Defining The Basic Offerings Infographics PDF Create beautiful presentations together with your team, using our easy-to-use presentation slides. Share your ideas in real-time and make changes on the fly by downloading our templates. So whether youre in the office, on the go, or in a remote location, you can stay in sync with your team and present your ideas with confidence. With Slidegeeks presentation got a whole lot easier. Grab these presentations today.
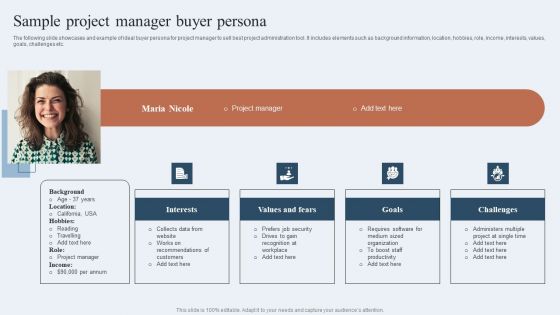
Niche Marketing Guide To Target Specific Customer Groups Sample Project Manager Buyer Persona Infographics PDF
The following slide showcases and example of ideal buyer persona for project manager to sell best project administration tool. It includes elements such as background information, location, hobbies, role, income, interests, values, goals, challenges etc. If your project calls for a presentation, then Slidegeeks is your go to partner because we have professionally designed, easy to edit templates that are perfect for any presentation. After downloading, you can easily edit Niche Marketing Guide To Target Specific Customer Groups Sample Project Manager Buyer Persona Infographics PDF and make the changes accordingly. You can rearrange slides or fill them with different images. Check out all the handy templates

Shareholders Engagement Communication Plan Target Infographics PDF
The mentioned slide delineates the communication plan of shareholders which assists to address their concerns . It also includes elements like campaign name, communication type, priority, start date , end date etc. Pitch your topic with ease and precision using this Shareholders Engagement Communication Plan Target Infographics PDF. This layout presents information on Communication Success, Investment Community, Awareness. It is also available for immediate download and adjustment. So, changes can be made in the color, design, graphics or any other component to create a unique layout.
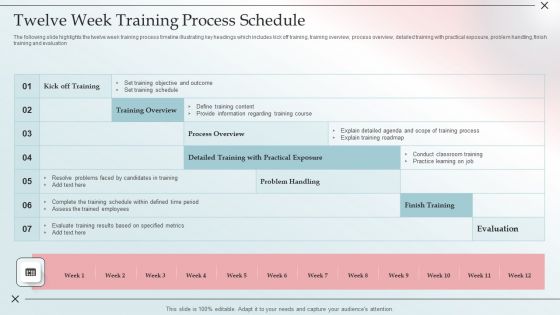
Twelve Week Training Process Schedule Infographics PDF
The following slide highlights the twelve week training process timeline illustrating key headings which includes kick off training, training overview, process overview, detailed training with practical exposure, problem handling, finish training and evaluation Pitch your topic with ease and precision using this Twelve Week Training Process Schedule Infographics PDF. This layout presents information on Evaluation, Training Process, Specified Metrics. It is also available for immediate download and adjustment. So, changes can be made in the color, design, graphics or any other component to create a unique layout.

Highly Ranked Ethical Investing Stocks Infographics PDF
This slide represents the ten best stocks for ethical investments. It includes details related to the overall , growth, valuation, efficiency, financial strength, dividends and momentum rating scores. Pitch your topic with ease and precision using this Highly Ranked Ethical Investing Stocks Infographics PDF. This layout presents information on Valuation Ratings Score, Growth Ratings Score, Financial Strength Ratings Score. It is also available for immediate download and adjustment. So, changes can be made in the color, design, graphics or any other component to create a unique layout.

Customer Invoice System Software Checklist Infographics PDF
The following slide showcases checklist of payment system software to ensure smooth operations in an organization. Key information covered are support recurring billing, auto-generated invoice, record payments, faster GST filing and payment recovery.Pitch your topic with ease and precision using this Customer Invoice System Software Checklist Infographics PDF. This layout presents information on Support Recurring, Recover Payments, Record Payments. It is also available for immediate download and adjustment. So, changes can be made in the color, design, graphics or any other component to create a unique layout.

SEO Content Review Sheet Overview Infographics PDF
The following slide highlights the progress status of SEO content audit to directly track the metrics and achieve marketing goals. It includes key elements such as content type, topic, assigned to, month, progress, keywords etc. Pitch your topic with ease and precision using this SEO Content Review Sheet Overview Infographics PDF. This layout presents information on Serving Recipes, Benefits Of Healthy, Food Preservation Process. It is also available for immediate download and adjustment. So, changes can be made in the color, design, graphics or any other component to create a unique layout.
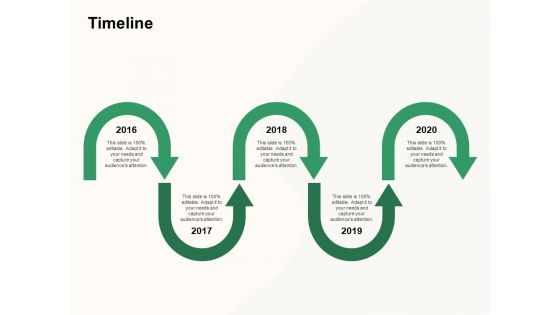
How To Effectively Manage A Construction Project Timeline Infographics PDF
Presenting how to effectively manage a construction project timeline infographics pdf. to provide visual cues and insights. Share and navigate important information on five stages that need your due attention. This template can be used to pitch topics like timeline, 2016 to 2020. In addtion, this PPT design contains high resolution images, graphics, etc, that are easily editable and available for immediate download.

Risk Assessment Ppt PowerPoint Presentation Infographics Inspiration
This is a risk assessment ppt powerpoint presentation infographics inspiration. This is a four stage process. The stages in this process are brief description of risk, date of risk occurring , medium, low, high.
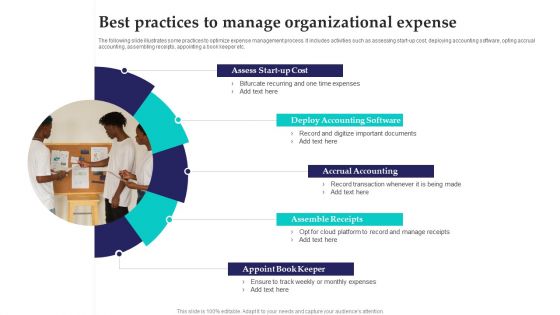
Best Practices To Manage Organizational Expense Infographics PDF
The following slide illustrates some practices to optimize expense management process. It includes activities such as assessing start up cost, deploying accounting software, opting accrual accounting, assembling receipts, appointing a book keeper etc. Presenting Best Practices To Manage Organizational Expense Infographics PDF to dispense important information. This template comprises five stages. It also presents valuable insights into the topics including Deploy Accounting Software, Accrual Accounting, Assemble Receipts. This is a completely customizable PowerPoint theme that can be put to use immediately. So, download it and address the topic impactfully.

Procedure Ppt PowerPoint Presentation Infographics Clipart
This is a procedure ppt powerpoint presentation infographics clipart. This is a six stage process. The stages in this process are risk planning, risk monitoring, risk assessment, risk identification, risk register.

Members Performance Assessment Survey Form For Reporting Manager Infographics PDF
This slide covers survey to provide opinion about team manager. It includes series of questions to be answered by team members and rate accordingly. Presenting Members Performance Assessment Survey Form For Reporting Manager Infographics PDF to dispense important information. This template comprises one stages. It also presents valuable insights into the topics including Clear Communication, About Team, Goals And Objectives. This is a completely customizable PowerPoint theme that can be put to use immediately. So, download it and address the topic impactfully.

Effective Hiring Plan By Human Resource Manager Infographics PDF
This slide covers action plan for recruitment by HR department. It includes various activities ranging from development of PMT, deciding salary structure, approval for recruitment budget, etc. Presenting Effective Hiring Plan By Human Resource Manager Infographics PDF to dispense important information. This template comprises four stages. It also presents valuable insights into the topics including Develop, Advertising, Print Media. This is a completely customizable PowerPoint theme that can be put to use immediately. So, download it and address the topic impactfully.

Project Issues Escalation Matrix Design Infographics PDF
This slide illustrate information about issues and ticket raised by customer in more efficient and effective manner without any compromising. It includes elements such as customer support representative, account manger, product management, director etc. Showcasing this set of slides titled Project Issues Escalation Matrix Design Infographics PDF. The topics addressed in these templates are Response, Escalation, Resolve Issue. All the content presented in this PPT design is completely editable. Download it and make adjustments in color, background, font etc. as per your unique business setting.
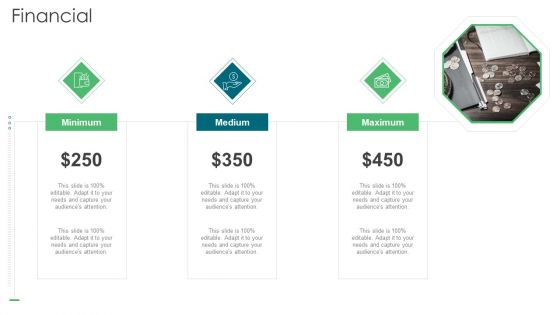
Environmental Assessment Financial Ppt Inspiration Infographics PDF
This is a environmental assessment financial ppt inspiration infographics pdf template with various stages. Focus and dispense information on three stages using this creative set, that comes with editable features. It contains large content boxes to add your information on topics like minimum, medium, maximum. You can also showcase facts, figures, and other relevant content using this PPT layout. Grab it now.
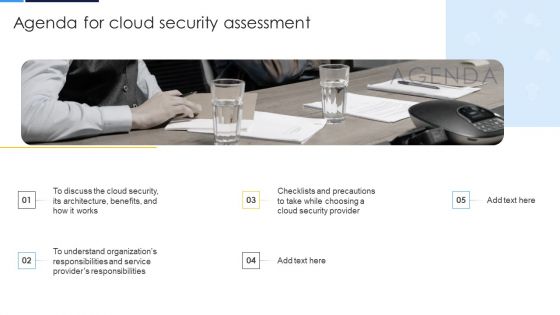
Agenda For Cloud Security Assessment Infographics PDF
Presenting Agenda For Cloud Security Assessment Infographics PDF to provide visual cues and insights. Share and navigate important information on five stages that need your due attention. This template can be used to pitch topics like Agenda In addtion, this PPT design contains high resolution images, graphics, etc, that are easily editable and available for immediate download.
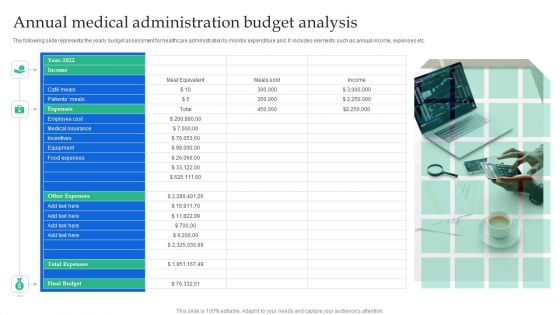
Annual Medical Administration Budget Analysis Infographics PDF
The following slide represents the yearly budget assessment for healthcare administration to monitor expenditure and. It includes elements such as annual income, expenses etc.Presenting Annual Medical Administration Budget Analysis Infographics PDF to dispense important information. This template comprises one stage. It also presents valuable insights into the topics including Medical Insurance, Equipment, Total Expenses. This is a completely customizable PowerPoint theme that can be put to use immediately. So, download it and address the topic impactfully.
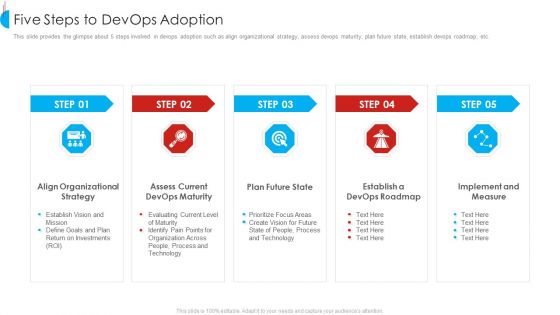
Five Steps To Devops Adoption Infographics PDF
Presenting five steps to devops adoption infographics pdf to provide visual cues and insights. Share and navigate important information on five stages that need your due attention. This template can be used to pitch topics like organizational strategy, assess current devops maturity, plan future state. In addtion, this PPT design contains high resolution images, graphics, etc, that are easily editable and available for immediate download.

Merger Partner Attractiveness Assessment Checklist Infographics PDF
This slide provides information regarding checklist to analyze merger partner attractiveness for further business expansion. The partner attractiveness is assessed through several parameters such as organization size, financial status, long term sustainability, etc. Do you have an important presentation coming up Are you looking for something that will make your presentation stand out from the rest Look no further than Merger Partner Attractiveness Assessment Checklist Infographics PDF. With our professional designs, you can trust that your presentation will pop and make delivering it a smooth process. And with Slidegeeks, you can trust that your presentation will be unique and memorable. So why wait Grab Merger Partner Attractiveness Assessment Checklist Infographics PDF today and make your presentation stand out from the rest.
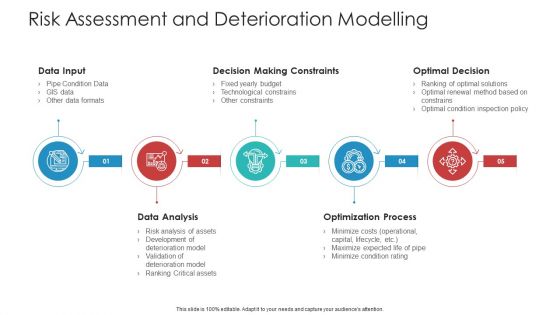
Risk Assessment And Deterioration Modelling Infographics PDF
This is a risk assessment and deterioration modelling infographics pdf template with various stages. Focus and dispense information on five stages using this creative set, that comes with editable features. It contains large content boxes to add your information on topics like data input, data analysis, optimization process, decision making constraints, optimal decision. You can also showcase facts, figures, and other relevant content using this PPT layout. Grab it now.
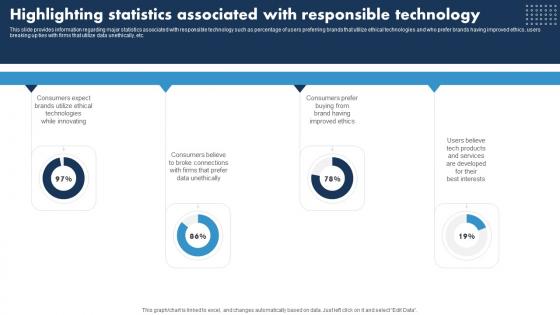
Highlighting Statistics Associated Esponsible Tech Guide To Manage Infographics Pdf
This slide provides information regarding major statistics associated with responsible technology such as percentage of users preferring brands that utilize ethical technologies and who prefer brands having improved ethics, users breaking up ties with firms that utilize data unethically, etc. Coming up with a presentation necessitates that the majority of the effort goes into the content and the message you intend to convey. The visuals of a PowerPoint presentation can only be effective if it supplements and supports the story that is being told. Keeping this in mind our experts created Highlighting Statistics Associated Esponsible Tech Guide To Manage Infographics Pdf to reduce the time that goes into designing the presentation. This way, you can concentrate on the message while our designers take care of providing you with the right template for the situation.
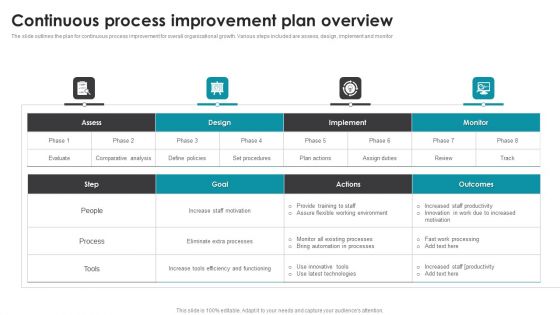
Continuous Process Improvement Plan Overview Infographics PDF
The slide outlines the plan for continuous process improvement for overall organizational growth. Various steps included are assess, design, implement and monitor. Showcasing this set of slides titled Continuous Process Improvement Plan Overview Infographics PDF. The topics addressed in these templates are Increase Staff Motivation, Eliminate Extra Processes, Increase Tools Efficiency. All the content presented in this PPT design is completely editable. Download it and make adjustments in color, background, font etc. as per your unique business setting.
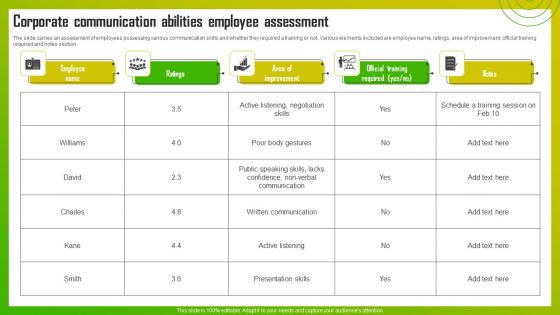
Corporate Communication Abilities Employee Assessment Infographics PDF
The slide carries an assessment of employees possessing various communication skills and whether they required a training or not. Various elements included are employee name, ratings, area of improvement, official training required and notes section. Showcasing this set of slides titled Corporate Communication Abilities Employee Assessment Infographics PDF. The topics addressed in these templates are Abilities Employee Assessment, Corporate Communication. All the content presented in this PPT design is completely editable. Download it and make adjustments in color, background, font etc. as per your unique business setting.
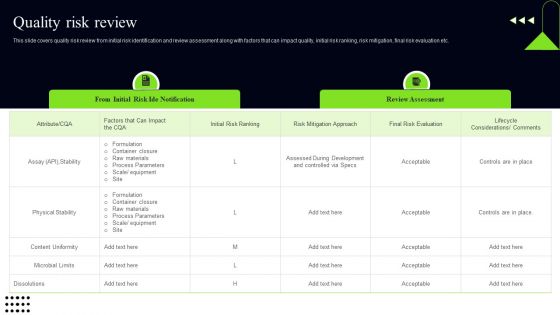
Quality Assessment Quality Risk Review Infographics PDF
This slide covers quality risk review from initial risk identification and review assessment along with factors that can impact quality, initial risk ranking, risk mitigation, final risk evaluation etc. The best PPT templates are a great way to save time, energy, and resources. Slidegeeks have 100 percent editable powerpoint slides making them incredibly versatile. With these quality presentation templates, you can create a captivating and memorable presentation by combining visually appealing slides and effectively communicating your message. Download Quality Assessment Quality Risk Review Infographics PDF from Slidegeeks and deliver a wonderful presentation.
Eight Key Questions With Icons And Query Sign Ppt PowerPoint Presentation Infographics Infographics PDF
Pitch your topic with ease and precision using this eight key questions with icons and query sign ppt powerpoint presentation infographics infographics pdf. This layout presents information on eight key questions with icons and query sign. It is also available for immediate download and adjustment. So, changes can be made in the color, design, graphics or any other component to create a unique layout.

Dynamic Malware Assessment Flow Chart Infographics PDF
This slide illustrates malware analysis flowchart which companies employ to learn from past attack and create more secure infrastructure for future. The elements covered in this slide are live operating system, volatile memory forensics and slide channel analysis. Showcasing this set of slides titled Dynamic Malware Assessment Flow Chart Infographics PDF. The topics addressed in these templates are Live Operating System, Volatile Memory Forensics, Slide Channel Analysis. All the content presented in this PPT design is completely editable. Download it and make adjustments in color, background, font etc. as per your unique business setting.

Business Competitive Edge Diagram Ppt Infographics
This is a business competitive edge diagram ppt infographics. This is a seven stage process. The stages in this process are surveys and assessment, coaching, meeting management, retail, insurance, human resources, finance and accounting.
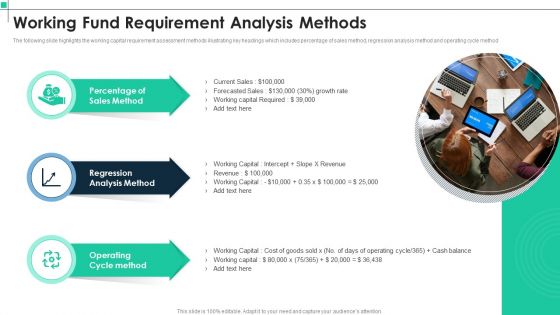
Working Fund Requirement Analysis Methods Infographics PDF
The following slide highlights the working capital requirement assessment methods illustrating key headings which includes percentage of sales method, regression analysis method and operating cycle method. Persuade your audience using this Working Fund Requirement Analysis Methods Infographics PDF. This PPT design covers three stages, thus making it a great tool to use. It also caters to a variety of topics including Sales Method, Regression Analysis Method, Operating Cycle Method. Download this PPT design now to present a convincing pitch that not only emphasizes the topic but also showcases your presentation skills.
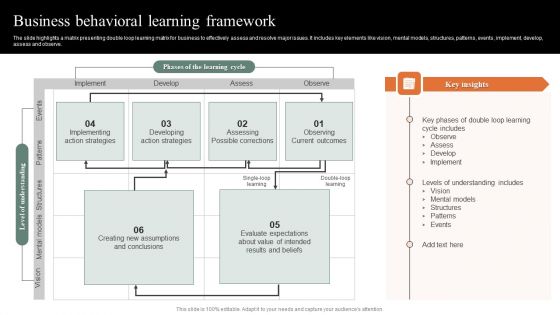
Business Behavioral Learning Framework Infographics PDF
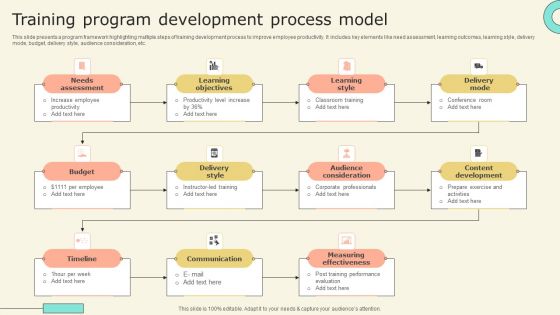
Training Program Development Process Model Infographics PDF
This slide presents a program framework highlighting multiple steps of training development process to improve employee productivity. It includes key elements like need assessment, learning outcomes, learning style, delivery mode, budget, delivery style, audience consideration, etc. Persuade your audience using this Training Program Development Process Model Infographics PDF. This PPT design covers eleven stages, thus making it a great tool to use. It also caters to a variety of topics including Needs Assessment, Learning Objectives, Learning Style . Download this PPT design now to present a convincing pitch that not only emphasizes the topic but also showcases your presentation skills.
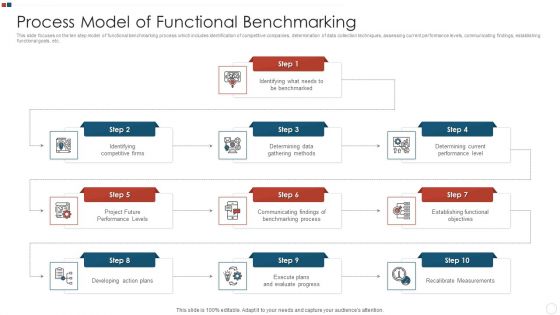
Process Model Of Functional Benchmarking Infographics PDF
This slide focuses on the ten step model of functional benchmarking process which includes identification of competitive companies, determination of data collection techniques, assessing current performance levels, communicating findings, establishing functional goals, etc.Presenting Process Model Of Functional Benchmarking Infographics PDF to dispense important information. This template comprises ten stages. It also presents valuable insights into the topics including Identifying, Competitive Firms, Determining Data, Gathering Methods This is a completely customizable PowerPoint theme that can be put to use immediately. So, download it and address the topic impactfully.
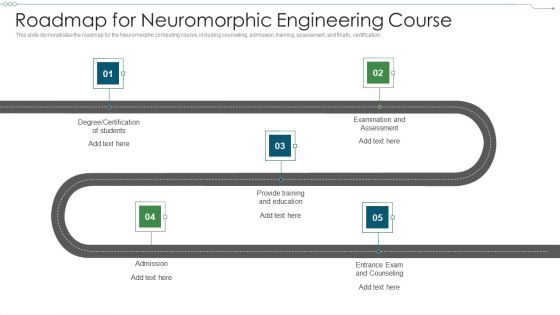
Roadmap For Neuromorphic Engineering Course Infographics PDF
This slide demonstrates the roadmap for the Neuromorphic computing course, including counseling, admission, training, assessment, and finally, certification. Presenting Roadmap For Neuromorphic Engineering Course Infographics PDF to provide visual cues and insights. Share and navigate important information on five stages that need your due attention. This template can be used to pitch topics like Degree Certification Of Students, Examination And Assessment, Provide Training And Education In addtion, this PPT design contains high resolution images, graphics, etc, that are easily editable and available for immediate download.
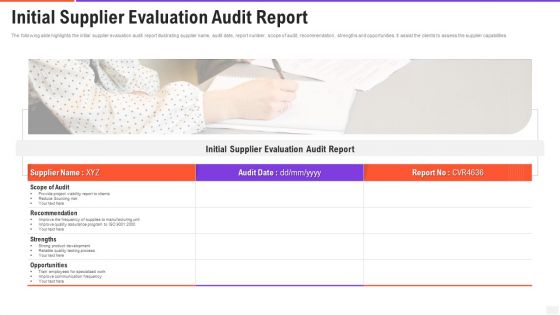
Initial Supplier Evaluation Audit Report Infographics PDF
The following slide highlights the initial supplier evaluation audit report illustrating supplier name, audit date, report number, scope of audit, recommendation, strengths and opportunities. It assist the clients to assess the supplier capabilities. Presenting initial supplier evaluation audit report infographics pdf to dispense important information. This template comprises one stages. It also presents valuable insights into the topics including scope of audit, recommendation, opportunities. This is a completely customizable PowerPoint theme that can be put to use immediately. So, download it and address the topic impactfully.
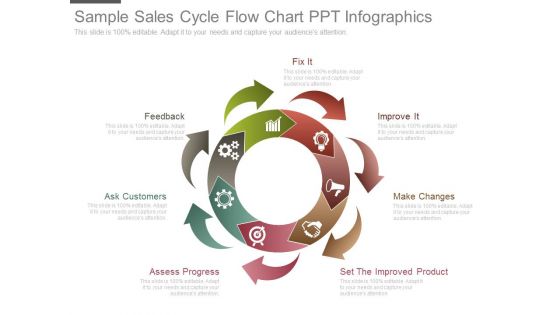
Sample Sales Cycle Flow Chart Ppt Infographics
This is a sample sales cycle flow chart ppt infographics. This is a seven stage process. The stages in this process are fix it, feedback, ask customers, assess progress, set the improved product, make changes, improve it.

Initial Assessment Business Template Ppt Infographics
This is a initial assessment business template ppt infographics. This is a four stage process. The stages in this process are achieve, action, ask, assess.

Quarterly Security Business Growth Assessment Roadmap Infographics
Presenting our jaw-dropping quarterly security business growth assessment roadmap infographics. You can alternate the color, font size, font type, and shapes of this PPT layout according to your strategic process. This PPT presentation is compatible with Google Slides and is available in both standard screen and widescreen aspect ratios. You can also download this well-researched PowerPoint template design in different formats like PDF, JPG, and PNG. So utilize this visually-appealing design by clicking the download button given below.

 Home
Home