AI PPT Maker
Templates
PPT Bundles
Design Services
Business PPTs
Business Plan
Management
Strategy
Introduction PPT
Roadmap
Self Introduction
Timelines
Process
Marketing
Agenda
Technology
Medical
Startup Business Plan
Cyber Security
Dashboards
SWOT
Proposals
Education
Pitch Deck
Digital Marketing
KPIs
Project Management
Product Management
Artificial Intelligence
Target Market
Communication
Supply Chain
Google Slides
Research Services
 One Pagers
All Categories
-
Home
- Customer Favorites
- Capital Investment
Capital Investment

Bar Chart Ppt PowerPoint Presentation Styles Outfit
This is a bar chart ppt powerpoint presentation styles outfit. This is a Seven stage process. The stages in this process are sales in percentage, financial years, graph, business.

Clustered Column Ppt PowerPoint Presentation Pictures Mockup
This is a clustered column ppt powerpoint presentation pictures mockup. This is a two stage process. The stages in this process are product, sales in percentage, financial year, graph, business.
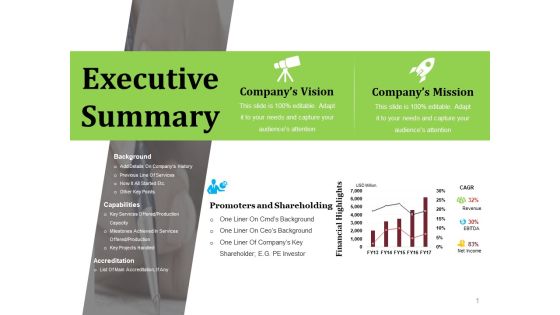
Executive Summary Ppt PowerPoint Presentation Ideas Professional
This is a executive summary ppt powerpoint presentation ideas professional. This is a two stage process. The stages in this process are company s vision, company s mission, promoters and shareholding, financial highlights.

Clustered Column Ppt PowerPoint Presentation File Slide
This is a clustered column ppt powerpoint presentation file slide. This is a two stage process. The stages in this process are product, financial year, sales in percentage, bar graph.

Executive Summary Ppt PowerPoint Presentation Professional Example
This is a executive summary ppt powerpoint presentation professional example. This is a four stage process. The stages in this process are background, capabilities, accreditation, promoters and shareholding, financial highlights.

Area Chart Ppt PowerPoint Presentation Layouts Maker
This is a area chart ppt powerpoint presentation layouts maker. This is a two stage process. The stages in this process are financial year, sales in percentage, graph, business, marketing.

Clustered Column Ppt PowerPoint Presentation Slides Smartart
This is a clustered column ppt powerpoint presentation slides smartart. This is a two stage process. The stages in this process are product, sales in percentage, financial year, bar graph.

Clustered Column Ppt PowerPoint Presentation File Graphics
This is a clustered column ppt powerpoint presentation file graphics. This is a two stage process. The stages in this process are product, financial year, sales in percentage, graph, growth.

area chart ppt powerpoint presentation professional elements
This is a area chart ppt powerpoint presentation professional elements. This is a two stage process. The stages in this process are financial year sales in percentage, business, marketing, graph.

Bar Chart Ppt PowerPoint Presentation File Slide
This is a bar chart ppt powerpoint presentation file slide. This is a one stage process. The stages in this process are sales in percentage financial years, business, marketing, strategy, graph.

Clustered Column Ppt PowerPoint Presentation Show Graphics
This is a clustered column ppt powerpoint presentation show graphics. This is a two stage process. The stages in this process are financial year, sales in percentage, business, marketing, graph.

Bar Chart Ppt PowerPoint Presentation Diagram Lists
This is a bar chart ppt powerpoint presentation diagram lists. This is a two stage process. The stages in this process are business, marketing, financial years, sales in percentage, graph.
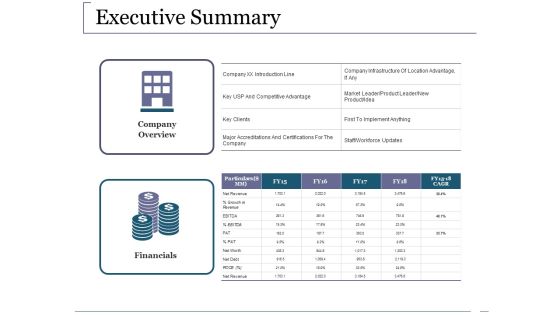
Executive Summary Ppt PowerPoint Presentation Layouts Example Topics
This is a executive summary ppt powerpoint presentation layouts example topics. This is a two stage process. The stages in this process are company overview, financials, particulars, business, marketing.

Bar Chart Ppt PowerPoint Presentation Visual Aids Diagrams
This is a bar chart ppt powerpoint presentation visual aids diagrams. This is a two stage process. The stages in this process are business, marketing, financial years, sales in percentage, graph.

Clustered Column Ppt PowerPoint Presentation Gallery Format
This is a clustered column ppt powerpoint presentation gallery format. This is a two stage process. The stages in this process are business, marketing, graph, financial year, sales in percentage.
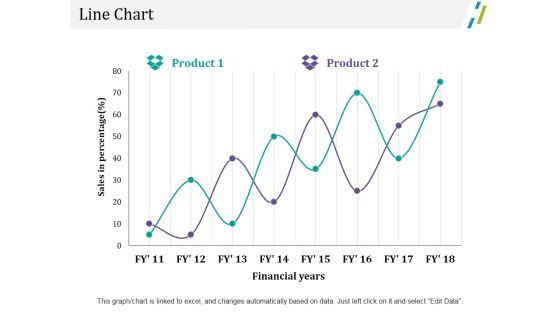
Line Chart Ppt PowerPoint Presentation Outline File Formats
This is a line chart ppt powerpoint presentation outline file formats. This is a two stage process. The stages in this process are business, marketing, sales in percentage, financial years, chart.

Line Chart Ppt PowerPoint Presentation Outline Ideas
This is a line chart ppt powerpoint presentation outline ideas. This is a two stage process. The stages in this process are business, marketing, financial years, sales in percentage, strategy.
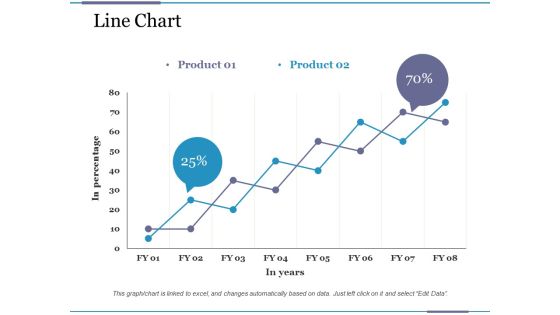
Line Chart Ppt PowerPoint Presentation Pictures File Formats
This is a line chart ppt powerpoint presentation pictures file formats. This is a two stage process. The stages in this process are business, financial, in percentage, in years, graph.

Column Chart Ppt PowerPoint Presentation Infographic Template Icon
This is a column chart ppt powerpoint presentation infographic template icon. This is a two stage process. The stages in this process are business, marketing, sales in percentage, financial year, graph.

Column Chart Ppt PowerPoint Presentation Show Structure
This is a column chart ppt powerpoint presentation show structure. This is a two stage process. The stages in this process are business, financial year in, sales in percentage, marketing, graph.

Area Chart Ppt PowerPoint Presentation Icon Aids
This is a area chart ppt powerpoint presentation icon aids. This is a three stage process. The stages in this process are financial years, sales in percentage, business, marketing, graph.

Bar Chart Ppt PowerPoint Presentation Summary Themes
This is a bar chart ppt powerpoint presentation summary themes. This is a three stage process. The stages in this process are financial years, sales in percentage, business, marketing, graph.

Area Chart Ppt PowerPoint Presentation Model Demonstration
This is a area chart ppt powerpoint presentation model demonstration. This is a two stage process. The stages in this process are business, marketing, financial year, in percentage, graph.

Bar Graph Ppt PowerPoint Presentation Infographics Icon
This is a bar graph ppt powerpoint presentation infographics icon. This is a two stage process. The stages in this process are business, marketing, financial year, in percentage, graph.

Combo Chart Ppt PowerPoint Presentation Summary Background Images
This is a combo chart ppt powerpoint presentation summary background images. This is a two stage process. The stages in this process are business, marketing, financial year, in percentage, graph.

Clustered Column Ppt PowerPoint Presentation Infographic Template Backgrounds
This is a clustered column ppt powerpoint presentation infographic template backgrounds. This is a two stage process. The stages in this process are sales in percentage, financial year, product.

Area Chart Ppt PowerPoint Presentation Model Inspiration
This is a area chart ppt powerpoint presentation model inspiration. This is a two stage process. The stages in this process are financial year, in percentage, area chart, business, marketing.

Bar Chart Ppt PowerPoint Presentation Infographic Template Picture
This is a bar chart ppt powerpoint presentation infographic template picture. This is a two stage process. The stages in this process are financial, in percentage, business, marketing, bar chart.

Combo Chart Ppt PowerPoint Presentation Model Vector
This is a combo chart ppt powerpoint presentation model vector. This is a two stage process. The stages in this process are financial year, in percentage, business, marketing, combo chart.
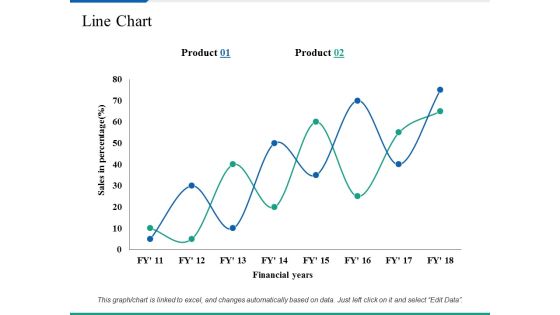
Line Chart Ppt PowerPoint Presentation Summary Clipart Images
This is a line chart ppt powerpoint presentation summary clipart images. This is a two stage process. The stages in this process are business, marketing, sales in percentage, financial years, strategy.

Stacked Area Clustered Column Ppt PowerPoint Presentation Portfolio Sample
This is a stacked area clustered column ppt powerpoint presentation portfolio sample. This is a three stage process. The stages in this process are stacked area, clustered column, financial, strategy, business, planning.

Area Chart Ppt PowerPoint Presentation Model Slide Portrait
This is a area chart ppt powerpoint presentation model slide portrait. This is a two stage process. The stages in this process are area chart, financial, business, marketing, planning, strategy.

Column Chart Ppt PowerPoint Presentation Background Images
This is a column chart ppt powerpoint presentation background images. This is a two stage process. The stages in this process are column chart, financial, business, marketing, planning, strategy.

Content Distribution Matrix Ppt PowerPoint Presentation Professional Graphics Template
This is a content distribution matrix ppt powerpoint presentation professional graphics template. This is a two stage process. The stages in this process are business, management, financial, marketing, sales.
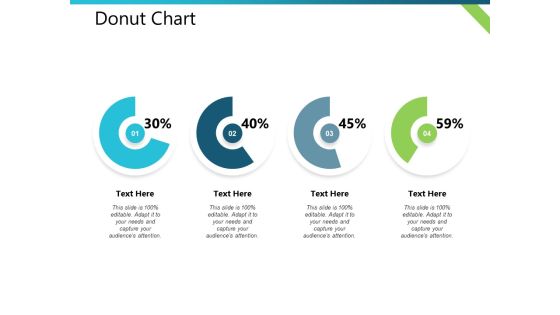
Donut Chart Distribution Plan Ppt PowerPoint Presentation Visual Aids Outline
This is a donut chart distribution plan ppt powerpoint presentation visual aids outline. This is a four stage process. The stages in this process are business, management, financial, marketing, strategy.

Employee Performance Measurement Kpi Ppt PowerPoint Presentation Inspiration Design Inspiration
This is a employee performance measurement kpi ppt powerpoint presentation inspiration design inspiration. This is a four stage process. The stages in this process are financial, business, management, marketing.

Bar Graph Icon For Data Analysis Ppt PowerPoint Presentation Pictures Ideas
This is a bar graph icon for data analysis ppt powerpoint presentation pictures ideas. This is a four stage process. The stages in this process are financial analysis, quantitative, statistical modelling.
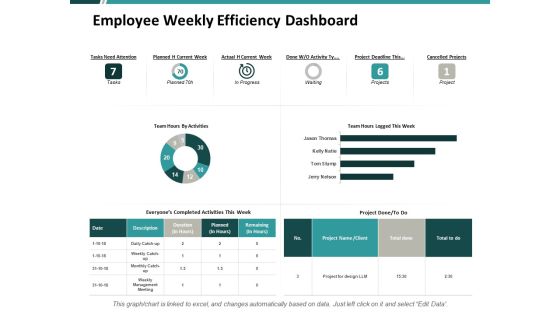
Employee Weekly Efficiency Dashboard Ppt PowerPoint Presentation Portfolio Show
This is a employee weekly efficiency dashboard ppt powerpoint presentation portfolio show. This is a three stage process. The stages in this process are financial, minimum, maximum, marketing, strategy.
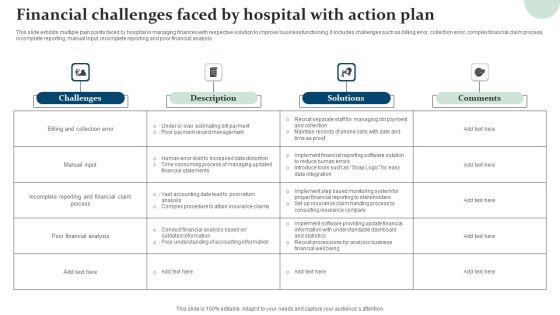
Financial Challenges Faced By Hospital With Action Plan Structure PDF
This slide exhibits multiple pain points faced by hospital in managing finances with respective solution to improve business functioning. It includes challenges such as billing error, collection error, complex financial claim process, incomplete reporting, manual input, incomplete reporting and poor financial analysis. Showcasing this set of slides titled Financial Challenges Faced By Hospital With Action Plan Structure PDF. The topics addressed in these templates are Challenges, Solutions, Poor Financial Analysis, Manual Input. All the content presented in this PPT design is completely editable. Download it and make adjustments in color, background, font etc. as per your unique business setting.
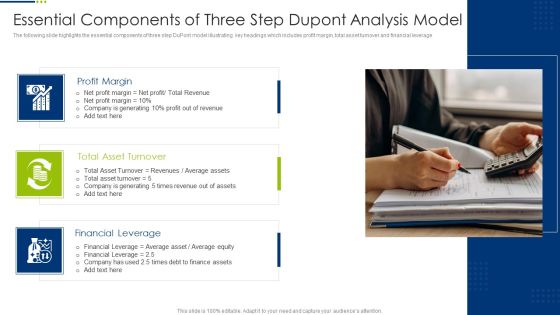
Essential Components Of Three Step Dupont Analysis Model Diagrams PDF
The following slide highlights the essential components of three step DuPont model illustrating key headings which includes profit margin, total asset turnover and financial leverage. Presenting Essential Components Of Three Step Dupont Analysis Model Diagrams PDF to dispense important information. This template comprises three stages. It also presents valuable insights into the topics including Profit Margin, Total Asset Turnover, Financial Leverage. This is a completely customizable PowerPoint theme that can be put to use immediately. So, download it and address the topic impactfully.
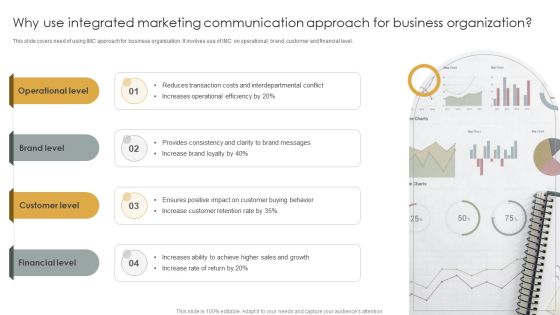
Why Use Integrated Marketing Communication Approach For Business Organization Elements PDF
This slide covers need of using IMC approach for business organization. It involves use of IMC on operational, brand, customer and financial level. Presenting Why Use Integrated Marketing Communication Approach For Business Organization Elements PDF to dispense important information. This template comprises four stages. It also presents valuable insights into the topics including Operational Level, Brand Level, Customer Level, Financial Level. This is a completely customizable PowerPoint theme that can be put to use immediately. So, download it and address the topic impactfully.
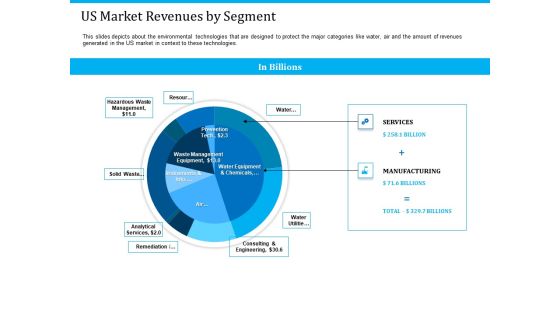
Pathways To Envirotech Sustainability Us Market Revenues By Segment Diagrams PDF
Deliver an awe inspiring pitch with this creative pathways to envirotech sustainability us market revenues by segment diagrams pdf bundle. Topics like services, manufacturing, resource, management can be discussed with this completely editable template. It is available for immediate download depending on the needs and requirements of the user.

A Step Towards Environmental Preservation Us Market Revenues By Segment Information PDF
Deliver an awe inspiring pitch with this creative a step towards environmental preservation us market revenues by segment information pdf bundle. Topics like services, manufacturing, resource, management can be discussed with this completely editable template. It is available for immediate download depending on the needs and requirements of the user.

Financial Tips For New Business In Circular Layout Ppt PowerPoint Presentation Infographic Template Ideas PDF
Persuade your audience using this financial tips for new business in circular layout ppt powerpoint presentation infographic template ideas pdf. This PPT design covers eight stages, thus making it a great tool to use. It also caters to a variety of topics including cash flow management is key, track and monitor all spending, limit fixed expenses, be realistic and prepare for worst, focus on customer acquisition, value time, dont mix business and personal funds, establish financial goals. Download this PPT design now to present a convincing pitch that not only emphasizes the topic but also showcases your presentation skills.
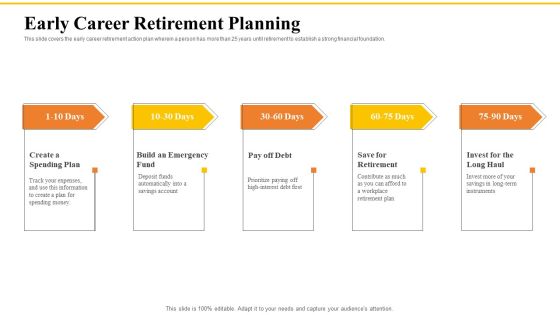
Financial Plans For Retirement Planning Early Career Retirement Planning Ppt Portfolio Slides PDF
This slide covers the early career retirement action plan wherein a person has more than 25 years until retirement to establish a strong financial foundation. Presenting financial plans for retirement planning early career retirement planning ppt portfolio slides pdf to provide visual cues and insights. Share and navigate important information on five stages that need your due attention. This template can be used to pitch topics like plan, retirement, expenses, deposit funds. In addtion, this PPT design contains high resolution images, graphics, etc, that are easily editable and available for immediate download.
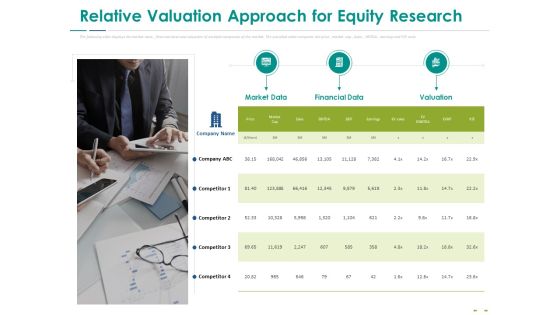
Stock Market Research Report Relative Valuation Approach For Equity Research Inspiration PDF
The following slide displays the market data, financial data and valuation of multiple companies of the market. The provided table compares the price, market cap, Sales, EBITDA, earning and P or E ratio. Presenting stock market research report relative valuation approach for equity research inspiration pdf to provide visual cues and insights. Share and navigate important information on one stages that need your due attention. This template can be used to pitch topics like market data, financial data, valuation. In addition, this PPT design contains high-resolution images, graphics, etc, that are easily editable and available for immediate download.

Merger And Acquisition Buying Strategy For Business Growth Why Is This The Most Appropriate Company Inspiration PDF
The slide outlines the important considerations for selecting the best firm for purchase. Reasonable pricing, minimal debt on target firm, strategic location and activities, solid financials, robust cash flows, and so on are all important factors. Presenting Merger And Acquisition Buying Strategy For Business Growth Why Is This The Most Appropriate Company Inspiration PDF to provide visual cues and insights. Share and navigate important information on three stages that need your due attention. This template can be used to pitch topics like Strategic Location And Operations, Reasonable Asking Price, Healthy Financials. In addtion, this PPT design contains high resolution images, graphics, etc, that are easily editable and available for immediate download.

Marketing Qualified Leads MQL Performance Measurement Dashboard Ppt Icon Examples PDF
This slide shows dashboard for tracking performance of generated marketing qualified leads. It shows details related to audience, prospects and also shows details related to financial KPIs. Persuade your audience using this Marketing Qualified Leads MQL Performance Measurement Dashboard Ppt Icon Examples PDF. This PPT design covers one stages, thus making it a great tool to use. It also caters to a variety of topics including Audience, Closing Percentage, Per Lead Category, Financial KPIs. Download this PPT design now to present a convincing pitch that not only emphasizes the topic but also showcases your presentation skills.

Potential Application Of Bitcoin Blockchain Technology Worldwide Brochure PDF
The slide shows the implementation of Bitcoin blockchain in multiple industries. It includes industries such as Automotive, Financial Services, Voting and Healthcare. Persuade your audience using this Potential Application Of Bitcoin Blockchain Technology Worldwide Brochure PDF. This PPT design covers four stages, thus making it a great tool to use. It also caters to a variety of topics including Automotive, Financial Service, Voting, Healthcare. Download this PPT design now to present a convincing pitch that not only emphasizes the topic but also showcases your presentation skills.
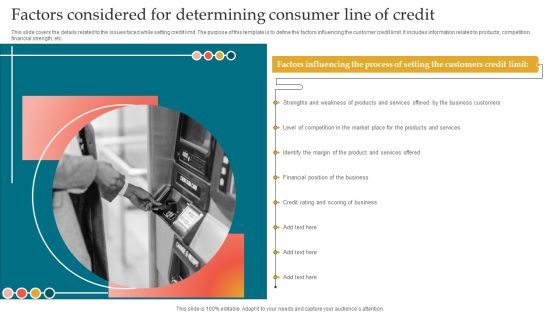
Factors Considered For Determining Consumer Line Of Credit Infographics PDF
This slide covers the details related to the issues faced while setting credit limit. The purpose of this template is to define the factors influencing the customer credit limit. It includes information related to products, competition, financial strength, etc. Presenting Factors Considered For Determining Consumer Line Of Credit Infographics PDF to dispense important information. This template comprises one stages. It also presents valuable insights into the topics including Business Customers, Products And Services, Financial Position. This is a completely customizable PowerPoint theme that can be put to use immediately. So, download it and address the topic impactfully.

Business Diagram Five Staged Circular Timeline For Financial Report Diagram Presentation Template
This business diagram displays five staged text circles. This diagram is suitable to depict flow of business activities or steps. Download this professional slide to present information in an attractive manner

Process Flowchart For Preparing Financial Statements Clipart PDF
This slide consists of basic accounting process followed by finance personnel to prepare financial statements. Key elements covered in this slide are document collection, recording of journal entries, posting entries to ledger, aligning accounts, reviewing by manager etc. Presenting Process Flowchart For Preparing Financial Statements Clipart PDF to dispense important information. This template comprises seven stages. It also presents valuable insights into the topics including Document Collection, Reviewing By Manager, Preparation Of Financial Statements. This is a completely customizable PowerPoint theme that can be put to use immediately. So, download it and address the topic impactfully.

Cloud Network Diagram With Percentage Data Powerpoint Slides
This PowerPoint template contains graphics of cloud network diagram with percentage values. You may download this PPT slide design to display cloud network and financial strategy. You can easily customize this template to make it more unique as per your need.
Key Focused Points For New Business Plan Ppt PowerPoint Presentation Icon Deck PDF
Presenting key focused points for new business plan ppt powerpoint presentation icon deck pdf to dispense important information. This template comprises one stages. It also presents valuable insights into the topics including financials, business. This is a completely customizable PowerPoint theme that can be put to use immediately. So, download it and address the topic impactfully.
Monthly Company Performance Analysisfinancial Icons PDF
This is a monthly company performance analysisfinancial icons pdf template with various stages. Focus and dispense information on three stages using this creative set, that comes with editable features. It contains large content boxes to add your information on topics like financial. You can also showcase facts, figures, and other relevant content using this PPT layout. Grab it now.

Viable Logistics Network Management Planning And Forecasting Summary PDF
Presenting viable logistics network management non financial measures introduction pdf to provide visual cues and insights. Share and navigate important information on four stages that need your due attention. This template can be used to pitch topics like performance measures. In addtion, this PPT design contains high resolution images, graphics, etc, that are easily editable and available for immediate download.
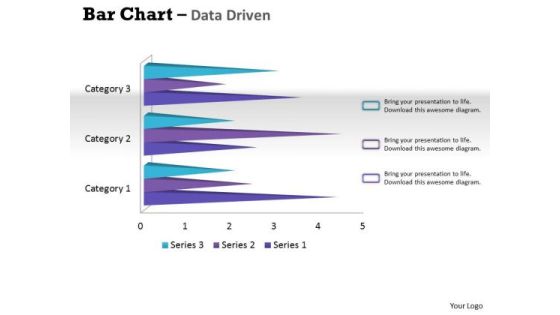
Data Analysis Techniques 3d Bar Chart For Financial Solutions PowerPoint Templates
Make Your Dreams A Reality With Our data analysis techniques 3d bar chart for financial solutions Powerpoint Templates . Your Ideas Will Begin To Take Shape.
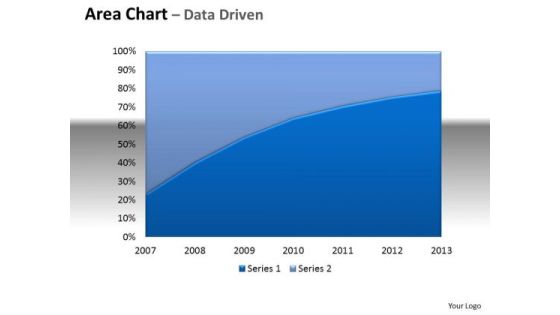
Financial Data Analysis Area Chart With Plotted Line Center PowerPoint Templates
Be The Doer With Our financial data analysis area chart with plotted line center Powerpoint Templates . Put Your Thoughts Into Practice.
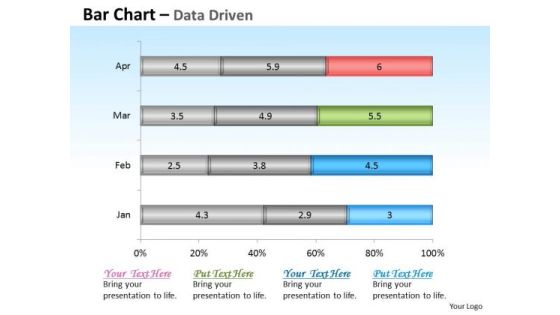
Financial Data Analysis Driven Base Bar Chart Design PowerPoint Slides Templates
Get The Domestics Right With Our financial data analysis driven base bar chart design powerpoint slides Templates . Create The Base For Thoughts To Grow.

Financial Data Analysis Driven Compare Market Share Of Brand PowerPoint Templates
Doll Up Your Thoughts With Our financial data analysis driven compare market share of brand Powerpoint Templates . They Will Make A Pretty Picture.
