AI PPT Maker
Templates
PPT Bundles
Design Services
Business PPTs
Business Plan
Management
Strategy
Introduction PPT
Roadmap
Self Introduction
Timelines
Process
Marketing
Agenda
Technology
Medical
Startup Business Plan
Cyber Security
Dashboards
SWOT
Proposals
Education
Pitch Deck
Digital Marketing
KPIs
Project Management
Product Management
Artificial Intelligence
Target Market
Communication
Supply Chain
Google Slides
Research Services
 One Pagers
All Categories
-
Home
- Customer Favorites
- Capital Investment
Capital Investment
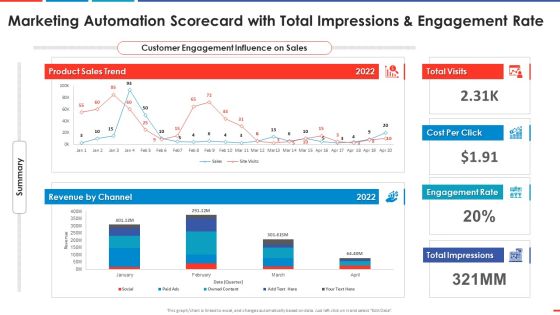
Marketing Automation Scorecard With Total Impression And Automated Business Promotion Scorecard Sample PDF
Deliver and pitch your topic in the best possible manner with this marketing automation scorecard with total impression and automated business promotion scorecard sample pdf. Use them to share invaluable insights on revenue, product sales trend, engagement rate and impress your audience. This template can be altered and modified as per your expectations. So, grab it now.

Data Requirements For Analytics Dashboard For Product Initiatives Clipart PDF
Showcasing this set of slides titled data requirements for analytics dashboard for product initiatives clipart pdf. The topics addressed in these templates are product, customer, revenue. All the content presented in this PPT design is completely editable. Download it and make adjustments in color, background, font etc. as per your unique business setting.
Sales Dashboard With Numbers To Measure Company Performance Icons PDF
Showcasing this set of slides titled Sales Dashboard With Numbers To Measure Company Performance Icons PDF. The topics addressed in these templates are Marketing, Sales, Revenue. All the content presented in this PPT design is completely editable. Download it and make adjustments in color, background, font etc. as per your unique business setting.

Application Release KPI Dashboard For Continuous Delivery Measurement Background PDF
Showcasing this set of slides titled Application Release KPI Dashboard For Continuous Delivery Measurement Background PDF The topics addressed in these templates are Active User Session, Conversion Rate, Revenue By Version All the content presented in this PPT design is completely editable. Download it and make adjustments in color, background, font etc. as per your unique business setting.
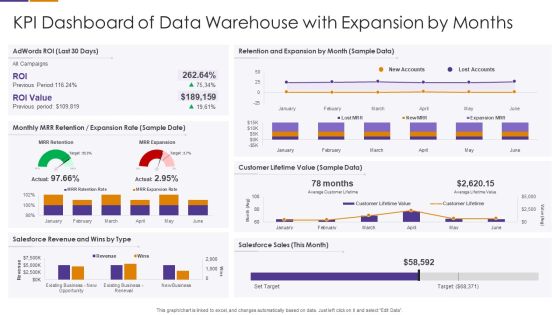
KPI Dashboard Of Data Warehouse With Expansion By Months Themes PDF
Showcasing this set of slides titled KPI Dashboard Of Data Warehouse With Expansion By Months Themes PDF The topics addressed in these templates are Customer Lifetime Value, Salesforce Revenue, Retention And Expansion All the content presented in this PPT design is completely editable. Download it and make adjustments in color, background, font etc. as per your unique business setting.
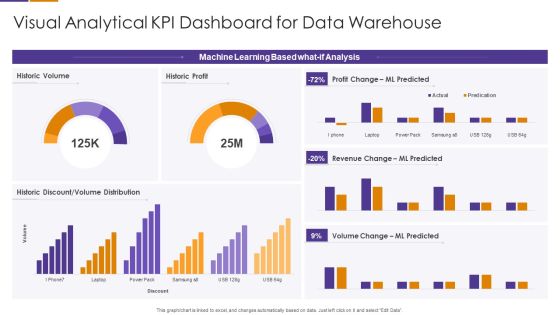
Visual Analytical KPI Dashboard For Data Warehouse Template PDF
Pitch your topic with ease and precision using this Visual Analytical KPI Dashboard For Data Warehouse Template PDF This layout presents information on Machine Learning Based, Volume Change, Revenue Change It is also available for immediate download and adjustment. So, changes can be made in the color, design, graphics or any other component to create a unique layout.
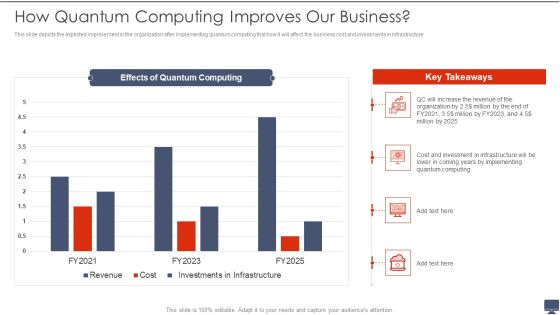
How Quantum Computing Improves Our Business Ppt Inspiration Influencers PDF
Deliver and pitch your topic in the best possible manner with this How Quantum Computing Improves Our Business Ppt Inspiration Influencers PDF. Use them to share invaluable insights on Organization, Revenue, Implementing and impress your audience. This template can be altered and modified as per your expectations. So, grab it now.
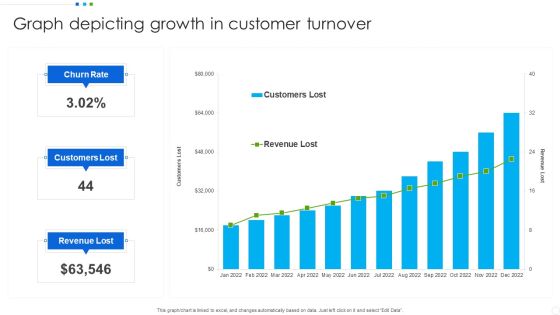
Graph Depicting Growth In Customer Turnover Infographics PDF
Showcasing this set of slides titled Graph Depicting Growth In Customer Turnover Infographics PDF. The topics addressed in these templates are Revenue Lost, Customers Lost, Churn Rate. All the content presented in this PPT design is completely editable. Download it and make adjustments in color, background, font etc. as per your unique business setting.

Monthly Salesforce Scorecard With Top Campaigns Metric Ppt PowerPoint Presentation Show Deck PDF
Deliver an awe inspiring pitch with this creative Monthly Salesforce Scorecard With Top Campaigns Metric Ppt PowerPoint Presentation Show Deck PDF bundle. Topics like Expected Revenue, Marketing Channel, Top Campaigns can be discussed with this completely editable template. It is available for immediate download depending on the needs and requirements of the user.
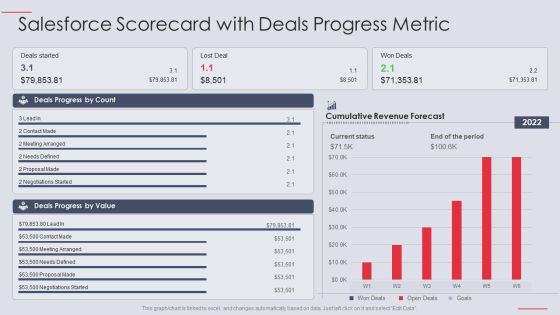
Salesforce Scorecard With Deals Progress Metric Ppt PowerPoint Presentation Layouts Layout PDF
Deliver and pitch your topic in the best possible manner with this Salesforce Scorecard With Deals Progress Metric Ppt PowerPoint Presentation Layouts Layout PDF Use them to share invaluable insights on Cumulative Revenue, Deals Progress, Contact Made and impress your audience. This template can be altered and modified as per your expectations. So, grab it now.
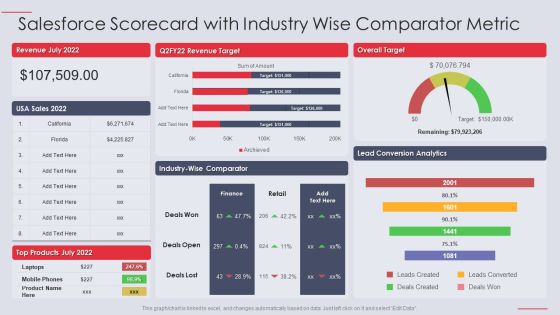
Salesforce Scorecard With Industry Wise Comparator Metric Ppt PowerPoint Presentation Infographic Template Show PDF
Deliver an awe inspiring pitch with this creative Salesforce Scorecard With Industry Wise Comparator Metric Ppt PowerPoint Presentation Infographic Template Show PDF bundle. Topics like Overall Target, Industry Comparator, Revenue can be discussed with this completely editable template. It is available for immediate download depending on the needs and requirements of the user.
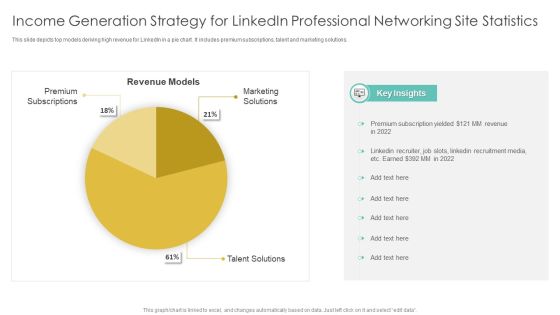
Income Generation Strategy For Linkedin Professional Networking Site Statistics Introduction PDF
Pitch your topic with ease and precision using this Income Generation Strategy For Linkedin Professional Networking Site Statistics Introduction PDF. This layout presents information on Revenue Models, Premium Subscriptions, Marketing Solutions. It is also available for immediate download and adjustment. So, changes can be made in the color, design, graphics or any other component to create a unique layout.

Organizational Transformation Barriers To Digital Transformation Clipart PDF
Deliver an awe inspiring pitch with this creative Organizational Transformation Barriers To Digital Transformation Clipart PDF bundle. Topics like Business Case, Employee Training, Revenue Targets can be discussed with this completely editable template. It is available for immediate download depending on the needs and requirements of the user.

Content Marketing Freelance Metrics Dashboard With Visitor Demographics Icons PDF
Showcasing this set of slides titled Content Marketing Freelance Metrics Dashboard With Visitor Demographics Icons PDF. The topics addressed in these templates are Content Level Metrics, Revenue Generated, Visitor Demographics. All the content presented in this PPT design is completely editable. Download it and make adjustments in color, background, font etc. as per your unique business setting.

IT Company Scorecard With Online Vs Instore Purchase Evaluation Structure PDF
Deliver an awe inspiring pitch with this creative IT Company Scorecard With Online Vs Instore Purchase Evaluation Structure PDF bundle. Topics like Incremental Sales, Products Revenue, Store Purchases can be discussed with this completely editable template. It is available for immediate download depending on the needs and requirements of the user.

Company Business Sales Highlights In Different Years Clipart PDF
Pitch your topic with ease and precision using this Company Business Sales Highlights In Different Years Clipart PDF. This layout presents information on Company Business Sales Highlights, Revenues. It is also available for immediate download and adjustment. So, changes can be made in the color, design, graphics or any other component to create a unique layout.

Customer Attrition Dashboard With Monthly Trends Ppt PowerPoint Presentation Show Vector PDF
Showcasing this set of slides titled Customer Attrition Dashboard With Monthly Trends Ppt PowerPoint Presentation Show Vector PDF. The topics addressed in these templates are Total Revenue, Customer Attrition, Customer Churn. All the content presented in this PPT design is completely editable. Download it and make adjustments in color, background, font etc. as per your unique business setting.
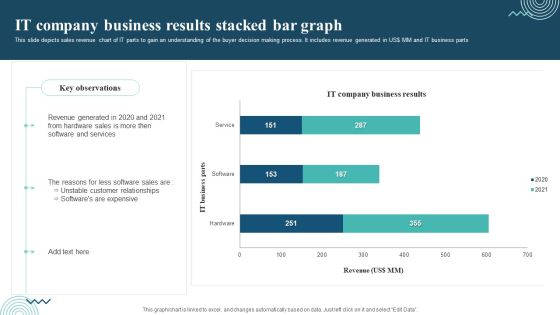
IT Company Business Results Stacked Bar Graph Topics PDF
Showcasing this set of slides titled IT Company Business Results Stacked Bar Graph Topics PDF. The topics addressed in these templates are Revenue Generated, Software And Services, Unstable Customer Relationships. All the content presented in this PPT design is completely editable. Download it and make adjustments in color, background, font etc. As per your unique business setting.

Dashboard For Tracking Organizational OGSM Model Metrics Microsoft PDF
Pitch your topic with ease and precision using this Dashboard For Tracking Organizational OGSM Model Metrics Microsoft PDF. This layout presents information on Revenue, Market Share, Gross Margin. It is also available for immediate download and adjustment. So, changes can be made in the color, design, graphics or any other component to create a unique layout.
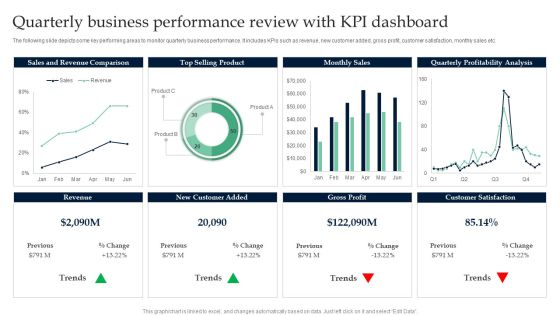
Quarterly Business Performance Review With KPI Dashboard Infographics PDF
Pitch your topic with ease and precision using this Quarterly Business Performance Review With KPI Dashboard Infographics PDF. This layout presents information on Sales And Revenue Comparison, Top Selling Product. It is also available for immediate download and adjustment. So, changes can be made in the color, design, graphics or any other component to create a unique layout.
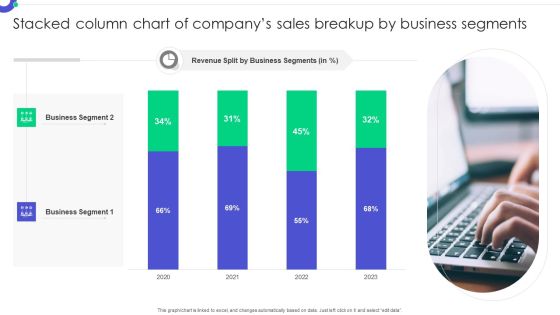
Stacked Column Chart Of Companys Sales Breakup By Business Segments Rules PDF
Pitch your topic with ease and precision using this Stacked Column Chart Of Companys Sales Breakup By Business Segments Rules PDF. This layout presents information on Business Segment, Revenue Split, Business Segments. It is also available for immediate download and adjustment. So, changes can be made in the color, design, graphics or any other component to create a unique layout.
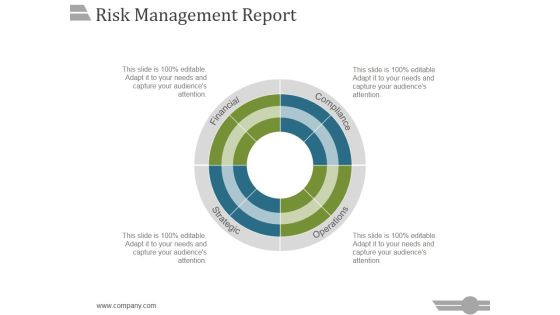
Risk Management Report Template 1 Ppt PowerPoint Presentation Inspiration
This is a risk management report template 1 ppt powerpoint presentation inspiration. This is a four stage process. The stages in this process are financial, compliance, strategic, operations.

Area Chart Ppt PowerPoint Presentation Summary Deck
This is a area chart ppt powerpoint presentation summary deck. This is a two stage process. The stages in this process are sales in percentage, financial year.

Scatter Bubble Chart Ppt PowerPoint Presentation Professional Skills
This is a scatter bubble chart ppt powerpoint presentation professional skills. This is a six stage process. The stages in this process are financial, marketing, management, strategy, planning.

Scatter Chart Ppt PowerPoint Presentation Gallery Layout
This is a scatter chart ppt powerpoint presentation gallery layout. This is a two stage process. The stages in this process are financial, marketing, management, strategy, planning.

Key Highlights Ppt PowerPoint Presentation Summary Display
This is a key highlights ppt powerpoint presentation summary display. This is a eight stage process. The stages in this process are business, marketing, management, financials.

Bar Graph Ppt PowerPoint Presentation Layouts Layouts
This is a bar graph ppt powerpoint presentation layouts layouts. This is a five stage process. The stages in this process are product, financial years, business, graph, marketing.

Absenteeism Rate Formula Ppt PowerPoint Presentation Show Maker
This is a absenteeism rate formula ppt powerpoint presentation show maker. This is a one stage process. The stages in this process are absenteeism, rate, formula, business, financials.

Executive Summary Ppt PowerPoint Presentation Gallery Ideas
This is a executive summary ppt powerpoint presentation gallery ideas. This is a two stage process. The stages in this process arebackground, capabilities, accreditation, financial highlights, company vision.

Area Chart Ppt PowerPoint Presentation Ideas Tips
This is a area chart ppt powerpoint presentation ideas tips. This is a two stage process. The stages in this process are in percentage, financial, year, business, marketing.

Bar Graph Ppt PowerPoint Presentation Model Vector
This is a bar graph ppt powerpoint presentation model vector. This is a two stage process. The stages in this process are graph, financial, year, business, marketing.
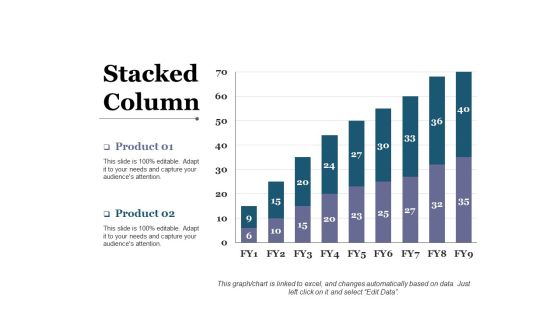
Stacked Column Ppt PowerPoint Presentation Ideas Maker
This is a stacked column ppt powerpoint presentation ideas maker. This is a two stage process. The stages in this process are business, financial, marketing, graph, strategy.
Radar Chart Ppt PowerPoint Presentation Icon Show
This is a radar chart ppt powerpoint presentation icon show. This is a two stage process. The stages in this process are business, financials, marketing, chart, strategy.
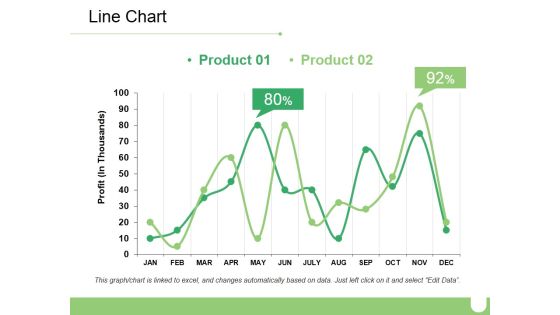
Line Chart Ppt PowerPoint Presentation Ideas Diagrams
This is a line chart ppt powerpoint presentation ideas diagrams. This is a two stage process. The stages in this process are business, marketing, percentage, financial, profit.

Scatter Chart Ppt PowerPoint Presentation Files
This is a scatter chart ppt powerpoint presentation files. This is a one stage process. The stages in this process are scatter chart, financial, strategy, business, planning.

Combo Chart Ppt PowerPoint Presentation Professional Ideas
This is a combo chart ppt powerpoint presentation professional ideas. This is a two stages process. The stages in this process are combo chart, financial, business, planning, marketing.

Area Chart Ppt PowerPoint Presentation Summary Backgrounds
This is a area chart ppt powerpoint presentation summary backgrounds. This is a two stage process. The stages in this process are percentage, financial, business, management.

Bar Chart Marketing Ppt PowerPoint Presentation Outline Deck
This is a bar chart marketing ppt powerpoint presentation outline deck. This is a two stage process. The stages in this process are business, management, marketing, financial, sales.

Clustered Column Line Ppt PowerPoint Presentation Gallery Layout
This is a clustered column line ppt powerpoint presentation gallery layout. This is a three stage process. The stages in this process are business, management, financial, marketing, sales.

Comparison Ppt PowerPoint Presentation Slides Graphic Images
This is a comparison ppt powerpoint presentation slides graphic images. This is a three stage process. The stages in this process are business, management, financial, strategy, analysis.

Stacked Bar Product Ppt PowerPoint Presentation Infographics Layout
This is a stacked bar product ppt powerpoint presentation infographics layout. This is a three stage process. The stages in this process are business, management, marketing, sales, financial.

Cultural Intelligence Key Statistics Ppt PowerPoint Presentation File Summary
This is a cultural intelligence key statistics ppt powerpoint presentation file summary. This is a four stage process. The stages in this process are financial, business, management, marketing.
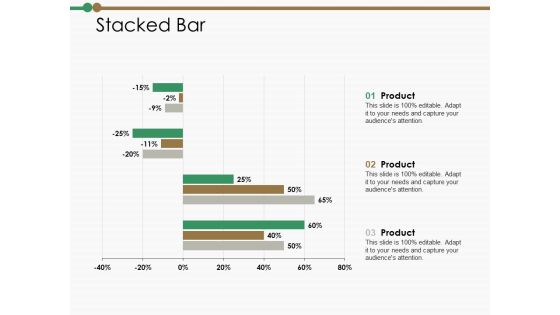
Stacked Bar Ppt PowerPoint Presentation Summary Clipart Images
This is a stacked bar ppt powerpoint presentation summary clipart images. This is a three stage process. The stages in this process are financial, percentage, product, management, marketing.

Bar Graph Chart Ppt PowerPoint Presentation Portfolio Templates
This is a bar graph chart ppt powerpoint presentation portfolio templates. This is a two stage process. The stages in this process are financial, minimum, medium, maximum.

Executive Summary Ppt PowerPoint Presentation Slides Design Inspiration

Comparison Minimum Ppt PowerPoint Presentation File Visual Aids
This is a comparison minimum ppt powerpoint presentation file visual aids. This is a three stage process. The stages in this process are financial, maximum, medium, minimum, marketing.
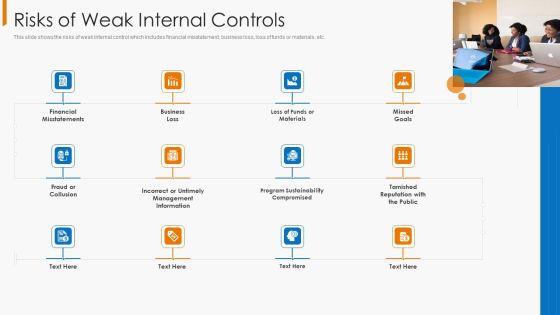
Financial Operational Controls And Evaluation Risks Of Weak Internal Controls Graphics PDF
This slide shows the risks of weak internal control which includes financial misstatement, business loss, loss of funds or materials, etc. Presenting financial operational controls and evaluation risks of weak internal controls graphics pdf to provide visual cues and insights. Share and navigate important information on twelve stages that need your due attention. This template can be used to pitch topics like financial misstatements, materials, goals. In addtion, this PPT design contains high resolution images, graphics, etc, that are easily editable and available for immediate download.
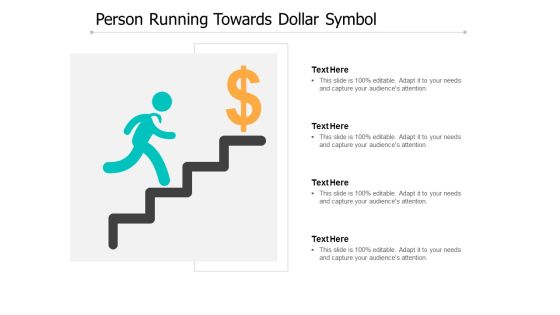
Person Running Towards Dollar Symbol Ppt PowerPoint Presentation Outline Elements
Presenting this set of slides with name person running towards dollar symbol ppt powerpoint presentation outline elements. This is a one stage process. The stages in this process are financial goal, business achievement arrow, financial business objectives. This is a completely editable PowerPoint presentation and is available for immediate download. Download now and impress your audience.

Investor Pitch Stock Market Launch Financial Institutions Our Company Achievements With Details Brochure PDF
This slide shows some business achievements over a period such as Market Leadership Award , Increase in Global Sales, Logistics provider of the Year Award etc. Presenting investor pitch stock market launch financial institutions our company achievements with details brochure pdf to provide visual cues and insights. Share and navigate important information on six stages that need your due attention. This template can be used to pitch topics like achievement, e commerce delivery and logistics, market leadership. In addtion, this PPT design contains high resolution images, graphics, etc, that are easily editable and available for immediate download.
Four Cubes For Fnancial Ratio Analysis Powerpoint Template
This business slide displays graphics of four cubes. This PPT slide has been designed to portray concept of financial ratio analysis. Download this PPT slide design to make interactive presentations.
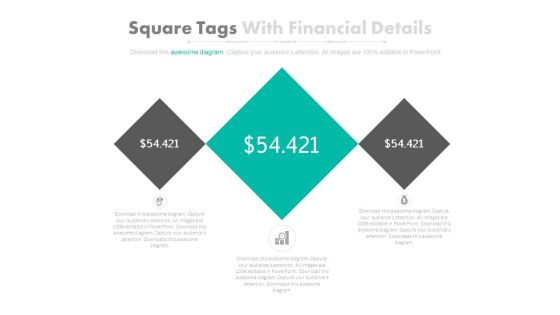
Three Square Tags With Dollars Value Powerpoint Slides
This PowerPoint template contains three square tags with dollar value. You may download this PPT slide design to display financial analysis. You can easily customize this template to make it more unique as per your need.
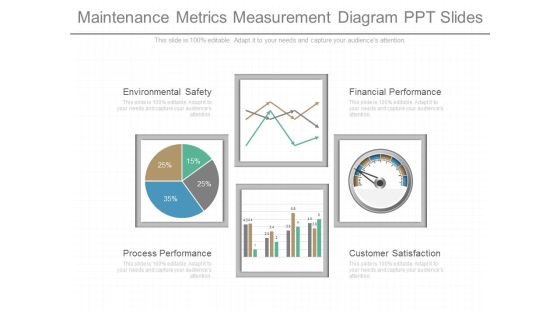
Maintenance Metrics Measurement Diagram Ppt Slides
This is a maintenance metrics measurement diagram ppt slides. This is a four stage process. The stages in this process are environmental safety, process performance, financial performance, customer satisfaction.
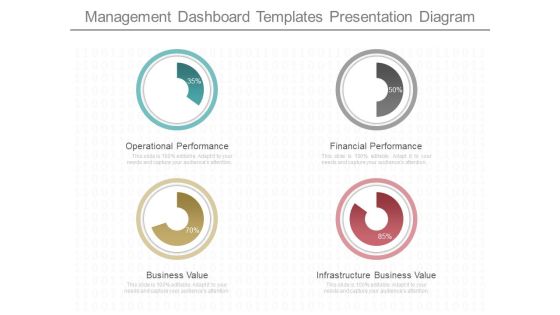
Management Dashboard Templates Presentation Diagram
This is a management dashboard templates presentation diagram. This is a four stage process. The stages in this process are operational performance, business value, financial performance, infrastructure business value.

Bar Chart Ppt PowerPoint Presentation Pictures Background Image
This is a bar chart ppt powerpoint presentation pictures background image. This is a seven stage process. The stages in this process are financial years, sales in percentage, graph, business.

Area Chart Ppt PowerPoint Presentation Layouts Graphics Example
This is a area chart ppt powerpoint presentation layouts graphics example. This is a two stage process. The stages in this process are sales in percentage, financial year, business, marketing, presentation.

Stacked Column Ppt PowerPoint Presentation Infographic Template Example File
This is a stacked column ppt powerpoint presentation infographic template example file. This is a two stage process. The stages in this process are financial, marketing, management, strategy, planning.

Benefits Of Big Data Ppt PowerPoint Presentation Professional Slide Portrait
This is a benefits of big data ppt powerpoint presentation professional slide portrait. This is a four stage process. The stages in this process are increased efficiency, better business decision making, improved customer experience and engagement, achieved financial savings.

Bar Chart Ppt PowerPoint Presentation Outline Introduction
This is a bar chart ppt powerpoint presentation outline introduction. This is a one stage process. The stages in this process are sales in percentage, product, business, financial years, graph.

Clustered Column Ppt PowerPoint Presentation Ideas Graphic Tips
This is a clustered column ppt powerpoint presentation ideas graphic tips. This is a two stage process. The stages in this process are financial year, sales in percentage, product, graph, business.

Bar Chart Ppt PowerPoint Presentation Professional Graphics Download
This is a bar chart ppt powerpoint presentation professional graphics download. This is a seven stage process. The stages in this process are sales in percentage, financial years, chart, business.
