Business Snapshot
Planning Transnational Technique To Improve International Scope Dashboard Tracking Post Expansion Revenue Structure PDF
This slide covers the dashboard for analyzing fast food business sales by location. It includes KPIs such as the companys revenue by location, by type, top 5 expenses by account, top 5 expenses by department, cost of revenue year to date, etc. If your project calls for a presentation, then Slidegeeks is your go to partner because we have professionally designed, easy to edit templates that are perfect for any presentation. After downloading, you can easily edit Planning Transnational Technique To Improve International Scope Dashboard Tracking Post Expansion Revenue Structure PDF and make the changes accordingly. You can rearrange slides or fill them with different images. Check out all the handy templates
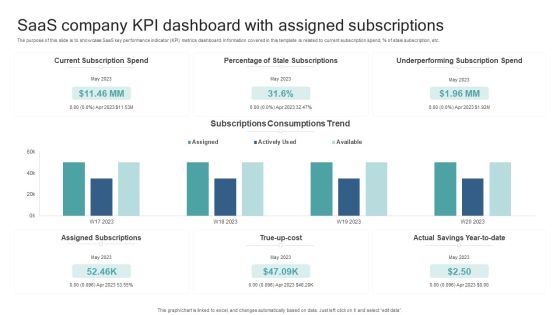
Saas Company KPI Dashboard With Assigned Subscriptions Formats PDF
The purpose of this slide is to showcase SaaS key performance indicator KPI metrics dashboard. Information covered in this template is related to current subscription spend, percent of stale subscription, etc. Pitch your topic with ease and precision using this Saas Company KPI Dashboard With Assigned Subscriptions Formats PDF. This layout presents information on Current Subscription Spend, Percentage Of Stale Subscriptions, True Up Cost, Underperforming Subscription Spend. It is also available for immediate download and adjustment. So, changes can be made in the color, design, graphics or any other component to create a unique layout.

Analyzing Impact Of Blockchain Iot On Major Kpis Formats PDF
This slide showcases impact analysis of blockchain internet of things IoT on key performance indicators KPIs. It provides information about efficiency, security, risk, costs, business models, revenue resources, etc. Deliver an awe inspiring pitch with this creative Analyzing Impact Of Blockchain Iot On Major Kpis Formats PDF bundle. Topics like Operational Efficiency, Information, Existing System can be discussed with this completely editable template. It is available for immediate download depending on the needs and requirements of the user.
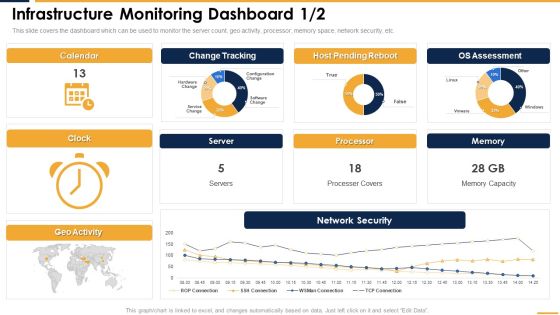
Infrastructure Monitoring Dashboard Structure PDF
This slide covers the dashboard which can be used to monitor the server count, geo activity, processor, memory space, network security, etc. Formulating a presentation can take up a lot of effort and time, so the content and message should always be the primary focus. The visuals of the PowerPoint can enhance the presenters message, so our Infrastructure Monitoring Dashboard Structure PDF was created to help save time. Instead of worrying about the design, the presenter can concentrate on the message while our designers work on creating the ideal templates for whatever situation is needed. Slidegeeks has experts for everything from amazing designs to valuable content, we have put everything into Infrastructure Monitoring Dashboard Structure PDF.

Comprehensive Guide To Build Marketing Digital Marketing Dashboard With Customer Acquisition Diagrams PDF
The following slide showcases comprehensive online marketing dashboard through which digital marketers can evaluate impact of advertisement campaigns on business performance. The success metrics mentioned in slide are customer lifetime value LTV, customer acquisition cost CAC, average lifetime value, etc. Do you have an important presentation coming up Are you looking for something that will make your presentation stand out from the rest Look no further than Comprehensive Guide To Build Marketing Digital Marketing Dashboard With Customer Acquisition Diagrams PDF. With our professional designs, you can trust that your presentation will pop and make delivering it a smooth process. And with Slidegeeks, you can trust that your presentation will be unique and memorable. So why wait Grab Comprehensive Guide To Build Marketing Digital Marketing Dashboard With Customer Acquisition Diagrams PDF today and make your presentation stand out from the rest.
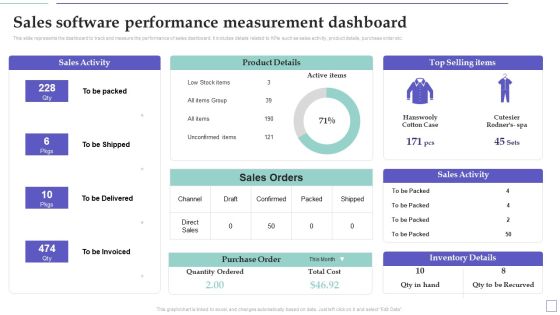
System Deployment Project Sales Software Performance Measurement Dashboard Summary PDF
This slide represents the dashboard to track and measure the performance of sales dashboard. It includes details related to KPIs such as sales activity, product details, purchase order etc. Welcome to our selection of the System Deployment Project Sales Software Performance Measurement Dashboard Summary PDF. These are designed to help you showcase your creativity and bring your sphere to life. Planning and Innovation are essential for any business that is just starting out. This collection contains the designs that you need for your everyday presentations. All of our PowerPoints are 100 percent editable, so you can customize them to suit your needs. This multi-purpose template can be used in various situations. Grab these presentation templates today.

Adjusting Financial Strategies And Planning KPI Dashboard To Analyze Financial Improvements Inspiration PDF
This slide showcases the KPIs that would help our business organization to evaluate improvements with the new financial strategy implementation. It includes total income, total expenses, accounts receivable, etc. The best PPT templates are a great way to save time, energy, and resources. Slidegeeks have 100 percent editable powerpoint slides making them incredibly versatile. With these quality presentation templates, you can create a captivating and memorable presentation by combining visually appealing slides and effectively communicating your message. Download Adjusting Financial Strategies And Planning KPI Dashboard To Analyze Financial Improvements Inspiration PDF from Slidegeeks and deliver a wonderful presentation.

Kpi Dashboard To Track Safety Program Performance Construction Site Safety Plan Summary PDF
This slide reflects the key performance indicator dashboard to track the performance of safety program. It includes information regarding the total manpower, manhours, unsafe conditions, lost time injuries frequency, injuries severity rate, along with the training hours. The Kpi Dashboard To Track Safety Program Performance Construction Site Safety Plan Summary PDF is a compilation of the most recent design trends as a series of slides. It is suitable for any subject or industry presentation, containing attractive visuals and photo spots for businesses to clearly express their messages. This template contains a variety of slides for the user to input data, such as structures to contrast two elements, bullet points, and slides for written information. Slidegeeks is prepared to create an impression.

Information Technology Expenditure Summary Dashboard Ppt PowerPoint Presentation Diagram Graph Charts PDF
The following slide showcases the cyber security expense overview to better allocate budget. It includes elements such as IT cost, revenue, security incidents, services down, issue status summary, total business hours lost etc. This Information Technology Expenditure Summary Dashboard Ppt PowerPoint Presentation Diagram Graph Charts PDF from Slidegeeks makes it easy to present information on your topic with precision. It provides customization options, so you can make changes to the colors, design, graphics, or any other component to create a unique layout. It is also available for immediate download, so you can begin using it right away. Slidegeeks has done good research to ensure that you have everything you need to make your presentation stand out. Make a name out there for a brilliant performance.

CSR Report On Safe Production Strategy Demonstration PDF
This slide illustrates production saving strategy boost CSR in a corporation for FY22. It includes new safe manufacturing strategy, impact, high risk events frequency etc. Showcasing this set of slides titled CSR Report On Safe Production Strategy Demonstration PDF. The topics addressed in these templates are Optimize Safety, Potentially High Risks, Promote Data Driven Decisions. All the content presented in this PPT design is completely editable. Download it and make adjustments in color, background, font etc. as per your unique business setting.
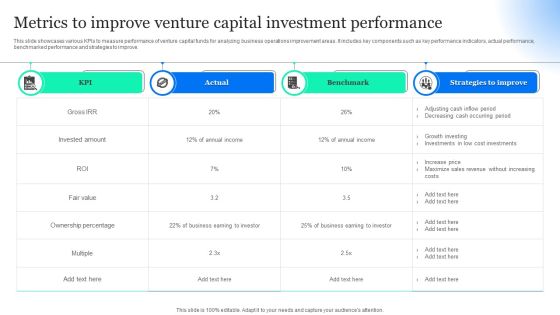
Metrics To Improve Venture Capital Investment Performance Information PDF
This slide showcases various KPIs to measure performance of venture capital funds for analyzing business operations improvement areas. It includes key components such as key performance indicators, actual performance, benchmarked performance and strategies to improve. Pitch your topic with ease and precision using this Metrics To Improve Venture Capital Investment Performance Information PDF. This layout presents information on Actual, Strategies Improve, Benchmark. It is also available for immediate download and adjustment. So, changes can be made in the color, design, graphics or any other component to create a unique layout.
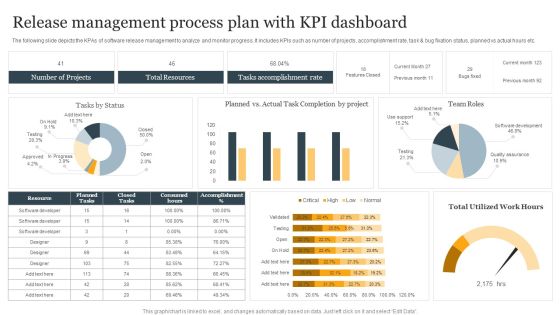
Release Management Process Plan With KPI Dashboard Ppt Infographic Template Structure PDF
The following slide depicts the KPAs of software release management to analyze and monitor progress. It includes KPIs such as number of projects, accomplishment rate, task and bug fixation status, planned vs actual hours etc. Showcasing this set of slides titled Release Management Process Plan With KPI Dashboard Ppt Infographic Template Structure PDF. The topics addressed in these templates are Number Of Projects, Total Resources, Tasks Accomplishment Rate. All the content presented in this PPT design is completely editable. Download it and make adjustments in color, background, font etc. as per your unique business setting.
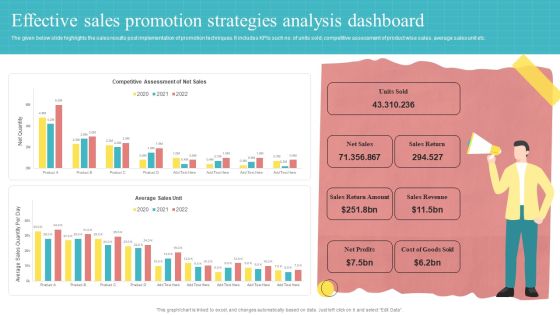
Effective Sales Promotion Strategies Analysis Dashboard Ppt PowerPoint Presentation Slides Background Designs PDF
The given below slide highlights the sales results post implementation of promotion techniques. It includes KPIs such no. of units sold, competitive assessment of product wise sales, average sales unit etc.Showcasing this set of slides titled Effective Sales Promotion Strategies Analysis Dashboard Ppt PowerPoint Presentation Slides Background Designs PDF. The topics addressed in these templates are Return Amount, Sales Return, Sales Revenue. All the content presented in this PPT design is completely editable. Download it and make adjustments in color, background, font etc. as per your unique business setting.
Several Brands Performance Tracking Dashboard Designs PDF
This slide provides information regarding different brands performance tracking dashboard in terms positive or negative mentions, sources, etc. The Several Brands Performance Tracking Dashboard Designs PDF is a compilation of the most recent design trends as a series of slides. It is suitable for any subject or industry presentation, containing attractive visuals and photo spots for businesses to clearly express their messages. This template contains a variety of slides for the user to input data, such as structures to contrast two elements, bullet points, and slides for written information. Slidegeeks is prepared to create an impression.

Weekly Sales Performance Report Of Fast Food Industry Slides PDF
The following slide exhibits report which identifies progress of sales team used to make data-driven adjustments. It presents information related to exports, current sales, etc. Showcasing this set of slides titled Weekly Sales Performance Report Of Fast Food Industry Slides PDF. The topics addressed in these templates are Outstanding Sales, Total Exports, Accumulated Exports. All the content presented in this PPT design is completely editable. Download it and make adjustments in color, background, font etc. as per your unique business setting.
Dashboard For Tracking Social Media Platforms Consumer Contact Point Guide Graphics PDF
This slide covers the KPI dashboard for analyzing social media channels. It includes metrics such as social media followers, Facebook daily reach, Facebook engaged users and page impressions, etc. Retrieve professionally designed Dashboard For Tracking Social Media Platforms Consumer Contact Point Guide Graphics PDF to effectively convey your message and captivate your listeners. Save time by selecting pre-made slideshows that are appropriate for various topics, from business to educational purposes. These themes come in many different styles, from creative to corporate, and all of them are easily adjustable and can be edited quickly. Access them as PowerPoint templates or as Google Slides themes. You do not have to go on a hunt for the perfect presentation because Slidegeeks got you covered from everywhere.

Information Systems Security And Risk Management Plan Process For Information Security Risk Assessment Formats PDF
This slide showcases process that can help organization to perform information security risk assessment. It can help identify security threats and allocate vulnerability rating to information assets. This modern and well arranged Information Systems Security And Risk Management Plan Process For Information Security Risk Assessment Formats PDF provides lots of creative possibilities. It is very simple to customize and edit with the Powerpoint Software. Just drag and drop your pictures into the shapes. All facets of this template can be edited with Powerpoint no extra software is necessary. Add your own material, put your images in the places assigned for them, adjust the colors, and then you can show your slides to the world, with an animated slide included.

4 Means To Achieve Company Goal Ppt PowerPoint Presentation Clipart
This is a 4 means to achieve company goal ppt powerpoint presentation clipart. This is a four stage process. The stages in this process are arrows, targets, success, marketing, presentation.

Cause And Effect Relationship In Behavior With Pointers Ppt PowerPoint Presentation Shapes
This is a cause and effect relationship in behavior with pointers ppt powerpoint presentation shapes. This is a six stage process. The stages in this process are root cause materials, root cause methods, effects resultant problem, root cause people, root cause equipment.
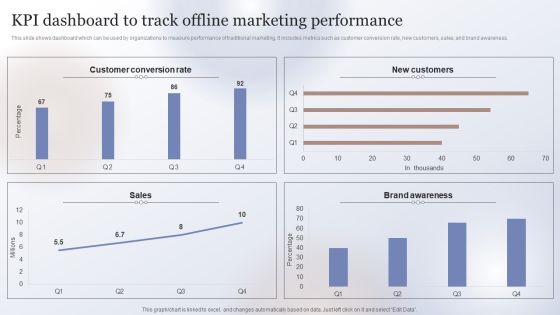
Marketing Strategy To Enhance KPI Dashboard To Track Offline Marketing Performance Ideas PDF
This slide shows dashboard which can be used by organizations to measure performance of traditional marketing. It includes metrics such as customer conversion rate, new customers, sales, and brand awareness. Welcome to our selection of the Marketing Strategy To Enhance KPI Dashboard To Track Offline Marketing Performance Ideas PDF. These are designed to help you showcase your creativity and bring your sphere to life. Planning and Innovation are essential for any business that is just starting out. This collection contains the designs that you need for your everyday presentations. All of our PowerPoints are 100 percent editable, so you can customize them to suit your needs. This multi-purpose template can be used in various situations. Grab these presentation templates today.
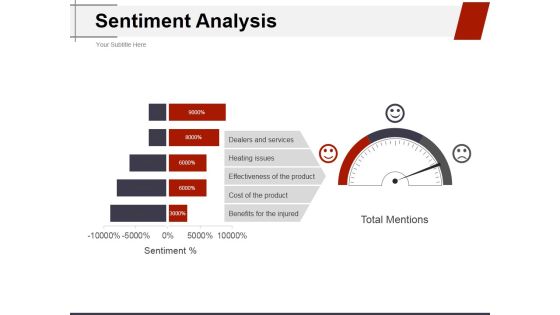
Sentiment Analysis Ppt PowerPoint Presentation Ideas Structure
This is a sentiment analysis ppt powerpoint presentation ideas structure. This is a three stage process. The stages in this process are dealers and services, heating issues, effectiveness of the product, cost of the product, benefits for the injured.

Optimizing Fiber Distributed Data Interface To Enhance Processes Four Types Of Cable Supported By FDDI Diagrams PDF
This slide shows four different types of cable supported by FDDI, including single multimedia mode unshielded twisted pair copper wiring and shielded twisted pair copper wiring. This modern and well arranged Optimizing Fiber Distributed Data Interface To Enhance Processes Four Types Of Cable Supported By FDDI Diagrams PDF provides lots of creative possibilities. It is very simple to customize and edit with the Powerpoint Software. Just drag and drop your pictures into the shapes. All facets of this template can be edited with Powerpoint no extra software is necessary. Add your own material, put your images in the places assigned for them, adjust the colors, and then you can show your slides to the world, with an animated slide included.

Comprehensive Guide To Strengthen Brand Equity Brand Equity Definition And Key Components Guidelines PDF
Following slide provides an overview about brand equity by covering its definition and key components such as brand loyalty, awareness, quality, association and experience. This modern and well arranged Comprehensive Guide To Strengthen Brand Equity Brand Equity Definition And Key Components Guidelines PDF provides lots of creative possibilities. It is very simple to customize and edit with the Powerpoint Software. Just drag and drop your pictures into the shapes. All facets of this template can be edited with Powerpoint, no extra software is necessary. Add your own material, put your images in the places assigned for them, adjust the colors, and then you can show your slides to the world, with an animated slide included.

Data Evaluation And Processing Toolkit Vendor Profile For Data Analytics Software Designs PDF
This slide shows the vendor scorecard for data analytics. It includes the multiple category of vendor profiling which can be scored and compared with different business needs. Welcome to our selection of the Data Evaluation And Processing Toolkit Vendor Profile For Data Analytics Software Designs PDF. These are designed to help you showcase your creativity and bring your sphere to life. Planning and Innovation are essential for any business that is just starting out. This collection contains the designs that you need for your everyday presentations. All of our PowerPoints are 100 percent editable, so you can customize them to suit your needs. This multi-purpose template can be used in various situations. Grab these presentation templates today.
Ultimate Guide To Improve Customer Support And Services Kpi Dashboard For Tracking Customer Retention Guidelines PDF
This slide covers the dashboard for analyzing customer loyalty with metrics such as NPS, loyal customer rate, premium users, CLV, customer churn, revenue churn, net retention, MRR growth, etc. Welcome to our selection of the Ultimate Guide To Improve Customer Support And Services Kpi Dashboard For Tracking Customer Retention Guidelines PDF. These are designed to help you showcase your creativity and bring your sphere to life. Planning and Innovation are essential for any business that is just starting out. This collection contains the designs that you need for your everyday presentations. All of our PowerPoints are 100 percent editable, so you can customize them to suit your needs. This multi purpose template can be used in various situations. Grab these presentation templates today.
Kpi Dashboard For Tracking Monthly Personal Finances Ppt Outline Graphics Example PDF
This slide shows dashboard which can be used by individuals to track monthly expenses in order to get better understanding of his or her finances. It includes metrics such as users spending, savings, debt, etc. Welcome to our selection of the Kpi Dashboard For Tracking Monthly Personal Finances Ppt Outline Graphics Example PDF. These are designed to help you showcase your creativity and bring your sphere to life. Planning and Innovation are essential for any business that is just starting out. This collection contains the designs that you need for your everyday presentations. All of our PowerPoints are 100 percent editable, so you can customize them to suit your needs. This multi purpose template can be used in various situations. Grab these presentation templates today.

Strategic Ecommerce Plan For B2B Enterprises B2b Ecommerce Dashboard To Track Website Performance Inspiration PDF
This slide represents metric dashboard to track and analyze B2b ecommerce website performance. It covers total user visits, sales, average return per user etc. Welcome to our selection of the Strategic Ecommerce Plan For B2B Enterprises B2b Ecommerce Dashboard To Track Website Performance Inspiration PDF. These are designed to help you showcase your creativity and bring your sphere to life. Planning and Innovation are essential for any business that is just starting out. This collection contains the designs that you need for your everyday presentations. All of our PowerPoints are 100 percent editable, so you can customize them to suit your needs. This multi-purpose template can be used in various situations. Grab these presentation templates today

Data Lineage Methods Data Lineage And Data Provenance Download PDF
This slide represents the data lineage and data provenance that represents data flow at summary and detail levels. The components of both concepts include a file transfer protocol server, data staging area, data warehouse, master data, data marts, and so on. Are you searching for a Data Lineage Methods Data Lineage And Data Provenance Download PDF that is uncluttered, straightforward, and original Its easy to edit, and you can change the colors to suit your personal or business branding. For a presentation that expresses how much effort you have put in, this template is ideal With all of its features, including tables, diagrams, statistics, and lists, its perfect for a business plan presentation. Make your ideas more appealing with these professional slides. Download Data Lineage Methods Data Lineage And Data Provenance Download PDF from Slidegeeks today.

Techniques To Optimize UX Customer Service Dashboard To Monitor Kpis Template PDF
This slide showcases support service dashboard to track relevant performance metrics. Major KPIs covered are customer satisfaction, average time to resolve problem, cost per support, customer retention, request volume, etc. Present like a pro with Techniques To Optimize UX Customer Service Dashboard To Monitor Kpis Template PDF Create beautiful presentations together with your team, using our easy-to-use presentation slides. Share your ideas in real-time and make changes on the fly by downloading our templates. So whether youre in the office, on the go, or in a remote location, you can stay in sync with your team and present your ideas with confidence. With Slidegeeks presentation got a whole lot easier. Grab these presentations today.

Coca Cola Emotional Marketing Strategy Affect Of Consumer Emotions On Brands Kpis Inspiration PDF
This slide showcases assessing key indicators for measuring financial performance of brand. It provides details about turnover, marketing costs, sales, administrative expenses, profit, percentage turnover, trade debtor days, headcount, etc. Create an editable Coca Cola Emotional Marketing Strategy Affect Of Consumer Emotions On Brands Kpis Inspiration PDF that communicates your idea and engages your audience. Whether youre presenting a business or an educational presentation, pre-designed presentation templates help save time. Coca Cola Emotional Marketing Strategy Affect Of Consumer Emotions On Brands Kpis Inspiration PDF is highly customizable and very easy to edit, covering many different styles from creative to business presentations. Slidegeeks has creative team members who have crafted amazing templates. So, go and get them without any delay.

Tiktok Advertising Campaign Management Dashboard Pictures PDF
This slide represents the key metrics dashboard to track and monitor the performance TikTok advertising campaign of enterprise. It includes details related to KPIs such as impressions, clicks, spend, CPC, CPM etc. Crafting an eye catching presentation has never been more straightforward. Let your presentation shine with this tasteful yet straightforward Tiktok Advertising Campaign Management Dashboard Pictures PDF template. It offers a minimalistic and classy look that is great for making a statement. The colors have been employed intelligently to add a bit of playfulness while still remaining professional. Construct the ideal Tiktok Advertising Campaign Management Dashboard Pictures PDF that effortlessly grabs the attention of your audience Begin now and be certain to wow your customers.

Kpis For Measuring Performance Of Request Order Procedure Slides PDF
This slide illustrates the major key performing indicators which can be used by business organization to measure the performance of placing order. The key performance indicators are order placement rate, purchase frequency, payment success rate, mobile conversion rate etc. Pitch your topic with ease and precision using this Kpis For Measuring Performance Of Request Order Procedure Slides PDF. This layout presents information on Kpis, Ideal, Actual. It is also available for immediate download and adjustment. So, changes can be made in the color, design, graphics or any other component to create a unique layout.
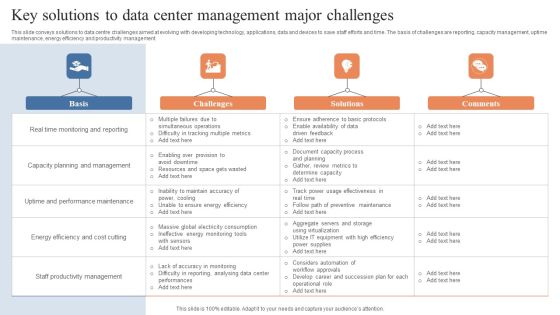
Key Solutions To Data Center Management Major Challenges Brochure PDF
This slide conveys solutions to data centre challenges aimed at evolving with developing technology, applications, data and devices to save staff efforts and time. The basis of challenges are reporting, capacity management, uptime maintenance, energy efficiency and productivity management. Showcasing this set of slides titled Key Solutions To Data Center Management Major Challenges Brochure PDF. The topics addressed in these templates are Multiple Failures, Simultaneous Operations, Difficulty Tracking, Multiple Metrics . All the content presented in this PPT design is completely editable. Download it and make adjustments in color, background, font etc. as per your unique business setting.
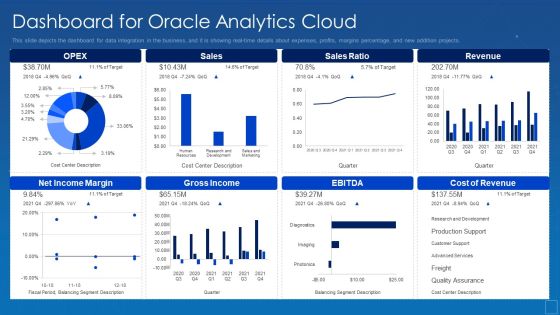
Oracle Cloud Data Analytics Administration IT Dashboard For Oracle Analytics Cloud Sample PDF
This slide depicts the dashboard for data integration in the business, and it is showing real-time details about expenses, profits, margins percentage, and new addition projects. Deliver an awe inspiring pitch with this creative oracle cloud data analytics administration it dashboard for oracle analytics cloud sample pdf bundle. Topics like dashboard for oracle analytics cloud can be discussed with this completely editable template. It is available for immediate download depending on the needs and requirements of the user.

5 R2R Key Performance Indicators Ppt PowerPoint Presentation Model Topics PDF
Following slide outlines critical R2R KPIs. Time to close, number of entry corrections, voice of transactions per FTE, growth of CA and process costs are some of the KPIs, which will assist accounts department to measure its overall performance.Showcasing this set of slides titled 5 R2R Key Performance Indicators Ppt PowerPoint Presentation Model Topics PDF. The topics addressed in these templates are Volume Transactions, Process Cost, Entry Corrections. All the content presented in this PPT design is completely editable. Download it and make adjustments in color, background, font etc. as per your unique business setting.
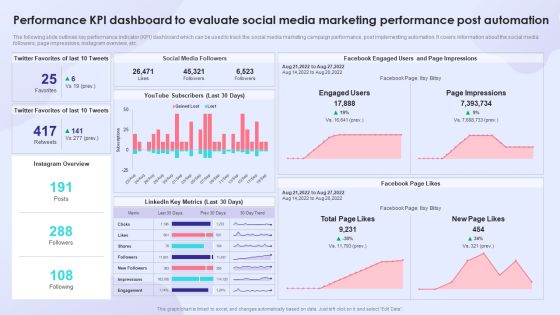
Performance KPI Dashboard To Evaluate Social Media Marketing Performance Post Automation Themes PDF
The following slide outlines key performance indicator KPI dashboard which can be used to track the social media marketing campaign performance, post implementing automation. It covers information about the social media followers, page impressions, instagram overview, etc. Deliver and pitch your topic in the best possible manner with this Performance KPI Dashboard To Evaluate Social Media Marketing Performance Post Automation Themes PDF. Use them to share invaluable insights on Social Media Followers, Linkedin Key Metrics, Performance KPI Dashboard and impress your audience. This template can be altered and modified as per your expectations. So, grab it now.

Kpis To Track In Customer Service Performance Evaluation Diagrams PDF
The following slide brings forth various key performance indicators which can be used by brand managers to track the customer service rate of the organization for continuous improvement. The key performing indicators are first response time, customer retention rate, customer satisfaction score etc. Showcasing this set of slides titled Kpis To Track In Customer Service Performance Evaluation Diagrams PDF. The topics addressed in these templates are First Response Time, Customer Retention Rate, Customer Satisfaction Score. All the content presented in this PPT design is completely editable. Download it and make adjustments in color, background, font etc. as per your unique business setting.

Kpi Dashboard To Measure Effectiveness Of Youtube Marketing Slides PDF
The following slide outlines key performance indicator KPI dashboard which will assist the marketer to track YouTube marketing campaign performance. The key metrics covered in the slide are subscribers gained and lost, likes, dislikes, comments, shares etc. Do you have an important presentation coming up Are you looking for something that will make your presentation stand out from the rest Look no further than Kpi Dashboard To Measure Effectiveness Of Youtube Marketing Slides PDF. With our professional designs, you can trust that your presentation will pop and make delivering it a smooth process. And with Slidegeeks, you can trust that your presentation will be unique and memorable. So why wait Grab Kpi Dashboard To Measure Effectiveness Of Youtube Marketing Slides PDF today and make your presentation stand out from the rest.

KPI Metrics For Cyber Safety And Security Report Elements PDF
This slide shows various key performance indicators which can be used to report cyber security. It includes metrics detected intrusion attempts, incident rate, vulnerability patch response times, etc. Showcasing this set of slides titled KPI Metrics For Cyber Safety And Security Report Elements PDF. The topics addressed in these templates are Incident Rate, Application, Metrics. All the content presented in this PPT design is completely editable. Download it and make adjustments in color, background, font etc. as per your unique business setting.

Data Lake Architecture Future Of Data Analysis How Does Central Repository Data Lake Works Ideas PDF
This slide represents the working of the data lakes, including how different types of data are stored at a centralized place, extracted and performed operations on the data.Deliver an awe inspiring pitch with this creative Data Lake Architecture Future Of Data Analysis How Does Central Repository Data Lake Works Ideas PDF bundle. Topics like Advanced Analytics, Business Intelligence, Storage And Processing can be discussed with this completely editable template. It is available for immediate download depending on the needs and requirements of the user.

Marketers Guide To Data Analysis Optimization Top Marketing Analytics Software Comparison Pictures PDF
This slide covers a comparative analysis of the market analytics system based on features such as real-time analytics and insights, brand measurement capabilities, contextualized customer and market insights, annual media plan recommendations, etc. Create an editable Marketers Guide To Data Analysis Optimization Top Marketing Analytics Software Comparison Pictures PDF that communicates your idea and engages your audience. Whether youre presenting a business or an educational presentation, pre designed presentation templates help save time. Marketers Guide To Data Analysis Optimization Top Marketing Analytics Software Comparison Pictures PDF is highly customizable and very easy to edit, covering many different styles from creative to business presentations. Slidegeeks has creative team members who have crafted amazing templates. So, go and get them without any delay.

Data Quality Project Lifecycle Framework To Increase Operational Efficiency Template PDF
This slide covers data quality lifecycle framework. It involves data governance, quality and analytics, quality assurance and data quality monitoring.Showcasing this set of slides titled Data Quality Project Lifecycle Framework To Increase Operational Efficiency Template PDF. The topics addressed in these templates are Roles Responsibilities, Reference Meta Data, Predictive Analytics. All the content presented in this PPT design is completely editable. Download it and make adjustments in color, background, font etc. as per your unique business setting.
Our Services Of Proposal For Land Photography Portfolio Service Icons PDF
Impress your clients and partners with our Our Services Of Proposal For Land Photography Portfolio Service Icons PDF Our 100 percent editable Template is packed with visually-stunning designs that will make your proposals stand out. With easy-to-use features and customizable elements, you can create unique proposals tailored to your specific needs. From business proposals to event proposals, our Template is the perfect tool for creating proposals that win.

Comparative Metrics For Continuous Tracking In Devops Tools Clipart PDF
This slide illustrates comparison of key performance indicators of DevOps tools. It includes metrics such as observability and visualization, observability and application, pattern analysis, etc. Showcasing this set of slides titled Comparative Metrics For Continuous Tracking In Devops Tools Clipart PDF. The topics addressed in these templates are Appdynamics, Datadog, Dynatrace. All the content presented in this PPT design is completely editable. Download it and make adjustments in color, background, font etc. as per your unique business setting.

Sales Kpis For Manufacturing Company Unit Ppt Pictures Images PDF
This slides showcase automated lead generation possibilities sale incentive procedure and sales funnel by product territory, sales revenue for financial year 2023 and sales by product. Showcasing this set of slides titled Sales Kpis For Manufacturing Company Unit Ppt Pictures Images PDF. The topics addressed in these templates are Lead Conversation Ratio, Total Opportunities, Total Opportunities. All the content presented in this PPT design is completely editable. Download it and make adjustments in color, background, font etc. as per your unique business setting.

Techniques To Optimize UX Dashboard Depicting Performance Metrics Of Customer Clipart PDF
This slide showcases dashboard depicting major customer service KPIs. The performance metrics covered are search exit rate, CSAT, average first response time, tickets solved, etc. Formulating a presentation can take up a lot of effort and time, so the content and message should always be the primary focus. The visuals of the PowerPoint can enhance the presenters message, so our Techniques To Optimize UX Dashboard Depicting Performance Metrics Of Customer Clipart PDF was created to help save time. Instead of worrying about the design, the presenter can concentrate on the message while our designers work on creating the ideal templates for whatever situation is needed. Slidegeeks has experts for everything from amazing designs to valuable content, we have put everything into Techniques To Optimize UX Dashboard Depicting Performance Metrics Of Customer Clipart PDF.
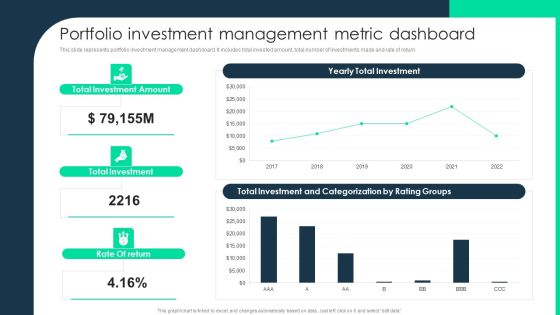
Portfolio Investment Management Metric Dashboard Brochure PDF
This slide represents portfolio investment management dashboard. It includes total invested amount, total number of investments made and rate of return. Deliver an awe inspiring pitch with this creative Portfolio Investment Management Metric Dashboard Brochure PDF bundle. Topics like Portfolio Investment Management, Metric Dashboard can be discussed with this completely editable template. It is available for immediate download depending on the needs and requirements of the user.

Portfolio Investment Management Metric Dashboard Slides PDF
This slide represents portfolio investment management dashboard. It includes total invested amount, total number of investments made and rate of return. Deliver an awe inspiring pitch with this creative Portfolio Investment Management Metric Dashboard Slides PDF bundle. Topics like Portfolio Investment Management, Metric Dashboard can be discussed with this completely editable template. It is available for immediate download depending on the needs and requirements of the user.
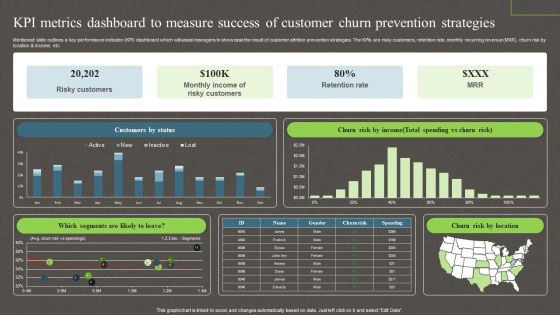
Kpi Metrics Dashboard To Measure Success Of Customer Churn Prevention Strategies Ppt PowerPoint Presentation File Model PDF
Mentioned slide outlines a key performance indicator KPI dashboard which will assist managers to showcase the result of customer attrition prevention strategies. The KPIs are risky customers, retention rate, monthly recurring revenue MRR, churn risk by location and income, etc. This Kpi Metrics Dashboard To Measure Success Of Customer Churn Prevention Strategies Ppt PowerPoint Presentation File Model PDF from Slidegeeks makes it easy to present information on your topic with precision. It provides customization options, so you can make changes to the colors, design, graphics, or any other component to create a unique layout. It is also available for immediate download, so you can begin using it right away. Slidegeeks has done good research to ensure that you have everything you need to make your presentation stand out. Make a name out there for a brilliant performance.
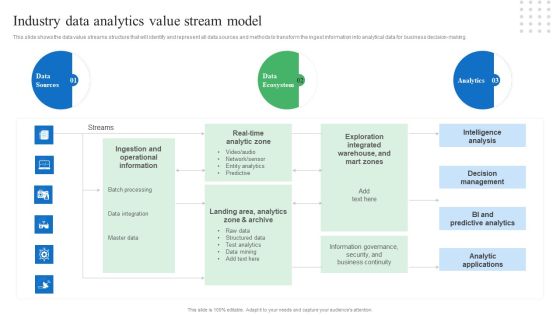
Toolkit For Data Science And Analytics Transition Industry Data Analytics Value Stream Model Brochure PDF
This slide shows the data value streams structure that will identify and represent all data sources and methods to transform the ingest information into analytical data for business decision-making. Whether you have daily or monthly meetings, a brilliant presentation is necessary. Toolkit For Data Science And Analytics Transition Industry Data Analytics Value Stream Model Brochure PDF can be your best option for delivering a presentation. Represent everything in detail using Toolkit For Data Science And Analytics Transition Industry Data Analytics Value Stream Model Brochure PDF and make yourself stand out in meetings. The template is versatile and follows a structure that will cater to your requirements. All the templates prepared by Slidegeeks are easy to download and edit. Our research experts have taken care of the corporate themes as well. So, give it a try and see the results.

Various Components Of Batch Processing Architecture System Microsoft PDF
Mentioned slide highlights the different components of batch processing system. Data sources, data storage, batch processing, analytical data store, analytics and reporting are some of the major components used to manager large volume of data. Showcasing this set of slides titled Various Components Of Batch Processing Architecture System Microsoft PDF. The topics addressed in these templates are Data Storage, Batch Processing, Analytical Data Store. All the content presented in this PPT design is completely editable. Download it and make adjustments in color, background, font etc. as per your unique business setting.
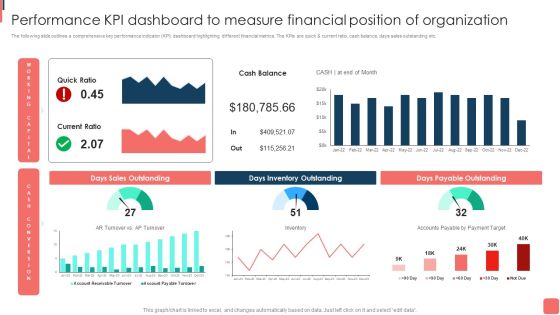
Effective Financial Planning Assessment Techniques Performance Kpi Dashboard To Measure Financial Graphics PDF
The following slide outlines a comprehensive key performance indicator KPI dashboard highlighting different financial metrics. The KPIs are quick and current ratio, cash balance, days sales outstanding etc. The best PPT templates are a great way to save time, energy, and resources. Slidegeeks have 100 precent editable powerpoint slides making them incredibly versatile. With these quality presentation templates, you can create a captivating and memorable presentation by combining visually appealing slides and effectively communicating your message. Download Effective Financial Planning Assessment Techniques Performance Kpi Dashboard To Measure Financial Graphics PDF from Slidegeeks and deliver a wonderful presentation.

Implementing Cyber Security Incident Enterprise Cyber Risk Dashboard Professional PDF
This slide represents the key metrics dashboard representing details related to management of cyber security incidents by an enterprise. It includes key performance indicators such as risk analysis progress, risk rating breakdown etc. Do you have an important presentation coming up Are you looking for something that will make your presentation stand out from the rest Look no further than Implementing Cyber Security Incident Enterprise Cyber Risk Dashboard Professional PDF. With our professional designs, you can trust that your presentation will pop and make delivering it a smooth process. And with Slidegeeks, you can trust that your presentation will be unique and memorable. So why wait Grab Implementing Cyber Security Incident Enterprise Cyber Risk Dashboard Professional PDF today and make your presentation stand out from the rest.

Toolkit For Data Science And Analytics Transition Data Analytics Project Plan Designs PDF
This slide shows the data analytics lifecycle covering multiple stages starting from presenting the business case to data identification, data validation, analysis and ending at data visualization and utilization of results. Present like a pro with Toolkit For Data Science And Analytics Transition Data Analytics Project Plan Designs PDF Create beautiful presentations together with your team, using our easy to use presentation slides. Share your ideas in real time and make changes on the fly by downloading our templates. So whether you are in the office, on the go, or in a remote location, you can stay in sync with your team and present your ideas with confidence. With Slidegeeks presentation got a whole lot easier. Grab these presentations today.

Comparative Matrix Of Real Time Analytics Systems Background PDF
The slide showcases a comparative analysis with differentiating aspects like data inputs, process, method involves , suitability and examples. It compares real-time data vs near real-time data anal analysis. Showcasing this set of slides titled Comparative Matrix Of Real Time Analytics Systems Background PDF. The topics addressed in these templates are Data Inputs, Process, Method Involves. All the content presented in this PPT design is completely editable. Download it and make adjustments in color, background, font etc. as per your unique business setting.

Kpis To Monitor Advertising Campaign Marketing Communication Strategy Success Pictures PDF
This slide consists of key performance indicators to be used by mangers for tracking success rate of advertising campaign marketing communication plan. Key metrices covered are content reach, brand mention, blog shares, search volume data, repeat purchase and organic traffic Showcasing this set of slides titled Kpis To Monitor Advertising Campaign Marketing Communication Strategy Success Pictures PDF. The topics addressed in these templates are Content Reach, Brand Mentions, Blog Shares. All the content presented in this PPT design is completely editable. Download it and make adjustments in color, background, font etc. as per your unique business setting.

Content Delivery And Promotion Kpis To Measure Content Distribution Campaign Ideas PDF
This slide showcases KPIs that can help organization to ensure effectiveness of content distribution campaigns. Key metrics are unique visitors, pages per session, click through rate, open rate, followers growth, engagement rate etc. Are you searching for a Content Delivery And Promotion Kpis To Measure Content Distribution Campaign Ideas PDF that is uncluttered, straightforward, and original Its easy to edit, and you can change the colors to suit your personal or business branding. For a presentation that expresses how much effort youve put in, this template is ideal With all of its features, including tables, diagrams, statistics, and lists, its perfect for a business plan presentation. Make your ideas more appealing with these professional slides. Download Content Delivery And Promotion Kpis To Measure Content Distribution Campaign Ideas PDF from Slidegeeks today.

Profitability Modelling Framework Dashboard To Track Firm Profitability Topics PDF
The purpose of this slide is to provide details about the firm profitability performance to its executives, business unit managers, product managers etc. so that they can take strategic decisions. Find highly impressive Profitability Modelling Framework Dashboard To Track Firm Profitability Topics PDF on Slidegeeks to deliver a meaningful presentation. You can save an ample amount of time using these presentation templates. No need to worry to prepare everything from scratch because Slidegeeks experts have already done a huge research and work for you. You need to download Profitability Modelling Framework Dashboard To Track Firm Profitability Topics PDF for your upcoming presentation. All the presentation templates are 100 percent editable and you can change the color and personalize the content accordingly. Download now.
Email Marketing Campaign Kpis Tracking Dashboard Template PDF
This slide shows key performance indicators KPI dashboard for measuring the effectiveness of email campaigns. It provides information about sent, delivered, opens, clicks, unsubscribed, bounces, complaints, etc. Are you in need of a template that can accommodate all of your creative concepts This one is crafted professionally and can be altered to fit any style. Use it with Google Slides or PowerPoint. Include striking photographs, symbols, depictions, and other visuals. Fill, move around, or remove text boxes as desired. Test out color palettes and font mixtures. Edit and save your work, or work with colleagues. Download Email Marketing Campaign Kpis Tracking Dashboard Template PDF and observe how to make your presentation outstanding. Give an impeccable presentation to your group and make your presentation unforgettable.

Retail Store Dashboard With Inventory SKU Ppt PowerPoint Presentation Gallery Graphics Template PDF
This slide showcases SKU dashboard for tracking retail store product inventory. It provides information about price, tax rate, units sold, stock, available, reorder, incoming, in transit, warehouse, etc. Showcasing this set of slides titled Retail Store Dashboard With Inventory SKU Ppt PowerPoint Presentation Gallery Graphics Template PDF. The topics addressed in these templates are South Hall Warehouse, New Jersey Warehouse, Munich Warehouse. All the content presented in this PPT design is completely editable. Download it and make adjustments in color, background, font etc. as per your unique business setting.


 Continue with Email
 Sign up for an account
 Home
Home