Business Snapshot

Product Target Market Research Survey Outcome Reporting Dashboard Portrait PDF
This slide showcases a report presenting results of product market research survey to collect customer feedback about new product. It includes key elements such as ingredient desire result, new product concept survey and demographic response. Showcasing this set of slides titled Product Target Market Research Survey Outcome Reporting Dashboard Portrait PDF. The topics addressed in these templates are Uniqueness, Problem, Effectiveness. All the content presented in this PPT design is completely editable. Download it and make adjustments in color, background, font etc. as per your unique business setting.

Adopting IMC Technique To Boost Brand Recognition Kpi Dashboard Highlighting Public Relations Metrics Brochure PDF
The following slide depicts key performance indicators to evaluate public relations efforts and increase brand visibility. It includes elements such as press releases, blog entries, social media updates, news releases etc. Formulating a presentation can take up a lot of effort and time, so the content and message should always be the primary focus. The visuals of the PowerPoint can enhance the presenters message, so our Adopting IMC Technique To Boost Brand Recognition Kpi Dashboard Highlighting Public Relations Metrics Brochure PDF was created to help save time. Instead of worrying about the design, the presenter can concentrate on the message while our designers work on creating the ideal templates for whatever situation is needed. Slidegeeks has experts for everything from amazing designs to valuable content, we have put everything into Adopting IMC Technique To Boost Brand Recognition Kpi Dashboard Highlighting Public Relations Metrics Brochure PDF

KPI Metrics Dashboard To Measure Effectiveness Of Healthcare Recruitment Demonstration PDF
The following slide showcases key performance indicator KPI metrics dashboard which can be used to evaluate the success rate of healthcare recruitment. It covers information about technical and non-technical hiring, recruitment costs, current hiring pipeline etc. Slidegeeks has constructed KPI Metrics Dashboard To Measure Effectiveness Of Healthcare Recruitment Demonstration PDF after conducting extensive research and examination. These presentation templates are constantly being generated and modified based on user preferences and critiques from editors. Here, you will find the most attractive templates for a range of purposes while taking into account ratings and remarks from users regarding the content. This is an excellent jumping off point to explore our content and will give new users an insight into our top notch PowerPoint Templates.

Tiktok Digital Marketing Campaign Tiktok Influencer Marketing Campaign Analysis Dashboard Brochure PDF
This slide represents the key metrics dashboard to track and analyze the performance of TikTok influencer marketing campaign of the enterprise. It includes details related to KPIs such as no.of shares, comments, views etc. The Tiktok Digital Marketing Campaign Tiktok Influencer Marketing Campaign Analysis Dashboard Brochure PDF is a compilation of the most recent design trends as a series of slides. It is suitable for any subject or industry presentation, containing attractive visuals and photo spots for businesses to clearly express their messages. This template contains a variety of slides for the user to input data, such as structures to contrast two elements, bullet points, and slides for written information. Slidegeeks is prepared to create an impression.

Service Improvement Techniques For Client Retention Customer Service Dashboard To Monitor Kpis Clipart PDF
This slide showcases support service dashboard to track relevant performance metrics. Major KPIs covered are customer satisfaction, average time to resolve problem, cost per support, customer retention, request volume, etc. Do you have an important presentation coming up. Are you looking for something that will make your presentation stand out from the rest. Look no further than Service Improvement Techniques For Client Retention Customer Service Dashboard To Monitor Kpis Clipart PDF. With our professional designs, you can trust that your presentation will pop and make delivering it a smooth process. And with Slidegeeks, you can trust that your presentation will be unique and memorable. So why wait. Grab Service Improvement Techniques For Client Retention Customer Service Dashboard To Monitor Kpis Clipart PDF today and make your presentation stand out from the rest.

Summary Financial Sales And Profit Margin Analysis Dashboard Pictures PDF
This graph or chart is linked to excel, and changes automatically based on data. Just left click on it and select Edit Data. Deliver an awe inspiring pitch with this creative Summary Financial Sales And Profit Margin Analysis Dashboard Pictures PDF bundle. Topics like Net Profit, Past Year Vs Target Vs Actual, Net Profit Margin By Region, Channel, Expenses Breakdown, Costs And Expenses, Profitability Indicator Ratios can be discussed with this completely editable template. It is available for immediate download depending on the needs and requirements of the user.

Data Quality Kpis Completeness Metrics Dashboard For Web Based Platform Graphics PDF
This slide covers dashboard based on different data categories from website. It includes data quality scores in context to data completeness and accuracy based metrics for data source ID, IP address, device ID, county codes, user agent data, horizontal accuracy, etc. Pitch your topic with ease and precision using this Data Quality Kpis Completeness Metrics Dashboard For Web Based Platform Graphics PDF. This layout presents information on Country Code, User Agent, Longitude. It is also available for immediate download and adjustment. So, changes can be made in the color, design, graphics or any other component to create a unique layout.

Automated Data Handling Tools Comparison Analysis Formats PDF
This slide showcase comparison of various digital automation data management tools to choose suitable one as per requirements. It includes elements such as tool names, features, price, review and level of complexity. Showcasing this set of slides titled Automated Data Handling Tools Comparison Analysis Formats PDF. The topics addressed in these templates are High Data Security, Analysis, Interactive Dashboards. All the content presented in this PPT design is completely editable. Download it and make adjustments in color, background, font etc. as per your unique business setting.
Sales Order Processing Performance Tracking Indicators Graphics PDF
The following slide showcases key performance indicators for sales order fulfilment to meet customer expectations, specifications, deliver goods on time, compare order fulfilment against past orders. It includes elements such as category, key performance indicators, expected rate and actual rate. Showcasing this set of slides titled Sales Order Processing Performance Tracking Indicators Graphics PDF. The topics addressed in these templates are Customer Metrics, Inbound Metrics, Financial Metrics. All the content presented in this PPT design is completely editable. Download it and make adjustments in color, background, font etc. as per your unique business setting.

Comprehensive Guide For Enhancing Performance Of Customer Service Center BPO Call Center Organizational Diagrams PDF
This slide showcases the business process outsourcing call center organizational structure which highlights retail customer service team, ecommerce service team, telecom service team, BFSI service team and healthcare service team. Boost your pitch with our creative Comprehensive Guide For Enhancing Performance Of Customer Service Center BPO Call Center Organizational Diagrams PDF. Deliver an awe-inspiring pitch that will mesmerize everyone. Using these presentation templates you will surely catch everyones attention. You can browse the ppts collection on our website. We have researchers who are experts at creating the right content for the templates. So you do not have to invest time in any additional work. Just grab the template now and use them.

Monthly KPI Work Performance Monitoring By Category Microsoft PDF
This slide shows the monthly key performance indicators report on various categories with a line chart . the categories includes financial, customer success , new business activities, HR and other metrics. Pitch your topic with ease and precision using this Monthly KPI Work Performance Monitoring By Category Microsoft PDF. This layout presents information on Metrics, Financial, Customer Success. It is also available for immediate download and adjustment. So, changes can be made in the color, design, graphics or any other component to create a unique layout.
Email Marketing Campaign Kpis Tracking Dashboard Graphics PDF
This slide shows key performance indicators KPI dashboard for measuring effectiveness of email campaigns. It provides information about sent, delivered, opens, clicks, unsubscribed, bounces, complaints, etc. Pitch your topic with ease and precision using this Email Marketing Campaign Kpis Tracking Dashboard Graphics PDF. This layout presents information on Email Marketing Campaign, Tracking Dashboard. It is also available for immediate download and adjustment. So, changes can be made in the color, design, graphics or any other component to create a unique layout.

Vehicle Management System KPI Dashboard Introduction PDF
This slide represents the dashboard showing real time data of fleet management to cut down operational costs and improve efficiency. It includes key metrics such as vehicles with errors, warnings, deviation from route, total vehicles, vehicles condition etc. Pitch your topic with ease and precision using this Vehicle Management System KPI Dashboard Introduction PDF. This layout presents information on Vehicle Management System, KPI Dashboard. It is also available for immediate download and adjustment. So, changes can be made in the color, design, graphics or any other component to create a unique layout.

Project Progress Status KPI Dashboard Ppt PowerPoint Presentation File Themes PDF
The given slide showcases the project status to communicate and monitor risk. It includes elements such as activity status, budget allocation, risk status and degree. Showcasing this set of slides titled Project Progress Status KPI Dashboard Ppt PowerPoint Presentation File Themes PDF. The topics addressed in these templates are Activity Status, Budget Allocation, Open Risk, Open Issues. All the content presented in this PPT design is completely editable. Download it and make adjustments in color, background, font etc. as per your unique business setting.
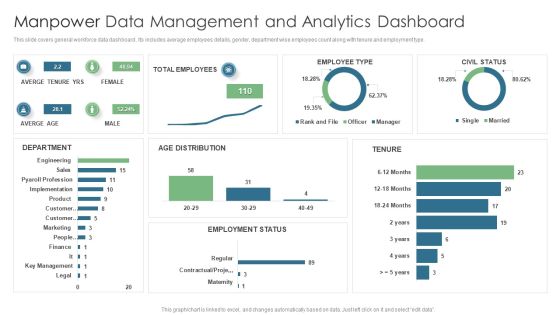
Manpower Data Management And Analytics Dashboard Topics PDF
This slide covers general workforce data dashboard . Its includes average employees details, gender, department wise employees count along with tenure and employment type. Pitch your topic with ease and precision using this Manpower Data Management And Analytics Dashboard Topics PDF. This layout presents information on Total Employees, Averge Tenure Yrs, Employee Type. It is also available for immediate download and adjustment. So, changes can be made in the color, design, graphics or any other component to create a unique layout.

Online Promotion Playbook Google Data Studio Reports Designs PDF
This template covers tools to measure marketing analytics such as google analytics for all web tracking, google data studio to build real-time reporting dashboards and google data studio reports. Deliver an awe inspiring pitch with this creative online promotion playbook google data studio reports designs pdf bundle. Topics like google data studio reports can be discussed with this completely editable template. It is available for immediate download depending on the needs and requirements of the user.
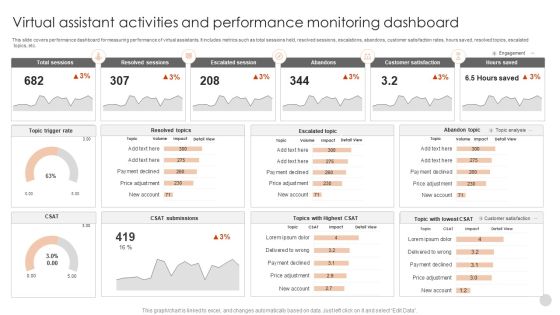
Virtual Assistant Activities And Performance Monitoring Dashboard Guidelines PDF
This slide covers performance dashboard for measuring performance of virtual assistants. It includes metrics such as total sessions held, resolved sessions, escalations, abandons, customer satisfaction rates, hours saved, resolved topics, escalated topics, etc.Pitch your topic with ease and precision using this Virtual Assistant Activities And Performance Monitoring Dashboard Guidelines PDF. This layout presents information on Total Sessions, Resolved Sessions, Escalated Session. It is also available for immediate download and adjustment. So, changes can be made in the color, design, graphics or any other component to create a unique layout.

Website Analytics Dashboard For Consumer Data Insights Template PDF
This slide showcases dashboard for website analytics that can help organization to gather data about visitors and formulate targeted marketing campaigns. It can also help to make individual and group buyer personas Here you can discover an assortment of the finest PowerPoint and Google Slides templates. With these templates, you can create presentations for a variety of purposes while simultaneously providing your audience with an eye-catching visual experience. Download Website Analytics Dashboard For Consumer Data Insights Template PDF to deliver an impeccable presentation. These templates will make your job of preparing presentations much quicker, yet still, maintain a high level of quality. Slidegeeks has experienced researchers who prepare these templates and write high-quality content for you. Later on, you can personalize the content by editing the Website Analytics Dashboard For Consumer Data Insights Template PDF.

Website Analytics Dashboard For Consumer Data Insights Clipart PDF
This slide showcases dashboard for website analytics that can help organization to gather data about visitors and formulate targeted marketing campaigns. It can also help to make individual and group buyer personas. Want to ace your presentation in front of a live audience Our Website Analytics Dashboard For Consumer Data Insights Clipart PDF can help you do that by engaging all the users towards you.. Slidegeeks experts have put their efforts and expertise into creating these impeccable powerpoint presentations so that you can communicate your ideas clearly. Moreover, all the templates are customizable, and easy-to-edit and downloadable. Use these for both personal and commercial use.

Application Areas Of Healthcare Data Analysis Slides PDF
This slide shows different areas of healthcare industry, where data analytics can be applied to improve quality of services. Showcasing this set of slides titled Application Areas Of Healthcare Data Analysis Slides PDF. The topics addressed in these templates are Disease Prevention, Diagnosis And Treatment, Post Care Monitoring. All the content presented in this PPT design is completely editable. Download it and make adjustments in color, background, font etc. as per your unique business setting.

Comparative Analysis Of Manufacturing Data Analytics Software Solutions Elements PDF
This slide represents the comparison between different software solutions provided for manufacturing analytics. It includes fault prediction, preventive maintenance, demand forecasting, robotization, inventory management , product development etc. Showcasing this set of slides titled Comparative Analysis Of Manufacturing Data Analytics Software Solutions Elements PDF. The topics addressed in these templates are Preventive Maintenance, Inventory Management, Risk Management. All the content presented in this PPT design is completely editable. Download it and make adjustments in color, background, font etc. as per your unique business setting.

Smartphone App Installation Metrics Dashboard With User Sessions Microsoft PDF
This slide showcases dashboard that can help organization to identify the installation trend of mobile application and formulate strategies in case of declining downloads. Its key components are installs trend, total installs, total sessions and total media source breakdown by revenue. Pitch your topic with ease and precision using this Smartphone App Installation Metrics Dashboard With User Sessions Microsoft PDF. This layout presents information on Smartphone App Installation Metrics Dashboard With User Sessions. It is also available for immediate download and adjustment. So, changes can be made in the color, design, graphics or any other component to create a unique layout.
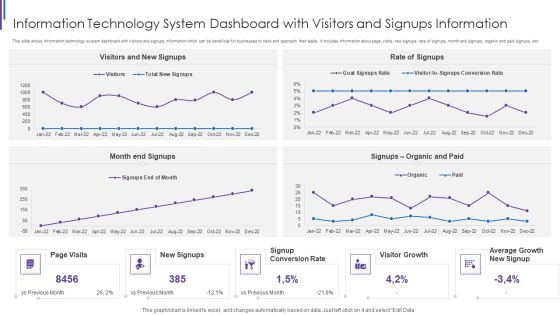
Information Technology System Dashboard With Visitors And Signups Information Guidelines PDF
This slide shows information technology system dashboard with visitors and signups information which can be beneficial for businesses to track and approach their leads. It includes information about page visits, new signups, rate of signups, month end signups, organic and paid signups, etc. Showcasing this set of slides titled Information Technology System Dashboard With Visitors And Signups Information Guidelines PDF. The topics addressed in these templates are Rate Of Signups, Month End Signups, Signup Conversion Rate, Visitors And New. All the content presented in this PPT design is completely editable. Download it and make adjustments in color, background, font etc. as per your unique business setting.

Data Quality Kpis Issues Prioritization Scorecard With Assessment Metrics Ideas PDF
This slide covers key data quality issues for e-commerce customers. It includes different metrics to check for impact of data issues in context to sales contribution analysis, marketing testimonials, customer financial risk, marketing campaigns, customer renewal analysis, etc. Showcasing this set of slides titled Data Quality Kpis Issues Prioritization Scorecard With Assessment Metrics Ideas PDF. The topics addressed in these templates are Context Of Analysis, Data Quality Attributes. All the content presented in this PPT design is completely editable. Download it and make adjustments in color, background, font etc. as per your unique business setting.

Project Data Quality Kpis Metrics Summary Dashboard With Threshold Guidelines PDF
This slide covers different KPIs to measure performance of data quality for project completion. It includes metric such as consistency, completeness, orderliness, timeliness, accuracy, auditability and uniqueness with thresholds. Pitch your topic with ease and precision using this Project Data Quality Kpis Metrics Summary Dashboard With Threshold Guidelines PDF. This layout presents information on Consistency, Completeness, Orderliness. It is also available for immediate download and adjustment. So, changes can be made in the color, design, graphics or any other component to create a unique layout.

Nike Emotional Branding Strategy Analyzing Brands Key Financial Indicators Summary PDF
This slide showcases assessing key indicators for measuring financial performance of brand. It provides details about turnover, marketing costs, sales, administrative expenses, profit, percentage turnover, trade debtor days, headcount, etc. Create an editable Nike Emotional Branding Strategy Analyzing Brands Key Financial Indicators Summary PDF that communicates your idea and engages your audience. Whether youre presenting a business or an educational presentation, pre designed presentation templates help save time. Nike Emotional Branding Strategy Analyzing Brands Key Financial Indicators Summary PDF is highly customizable and very easy to edit, covering many different styles from creative to business presentations. Slidegeeks has creative team members who have crafted amazing templates. So, go and get them without any delay.

Use Case For Implementing Remarkable Marketing Strategy Formats PDF
This slide provides glimpse about a business use case of a business organization using remarkable buzz marketing strategy to generate consumer interest and expand the customer base. It includes context, challenges, solution, results, etc. The Use Case For Implementing Remarkable Marketing Strategy Formats PDF is a compilation of the most recent design trends as a series of slides. It is suitable for any subject or industry presentation, containing attractive visuals and photo spots for businesses to clearly express their messages. This template contains a variety of slides for the user to input data, such as structures to contrast two elements, bullet points, and slides for written information. Slidegeeks is prepared to create an impression.

KPI Dashboard To Track Logistics Center Performance Ppt Styles Graphic Images PDF
This slide shows the KPI dashboard for monitoring activities of logistics hub. It includes fleet status, delivery status, delivery by region, average loading time, etc. Showcasing this set of slides titled KPI Dashboard To Track Logistics Center Performance Ppt Styles Graphic Images PDF. The topics addressed in these templates are Fleet Status, Delivery Status, Delivery By Region. All the content presented in this PPT design is completely editable. Download it and make adjustments in color, background, font etc. as per your unique business setting.

Agile Project Activity Monitoring With Status Information PDF
This slide illustrates project development status of agile program. It includes scope, schedule, cost, risks, quality, sprint deliverables such as headline, start, end, status, etc. Showcasing this set of slides titled Agile Project Activity Monitoring With Status Information PDF. The topics addressed in these templates are Agile Project, Activity Monitoring Status. All the content presented in this PPT design is completely editable. Download it and make adjustments in color, background, font etc. as per your unique business setting.

Performance KPI Dashboard To E Commerce Project Management Ppt Summary Inspiration PDF
Mentioned slide highlights a comprehensive dashboard which can be used by eCommerce businesses to plan and manage its various projects. The template provides information about total visitors in the current year, sales history of various products, result of the marketing campaign, etc. Showcasing this set of slides titled Performance KPI Dashboard To E Commerce Project Management Ppt Summary Inspiration PDF. The topics addressed in these templates are Revenue Growth, Order Summary, Latest Updates. All the content presented in this PPT design is completely editable. Download it and make adjustments in color, background, font etc. as per your unique business setting.
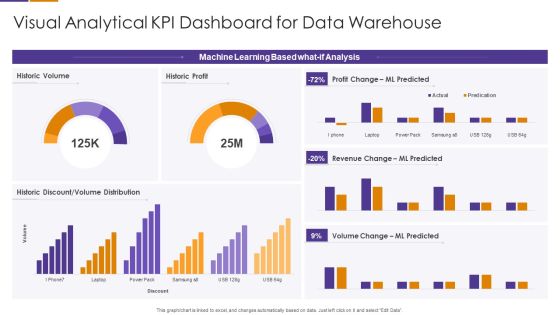
Visual Analytical KPI Dashboard For Data Warehouse Template PDF
Pitch your topic with ease and precision using this Visual Analytical KPI Dashboard For Data Warehouse Template PDF This layout presents information on Machine Learning Based, Volume Change, Revenue Change It is also available for immediate download and adjustment. So, changes can be made in the color, design, graphics or any other component to create a unique layout.
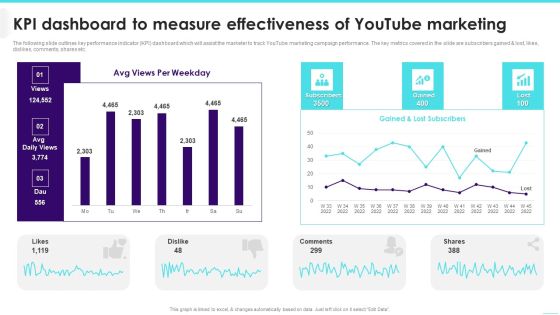
KPI Dashboard To Measure Effectiveness Of Youtube Marketing Inspiration PDF
The following slide outlines key performance indicator KPI dashboard which will assist the marketer to track YouTube marketing campaign performance. The key metrics covered in the slide are subscribers gained lost, likes, dislikes, comments, shares etc.Deliver an awe inspiring pitch with this creative KPI Dashboard To Measure Effectiveness Of Youtube Marketing Inspiration PDF bundle. Topics like Lost Subscribers, Comments, Per Weekday can be discussed with this completely editable template. It is available for immediate download depending on the needs and requirements of the user.

Projects Portfolio Roadmap With Health And Budget Cost Status Dashboard Pictures PDF
This slide covers timeline for multi projects with key assigned person. It also includes dashboard stating number of projects, health status and total budget allocated. Showcasing this set of slides titled Projects Portfolio Roadmap With Health And Budget Cost Status Dashboard Pictures PDF. The topics addressed in these templates are Projects Portfolio Roadmap, Health And Budget, Cost Status Dashboard. All the content presented in this PPT design is completely editable. Download it and make adjustments in color, background, font etc. as per your unique business setting.
Lead Tracking Dashboard With Metric Comparison Brochure PDF
This slide showcases dashboard of lead pipeline that can help to identify total number of leads generated and expenses incurred to acquire the audience. It also showcases other key performance metrics like lead breakdown by status and number of leads per month. Pitch your topic with ease and precision using this Lead Tracking Dashboard With Metric Comparison Brochure PDF. This layout presents information on Metric Comparison, Lead Pipeline, Lead Breakdown Status. It is also available for immediate download and adjustment. So, changes can be made in the color, design, graphics or any other component to create a unique layout.

Cloud Performance Tracking Dashboard Professional PDF
This slide covers the Key performance indicators for tracking performance of the cloud such as violations break down, sources, rules and severity. Deliver an awe inspiring pitch with this creative Cloud Performance Tracking Dashboard Professional PDF bundle. Topics like Cloud Performance, Tracking Dashboard can be discussed with this completely editable template. It is available for immediate download depending on the needs and requirements of the user.

Data Interpretation And Evaluation Readiness Form Of Company Summary PDF
This slide represents the survey results of assessment of data and analytics skills conducted by an organization. It includes five questions along with their confidence levels. Showcasing this set of slides titled Data Interpretation And Evaluation Readiness Form Of Company Summary PDF. The topics addressed in these templates are Individual Analyze, Capabilities, Analytics Tools. All the content presented in this PPT design is completely editable. Download it and make adjustments in color, background, font etc. as per your unique business setting.
Ppt 3d Illustration Of Surprised Emoticon Picture PowerPoint Templates
PPT 3d illustration of surprised emoticon picture PowerPoint Templates-Use this Amazing 3D PowerPoint Diagram to express the Surprising Situation. This Diagram can be used in Business related Presentations. It consists of other colorful Emoticons which can be used for different purposes.-PPT 3d illustration of surprised emoticon picture PowerPoint Templates
Ppt Angry Emoticons Illustration Picture Time Management PowerPoint Templates
PPT angry emoticons illustration picture time management powerpoint Templates-By using this Business PowerPoint Diagram you will be able to represent different types of angry emoticons. It portrays the concept of irritation, mad, outrage, passion, peevishness, petulance, rage, resentment, slow burn, soreness, stew, storm, tantrum, temper, tiff, vexation, violence.-PPT angry emoticons illustration picture time management powerpoint Templates

Process Workflow Of Data Enablement Framework Across Organization Summary PDF
This slide illustrates work flowchart process for data enablement in organization. It includes data sources, data ingestion, streaming, data delivery, analytic applications, etc. Showcasing this set of slides titled Process Workflow Of Data Enablement Framework Across Organization Summary PDF. The topics addressed in these templates are Data Access, Virtualization, Data Delivery. All the content presented in this PPT design is completely editable. Download it and make adjustments in color, background, font etc. as per your unique business setting.
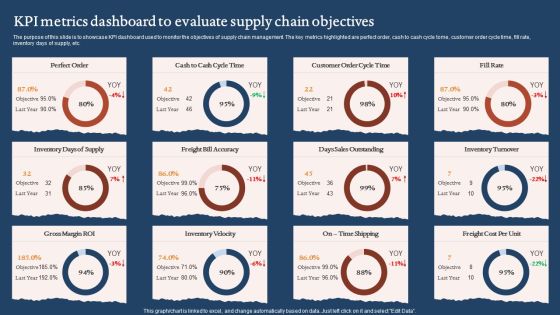
KPI Metrics Dashboard To Evaluate Supply Chain Objectives Graphics PDF
The purpose of this slide is to showcase KPI dashboard used to monitor the objectives of supply chain management. The key metrics highlighted are perfect order, cash to cash cycle tome, customer order cycle time, fill rate, inventory days of supply, etc. Pitch your topic with ease and precision using this KPI Metrics Dashboard To Evaluate Supply Chain Objectives Graphics PDF. This layout presents information on Days Sales Outstanding, Inventory Velocity, Gross Margin Roi. It is also available for immediate download and adjustment. So, changes can be made in the color, design, graphics or any other component to create a unique layout.
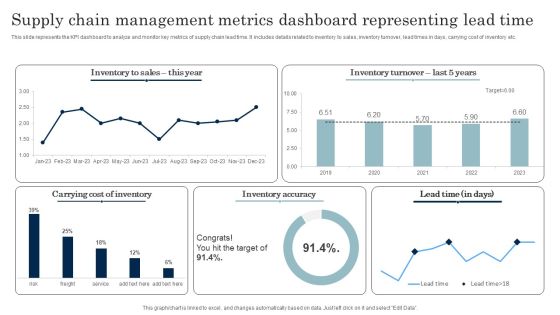
Supply Chain Management Metrics Dashboard Representing Lead Time Download PDF
This slide represents the KPI dashboard to analyze and monitor key metrics of supply chain lead time. It includes details related to inventory to sales, inventory turnover, lead times in days, carrying cost of inventory etc. Pitch your topic with ease and precision using this Supply Chain Management Metrics Dashboard Representing Lead Time Download PDF. This layout presents information on Inventory Accuracy, Carrying Cost Of Inventory. It is also available for immediate download and adjustment. So, changes can be made in the color, design, graphics or any other component to create a unique layout.

Calculate Facebook Key Performance Indicator Ppt PowerPoint Presentation Complete Deck With Slides
This complete deck acts as a great communication tool. It helps you in conveying your business message with personalized sets of graphics, icons etc. Comprising a set of eleven slides, this complete deck can help you persuade your audience. It also induces strategic thinking as it has been thoroughly researched and put together by our experts. Not only is it easily downloadable but also editable. The color, graphics, theme any component can be altered to fit your individual needs. So grab it now.

Iot Digital Twin Technology Post Covid Expenditure Management Healthcare Dashboard Showing Analytical Data Brochure PDF
This slide shows the healthcare dashboard that presents analytical data such as occupancy, patient turnover, efficiency and costs, satisfaction and service indicators. Deliver an awe inspiring pitch with this creative iot digital twin technology post covid expenditure management healthcare dashboard showing analytical data brochure pdf bundle. Topics like service, indicators, cost, appointments, turnover can be discussed with this completely editable template. It is available for immediate download depending on the needs and requirements of the user.
Technology Upgradation Action Plan Dashboard For Issues Tracking Ppt Portfolio Graphics Pictures PDF
This slide shows the issues tracking the dashboard for the business transition project. It provides details of multiple issues faced by users to keep records for effective management of the project. Deliver an awe inspiring pitch with this creative Technology Upgradation Action Plan Dashboard For Issues Tracking Ppt Portfolio Graphics Pictures PDF bundle. Topics like Issues Failed Verification, Immediate Issues, High Churn Issues, Suspect Requirements, Failed Test Runs can be discussed with this completely editable template. It is available for immediate download depending on the needs and requirements of the user.

Risk Assessment Software Dashboard For Cybersecurity Ppt PowerPoint Presentation Gallery Pictures PDF
This slide represents risk assessment software dashboard for cybersecurity. It includes risk percentage, number of risks, risk analysis progress, risk response progress, risk rating etc. Showcasing this set of slides titled Risk Assessment Software Dashboard For Cybersecurity Ppt PowerPoint Presentation Gallery Pictures PDF. The topics addressed in these templates are Risk Rating Breakdown, Action Plan Breakdown, Top 5 Entities Prone To Risk. All the content presented in this PPT design is completely editable. Download it and make adjustments in color, background, font etc. as per your unique business setting.
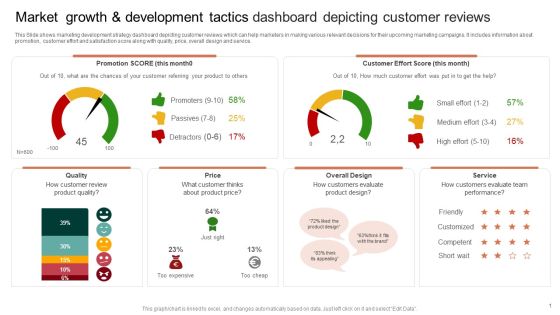
Market Growth And Development Tactics Dashboard Depicting Customer Reviews Pictures PDF
This Slide shows marketing development strategy dashboard depicting customer reviews which can help marketers in making various relevant decisions for their upcoming marketing campaigns. It includes information about promotion, customer effort and satisfaction score along with quality, price, overall design and service. Showcasing this set of slides titled Market Growth And Development Tactics Dashboard Depicting Customer Reviews Pictures PDF. The topics addressed in these templates are Product Price, Product Quality, Overall Design. All the content presented in this PPT design is completely editable. Download it and make adjustments in color, background, font etc. as per your unique business setting.

Product Procurement Management Dashboard With Defect Rate Supplier Availability And Lead Time Pictures PDF
This slide shows a dashboard of procurement to provide real time information about various components. It includes defect rate, on time supplies , supplier availability and lead time. Showcasing this set of slides titled Product Procurement Management Dashboard With Defect Rate Supplier Availability And Lead Time Pictures PDF. The topics addressed in these templates are Supplier Defect Rate, Supplier Availability, Lead Time. All the content presented in this PPT design is completely editable. Download it and make adjustments in color, background, font etc. as per your unique business setting.
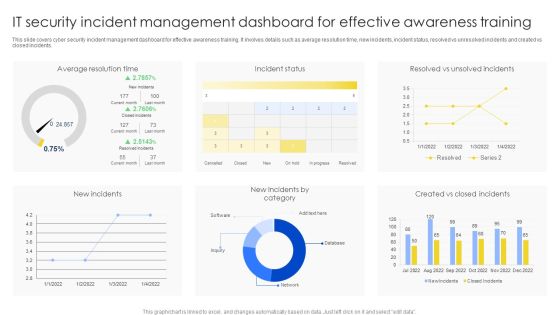
IT Security Incident Management Dashboard For Effective Awareness Training Pictures PDF
This slide covers cyber security incident management dashboard for effective awareness training. It involves details such as average resolution time, new incidents, incident status, resolved vs unresolved incidents and created vs closed incidents. Showcasing this set of slides titled IT Security Incident Management Dashboard For Effective Awareness Training Pictures PDF. The topics addressed in these templates are Average Resolution Time, Incident Status, New Incidents. All the content presented in this PPT design is completely editable. Download it and make adjustments in color, background, font etc. as per your unique business setting.

Multichannel Banking System Performance Analysis Dashboard Ppt Pictures Background Designs PDF
This slide represents the dashboard showing the analysis of omnichannel banking performance. It includes details related to last week summary, transaction volume and value over time etc. Showcasing this set of slides titled Multichannel Banking System Performance Analysis Dashboard Ppt Pictures Background Designs PDF. The topics addressed in these templates are Last Week Summary, Transaction Volume, Over Time. All the content presented in this PPT design is completely editable. Download it and make adjustments in color, background, font etc. as per your unique business setting.

Big Data And Analytics Framework Diagram Introduction PDF
This slide provide information about bid data architecture to effectively and efficiently store organization data. It includes elements such as data sources, storage, real time message ingestion, stream processing, batch processing etc. Showcasing this set of slides titled Big Data And Analytics Framework Diagram Introduction PDF. The topics addressed in these templates are Data Sources, Data Storage, Batch Processing. All the content presented in this PPT design is completely editable. Download it and make adjustments in color, background, font etc. as per your unique business setting.
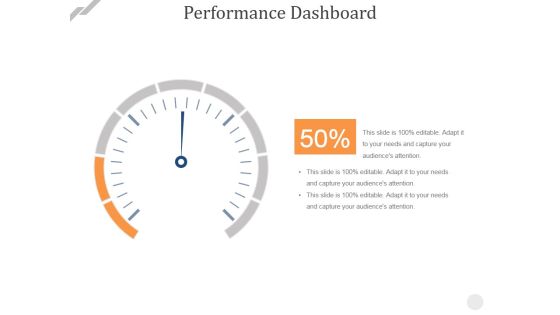
Performance Dashboard Template 2 Ppt PowerPoint Presentation Picture
This is a performance dashboard template 2 ppt powerpoint presentation picture. This is a one stage process. The stages in this dashboard, planning, management, strategy, marketing, business.

Data Science Model For Healthcare Analytics Microsoft PDF
The following slide presents a framework showing key steps to execute healthcare analytics using data science. It includes key components such as data fusion, data integration, data driven models, knowledge driven models, data analytics, decision analytics, analytics outcome, etc. Showcasing this set of slides titled Data Science Model For Healthcare Analytics Microsoft PDF. The topics addressed in these templates are Analytics Methods, Analytics Models, Analytics Options. All the content presented in this PPT design is completely editable. Download it and make adjustments in color, background, font etc. as per your unique business setting.

Big Data And Analytics Integration Architecture Themes PDF
The purpose of this slide is to highlight the strategic model along with various tools and techniques to store and extract big data and analytics. The major components include web applications, external databases, cloud computing, big data storage etc. Showcasing this set of slides titled Big Data And Analytics Integration Architecture Themes PDF. The topics addressed in these templates are Data Discovery Platform, Big Data Storage, Enterprise Database. All the content presented in this PPT design is completely editable. Download it and make adjustments in color, background, font etc. as per your unique business setting.

Customer Service Metrics Dashboard With Net Retention Rate Sample PDF
This slide showcases KPI dashboard for customer service that can help to compare the customer churn rate, revenue churn rate, net retention rate and MRR growth rate as compared to previous month. Its key elements are net promoter score, loyal customer rate, percentage of premium users and customer lifetime value. Pitch your topic with ease and precision using this Customer Service Metrics Dashboard With Net Retention Rate Sample PDF. This layout presents information on Loyal Customer Rate, Premium Users, Customer Lifetime Value. It is also available for immediate download and adjustment. So, changes can be made in the color, design, graphics or any other component to create a unique layout.

Quarterly Cost Variance Analysis With Maintenance Metrics Dashboard Information PDF
The following slide depicts a maintenance KPI dashboard to have useful insights for effective decision making. It includes key performance areas such as quarterly cost variance, scrap, quarterly run time variance analysis etc. Pitch your topic with ease and precision using this Quarterly Cost Variance Analysis With Maintenance Metrics Dashboard Information PDF. This layout presents information on Production, Budgeted Cost, Planned Run Time, Actual Run Time. It is also available for immediate download and adjustment. So, changes can be made in the color, design, graphics or any other component to create a unique layout.

Information Visualization Research Branch Template PDF
This slide explains information visualization as a branch of visualization research that includes visuals like histograms, trend graphs, flow charts. Slidegeeks is here to make your presentations a breeze with Information Visualization Research Branch Template PDF With our easy to use and customizable templates, you can focus on delivering your ideas rather than worrying about formatting. With a variety of designs to choose from, you are sure to find one that suits your needs. And with animations and unique photos, illustrations, and fonts, you can make your presentation pop. So whether you are giving a sales pitch or presenting to the board, make sure to check out Slidegeeks first.
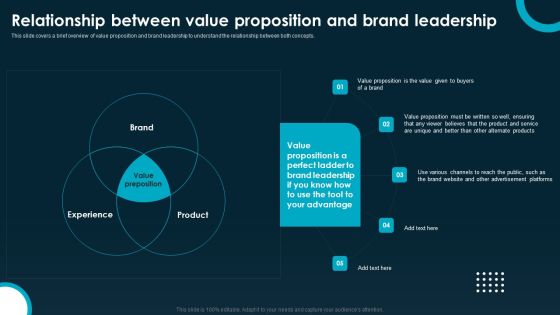
Relationship Between Value Proposition And Brand Leadership Introduction PDF
This slide covers a brief overview of value proposition and brand leadership to understand the relationship between both concepts. Slidegeeks is here to make your presentations a breeze with Relationship Between Value Proposition And Brand Leadership Introduction PDF With our easy to use and customizable templates, you can focus on delivering your ideas rather than worrying about formatting. With a variety of designs to choose from, you are sure to find one that suits your needs. And with animations and unique photos, illustrations, and fonts, you can make your presentation pop. So whether you are giving a sales pitch or presenting to the board, make sure to check out Slidegeeks first.

Forecast Analysis Technique IT Methods Of Data Clustering In Predictive Modeling Formats PDF
This slide outlines the two primary information clustering methods used in the predictive analytics clustering model. The methods include K means and K nearest neighbor clustering, including the working of both approaches. Create an editable Forecast Analysis Technique IT Methods Of Data Clustering In Predictive Modeling Formats PDF that communicates your idea and engages your audience. Whether you are presenting a business or an educational presentation, pre designed presentation templates help save time. Forecast Analysis Technique IT Methods Of Data Clustering In Predictive Modeling Formats PDF is highly customizable and very easy to edit, covering many different styles from creative to business presentations. Slidegeeks has creative team members who have crafted amazing templates. So, go and get them without any delay.
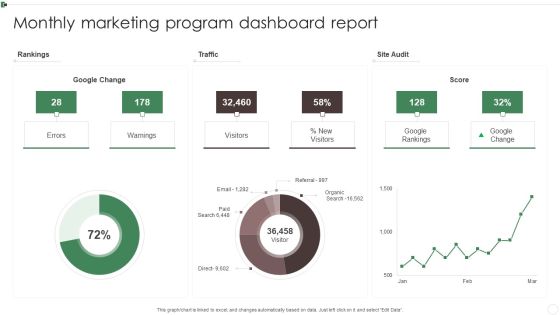
Monthly Marketing Program Dashboard Report Ppt Inspiration Information PDF
This graph or chart is linked to excel, and changes automatically based on data. Just left click on it and select Edit Data. Pitch your topic with ease and precision using this Monthly Marketing Program Dashboard Report Ppt Inspiration Information PDF. This layout presents information on Rankings, Traffic, Site Audit, Warnings. It is also available for immediate download and adjustment. So, changes can be made in the color, design, graphics or any other component to create a unique layout.

Cyber Security Incident Response KPI Dashboard Microsoft PDF
This slide represents dashboard showing the key metrics of cyber security incident response. It includes key performance indicators such as risk score, compliance status, threat level etc. Slidegeeks has constructed Cyber Security Incident Response KPI Dashboard Microsoft PDF after conducting extensive research and examination. These presentation templates are constantly being generated and modified based on user preferences and critiques from editors. Here, you will find the most attractive templates for a range of purposes while taking into account ratings and remarks from users regarding the content. This is an excellent jumping off point to explore our content and will give new users an insight into our top notch PowerPoint Templates.


 Continue with Email
 Sign up for an account
 Home
Home