AI PPT Maker
Templates
PPT Bundles
Design Services
Business PPTs
Business Plan
Management
Strategy
Introduction PPT
Roadmap
Self Introduction
Timelines
Process
Marketing
Agenda
Technology
Medical
Startup Business Plan
Cyber Security
Dashboards
SWOT
Proposals
Education
Pitch Deck
Digital Marketing
KPIs
Project Management
Product Management
Artificial Intelligence
Target Market
Communication
Supply Chain
Google Slides
Research Services
 One Pagers
All Categories
-
Home
- Customer Favorites
- Business Model Comparison
Business Model Comparison
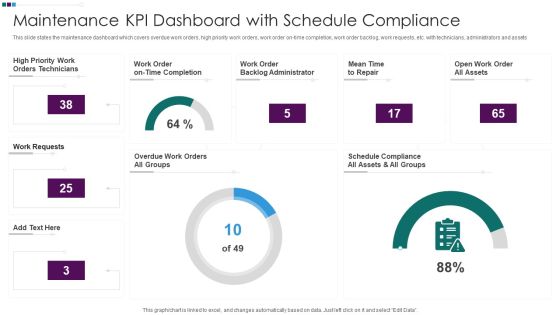
Maintenance KPI Dashboard With Schedule Compliance Ppt Styles Demonstration PDF
This slide states the maintenance dashboard which covers overdue work orders, high priority work orders, work order on-time completion, work order backlog, work requests, etc. with technicians, administrators and assets. Pitch your topic with ease and precision using this Maintenance KPI Dashboard With Schedule Compliance Ppt Styles Demonstration PDF. This layout presents information on High Priority Work, Work Order Backlog, Mean Time Repair, Open Work Order. It is also available for immediate download and adjustment. So, changes can be made in the color, design, graphics or any other component to create a unique layout.
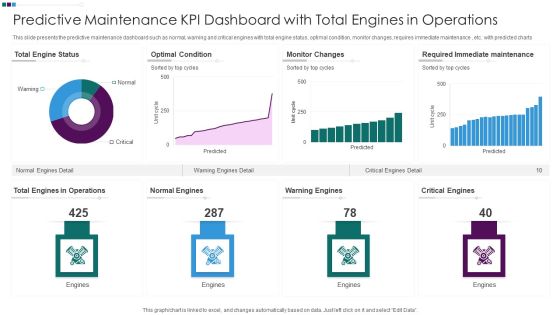
Predictive Maintenance KPI Dashboard With Total Engines In Operations Ppt Professional Inspiration PDF
This slide presents the predictive maintenance dashboard such as normal, warning and critical engines with total engine status, optimal condition, monitor changes, requires immediate maintenance , etc. with predicted charts. Pitch your topic with ease and precision using this Predictive Maintenance KPI Dashboard With Total Engines In Operations Ppt Professional Inspiration PDF. This layout presents information on Total Engine Status, Optimal Condition Monitor, Changes Warning Engines, Required Immediate Maintenance. It is also available for immediate download and adjustment. So, changes can be made in the color, design, graphics or any other component to create a unique layout.

Inventory Management System To Track Stock Quantity Demonstration PDF
This slide covers stock inventory management system to track stock quantity. It involves product code, description, warehouse, quantity on hand, average cost and total cost. Pitch your topic with ease and precision using this Inventory Management System To Track Stock Quantity Demonstration PDF. This layout presents information on Inventory Management System, Stock Quantity, Quantity On Hand. It is also available for immediate download and adjustment. So, changes can be made in the color, design, graphics or any other component to create a unique layout.
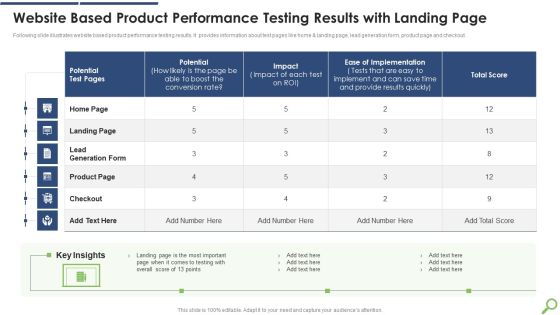
Website Based Product Performance Testing Results With Landing Page Mockup PDF
Following slide illustrates website based product performance testing results. It provides information about test pages like home and landing page, lead generation form, product page and checkout. Pitch your topic with ease and precision using this Website Based Product Performance Testing Results With Landing Page Mockup PDF This layout presents information on Provide Results, Potential Test, Ease Of Implementation It is also available for immediate download and adjustment. So, changes can be made in the color, design, graphics or any other component to create a unique layout.

Comparative Assessment Of Inventory And Asset Monitoring Summary PDF
This slide covers comparative assessment of inventory and asset tracking based on key parameters. It involves parameters such as maintenance, return process, timeline and prepare for next use.Pitch your topic with ease and precision using this Comparative Assessment Of Inventory And Asset Monitoring Summary PDF This layout presents information on Inventory Tracking, Asset Tracking, Maintenance Needed It is also available for immediate download and adjustment. So, changes can be made in the color, design, graphics or any other component to create a unique layout.

BCWP Project Management Performance Measures Download PDF
The following slide highlights the earned value management performance measures illustrating key headings which includes performance measures, performance indices, variances, cost variance, schedule variance, cost performance index, schedule performance index and status.Pitch your topic with ease and precision using this BCWP Project Management Performance Measures Download PDF This layout presents information on Schedule Variance, Cost Performance, Schedule Performance It is also available for immediate download and adjustment. So, changes can be made in the color, design, graphics or any other component to create a unique layout.

Brand Value Proposition Assessment Questionnaire Download PDF
The slide highlights the brand value proposition assessment questionnaire illustrating assessment questions and responses with scores. Assessment questions depicts clearly draft and define, relevance, differentiation, reflection in brand behaviour Pitch your topic with ease and precision using this Brand Value Proposition Assessment Questionnaire Download PDF This layout presents information on Assessment Questions, Completely Disagree, Mostly Disagree It is also available for immediate download and adjustment. So, changes can be made in the color, design, graphics or any other component to create a unique layout.
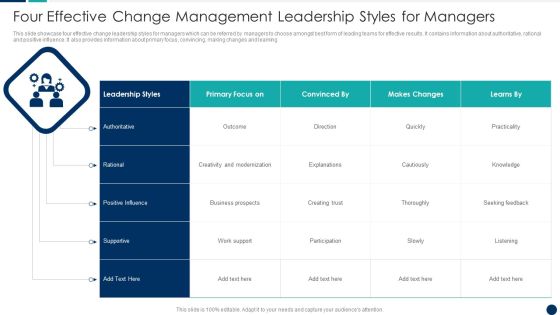
Four Effective Change Management Leadership Styles For Managers Sample PDF
This slide showcase four effective change leadership styles for managers which can be referred by managers to choose amongst best form of leading teams for effective results. It contains information about authoritative, rational and positive influence. It also provides information about primary focus, convincing, making changes and learning Pitch your topic with ease and precision using this Four Effective Change Management Leadership Styles For Managers Sample PDF This layout presents information on Creativity Modernization, Positive Influence, Makes Changes It is also available for immediate download and adjustment. So, changes can be made in the color, design, graphics or any other component to create a unique layout.
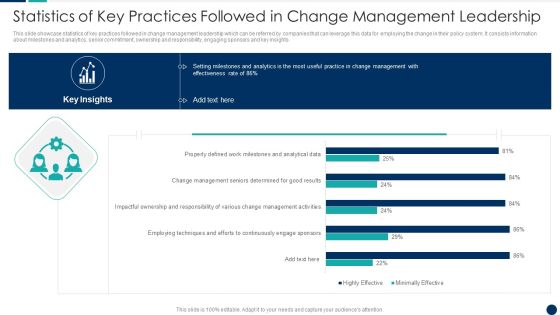
Statistics Of Key Practices Followed In Change Management Leadership Ideas PDF
This slide showcase statistics of key practices followed in change management leadership which can be referred by companies that can leverage this data for employing the change in their policy system. It consists information about milestones and analytics, senior commitment, ownership and responsibility, engaging sponsors and key insights.Pitch your topic with ease and precision using this Statistics Of Key Practices Followed In Change Management Leadership Ideas PDF This layout presents information on Employing Techniques, Efforts Continuously, Engage Sponsors It is also available for immediate download and adjustment. So, changes can be made in the color, design, graphics or any other component to create a unique layout.

Cross Functional Team Alliance Challenges With Mitigating Solutions Pictures PDF
This slide showcases challenges that can create hindrance in cross functional team and project collaboration. It also outlines solutions to overcome the roadblocks and their impact on employees coordination Pitch your topic with ease and precision using this Cross Functional Team Alliance Challenges With Mitigating Solutions Pictures PDF This layout presents information on Geographical Limitations, Team Dynamics, Communicate Goals It is also available for immediate download and adjustment. So, changes can be made in the color, design, graphics or any other component to create a unique layout.
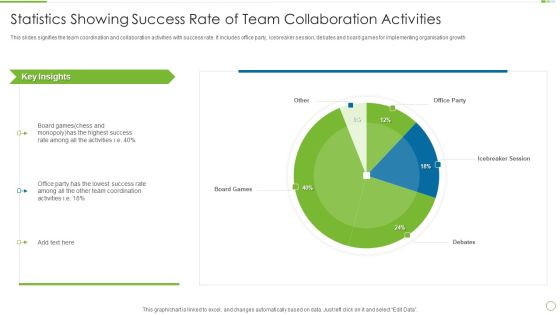
Statistics Showing Success Rate Of Team Collaboration Activities Information PDF
This slides signifies the team coordination and collaboration activities with success rate. It includes office party, icebreaker session, debates and board games for implementing organisation growth. Pitch your topic with ease and precision using this Statistics Showing Success Rate Of Team Collaboration Activities Information PDF This layout presents information on Highest Success, Lowest Success, Team Coordination It is also available for immediate download and adjustment. So, changes can be made in the color, design, graphics or any other component to create a unique layout.

Skill Evaluation Dashboard With Turnover Rate Ideas PDF
Mentioned slide delineates talent assessment dashboard which will assist companies to frame efficient recruitment strategy. This dashboard provides detail information about hiring stats, talent turnover rate, talent rating, fired talents etc.Pitch your topic with ease and precision using this Skill Evaluation Dashboard With Turnover Rate Ideas PDF This layout presents information on Talent Management, Talent Satisfaction, Talent Rating It is also available for immediate download and adjustment. So, changes can be made in the color, design, graphics or any other component to create a unique layout.

Skill Evaluation Report For Identifying Skill Gap Microsoft PDF
Following slide depicts talent assessment report of current employees which can be used by managers for identifying the skill gap. This slide provides information about skills like written and verbal communication, use of CRM and research along with current score, desired score, reasons for gap and corrective action to be taken to overcome the skill gap.Pitch your topic with ease and precision using this Skill Evaluation Report For Identifying Skill Gap Microsoft PDF This layout presents information on Verbal Communication, Corrective Required, Provide Personality It is also available for immediate download and adjustment. So, changes can be made in the color, design, graphics or any other component to create a unique layout.
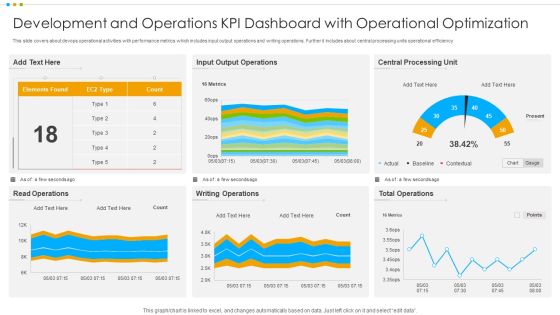
Development And Operations KPI Dashboard With Operational Optimization Pictures PDF
This slide covers about devops operational activities with performance metrics which includes input output operations and writing operations. Further it includes about central processing units operational efficiency.Pitch your topic with ease and precision using this Development And Operations KPI Dashboard With Operational Optimization Pictures PDF This layout presents information on Output Operations, Central Processing, Total Operations It is also available for immediate download and adjustment. So, changes can be made in the color, design, graphics or any other component to create a unique layout.

Dashboard For Hiring Data Analysis By Recruitment Team Formats PDF
The slide highlights the dashboard for hiring data analysis by recruitment team depicting of open job positions, jobs approved, candidates in recruitment pipeline and job assigned to team.Pitch your topic with ease and precision using this Dashboard For Hiring Data Analysis By Recruitment Team Formats PDF This layout presents information on Candidates Recruitment, Marketing Communication, Approved It is also available for immediate download and adjustment. So, changes can be made in the color, design, graphics or any other component to create a unique layout.
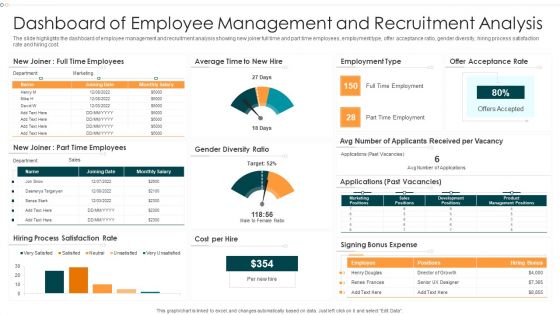
Dashboard Of Employee Management And Recruitment Analysis Infographics PDF
The slide highlights the dashboard of employee management and recruitment analysis showing new joiner full time and part time employees, employment type, offer acceptance ratio, gender diversity, hiring process satisfaction rate and hiring cost.Pitch your topic with ease and precision using this Dashboard Of Employee Management And Recruitment Analysis Infographics PDF This layout presents information on Dashboard Employee, Management, Recruitment Analysis It is also available for immediate download and adjustment. So, changes can be made in the color, design, graphics or any other component to create a unique layout.
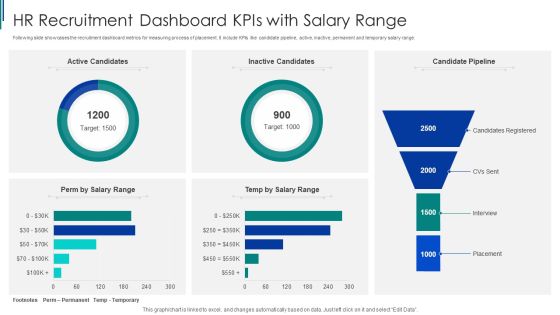
HR Recruitment Dashboard Kpis With Salary Range Ppt Inspiration Rules PDF
Following slide showcases the recruitment dashboard metrics for measuring process of placement. It include KPIs like candidate pipeline, active, inactive, permanent and temporary salary range. Pitch your topic with ease and precision using this HR Recruitment Dashboard Kpis With Salary Range Ppt Inspiration Rules PDF. This layout presents information on HR Recruitment, Dashboard Kpis, Salary Range. It is also available for immediate download and adjustment. So, changes can be made in the color, design, graphics or any other component to create a unique layout.
Risk Associated With Team Working Environment In Workplace Ppt Icon Examples PDF
This slide represents risk associated with collaborative working environment in workplace. It covers risk such as wasting time, poor project management poor strategy execution, negative impact n employee morale and security risk. Pitch your topic with ease and precision using this Risk Associated With Team Working Environment In Workplace Ppt Icon Examples PDF. This layout presents information on Risk, Strategy Execution, Project Management. It is also available for immediate download and adjustment. So, changes can be made in the color, design, graphics or any other component to create a unique layout.

Strategies To Enhance Team Working At Workplace Ppt Pictures Objects PDF
This slide represents strategies for enhancing collaborative working in workspace. It covers promotion of frequent communication, ensuring leadership support, leverage collaborative technology and develop teamwork skills. Pitch your topic with ease and precision using this Strategies To Enhance Team Working At Workplace Ppt Pictures Objects PDF. This layout presents information on Promote Frequent Communication, Leverage Collaboration Technology, Develop Teamwork Skills. It is also available for immediate download and adjustment. So, changes can be made in the color, design, graphics or any other component to create a unique layout.

Comparative Monthly Sales Report With Forecast Portrait PDF
The following slide highlights the comparative monthly sales report with forecast illustrating key headings which includes key headings category name, current month, last month and next month forecast. Pitch your topic with ease and precision using this Comparative Monthly Sales Report With Forecast Portrait PDF. This layout presents information on Quantity, Monthly Sales Report, Dairy Products. It is also available for immediate download and adjustment. So, changes can be made in the color, design, graphics or any other component to create a unique layout.

Sales Team Monthly Report With Variance Background PDF
The following slide highlights the sales team monthly report with variance illustrating key headings which includes key headings month, sales, target, variance, percentage variance and key takeaways. Pitch your topic with ease and precision using this Sales Team Monthly Report With Variance Background PDF. This layout presents information on Sales Team Monthly Report With Variance Background PDF. It is also available for immediate download and adjustment. So, changes can be made in the color, design, graphics or any other component to create a unique layout.

Strategic Issue Management Checklist To Improve Project Effectiveness Infographics PDF
The following slide showcases checklist identify and control issues in project. It further includes key tasks and status complete, in progress, and incomplete related to them. Pitch your topic with ease and precision using this Strategic Issue Management Checklist To Improve Project Effectiveness Infographics PDF. This layout presents information on Issue Overcoming, Issue Identification, Issue Determination. It is also available for immediate download and adjustment. So, changes can be made in the color, design, graphics or any other component to create a unique layout.
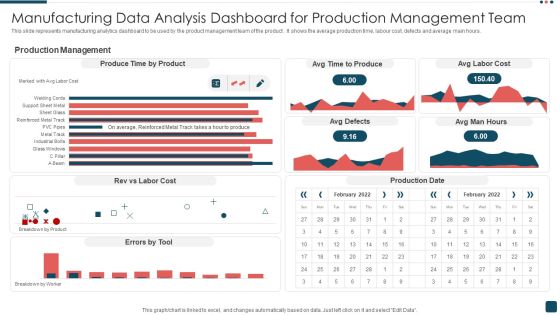
Manufacturing Data Analysis Dashboard For Production Management Team Summary PDF
This slide represents manufacturing analytics dashboard to be used by the product management team of the product . It shows the average production time, labour cost, defects and average main hours. Pitch your topic with ease and precision using this Manufacturing Data Analysis Dashboard For Production Management Team Summary PDF. This layout presents information on Production Management, Product, Cost. It is also available for immediate download and adjustment. So, changes can be made in the color, design, graphics or any other component to create a unique layout.

Key Metrics To Measure Effectiveness Of Data Loss Prevention Strategies Elements PDF
Following slide illustrates various metrics which can be used to evaluate the success rate of data loss prevention strategies. The key metrics could be Data classification success rate percentage of policy exceptions percentage of false positives etc. Pitch your topic with ease and precision using this Key Metrics To Measure Effectiveness Of Data Loss Prevention Strategies Elements PDF. This layout presents information on Data Classification Success Rate, Key Metrics, Source. It is also available for immediate download and adjustment. So, changes can be made in the color, design, graphics or any other component to create a unique layout.
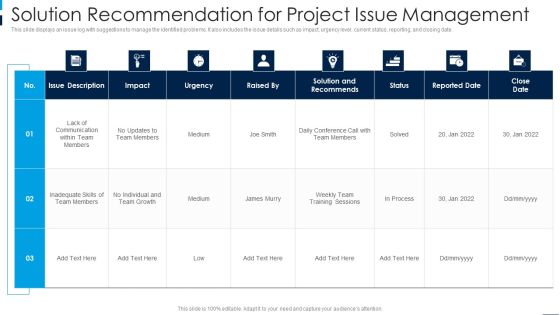
Solution Recommendation For Project Issue Management Background PDF
This slide displays an issue log with suggestions to manage the identified problems. It also includes the issue details such as impact, urgency level, current status, reporting, and closing date. Pitch your topic with ease and precision using this Solution Recommendation For Project Issue Management Background PDF. This layout presents information on Team Members, Communication, Team Growth. It is also available for immediate download and adjustment. So, changes can be made in the color, design, graphics or any other component to create a unique layout.

Line Chart Representing Outcomes Summary Of Product Sales Mockup PDF
This slide shows the graphical representation of sales volume of company products which includes product A , B and C which helps company to analyze the acceptability of products by potential customers.Pitch your topic with ease and precision using this Line Chart Representing Outcomes Summary Of Product Sales Mockup PDF This layout presents information on Company Generated, Maximum Revenues, Increasing For Product It is also available for immediate download and adjustment. So, changes can be made in the color, design, graphics or any other component to create a unique layout.
Outcomes Summary Of Company Revenues Using Pie Chart Icons PDF
This slide focuses on graphical representation of revenues earned by company which includes media such as print advertising, electronic-media, events, paid subscriptions , custom publishing, etc.Pitch your topic with ease and precision using this Outcomes Summary Of Company Revenues Using Pie Chart Icons PDF This layout presents information on Custom Publishing, Paid Subscriptions, Revenues Are Generated It is also available for immediate download and adjustment. So, changes can be made in the color, design, graphics or any other component to create a unique layout.
Yearly Outcomes Summary Of Profit And Loss Trends Icons PDF
This slide shows the graphical representation of result summary of profit and loss trends for five consecutive years that shows revenues, cost of goods sold, selling, general and administrative expenses, net income, etc.Pitch your topic with ease and precision using this Yearly Outcomes Summary Of Profit And Loss Trends Icons PDF This layout presents information on Earned Maximum, Selling General, Administrative Expenses It is also available for immediate download and adjustment. So, changes can be made in the color, design, graphics or any other component to create a unique layout.
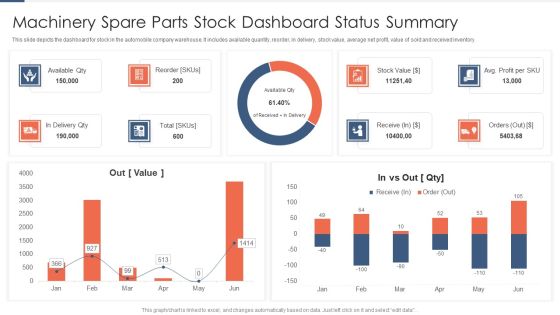
Machinery Spare Parts Stock Dashboard Status Summary Topics PDF
This slide depicts the dashboard for stock in the automobile company warehouse. It includes available quantity, reorder, in delivery, stock value, average net profit, value of sold and received inventory. Pitch your topic with ease and precision using this Machinery Spare Parts Stock Dashboard Status Summary Topics PDF. This layout presents information on Available Qty, Delivery Qty, Reorder. It is also available for immediate download and adjustment. So, changes can be made in the color, design, graphics or any other component to create a unique layout.
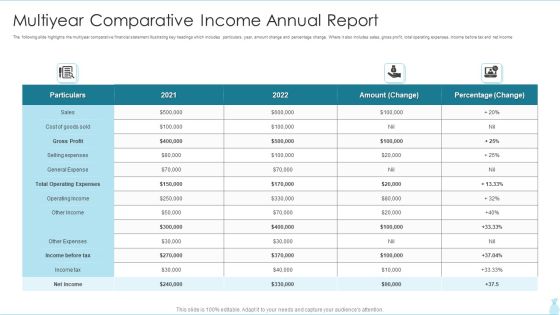
Multiyear Comparative Income Annual Report Rules PDF
The following slide highlights the multiyear comparative financial statement illustrating key headings which includes particulars, year, amount change and percentage change. Where it also includes sales, gross profit, total operating expenses, income before tax and net income.Pitch your topic with ease and precision using this Multiyear Comparative Income Annual Report Rules PDF This layout presents information on Gross Profit, Selling Expenses, Operating Expenses It is also available for immediate download and adjustment. So, changes can be made in the color, design, graphics or any other component to create a unique layout.

Essential Steps For Rapid Improvement Kaizen Process Ppt PowerPoint Presentation File Outfit PDF
This slide focuses on the steps for rapid improvement Kaizen event which such as defining problem, team formation, providing training, collecting information, value streaming, facilitating training sessions, prioritizing solutions, team recognition, problem visualization, etc. Pitch your topic with ease and precision using this Essential Steps For Rapid Improvement Kaizen Process Ppt PowerPoint Presentation File Outfit PDF. This layout presents information on Iterative Question, Defining Problem, Forming Team. It is also available for immediate download and adjustment. So, changes can be made in the color, design, graphics or any other component to create a unique layout.

Kaizen Process Report With Improvement Metrics Ppt PowerPoint Presentation File Icons PDF
This slide focuses on the kaizen event report which covers process owner, key performance indicators, summary, problem description, improvement metrics, goals, daily milestones, team members and other considerations, etc. Pitch your topic with ease and precision using this Kaizen Process Report With Improvement Metrics Ppt PowerPoint Presentation File Icons PDF. This layout presents information on Key Performance Indoctrinator, Improvement Goal, Improvement Metric. It is also available for immediate download and adjustment. So, changes can be made in the color, design, graphics or any other component to create a unique layout.
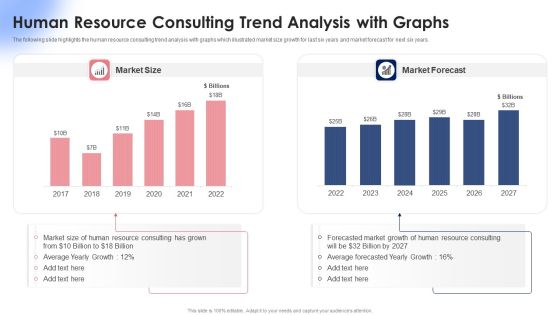
Human Resource Consulting Trend Analysis With Graphs Ppt Summary Clipart Images PDF
The following slide highlights the human resource consulting trend analysis with graphs which illustrated market size growth for last six years and market forecast for next six years. Pitch your topic with ease and precision using this Human Resource Consulting Trend Analysis With Graphs Ppt Summary Clipart Images PDF. This layout presents information on Market Size, Market Forecast, 2017 To 2022. It is also available for immediate download and adjustment. So, changes can be made in the color, design, graphics or any other component to create a unique layout.

Enterprise Quarterly Income And Expenditure Performance Chart Graphics PDF
This slide depicts total income and expenses incurred annually. It represents the value of the income to expenses for each pair of bars, by quarter and variance is the profit earned. Pitch your topic with ease and precision using this Enterprise Quarterly Income And Expenditure Performance Chart Graphics PDF. This layout presents information on Expenses Surpassed Income, Sales, Huge Profit. It is also available for immediate download and adjustment. So, changes can be made in the color, design, graphics or any other component to create a unique layout.

Trend Of Quarterly Funding For Start Up Project Performance Chart Graphics PDF
This slide depicts investment made in different start up projects for 2 years. It also includes the investment amount, funding quarters in graphical form with a trend line and insights. Pitch your topic with ease and precision using this Trend Of Quarterly Funding For Start Up Project Performance Chart Graphics PDF. This layout presents information on Good Management, Efficient Team, Investment Decreased. It is also available for immediate download and adjustment. So, changes can be made in the color, design, graphics or any other component to create a unique layout.

CRM Performance Metrics Dashboard Showing Sales In Real Estate Customer Information PDF
This slide represents the dashboard showing the sales performance of a real estate company. It includes details related top 5 agents US sales, sales vs target per agent, top 5 banks-sold units, sales by top 5 agencies. Pitch your topic with ease and precision using this CRM Performance Metrics Dashboard Showing Sales In Real Estate Customer Information PDF. This layout presents information on Us Sales, Sold Units, Target Per Agent. It is also available for immediate download and adjustment. So, changes can be made in the color, design, graphics or any other component to create a unique layout.

Marketing And Operations Dashboard For Distribution Company Guidelines PDF
This slide covers sales and operations dashboard for distribution company. It involves details such as total sales by location, gross margin, monthly sales trends, average revenue and sales by major customers. Pitch your topic with ease and precision using this Marketing And Operations Dashboard For Distribution Company Guidelines PDF. This layout presents information on Gross Margin, Actual Vs Budget, Product. It is also available for immediate download and adjustment. So, changes can be made in the color, design, graphics or any other component to create a unique layout.
Marketing And Operations Dashboard For Performance Management Icons PDF
This slide covers sales and operation dashboard for performance management. It involves details such as number of new buyers, sales revenue, average revenue per unit etc. Pitch your topic with ease and precision using this Marketing And Operations Dashboard For Performance Management Icons PDF. This layout presents information on Average Revenue Per Unit, Customer Acquisition Cost, Customer Lifetime Value. It is also available for immediate download and adjustment. So, changes can be made in the color, design, graphics or any other component to create a unique layout.

Marketing And Operations Dashboard To Drive Effective Productivity Background PDF
This slide covers sales and operations dashboard to drive effective productivity. It involves details such as number of account assigned, working accounts, engaged accounts and total account activity. Pitch your topic with ease and precision using this Marketing And Operations Dashboard To Drive Effective Productivity Background PDF. This layout presents information on Total Account Activity, Number Of Working Account, Engaged Account. It is also available for immediate download and adjustment. So, changes can be made in the color, design, graphics or any other component to create a unique layout.
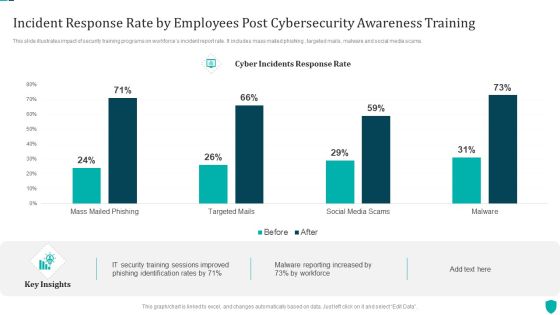
Incident Response Rate By Employees Post Cybersecurity Awareness Training Demonstration PDF
This slide illustrates impact of security training programs on workforces incident report rate. It includes mass mailed phishing , targeted mails, malware and social media scams.Pitch your topic with ease and precision using this Incident Response Rate By Employees Post Cybersecurity Awareness Training Demonstration PDF. This layout presents information on Training Sessions, Phishing Identification, Malware Reporting. It is also available for immediate download and adjustment. So, changes can be made in the color, design, graphics or any other component to create a unique layout.
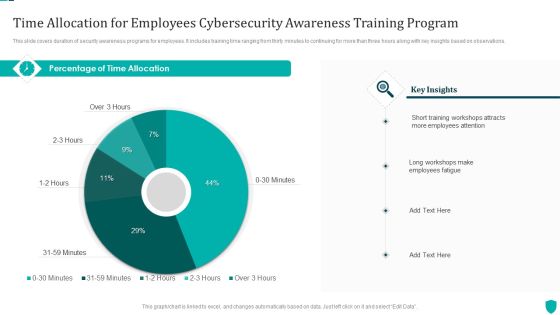
Time Allocation For Employees Cybersecurity Awareness Training Program Themes PDF
This slide covers duration of security awareness programs for employees. It includes training time ranging from thirty minutes to continuing for more than three hours along with key insights based on observations.Pitch your topic with ease and precision using this Time Allocation For Employees Cybersecurity Awareness Training Program Themes PDF. This layout presents information on Training Workshops, Employees Attention, Employees Fatigue. It is also available for immediate download and adjustment. So, changes can be made in the color, design, graphics or any other component to create a unique layout.

Financial Forecast And Essential Metrics Dashboard Ppt File Show PDF
This slide elaborates about the multiple sources through which one can project about the growth and current status of the company. It includes lead conversion rate, monthly revenue , short term assets , net and gross profit margins, etc. Pitch your topic with ease and precision using this Financial Forecast And Essential Metrics Dashboard Ppt File Show PDF. This layout presents information on Monthly Revenue Growth, Short Term Assets, Overall Financial Performance, Net Profit Margin. It is also available for immediate download and adjustment. So, changes can be made in the color, design, graphics or any other component to create a unique layout.
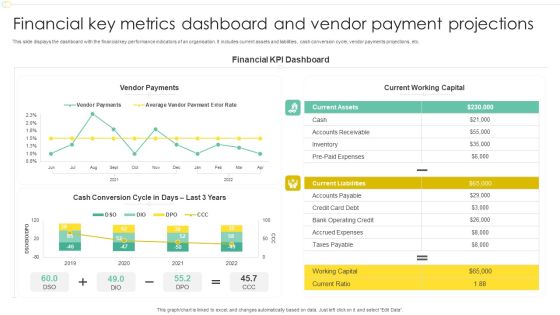
Financial Key Metrics Dashboard And Vendor Payment Projections Professional PDF
This slide displays the dashboard with the financial key performance indicators of an organisation. It includes current assets and liabilities, cash conversion cycle, vendor payments projections, etc. Pitch your topic with ease and precision using this Financial Key Metrics Dashboard And Vendor Payment Projections Professional PDF. This layout presents information on Financial KPI Dashboard, Current Working Capital, Vendor Payments. It is also available for immediate download and adjustment. So, changes can be made in the color, design, graphics or any other component to create a unique layout.
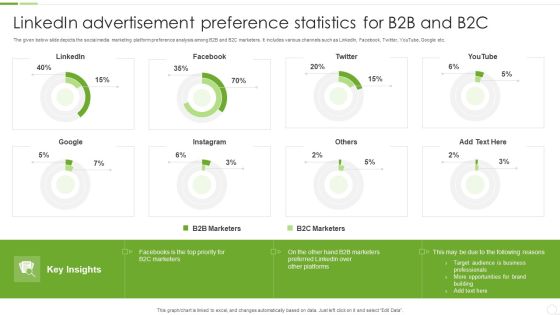
Linkedin Advertisement Preference Statistics For B2B And B2C Ppt Visual Aids Professional PDF
The given below slide depicts the social media marketing platform preference analysis among B2B and B2C marketers. It includes various channels such as LinkedIn, Facebook, Twitter, YouTube, Google etc. Pitch your topic with ease and precision using this Linkedin Advertisement Preference Statistics For B2B And B2C Ppt Visual Aids Professional PDF. This layout presents information on B2B Marketers, B2C Marketers, Target Audience. It is also available for immediate download and adjustment. So, changes can be made in the color, design, graphics or any other component to create a unique layout.

Company Inward Marketing Strategy Key Barriers Statistics Icons PDF
This slide covers top challenges of inbound marketing strategy that reduces its effectiveness. It includes generation of traffic, proving ROI for marketing activities, securing budget, technology update, website management, hiring talent and training team.Pitch your topic with ease and precision using this Company Inward Marketing Strategy Key Barriers Statistics Icons PDF. This layout presents information on Difficult To Search, Insufficient Traffic, Setting Budget. It is also available for immediate download and adjustment. So, changes can be made in the color, design, graphics or any other component to create a unique layout.

Statistics Showing Growth Rate Of Managed Cyber Security Solutions Service Market Ppt Show Inspiration PDF
This slide exhibits key statistics highlighting overview of managed security service market with expected market growth rate from 2020 to 2030 along with key insights. Pitch your topic with ease and precision using this Statistics Showing Growth Rate Of Managed Cyber Security Solutions Service Market Ppt Show Inspiration PDF. This layout presents information on Statistics Showing Growth, Cyber Security, Solutions Service Market. It is also available for immediate download and adjustment. So, changes can be made in the color, design, graphics or any other component to create a unique layout.

Expenditure Estimation Based On Project Size Ppt Outline Graphics Example PDF
The following slide highlights the cost estimation based on project size illustrating key headings which includes project size, range, installed cost, management cost, control cost and total cost, where project size is classified into small project, medium project and large project Pitch your topic with ease and precision using this Expenditure Estimation Based On Project Size Ppt Outline Graphics Example PDF. This layout presents information on Small Project, Management Cost, Control Cost. It is also available for immediate download and adjustment. So, changes can be made in the color, design, graphics or any other component to create a unique layout.

Recognition Program To Boost Workforce Morale Ppt Gallery Information PDF
This slide shows statistical data of recognition programs to engage and motivate employees. It includes monetary program, awards, employee of the month, service anniversaries and verbal appreciation. Pitch your topic with ease and precision using this Recognition Program To Boost Workforce Morale Ppt Gallery Information PDF. This layout presents information on Monetary Program, Awards And Trophies, Employee Month, Service Anniversaries. It is also available for immediate download and adjustment. So, changes can be made in the color, design, graphics or any other component to create a unique layout.

Employee Survey Results For Flexible Work Advantages Ppt Infographic Template Guidelines PDF
This slide shows the percentage wise results of survey conducted for employees regarding the advantages of flexible working culture. It includes main categories of adjustable work schedule, no travelling, family time and other advantages such as work life balance and focusing on physical health etc. Pitch your topic with ease and precision using this Employee Survey Results For Flexible Work Advantages Ppt Infographic Template Guidelines PDF. This layout presents information on Key Insights, Family Time, Adjustable Work Schedule, No Travelling. It is also available for immediate download and adjustment. So, changes can be made in the color, design, graphics or any other component to create a unique layout.

Logistics KPI Status Dashboard With Monthly KPI Ppt Infographic Template Layout PDF
The following slide highlights the transportation status dashboard with monthly KPI illustrating order status with customer, order date and delivery date. It shows financial performance for four quarters as well as todays order, inventory and monthly KPI with Inventory, shipping cost for past 30 days. Pitch your topic with ease and precision using this Logistics KPI Status Dashboard With Monthly KPI Ppt Infographic Template Layout PDF. This layout presents information on Order Status, Today Order, Inventory, Monthly KPI. It is also available for immediate download and adjustment. So, changes can be made in the color, design, graphics or any other component to create a unique layout.

Dashboard For Logistics KPI Management System Of Logistics Company Infographics PDF
The following slide highlights the dashboard for transportation management system of logistics company illustrating shipment status of 30 days, shipment by carrier, on time shipment, average shipment cost, carrier efficiency and shipment count. Pitch your topic with ease and precision using this Dashboard For Logistics KPI Management System Of Logistics Company Infographics PDF. This layout presents information on Shipment Status, Shipment By Carrier, On Time Shipment. It is also available for immediate download and adjustment. So, changes can be made in the color, design, graphics or any other component to create a unique layout.

Logistics KPI Carrier Management Dashboard For Ecommerce Company Microsoft PDF
The following slide highlights the transportation carrier management dashboard for Ecommerce company depicting vehicle status, yearly cost, maintenance cost, cost breakdown, vehicle life span, empty miles and insurance by vehicle type. Pitch your topic with ease and precision using this Logistics KPI Carrier Management Dashboard For Ecommerce Company Microsoft PDF. This layout presents information on Mini Trucks, 13 Trailers, Empty Miles, Vehicle Life Span. It is also available for immediate download and adjustment. So, changes can be made in the color, design, graphics or any other component to create a unique layout.
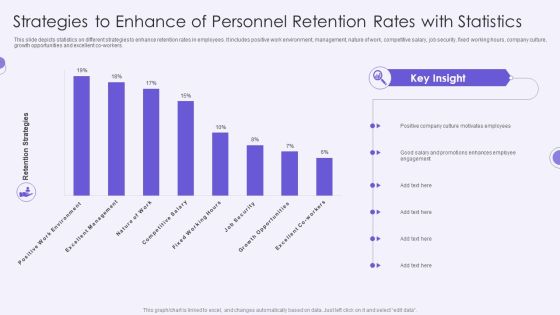
Strategies To Enhance Of Personnel Retention Rates With Statistics Summary PDF
This slide depicts statistics on different strategies to enhance retention rates in employees. It includes positive work environment, management, nature of work, competitive salary, job security, fixed working hours, company culture, growth opportunities and excellent co-workers.Pitch your topic with ease and precision using this Strategies To Enhance Of Personnel Retention Rates With Statistics Summary PDF. This layout presents information on Positive Company, Culture Motivates, Employees Promotions . It is also available for immediate download and adjustment. So, changes can be made in the color, design, graphics or any other component to create a unique layout.

Digital Risk Assessment Management Dashboard With Geographical Distribution Clipart PDF
The following slide highlights the cyber security risk management dashboard with dashboard with geographical distribution depicting incident volume by severity, open incidents, root cause details, divisional details and geographical distribution of risks. Pitch your topic with ease and precision using this Digital Risk Assessment Management Dashboard With Geographical Distribution Clipart PDF. This layout presents information on Geographical Distribution, Root Cause Details, Divisional Details, Social Engineering. It is also available for immediate download and adjustment. So, changes can be made in the color, design, graphics or any other component to create a unique layout.

Monthly Product Lines Production And Assembly Report Demonstration PDF
This slide illustrates tabular representation of production report of each product line. It includes year, month, no. of working days, line number, no. of styles made, OT hours, target production etc.Pitch your topic with ease and precision using this Monthly Product Lines Production And Assembly Report Demonstration PDF. This layout presents information on Target Production, Monthly Production, Difference. It is also available for immediate download and adjustment. So, changes can be made in the color, design, graphics or any other component to create a unique layout.

Solutions For Time To Market Challenges In Pharma Industry Brochure PDF
This slide shows various challenges faced by the Pharma industry in time to market. The key challenges are complex process, manual process, outdated technology. It also provides information about the solutions.Pitch your topic with ease and precision using this Solutions For Time To Market Challenges In Pharma Industry Brochure PDF. This layout presents information on Complex Processes, Manual Process, Outdated Technology. It is also available for immediate download and adjustment. So, changes can be made in the color, design, graphics or any other component to create a unique layout.
Market Insights Research Results With KPI Dashboard Ppt PowerPoint Presentation Icon File Formats PDF
The given below slide highlights the KPAs of market research associated with customer satisfaction. It includes net promoter score, customer effort score, monthly NPS and CES trend etc.Pitch your topic with ease and precision using this Market Insights Research Results With KPI Dashboard Ppt PowerPoint Presentation Icon File Formats PDF. This layout presents information on Satisfaction Score, Customer Effort, Customer Score. It is also available for immediate download and adjustment. So, changes can be made in the color, design, graphics or any other component to create a unique layout.
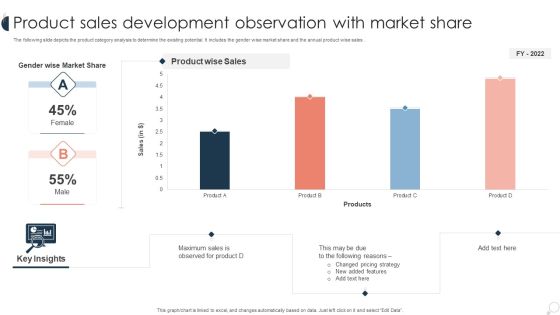
Product Sales Development Observation With Market Share Ppt PowerPoint Presentation Infographic Template Guide PDF
The following slide depicts the product category analysis to determine the existing potential. It includes the gender wise market share and the annual product wise sales . Pitch your topic with ease and precision using this Product Sales Development Observation With Market Share Ppt PowerPoint Presentation Infographic Template Guide PDF. This layout presents information on Changed Pricing, Observed For Product, Product Wise. It is also available for immediate download and adjustment. So, changes can be made in the color, design, graphics or any other component to create a unique layout.

Healthcare Big Data Assessment Dashboard Portrait PDF
This slide displays the data of healthcare sector showing the total number of patients in the hospital, average treatment cost and waiting time. It also shows the outpatient and impatient trends. Pitch your topic with ease and precision using this Healthcare Big Data Assessment Dashboard Portrait PDF. This layout presents information on Patient Status, Treatment Costs. It is also available for immediate download and adjustment. So, changes can be made in the color, design, graphics or any other component to create a unique layout.

Content Freelance Marketing Metrics With Total Visits And Bounce Rate Slides PDF
The following slide highlights the content freelance marketing metrics with total visits and bounce rate. It showcases total visits, average visit per day, page overview, page engagement, unique visits, bounce rate, retention rate and top content Pitch your topic with ease and precision using this Content Freelance Marketing Metrics With Total Visits And Bounce Rate Slides PDF. This layout presents information on Average, Page Engagement, Bounce Rate. It is also available for immediate download and adjustment. So, changes can be made in the color, design, graphics or any other component to create a unique layout.
