AI PPT Maker
Templates
PPT Bundles
Design Services
Business PPTs
Business Plan
Management
Strategy
Introduction PPT
Roadmap
Self Introduction
Timelines
Process
Marketing
Agenda
Technology
Medical
Startup Business Plan
Cyber Security
Dashboards
SWOT
Proposals
Education
Pitch Deck
Digital Marketing
KPIs
Project Management
Product Management
Artificial Intelligence
Target Market
Communication
Supply Chain
Google Slides
Research Services
 One Pagers
All Categories
-
Home
- Customer Favorites
- Business Model Comparison
Business Model Comparison
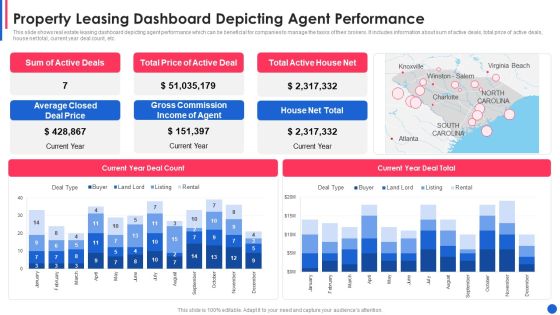
Property Leasing Dashboard Depicting Agent Performance Guidelines PDF
This slide shows real estate leasing dashboard depicting agent performance which can be beneficial for companies to manage the tasks of their brokers. It includes information about sum of active deals, total price of active deals, house net total, current year deal count, etc.Pitch your topic with ease and precision using this property leasing dashboard depicting agent performance guidelines pdf This layout presents information on average closed deal price, gross commission income, total active house net It is also available for immediate download and adjustment. So, changes can be made in the color, design, graphics or any other component to create a unique layout.

Real Estate Property Management Dashboard With Leasing Status Graphics PDF
This slide shows real estate property management dashboard with leasing status which can be referred by companies to have an overview about their performance. It includes information about revenue, properties, recent tasks, expired leases, outstanding balances, etc.Pitch your topic with ease and precision using this real estate property management dashboard with leasing status graphics pdf This layout presents information on property revenue overview, leases which are expiring, recent tasks It is also available for immediate download and adjustment. So, changes can be made in the color, design, graphics or any other component to create a unique layout.

Market Research Project Dashboard For Measuring Brand Awareness Rules PDF
Mentioned slide delineates research program dashboard which can be used by marketers for measuring brand awareness. This dashboard includes various elements such as celebrity analysis, top branding themes etc. Pitch your topic with ease and precision using this market research project dashboard for measuring brand awareness rules pdf. This layout presents information on brand awareness, celebrity analysis, advertisement. It is also available for immediate download and adjustment. So, changes can be made in the color, design, graphics or any other component to create a unique layout.

Digital Marketing Project Administration And Employee Performance Guidelines PDF
Statistics presented in the following slide showcase project coordination and employees performance in marketing campaign. It is based on following tasks SEO, SCO, Email Campaign and Blog writing. Pitch your topic with ease and precision using this digital marketing project administration and employee performance guidelines pdf. This layout presents information on digital marketing project administration and employee performance. It is also available for immediate download and adjustment. So, changes can be made in the color, design, graphics or any other component to create a unique layout.
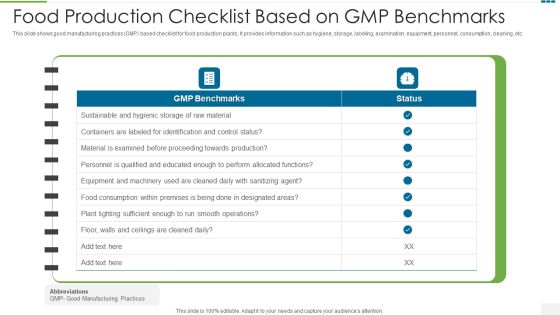
Food Production Checklist Based On GMP Benchmarks Formats PDF
This slide shows good manufacturing practices GMP based checklist for food production plants. It provides information such as hygiene, storage, labeling, examination, equipment, personnel, consumption, cleaning, etc.Pitch your topic with ease and precision using this food production checklist based on gmp benchmarks formats pdf This layout presents information on containers are labeled, material is examined, proceeding towards production It is also available for immediate download and adjustment. So, changes can be made in the color, design, graphics or any other component to create a unique layout.

Dashboard Of Project Risk Evaluation With Risk Rating Pictures PDF
The slide highlights the dashboard of project risk assessment with risk rating illustrating total risks, open risk, improving, closed risk, mitigated risk, residual risk, risk rating, inherent risk, control risk and impact probability matrixPitch your topic with ease and precision using this dashboard of project risk evaluation with risk rating pictures pdf This layout presents information on dashboard of project risk evaluation with risk rating It is also available for immediate download and adjustment. So, changes can be made in the color, design, graphics or any other component to create a unique layout.

Email Marketing Techniques For Campaign Success Ppt PowerPoint Presentation File Images PDF
This slide showcases an effective email marketing strategy. This slide provides information about various emails to be sent to users, their status, email type, target audience, sending date and eye catching headlines. Pitch your topic with ease and precision using this email marketing techniques for campaign success ppt powerpoint presentation file images pdf. This layout presents information on customer survey, customers, target. It is also available for immediate download and adjustment. So, changes can be made in the color, design, graphics or any other component to create a unique layout.
SFA Dashboard To Track Performance Ppt PowerPoint Presentation Icon Example File PDF
This Slide visually represents sales force automation dashboard to track performance which can be utilized by marketing managers to streamline the process of automated selling. It includes information about sales pipeline, competitors, opportunities, key competitors, etc. Pitch your topic with ease and precision using this sfa dashboard to track performance ppt powerpoint presentation icon example file pdf. This layout presents information on sales pipeline, sales pipeline by sales rep, key competitors, forecast by month, key opportunities. It is also available for immediate download and adjustment. So, changes can be made in the color, design, graphics or any other component to create a unique layout.

Key Strategies For Customer Brand Loyalty Program Ppt PowerPoint Presentation Diagram Templates PDF
The purpose of this slide is to showcase various strategies which can be used for customer loyalty program. Discount, loyalty points program, gift cards, rewards for referral and free trial are some of the key strategies mentioned in the slide. Pitch your topic with ease and precision using this key strategies for customer brand loyalty program ppt powerpoint presentation diagram templates pdf. This layout presents information on discount, loyalty points program, gift cards, rewards for referrals, leverage free trials. It is also available for immediate download and adjustment. So, changes can be made in the color, design, graphics or any other component to create a unique layout.
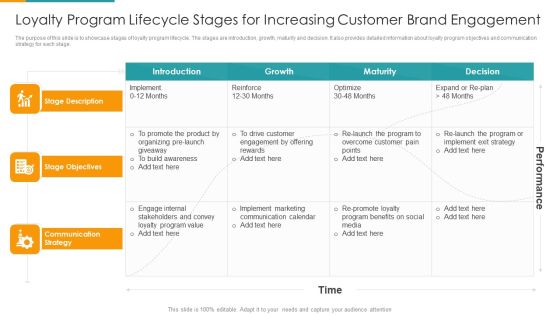
Loyalty Program Lifecycle Stages For Increasing Customer Brand Engagement Ppt PowerPoint Presentation Gallery Example PDF
The purpose of this slide is to showcase stages of loyalty program lifecycle. The stages are introduction, growth, maturity and decision. It also provides detailed information about loyalty program objectives and communication strategy for each stage. Pitch your topic with ease and precision using this loyalty program lifecycle stages for increasing customer brand engagement ppt powerpoint presentation gallery example pdf. This layout presents information on stage description, stage objectives, communication strategy. It is also available for immediate download and adjustment. So, changes can be made in the color, design, graphics or any other component to create a unique layout.

Various Statistics Showing Results Of Customer Brand Loyalty Program Background PDF
The purpose of this slide is to showcase major statistics illustrating the customer loyalty program results. The key statistics covered in the slide are extent of consumers loyalty to different brand, customers response to new brands and the various factors for brand loyalty. Pitch your topic with ease and precision using this various statistics showing results of customer brand loyalty program background pdf. This layout presents information on extent of customer loyalty to brands, customers responsiveness to new brands, brand loyalty matters. It is also available for immediate download and adjustment. So, changes can be made in the color, design, graphics or any other component to create a unique layout.

Control Chart Tools For Project Quality Management Tools And Techniques For Process Improvement Topics PDF
This slide shows the control chart tools for project quality management which includes upper and lower control limit, positive and negative sigma, average, etc. that shows with the passage of time, number of defects gets fluctuated that means the level of controlling process. Pitch your topic with ease and precision using this control chart tools for project quality management tools and techniques for process improvement topics pdf. This layout presents information on time, upper control limit, lower control limit. It is also available for immediate download and adjustment. So, changes can be made in the color, design, graphics or any other component to create a unique layout.
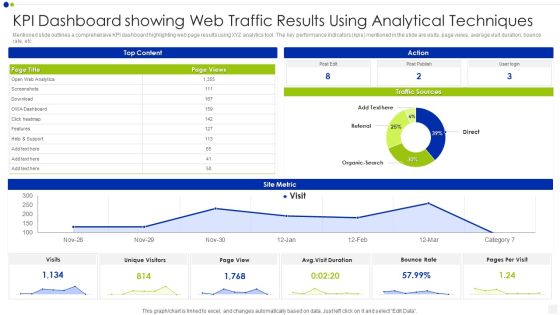
KPI Dashboard Showing Web Traffic Results Using Analytical Techniques Inspiration PDF
Mentioned slide outlines a comprehensive KPI dashboard highlighting web page results using XYZ analytics tool. The key performance indicators kpis mentioned in the slide are visits, page views, average visit duration, bounce rate, etc. Pitch your topic with ease and precision using this kpi dashboard showing web traffic results using analytical techniques inspiration pdf. This layout presents information on bounce rate, traffic sources, analytics. It is also available for immediate download and adjustment. So, changes can be made in the color, design, graphics or any other component to create a unique layout.
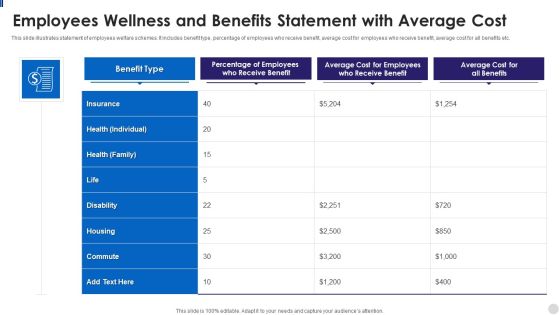
Employees Wellness And Benefits Statement With Average Cost Rules PDF
This slide illustrates statement of employees welfare schemes. It includes benefit type, percentage of employees who receive benefit, average cost for employees who receive benefit, average cost for all benefits etc. Pitch your topic with ease and precision using this Employees Wellness And Benefits Statement With Average Cost Rules PDF. This layout presents information on Average, Cost, Benefit. It is also available for immediate download and adjustment. So, changes can be made in the color, design, graphics or any other component to create a unique layout.

Single Tenant Vs Multi Tenant Saas Program Architecture Ppt PowerPoint Presentation Gallery Rules PDF
The following slide highlights the single tenant vs multi tenant SaaS platform architecture illustrating key headings which includes metrics, security, customization, cost effectiveness, scaling capabilities and ongoing maintenance. Pitch your topic with ease and precision using this single tenant vs multi tenant saas program architecture ppt powerpoint presentation gallery rules pdf. This layout presents information on security, customization, cost effectiveness, scaling capabilities. It is also available for immediate download and adjustment. So, changes can be made in the color, design, graphics or any other component to create a unique layout.

Employee Performance Evaluation Report Form To Measure Functional And Interpersonal Skills Download PDF
The following slide outlines a comprehensive employee review report form. Information covered in this template is related to functional skills, work habits, interpersonal skills, and leadership. Pitch your topic with ease and precision using this Employee Performance Evaluation Report Form To Measure Functional And Interpersonal Skills Download PDF. This layout presents information on Evaluation, Financial Analyst, Dynamic Circumstances. It is also available for immediate download and adjustment. So, changes can be made in the color, design, graphics or any other component to create a unique layout.

Employee Performance Evaluation Report Form With Major Accomplishment Download PDF
The following slide outlines employee review report form which can be used by the manager at the time of appraisal process. It provides information about job knowledge, reliability, quantity of work, creativity, decision making, accomplishment, etc. Pitch your topic with ease and precision using this Employee Performance Evaluation Report Form With Major Accomplishment Download PDF. This layout presents information on Quantity Of Work, Reliability, Decision Making. It is also available for immediate download and adjustment. So, changes can be made in the color, design, graphics or any other component to create a unique layout.

Comparative Assessment Of Digital Insurance Websites Download PDF
This slide illustrates comparative assessment of digital insurance websites. It provides information about motor, home, health and life insurance along with automation, claim fraud detection, omnichannel, claim processing, etc. Pitch your topic with ease and precision using this Comparative Assessment Of Digital Insurance Websites Download PDF. This layout presents information on Automation, Risk Prediction, Claim Processing. It is also available for immediate download and adjustment. So, changes can be made in the color, design, graphics or any other component to create a unique layout.
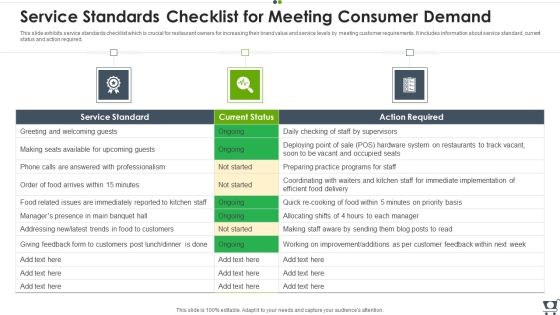
Service Standards Checklist For Meeting Consumer Demand Diagrams PDF
This slide exhibits service standards checklist which is crucial for restaurant owners for increasing their brand value and service levels by meeting customer requirements. It includes information about service standard, current status and action required. Pitch your topic with ease and precision using this Service Standards Checklist For Meeting Consumer Demand Diagrams PDF. This layout presents information on Service Standard, Action Required, System. It is also available for immediate download and adjustment. So, changes can be made in the color, design, graphics or any other component to create a unique layout.

Retail Banking Demand For Consumer Retention Themes PDF
This slide illustrates retail banking requirements which are crucial in increasing the rate of new prospect acquisition and customer retention. It includes information about powerful brand image, standardized data analytics, integrated omnichannels, product transparency, competitive pricing, using advanced technology, rewards to loyal customers, etc. Pitch your topic with ease and precision using this Retail Banking Demand For Consumer Retention Themes PDF. This layout presents information on Require, Strategies, Retail. It is also available for immediate download and adjustment. So, changes can be made in the color, design, graphics or any other component to create a unique layout.
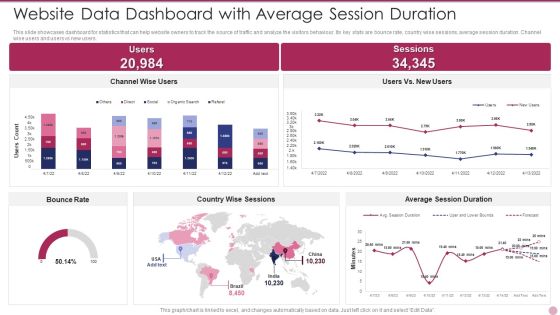
Website Data Dashboard With Average Session Duration Ideas PDF
This slide showcases dashboard for statistics that can help website owners to track the source of traffic and analyze the visitors behaviour. Its key stats are bounce rate, country wise sessions, average session duration. Channel wise users and users vs new users. Pitch your topic with ease and precision using this Website Data Dashboard With Average Session Duration Ideas PDF. This layout presents information on Website Data Dashboard With Average Session Duration. It is also available for immediate download and adjustment. So, changes can be made in the color, design, graphics or any other component to create a unique layout.

Website Data Improvement Checklist With Priority Status Formats PDF
This slide showcases checklist for website statistics improvement that can ensure positive user experience and higher search engine rankings. It also provides information about priority status of each aspect of checklist. Pitch your topic with ease and precision using this Website Data Improvement Checklist With Priority Status Formats PDF. This layout presents information on Website Data Improvement Checklist With Priority Status. It is also available for immediate download and adjustment. So, changes can be made in the color, design, graphics or any other component to create a unique layout.

Website Data Report For Website Performance Background PDF
This slide showcases weekly report for website statistics that can help to ensure the regular growth in website traffic, leads generated, pages or session and conversion rate. It showcases progress for a period of 4 weeks. Pitch your topic with ease and precision using this Website Data Report For Website Performance Background PDF. This layout presents information on Website Data Report For Website Performance. It is also available for immediate download and adjustment. So, changes can be made in the color, design, graphics or any other component to create a unique layout.
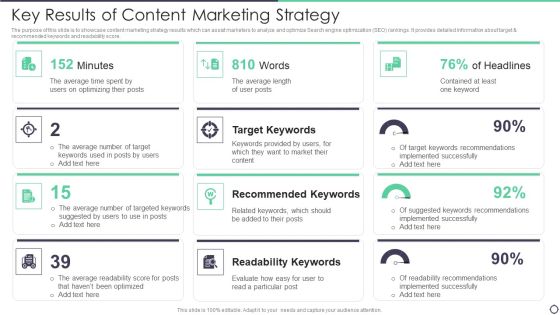
Key Results Of Content Marketing Strategy Background PDF
The purpose of this slide is to showcase content marketing strategy results which can assist marketers to analyze and optimize Search engine optimization SEO rankings. It provides detailed information about target and recommended keywords and readability score. Pitch your topic with ease and precision using this Key Results Of Content Marketing Strategy Background PDF. This layout presents information on Average, Target Keywords, Readability Keywords. It is also available for immediate download and adjustment. So, changes can be made in the color, design, graphics or any other component to create a unique layout.

Marketing Kpi Dashboard Showing Campaign Outcomes Pictures PDF
The purpose of this slide is to outline KPI dashboard of various results generated from marketing campaign. The results highlighted in the slide are total visits, average session duration, bounce rate, traffic sources, top channels by conversion etc. Pitch your topic with ease and precision using this Marketing Kpi Dashboard Showing Campaign Outcomes Pictures PDF. This layout presents information on Marketing Kpi Dashboard Showing Campaign Outcomes. It is also available for immediate download and adjustment. So, changes can be made in the color, design, graphics or any other component to create a unique layout.
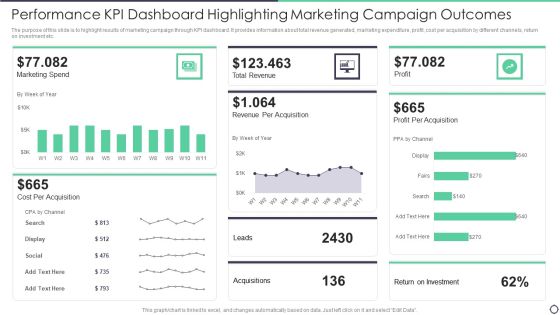
Performance Kpi Dashboard Highlighting Marketing Campaign Outcomes Topics PDF
The purpose of this slide is to highlight results of marketing campaign through KPI dashboard. It provides information about total revenue generated, marketing expenditure, profit, cost per acquisition by different channels, return on investment etc. Pitch your topic with ease and precision using this Performance Kpi Dashboard Highlighting Marketing Campaign Outcomes Topics PDF. This layout presents information on Cost, Marketing, Revenue. It is also available for immediate download and adjustment. So, changes can be made in the color, design, graphics or any other component to create a unique layout.
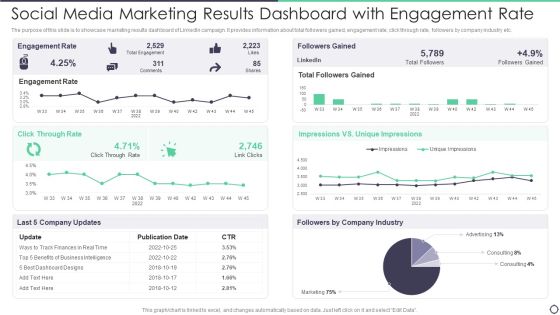
Social Media Marketing Results Dashboard With Engagement Rate Brochure PDF
The purpose of this slide is to showcase marketing results dashboard of LinkedIn campaign. It provides information about total followers gained, engagement rate, click through rate, followers by company industry etc. Pitch your topic with ease and precision using this Social Media Marketing Results Dashboard With Engagement Rate Brochure PDF. This layout presents information on Social Media Marketing Results Dashboard With Engagement Rate. It is also available for immediate download and adjustment. So, changes can be made in the color, design, graphics or any other component to create a unique layout.

Market Summary For Ecommerce Website With Conversion Rate Diagrams PDF
The mentioned slide highlights the highlights the market report for ecommerce website which includes the monthly shoppers and bounce rate with top marketing campaigns. Pitch your topic with ease and precision using this Market Summary For Ecommerce Website With Conversion Rate Diagrams PDF. This layout presents information on Market Summary For Ecommerce Website With Conversion Rate. It is also available for immediate download and adjustment. So, changes can be made in the color, design, graphics or any other component to create a unique layout.

Risk Assessment Associated With Contract Production Ppt PowerPoint Presentation Gallery Visual Aids PDF
This slide represents comparative assessment for contract manufacturing risks. It include threats such as manufacturer relationship, quality, intellectual property loss, supply chain etc. Pitch your topic with ease and precision using this Risk Assessment Associated With Contract Production Ppt PowerPoint Presentation Gallery Visual Aids PDF. This layout presents information on Relationship, Quality, Risk, Supply Chain, Communication Requirement. It is also available for immediate download and adjustment. So, changes can be made in the color, design, graphics or any other component to create a unique layout.

Social Media Engagement To Increase Customer Engagement Monthly Schedule For Social Media Posts Mockup PDF
This slide highlights monthly schedule for social media posts across platforms. It provides information about keywords, headers, content, awareness, likes, comments, satisfaction, feedback, polls, humor, etc. Pitch your topic with ease and precision using this Social Media Engagement To Increase Customer Engagement Monthly Schedule For Social Media Posts Mockup PDF. This layout presents information on Monthly Schedule For Social Media Posts. It is also available for immediate download and adjustment. So, changes can be made in the color, design, graphics or any other component to create a unique layout.
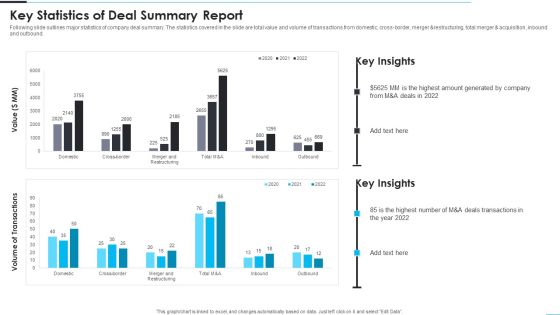
Key Statistics Of Deal Summary Report Formats PDF
Following slide outlines major statistics of company deal summary. The statistics covered in the slide are total value and volume of transactions from domestic, cross-border, merger and restructuring, total merger and acquisition, inbound and outbound. Pitch your topic with ease and precision using this Key Statistics Of Deal Summary Report Formats PDF. This layout presents information on Key Statistics Of Deal Summary Report. It is also available for immediate download and adjustment. So, changes can be made in the color, design, graphics or any other component to create a unique layout.
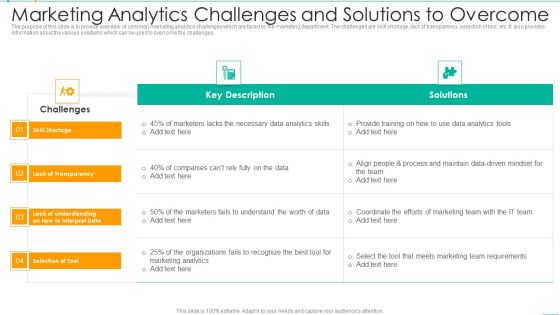
Marketing Analytics Challenges And Solutions To Overcome Template PDF
The purpose of this slide is to provide overview of common marketing analytics challenges which are faced by the marketing department. The challenges are skill shortage, lack of transparency, selection of tool, etc. It also provides information about the various solutions which can be used to overcome the challenges. Pitch your topic with ease and precision using this Marketing Analytics Challenges And Solutions To Overcome Template PDF. This layout presents information on Marketers, Data Analytics, Team. It is also available for immediate download and adjustment. So, changes can be made in the color, design, graphics or any other component to create a unique layout.

Marketing Analytics Dashboard With Conversion Rate Summary PDF
The purpose of this slide is to outline marketing analytics dashboard. The dashboard provides information about key metrices such as total impressions, clicks, cost, conversion value, rate, ROAS, market share by different ad platforms etc. Pitch your topic with ease and precision using this Marketing Analytics Dashboard With Conversion Rate Summary PDF. This layout presents information on Marketing Analytics Dashboard With Conversion Rate. It is also available for immediate download and adjustment. So, changes can be made in the color, design, graphics or any other component to create a unique layout.

Real Time Analytics Dashboard To Measure Marketing Campaign Performance Information PDF
The purpose of this slide is to outline analytics dashboard to evaluate the success rate of marketing campaign performance. It provides information about metrics such as clicks, impressions, spend, conversions, site audit score, audience growth, etc. Pitch your topic with ease and precision using this Real Time Analytics Dashboard To Measure Marketing Campaign Performance Information PDF. This layout presents information on Real Time Analytics Dashboard To Measure Marketing Campaign Performance. It is also available for immediate download and adjustment. So, changes can be made in the color, design, graphics or any other component to create a unique layout.

Dashboard Depicting Macroeconomic Analysis With Population Inspiration PDF
This slide shows the dashboard that depicts the macroeconomic analysis which includes population, gross domestic product, GDP per capita, poverty rate, literacy rate verses internet usage of four different countries and FDI inflow, etc. Pitch your topic with ease and precision using this Dashboard Depicting Macroeconomic Analysis With Population Inspiration PDF. This layout presents information on Poverty Rate, Literacy Rate Vs Internet Usages, FDI Inflow In 2022. It is also available for immediate download and adjustment. So, changes can be made in the color, design, graphics or any other component to create a unique layout.
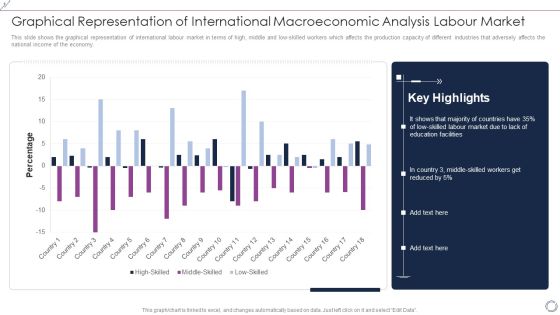
Graphical Representation Of International Macroeconomic Analysis Labour Market Diagrams PDF
This slide shows the graphical representation of international labour market in terms of high, middle and low-skilled workers which affects the production capacity of different industries that adversely affects the national income of the economy. Pitch your topic with ease and precision using this Graphical Representation Of International Macroeconomic Analysis Labour Market Diagrams PDF. This layout presents information on High Skilled, Middle Skilled, Low Skilled. It is also available for immediate download and adjustment. So, changes can be made in the color, design, graphics or any other component to create a unique layout.
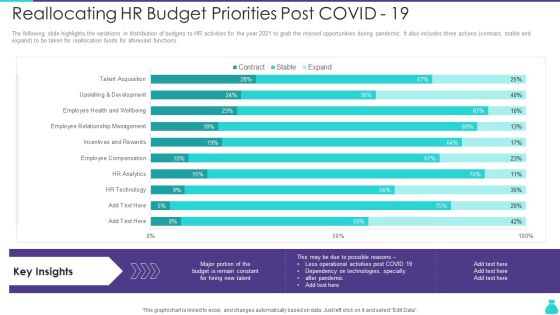
Reallocating HR Budget Priorities Post Covid 19 Ppt PowerPoint Presentation Gallery Graphics Download PDF
The following slide highlights the variations in distribution of budgets to HR activities for the year 2021 to grab the missed opportunities during pandemic. It also includes three actions contract, stable and expand to be taken for reallocation funds for aforesaid functions. Pitch your topic with ease and precision using this Reallocating HR Budget Priorities Post Covid 19 Ppt PowerPoint Presentation Gallery Graphics Download PDF. This layout presents information on HR Technology, HR Analytics, Employee Compensation. It is also available for immediate download and adjustment. So, changes can be made in the color, design, graphics or any other component to create a unique layout.
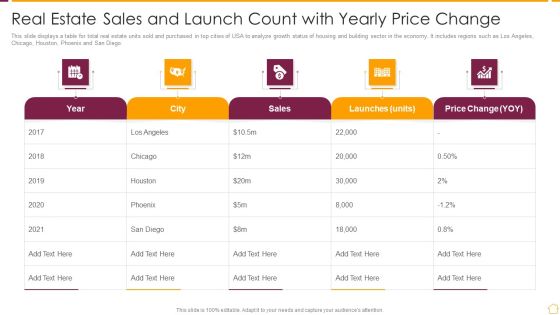
Real Estate Sales And Launch Count With Yearly Price Change Ppt PowerPoint Presentation File Example Topics PDF
This slide displays a table for total real estate units sold and purchased in top cities of USA to analyze growth status of housing and building sector in the economy. It includes regions such as Los Angeles, Chicago, Houston, Phoenix and San Diego. Pitch your topic with ease and precision using this Real Estate Sales And Launch Count With Yearly Price Change Ppt PowerPoint Presentation File Example Topics PDF. This layout presents information on Launches Units, Price Change, Sales, 2017 To 2021. It is also available for immediate download and adjustment. So, changes can be made in the color, design, graphics or any other component to create a unique layout.
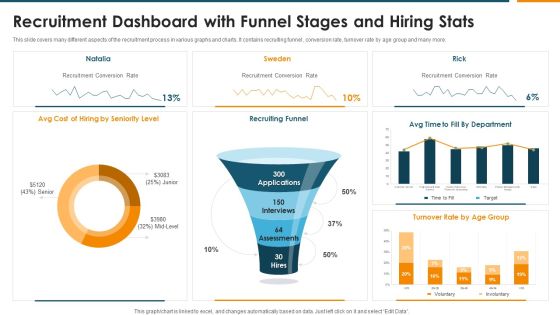
Recruitment Dashboard With Funnel Stages And Hiring Stats Rules PDF
This slide covers many different aspects of the recruitment process in various graphs and charts. It contains recruiting funnel , conversion rate, turnover rate by age group and many more. Pitch your topic with ease and precision using this Recruitment Dashboard With Funnel Stages And Hiring Stats Rules PDF. This layout presents information on Recruiting Funnel, Recruitment Conversion Rate, Seniority Level. It is also available for immediate download and adjustment. So, changes can be made in the color, design, graphics or any other component to create a unique layout.

Digital Marketing KPI Dashboard With Goal Conversion Rate Ideas PDF
The following slide showcases a marketing KPI dashboard. The various metrics highlighted in the slide are total sessions, bounce rate, goal completions, goal conversion rate, top channels which generated revenue. Pitch your topic with ease and precision using this Digital Marketing KPI Dashboard With Goal Conversion Rate Ideas PDF. This layout presents information on Rate, Goal, Conversions. It is also available for immediate download and adjustment. So, changes can be made in the color, design, graphics or any other component to create a unique layout.
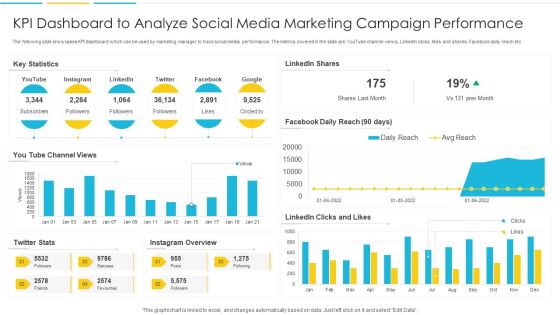
KPI Dashboard To Analyze Social Media Marketing Campaign Performance Rules PDF
The following slide showcases KPI dashboard which can be used by marketing manager to track social media performance. The metrics covered in the slide are YouTube channel views, LinkedIn clicks, likes and shares, Facebook daily reach etc. Pitch your topic with ease and precision using this KPI Dashboard To Analyze Social Media Marketing Campaign Performance Rules PDF. This layout presents information on Dashboard, Marketing, Analyze. It is also available for immediate download and adjustment. So, changes can be made in the color, design, graphics or any other component to create a unique layout.
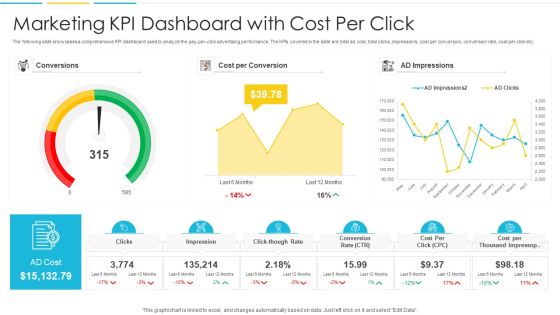
Marketing KPI Dashboard With Cost Per Click Infographics PDF
The following slide showcases a comprehensive KPI dashboard used to analyze the pay-per-click advertising performance. The KPIs covered in the slide are total ad cost, total clicks, impressions, cost per conversion, conversion rate, cost per click etc. Pitch your topic with ease and precision using this Marketing KPI Dashboard With Cost Per Click Infographics PDF. This layout presents information on Conversions, Cost, Impressions. It is also available for immediate download and adjustment. So, changes can be made in the color, design, graphics or any other component to create a unique layout.

Content Marketing Strategy With Weekly Blog Posting Schedule Slides PDF
This template covers the content schedule for uploading weekly blog posts. It includes posting details such as number, author due date, publish date, topic, keywords, photos, target audience. Pitch your topic with ease and precision using this Content Marketing Strategy With Weekly Blog Posting Schedule Slides PDF. This layout presents information on Target, Product Management, Marketing Strategies. It is also available for immediate download and adjustment. So, changes can be made in the color, design, graphics or any other component to create a unique layout.
Emerging Trends In Integrated Solid Waste Administration Icons PDF
This slide represents the statistical data of the upcoming trends in the management of solid waste of different areas. It shows millions of tonnes collected for the current year and forecast of future years. Pitch your topic with ease and precision using this Emerging Trends In Integrated Solid Waste Administration Icons PDF. This layout presents information on Emerging, Integrated, Administration. It is also available for immediate download and adjustment. So, changes can be made in the color, design, graphics or any other component to create a unique layout.

Assessing The Efforts Made By Employees For Enhancing Sales Skills Brochure PDF
The given below slide highlights of employee engage themselves in various activities to enhance their current sales skills set. It includes activities such as attended training session, peer learning, webinars, individual coaching etc.Pitch your topic with ease and precision using this Assessing The Efforts Made By Employees For Enhancing Sales Skills Brochure PDF This layout presents information on Learning Events, Maximum Of The Them Attended, Training Sessions It is also available for immediate download and adjustment. So, changes can be made in the color, design, graphics or any other component to create a unique layout.
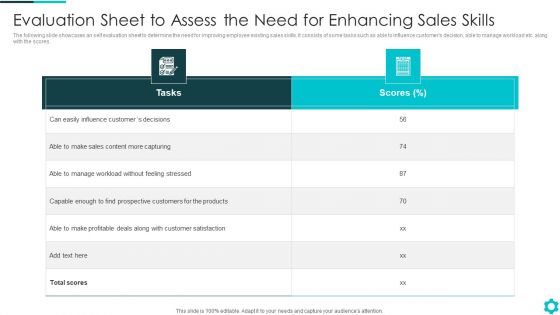
Evaluation Sheet To Assess The Need For Enhancing Sales Skills Template PDF
The following slide showcases an self evaluation sheet to determine the need for improving employee existing sales skills. It consists of some tasks such as able to influence customers decision, able to manage workload etc. along with the scores.Pitch your topic with ease and precision using this Evaluation Sheet To Assess The Need For Enhancing Sales Skills Template PDF This layout presents information on Profitable Deals, Manage Workload, Capable Enough It is also available for immediate download and adjustment. So, changes can be made in the color, design, graphics or any other component to create a unique layout.

Garment Production Quality KPI Dashboard Portrait PDF
The following slide shows dashboard that shows KPIs to measure garment manufacturing quality . Major KPIs covered are factory efficiency , quality to production, cut to ship ratio.Pitch your topic with ease and precision using this Garment Production Quality KPI Dashboard Portrait PDF This layout presents information on Production Downtime, Time Delivery Over The Quarters, Average Style Changeover Time It is also available for immediate download and adjustment. So, changes can be made in the color, design, graphics or any other component to create a unique layout.

KPI Dashboard Highlighting Customer Recommendation Program Results Rules PDF
The following slide showcases a comprehensive dashboard which can be used to track customer referral program results. It provides information about total participants enrolled, invites, clicks, converts, tweets, facebook shares etc. Pitch your topic with ease and precision using this KPI Dashboard Highlighting Customer Recommendation Program Results Rules PDF. This layout presents information on Participants, Invites, Converts. It is also available for immediate download and adjustment. So, changes can be made in the color, design, graphics or any other component to create a unique layout.
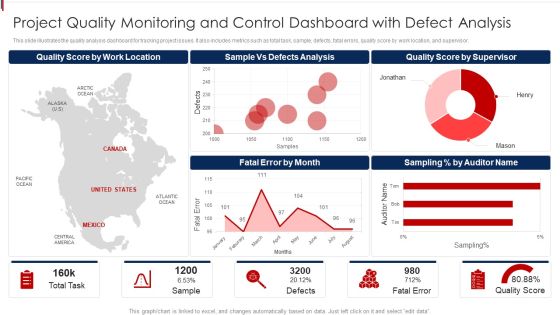
Project Quality Monitoring And Control Dashboard With Defect Analysis Demonstration PDF
This slide illustrates the quality analysis dashboard for tracking project issues. It also includes metrics such as total task, sample, defects, fatal errors, quality score by work location, and supervisor. Pitch your topic with ease and precision using this Project Quality Monitoring And Control Dashboard With Defect Analysis Demonstration PDF. This layout presents information on Location, Analysis, Supervisor. It is also available for immediate download and adjustment. So, changes can be made in the color, design, graphics or any other component to create a unique layout.
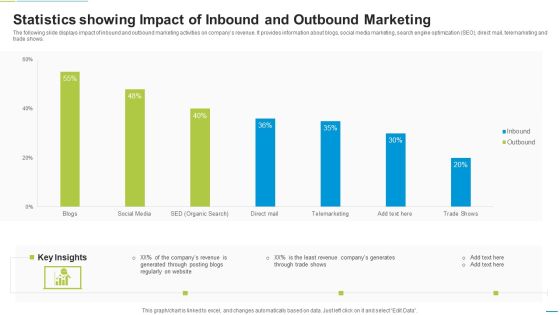
Statistics Showing Impact Of Inbound And Outbound Marketing Diagrams PDF
The following slide displays impact of inbound and outbound marketing activities on companys revenue. It provides information about blogs, social media marketing, search engine optimization SEO, direct mail, telemarketing and trade shows. Pitch your topic with ease and precision using this Statistics Showing Impact Of Inbound And Outbound Marketing Diagrams PDF. This layout presents information on Telemarketing, Social Media, Blogs. It is also available for immediate download and adjustment. So, changes can be made in the color, design, graphics or any other component to create a unique layout.
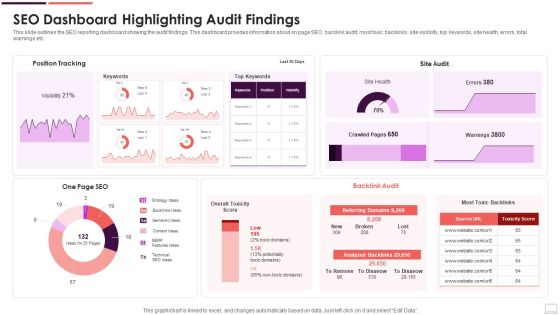
SEO Dashboard Highlighting Audit Findings Mockup PDF
This slide outlines the SEO reporting dashboard showing the audit findings. This dashboard provides information about on page SEO, backlink audit, most toxic backlinks, site visibility, top keywords, site health, errors, total warnings etc. Pitch your topic with ease and precision using this SEO Dashboard Highlighting Audit Findings Mockup PDF. This layout presents information on Strategy Ideas, Backlinks Ideas, Semantic Ideas. It is also available for immediate download and adjustment. So, changes can be made in the color, design, graphics or any other component to create a unique layout.

Performance Benchmarking Report For Effective Supply Chain Process Infographics PDF
This slide covers the performance benchmarking report for effective supply chain process which includes performance attribute, metrics, supplier actual, parity, advantage, superior and gaps in actual performance with accuracy, responsiveness, flexibility, expense, etc.Pitch your topic with ease and precision using this Performance Benchmarking Report For Effective Supply Chain Process Infographics PDF This layout presents information on Responsiveness, Flexibility, Accuracy It is also available for immediate download and adjustment. So, changes can be made in the color, design, graphics or any other component to create a unique layout.

Customer Journey Mapping With Front And Back Stage Demonstration PDF
This slide shows the customer experience mapping which includes different stages like finding solution, pre-sales, placing order and seeking help with actions, people, things and processes.Pitch your topic with ease and precision using this Customer Journey Mapping With Front And Back Stage Demonstration PDF This layout presents information on Inventory Clerk, System Or Processes, Marketing Department It is also available for immediate download and adjustment. So, changes can be made in the color, design, graphics or any other component to create a unique layout.
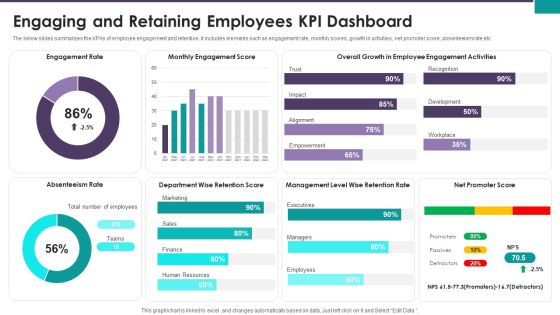
Engaging And Retaining Employees KPI Dashboard Ppt Slides Show PDF
The below slides summarizes the KPAs of employee engagement and retention. It includes elements such as engagement rate, monthly scores, growth in activities, net promoter score, absenteeism rate etc. Pitch your topic with ease and precision using this Engaging And Retaining Employees KPI Dashboard Ppt Slides Show PDF. This layout presents information on Engagement Rate Monthly, Engagement Score Overall, Growth Employee Engagement. It is also available for immediate download and adjustment. So, changes can be made in the color, design, graphics or any other component to create a unique layout.
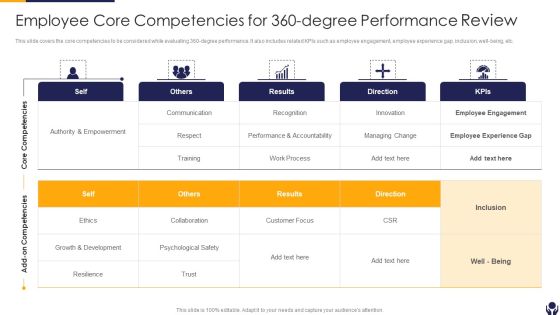
Employee Core Competencies For 360-Degree Performance Review Themes PDF
This slide covers the core competencies to be considered while evaluating 360 degree performance. It also includes related KPIs such as employee engagement, employee experience gap, inclusion, well being, etc. Pitch your topic with ease and precision using this Employee Core Competencies For 360-Degree Performance Review Themes PDF This layout presents information on Authority Empowerment, Performance Accountability, Psychological Safety It is also available for immediate download and adjustment. So, changes can be made in the color, design, graphics or any other component to create a unique layout.

Statistical Data Showcasing Key Elements Of Cyber War Rules PDF
This slide represents the statistics related to the key elements of the cyber terrorism. It includes elements such as fear as an outcome, civilian targets, criminality or illegality, digital means or target.Pitch your topic with ease and precision using this Statistical Data Showcasing Key Elements Of Cyber War Rules PDF This layout presents information on Cyber Terrorism, Political Or Ideological, Random Or Indiscriminate It is also available for immediate download and adjustment. So, changes can be made in the color, design, graphics or any other component to create a unique layout.
Finance Metrics Dashboard Illustrating Account Payables Icons PDF
This graph or chart is linked to excel, and changes automatically based on data. Just left click on it and select edit data. Pitch your topic with ease and precision using this Total Income Budget, Total Expenses Balance, Net Profit Quick, Ratio Current Ratio. This layout presents information on Account Payable Age, Average Creditor Days, Cash On Hand. It is also available for immediate download and adjustment. So, changes can be made in the color, design, graphics or any other component to create a unique layout.

Finance Metrics Dashboard Illustrating Income And Cash Flow Template PDF
This graph or chart is linked to excel, and changes automatically based on data. Just left click on it and select edit data. Pitch your topic with ease and precision using this Finance Metrics Dashboard Illustrating Income And Cash Flow Template PDF. This layout presents information on Current Accounts Receivable, Current Account Payable, Cash End Period, Account Receivable Account. It is also available for immediate download and adjustment. So, changes can be made in the color, design, graphics or any other component to create a unique layout.
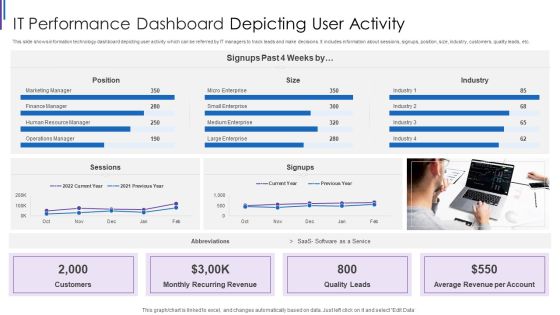
IT Performance Dashboard Depicting User Activity Inspiration PDF
This slide shows information technology dashboard depicting user activity which can be referred by IT managers to track leads and make decisions. It includes information about sessions, signups, position, size, industry, customers, quality leads, etc. Pitch your topic with ease and precision using this IT Performance Dashboard Depicting User Activity Inspiration PDF. This layout presents information on Monthly Recurring Revenue, Average Revenue Per, Account Quality Leads, Customers Position Sessions. It is also available for immediate download and adjustment. So, changes can be made in the color, design, graphics or any other component to create a unique layout.
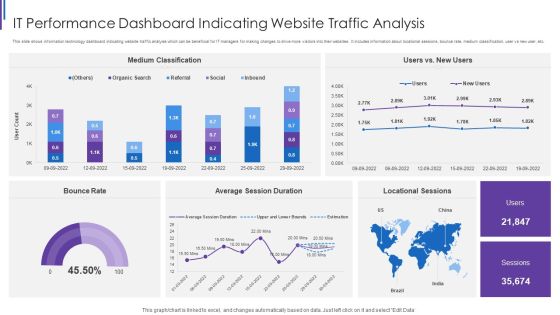
IT Performance Dashboard Indicating Website Traffic Analysis Background PDF
This slide shows information technology dashboard indicating website traffic analysis which can be beneficial for IT managers for making changes to drive more visitors into their websites. It includes information about locational sessions, bounce rate, medium classification, user vs new user, etc. Pitch your topic with ease and precision using this IT Performance Dashboard Indicating Website Traffic Analysis Background PDF. This layout presents information on Medium Classification Rate, Average Session Duration, Locational Sessions Bounce. It is also available for immediate download and adjustment. So, changes can be made in the color, design, graphics or any other component to create a unique layout.
