Budget Chart

Bar Chart Ppt PowerPoint Presentation Infographic Template Master Slide
This is a bar chart ppt powerpoint presentation infographic template master slide. This is a two stage process. The stages in this process are growth, finance, business, analysis, marketing.

Scatter Bubble Chart Template Ppt PowerPoint Presentation Professional Background
This is a scatter bubble chart template ppt powerpoint presentation professional background. This is a six stage process. The stages in this process are business, marketing, strategy, planning, finance.

Structure Chart For Managing Business Operations Ppt Slide
This is a structure chart for managing business operations ppt slide. This is a six stage process. The stages in this process are priority actions, what system support resources, who responsible, when done, how to measure, annual status.

Usa Map Chart Americana PowerPoint Presentation Slides C
Microsoft PowerPoint Slides and Backgrounds with of a multicolored bar chart sitting on top of a transparent extruded map of the united states on a medium gray reflective surface
Usa Map Chart Americana PowerPoint Presentation Slides Cc
Microsoft PowerPoint Slides and Backgrounds with of a multicolored bar chart sitting on top of a transparent extruded map of the united states on a medium gray reflective surface
Usa Map Chart Americana PowerPoint Presentation Slides F
Microsoft PowerPoint Slides and Backgrounds with of a multicolored bar chart sitting on top of a transparent extruded map of the united states on a medium gray reflective surface
Usa Map Chart Americana PowerPoint Presentation Slides R
Microsoft PowerPoint Slides and Backgrounds with of a multicolored bar chart sitting on top of a transparent extruded map of the united states on a medium gray reflective surface
Usa Map Chart Americana PowerPoint Presentation Slides S
Microsoft PowerPoint Slides and Backgrounds with of a multicolored bar chart sitting on top of a transparent extruded map of the united states on a medium gray reflective surface
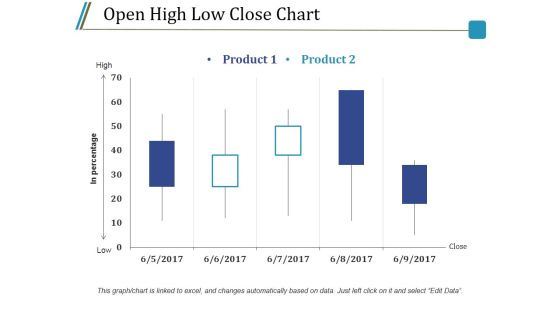
Open High Low Close Chart Ppt PowerPoint Presentation Styles Model
This is a open high low close chart ppt powerpoint presentation styles model. This is a five stage process. The stages in this process are product, high, low, in percentage, close.

Stock Chart Template 2 Ppt PowerPoint Presentation Infographic Template Styles
This is a stock chart template 2 ppt powerpoint presentation infographic template styles. This is a one stage process. The stages in this process are high, volume, low, product, volume.

Open High Low Close Chart Ppt PowerPoint Presentation Outline Rules
This is a open high low close chart ppt powerpoint presentation outline rules. This is a two stage process. The stages in this process are product, high, low, close, in percentage.
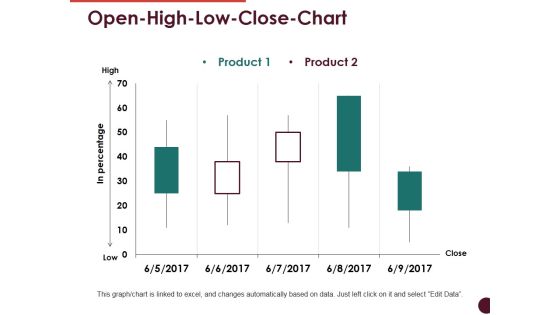
Open High Low Close Chart Ppt PowerPoint Presentation Professional Visuals
This is a open high low close chart ppt powerpoint presentation professional visuals. This is a two stage process. The stages in this process are high, low, in percentage, product, close.

Volume High Low Close Chart Ppt PowerPoint Presentation Infographics Good
This is a volume high low close chart ppt powerpoint presentation infographics good. This is a two stage process. The stages in this process are high, volume, low, product, close.

Bar Chart Ppt PowerPoint Presentation Slides Example File
This is a bar chart ppt powerpoint presentation slides example file. This is a two stage process. The stages in this process are product, financial years, sales in percentage.

Control Chart Template 1 Ppt PowerPoint Presentation Ideas Images
This is a control chart template 1 ppt powerpoint presentation ideas images. This is a two stage process. The stages in this process are average range or quality, upper control limit, lower control limit, time, process average.

Control Chart Template 2 Ppt PowerPoint Presentation Portfolio Summary
This is a control chart template 2 ppt powerpoint presentation portfolio summary. This is a one stage process. The stages in this process are upper control limit, process segment, process change, unstable trend, lower control limit.
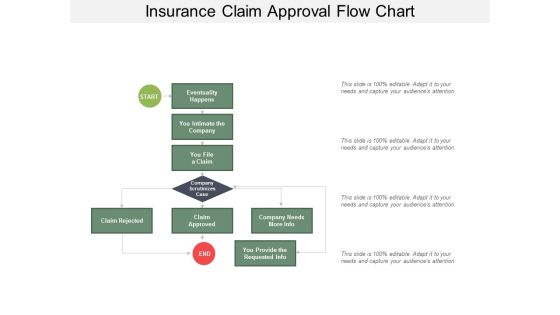
Insurance Claim Approval Flow Chart Ppt Powerpoint Presentation Styles Gallery
This is a insurance claim approval flow chart ppt powerpoint presentation styles gallery. This is a four stage process. The stages in this process are insurance claim process, insurance claim steps, insurance claim procedure.
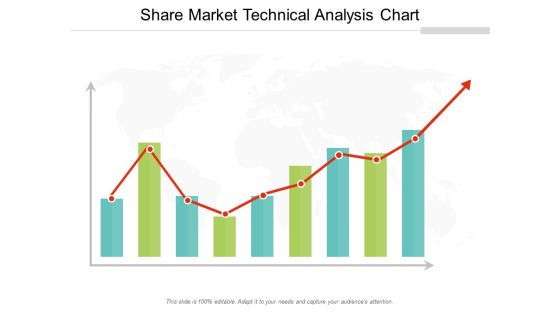
Share Market Technical Analysis Chart Ppt Powerpoint Presentation Professional Rules
This is a share market technical analysis chart ppt powerpoint presentation professional rules. This is a three stage process. The stages in this process are stock market, financial market, bull market.

Operational Flow Of Financial Services Chart Example Of Ppt
This is a operational flow of financial services chart example of ppt. This is a five stage process. The stages in this process are customer, mobile, atm, employees, high finance trading.

Small Business Structure Chart Example Powerpoint Slide Background Image
This is a small business structure chart example powerpoint slide background image. This is a six stage process. The stages in this process are financial manager, sales, distributions, finance, operations, general manager.

Volume High Low Close Chart Ppt PowerPoint Presentation Shapes
This is a volume high low close chart ppt powerpoint presentation shapes. This is a five stage process. The stages in this process are business, strategy, analysis, marketing, finance, growth.

Customer Services Management Chart Ppt PowerPoint Presentation Show Slides
This is a customer services management chart ppt powerpoint presentation show slides. This is a two stage process. The stages in this process are finance manager, graphic designer, ceo director, product manager.

Donut Pie Chart Ppt PowerPoint Presentation Infographic Template Layout Ideas
This is a donut pie chart ppt powerpoint presentation infographic template layout ideas. This is a five stage process. The stages in this process are product, business, finance, marketing.
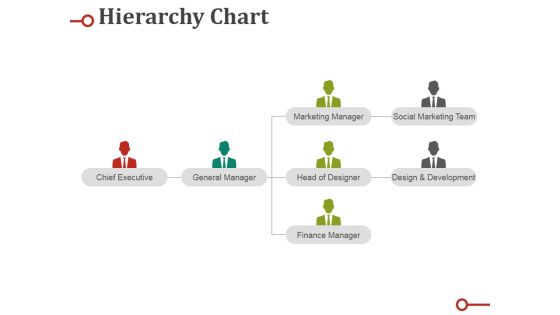
Hierarchy Chart Ppt PowerPoint Presentation Infographic Template Designs Download
This is a hierarchy chart ppt powerpoint presentation infographic template designs download. This is a four stage process. The stages in this process are chief executive, general manager, marketing manager, head of designer, finance manager.

High Low Close Chart Ppt PowerPoint Presentation Styles Display
This is a high low close chart ppt powerpoint presentation styles display. This is a ten stage process. The stages in this process are high, volume, low, close, finance.

High Low Close Chart Ppt PowerPoint Presentation Show Ideas
This is a high low close chart ppt powerpoint presentation show ideas. This is a ten stage process. The stages in this process are high, volume, low, close, finance.

Stack Area Chart Ppt PowerPoint Presentation Example File
This is a stack area chart ppt powerpoint presentation example file. This is a two stage process. The stages in this process are product, sales in percentage, percentage, finance.

Scatter Bubble Chart Ppt PowerPoint Presentation Styles Objects
This is a scatter bubble chart ppt powerpoint presentation styles objects. This is a two stage process. The stages in this process are product, in price, highest sale, percentage, finance.

Six Sigma Linear Circles Chart Presentation Powerpoint Templates
This is a six sigma linear circles chart presentation powerpoint templates. This is a five stage process. The stages in this process are bottom line, trained individuals, engagement, project by project, customer focused.

Corporate Structure Business ORG Chart Ppt PowerPoint Presentation Slides Template
This is a corporate structure business org chart ppt powerpoint presentation slides template. This is a five stage process. The stages in this process are project governance, governance structure, project structure.

Line Chart Ppt PowerPoint Presentation Portfolio Design Templates
This is a line chart ppt powerpoint presentation portfolio design templates. This is a two stage process. The stages in this process are in percentage, in years, percentage, business, graph.
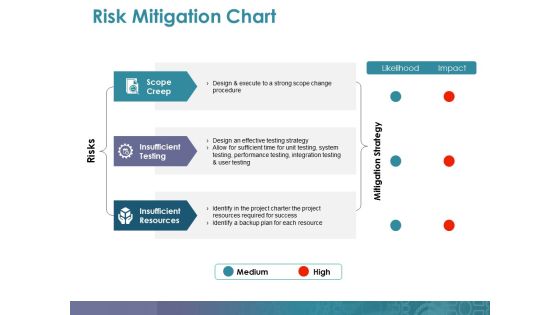
Risk Mitigation Chart Ppt PowerPoint Presentation Professional Guidelines
This is a risk mitigation chart ppt powerpoint presentation professional guidelines. This is a three stage process. The stages in this process are scope creep, insufficient testing, insufficient resources, mitigation strategy, risks.
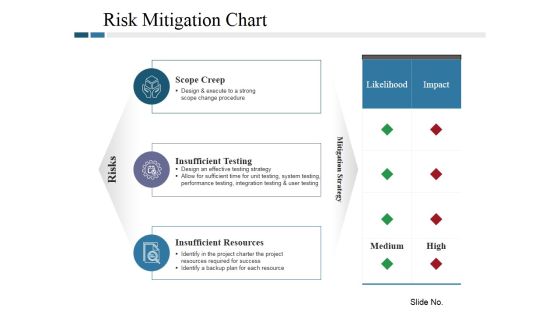
Risk Mitigation Chart Ppt PowerPoint Presentation Model Tips
This is a risk mitigation chart ppt powerpoint presentation model tips. This is a three stage process. The stages in this process are scope creep, insufficient testing, insufficient resources, risks, likelihood.

Volume Open High Low Close Chart Ppt PowerPoint Presentation Themes
This is a volume open high low close chart ppt powerpoint presentation themes. This is a five stage process. The stages in this process are high, volume, close, low.

Various Long Term Incentive Programs Plan Chart Pictures PDF
This slide represents various long term incentive policy plan chart such as deferred annual bonus, three year performance linked restricted stock and five year saving plan. Pitch your topic with ease and precision using this Various Long Term Incentive Programs Plan Chart Pictures PDF. This layout presents information on Plan Funding, Restricted Stock, Stock Bonus. It is also available for immediate download and adjustment. So, changes can be made in the color, design, graphics or any other component to create a unique layout.

Donut Pie Chart Ppt PowerPoint Presentation Infographic Template Diagrams
This is a donut pie chart ppt powerpoint presentation infographic template diagrams. This is a three stage process. The stages in this process are business, strategy, analysis, pretention, comparison.

Scatter Bubble Chart Ppt PowerPoint Presentation Diagram Ppt
This is a scatter bubble chart ppt powerpoint presentation diagram ppt. This is a two stage process. The stages in this process are product, in price, highest sale, percentage, business, marketing.

Sales And Marketing Plan Gantt Chart Ppt Examples Slides
This is a sales and marketing plan gantt chart ppt examples slides. This is a three stage process. The stages in this process are sales goal, sales actual, banner ads, newspaper, in store marketing.
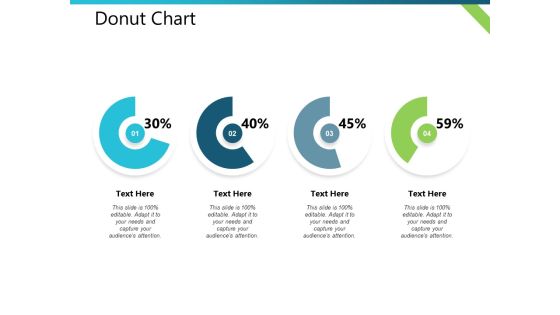
Donut Chart Distribution Plan Ppt PowerPoint Presentation Visual Aids Outline
This is a donut chart distribution plan ppt powerpoint presentation visual aids outline. This is a four stage process. The stages in this process are business, management, financial, marketing, strategy.
Pie Chart With Seven Business Icons Powerpoint Templates
Our compelling template consists with a design of pie chart with seven business icons. This slide has been professionally designed to exhibit financial ratio analysis. This template offers an excellent background to build impressive presentation.
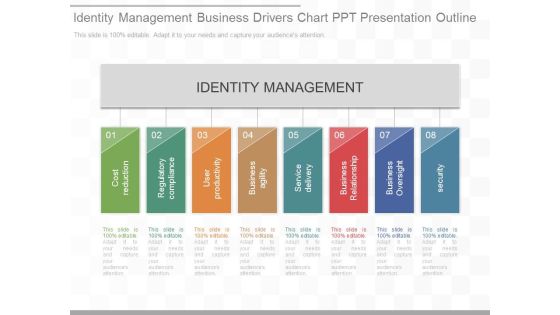
Identity Management Business Drivers Chart Ppt Presentation Outline
This is a identity management business drivers chart ppt presentation outline. This is a eight stage process. The stages in this process are identity management, cost reduction, regulatory compliance, user productivity, business agility, service delivery, business relationship, business oversight, security.
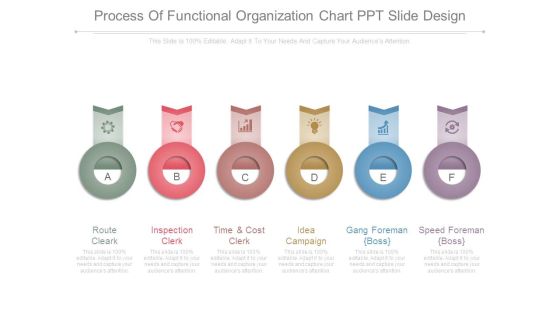
Process Of Functional Organization Chart Ppt Slide Design
This is a process of functional organization chart ppt slide design. This is a six stage process. The stages in this process are route cleark, inspection clerk, time and cost clerk, idea campaign, gang foreman boss, speed foreman boss.
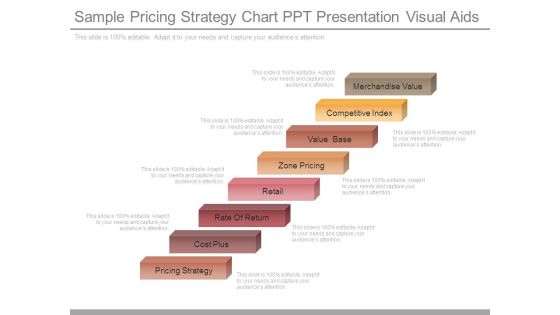
Sample Pricing Strategy Chart Ppt Presentation Visual Aids
This is a sample pricing strategy chart ppt presentation visual aids. This is a eight stage process. The stages in this process are merchandise value, competitive index, value base, zone pricing, retail, rate of return, cost plus, pricing strategy.

Concentric Chart With Five Financial Steps Powerpoint Slides
This PowerPoint slide contains diagram of concentric chart with five financial steps This professional slide helps to exhibit financial planning for business. Use this PowerPoint template to make impressive presentations.

Scatter Bubble Chart Ppt PowerPoint Presentation Inspiration Backgrounds
This is a scatter bubble chart ppt powerpoint presentation inspiration backgrounds. This is a five stage process. The stages in this process are highest sale, in price, business, marketing, success.

Area Chart Ppt PowerPoint Presentation Layouts Graphics Example
This is a area chart ppt powerpoint presentation layouts graphics example. This is a two stage process. The stages in this process are sales in percentage, financial year, business, marketing, presentation.
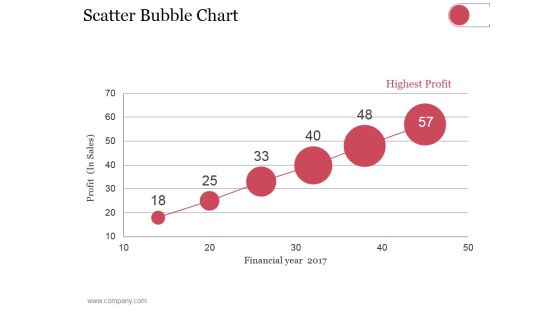
Scatter Bubble Chart Ppt PowerPoint Presentation Summary Pictures
This is a scatter bubble chart ppt powerpoint presentation summary pictures. This is a six stage process. The stages in this process are highest profit, financial year, profit in sales.
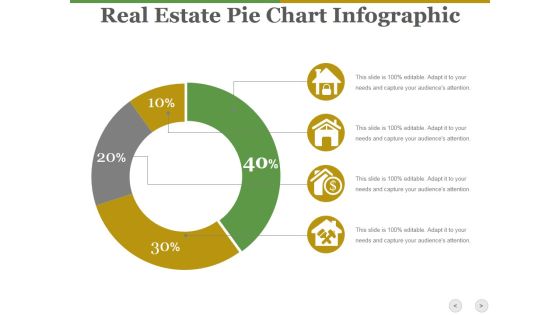
Real Estate Pie Chart Infographic Ppt PowerPoint Presentation Show Diagrams
This is a real estate pie chart infographic ppt powerpoint presentation show diagrams. This is a four stage process. The stages in this process are business, icons, marketing, strategy, process.

Hierarchy Chart Sample Templates Ppt PowerPoint Presentation Background Designs
This is a hierarchy chart sample templates ppt powerpoint presentation background designs. This is a two stage process. The stages in this process are business, marketing, management, communication, planning.

data collection and analysis flow chart ppt powerpoint presentation microsoft
This is a data collection and analysis flow chart ppt powerpoint presentation microsoft. This is a nine stage process. The stages in this process are business, planning, marketing, strategy, management.

Donut Pie Chart Ppt PowerPoint Presentation Infographic Template Sample
This is a donut pie chart ppt powerpoint presentation infographic template sample. This is a six stage process. The stages in this process are business, pie, process, planning, strategy.
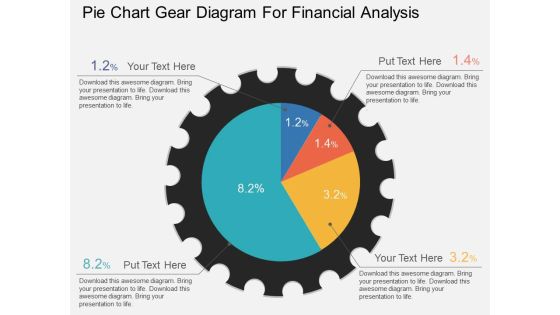
Pie Chart Gear Diagram For Financial Analysis Powerpoint Template
This PowerPoint template has been designed with graphic of pie chart gear diagram. This PPT slide can be used to display financial analysis. Download this PPT diagram slide to make your presentations more effective.
Business Strategy Innovation 3d Presentations Of Bar Chart Character Modeling
Your Thoughts Will Be The Main Course. Provide The Dressing With Our business strategy innovation 3d presentations of bar chart character modeling Powerpoint Templates. Dress Up Your Views With Our Marketing Powerpoint Templates. Deliver Your Ideas With Aplomb.

Xbar And R Chart Ppt PowerPoint Presentation Example 2015
This is a xbar and r chart ppt powerpoint presentation example 2015. This is a two stage process. The stages in this process are business, strategy, marketing, success, growth strategy.

Data Collection And Analysis Control Chart Ppt PowerPoint Presentation Visuals
This is a data collection and analysis control chart ppt powerpoint presentation visuals. This is a ten stage process. The stages in this process are upper limit, centerline, lower limit, plotted points.

Column Chart Ppt PowerPoint Presentation Infographic Template Graphic Images
This is a column chart ppt powerpoint presentation infographic template graphic images. This is a nine stage process. The stages in this process are business, marketing, growth, product, management.

Line Chart Ppt Powerpoint Presentation Infographic Template Format
This is a line chart ppt powerpoint presentation infographic template format. This is a two stage process. The stages in this process are jan, feb, mar, apr, may, financial.

High Low Close Chart Ppt PowerPoint Presentation Professional Background Images
This is a high low close chart ppt powerpoint presentation professional background images. This is a five stage process. The stages in this process are close, high, volume, low, open.

Volume High Low Close Chart Ppt PowerPoint Presentation Outline Examples
This is a volume high low close chart ppt powerpoint presentation outline examples. This is a five stage process. The stages in this process are high, low, volume, graph, business.

Combo Chart Ppt PowerPoint Presentation Infographic Template Brochure
This is a combo chart ppt powerpoint presentation infographic template brochure. This is a eight stage process. The stages in this process are product, market size, strategy, business, marketing.
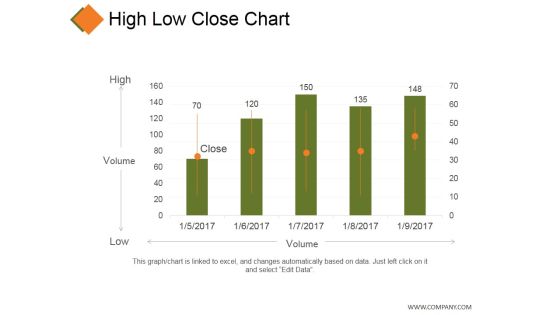
High Low Close Chart Ppt PowerPoint Presentation Model Grid
This is a high low close chart ppt powerpoint presentation model grid. This is a five stage process. The stages in this process are business, high, volume, low, marketing.

Donut Pie Chart Ppt PowerPoint Presentation Inspiration Background Image
This is a donut pie chart ppt powerpoint presentation inspiration background image. This is a three stage process. The stages in this process are product, percentage, business, marketing, process.
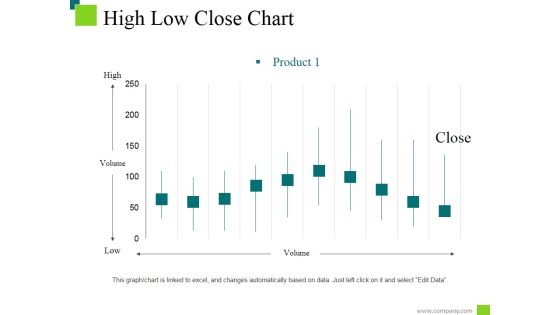
High Low Close Chart Ppt PowerPoint Presentation Styles Information
This is a high low close chart ppt powerpoint presentation styles information. This is a ten stage process. The stages in this process are low, high, product, volume, close.
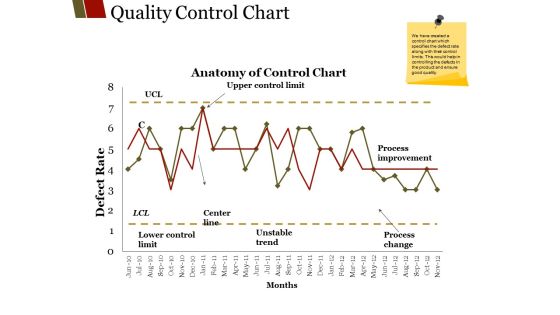
Quality Control Chart Ppt PowerPoint Presentation File Graphics Design
This is a quality control chart ppt powerpoint presentation file graphics design. This is a two stage process. The stages in this process are unstable trend, months center line, lower control limit, process improvement.
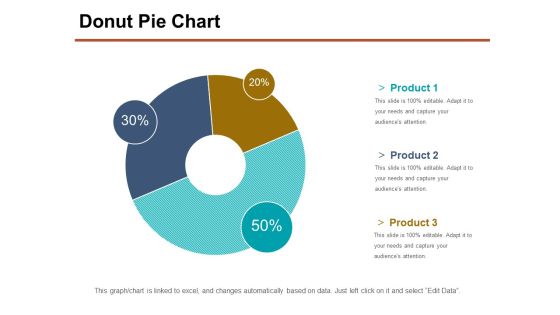
Donut Pie Chart Ppt PowerPoint Presentation Professional Slide Portrait
This is a donut pie chart ppt powerpoint presentation professional slide portrait. This is a three stage process. The stages in this process are product, percentage, business, management, process.
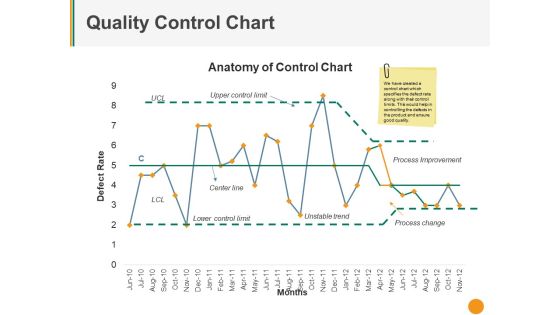
Quality Control Chart Ppt PowerPoint Presentation Pictures Deck
This is a quality control chart ppt powerpoint presentation pictures deck. This is a one stage process. The stages in this process are upper control limit, center line, unstable trend, process improvement, process change.
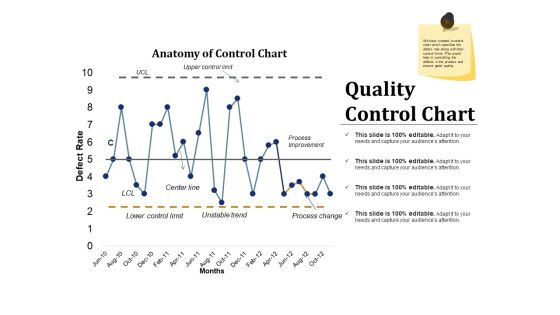
Quality Control Chart Ppt PowerPoint Presentation Inspiration Example Introduction
This is a quality control chart ppt powerpoint presentation inspiration example introduction. This is a two stage process. The stages in this process are process improvement, process change, unstable trend, lower control limit, center line.

Bar Chart Ppt PowerPoint Presentation Infographic Template Graphics Design
This is a bar chart ppt powerpoint presentation infographic template graphics design. This is a five stage process. The stages in this process are management, marketing, business, percentage, product.
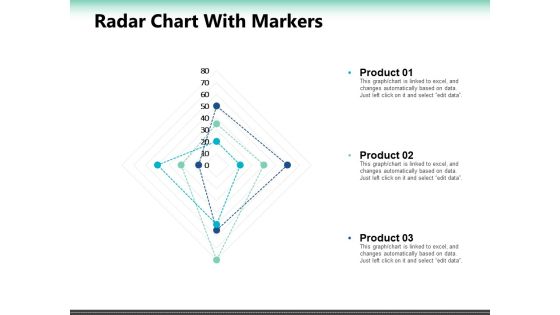
Radar Chart With Markers Ppt PowerPoint Presentation Summary Slide Portrait
This is a radar chart with markers ppt powerpoint presentation summary slide portrait. This is a seven stage process. The stages in this process are percentage, product, business, marketing.

Cash Payment Management Flow Chart Ppt PowerPoint Presentation Styles Professional
This is a cash payment management flow chart ppt powerpoint presentation styles professional. This is a seven stage process. The stages in this process are liquidity, cash assets, solvency.

Gantt Chart Events Ppt PowerPoint Presentation Portfolio Graphics
Make a highly optimized project management report using this content-ready Gantt Chart PPT Diagram. Effortless yet very clear, this layout proves a useful tool to present the professional details of a task or activity. Showcase the activities and allotted time to the business executives with this Gantt Chart PowerPoint theme. List down the column tasks in various timeframes and the activities associated with each of them here. Further, plot time allocation for various tasks, monitor their actual time and make comparisons to interpret the final progress with this well-structured Gantt Chart Excel Template. You can add all the significant details of a particular project in this chart and showcase it to all the project members so that they can participate in the overall development. Not only this but also our PPT template can help you showcase the work breakdown structure of your project.
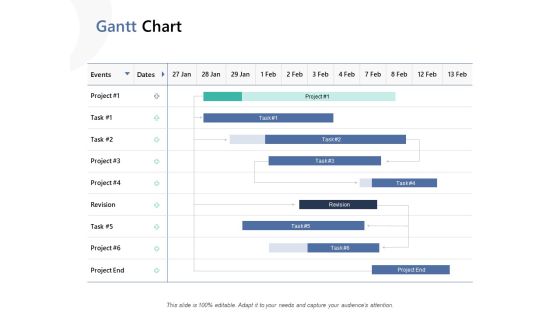
Gantt Chart Ppt PowerPoint Presentation Model Design Inspiration
Make a highly optimized project management report using this content-ready Gantt Chart PPT Diagram. Effortless yet very clear, this layout proves a useful tool to present the professional details of a task or activity. Showcase the activities and allotted time to the business executives with this Gantt Chart PowerPoint theme. List down the column tasks in various timeframes and the activities associated with each of them here. Further, plot time allocation for various tasks, monitor their actual time and make comparisons to interpret the final progress with this well-structured Gantt Chart Excel Template. You can add all the significant details of a particular project in this chart and showcase it to all the project members so that they can participate in the overall development. Not only this but also our PPT template can help you showcase the work breakdown structure of your project.

Gantt Chart Ppt PowerPoint Presentation Infographic Template Influencers
Make a highly optimized project management report using this content-ready Gantt Chart PPT Diagram. Effortless yet very clear, this layout proves a useful tool to present the professional details of a task or activity. Showcase the activities and allotted time to the business executives with this Gantt Chart PowerPoint theme. List down the column tasks in various timeframes and the activities associated with each of them here. Further, plot time allocation for various tasks, monitor their actual time and make comparisons to interpret the final progress with this well-structured Gantt Chart Excel Template. You can add all the significant details of a particular project in this chart and showcase it to all the project members so that they can participate in the overall development. Not only this but also our PPT template can help you showcase the work breakdown structure of your project.

Business Coaching Gantt Chart Ppt PowerPoint Presentation Layouts Files PDF
Make a highly optimized project management report using this content-ready Gantt Chart PPT Diagram. Effortless yet very clear, this layout proves a useful tool to present the professional details of a task or activity. Showcase the activities and allotted time to the business executives with this Gantt Chart PowerPoint theme. List down the column tasks in various timeframes and the activities associated with each of them here. Further, plot time allocation for various tasks, monitor their actual time and make comparisons to interpret the final progress with this well-structured Gantt Chart Excel Template. You can add all the significant details of a particular project in this chart and showcase it to all the project members so that they can participate in the overall development. Not only this but also our PPT template can help you showcase the work breakdown structure of your project.

Network Planning And Analysis Chart Powerpoint Slides Designs Download
This is a network planning and analysis chart powerpoint slides designs download. This is a six stage process. The stages in this process are equipment planning, proof of concept, project execution, configuration, installation, gap and root cause analysis.
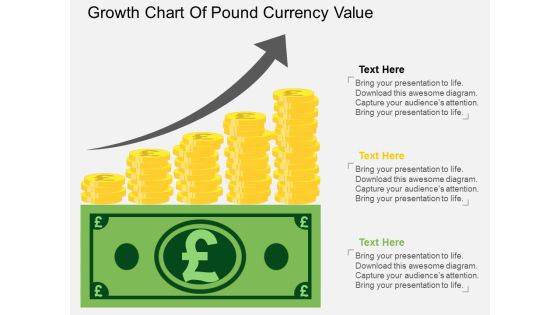
Growth Chart Of Pound Currency Value Powerpoint Template
The above PPT template displays growth chart of Pound currency. This diagram helps to exhibit Pound currency value growth. Adjust the above diagram in your business presentations to visually support your content.
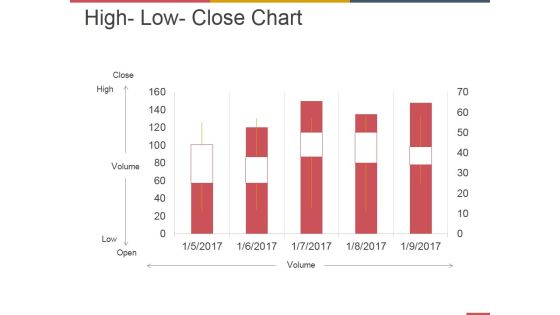
High Low Close Chart Ppt PowerPoint Presentation Summary Ideas
This is a high low close chart ppt powerpoint presentation summary ideas. This is a five stage process. The stages in this process are business, strategy, marketing, analysis, growth.
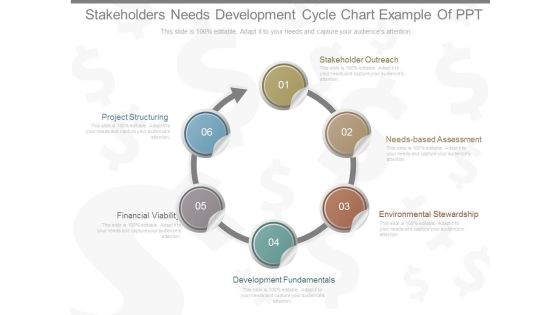
Stakeholders Needs Development Cycle Chart Example Of Ppt
This is a stakeholders needs development cycle chart example of ppt. This is a six stage process. The stages in this process are stakeholder outreach, needs based assessment, environmental stewardship,, development fundamentals, financial viability, project structuring.

Business Development Skills Business Development Skills Chart Slides
This is a business development skills business development skills chart slides. This is a eleven stage process. The stages in this process are entrepreneur, strategies, commercial, project, leadership, marketing, international, innovation, gestation, management, developer.
Pie Chart Icon For Yearly Earning Breakup Portrait PDF
Persuade your audience using this Pie Chart Icon For Yearly Earning Breakup Portrait PDF. This PPT design covers Three stages, thus making it a great tool to use. It also caters to a variety of topics including Pie Chart Icon, Yearly Earning Breakup. Download this PPT design now to present a convincing pitch that not only emphasizes the topic but also showcases your presentation skills.

5 Reinforcing Components Arrow Diagram Chart Business Prototyping PowerPoint Slides
We present our 5 reinforcing components arrow diagram chart business prototyping PowerPoint Slides.Use our Arrows PowerPoint Templates because it shows the pyramid which is a symbol of the desire to reach the top in a steady manner. Present our Business PowerPoint Templates because watch the excitement levels rise as they realise their worth. Download and present our Competition PowerPoint Templates because you know your business and have a vision for it. Use our Design PowerPoint Templates because your business and plans for its growth consist of processes that are highly co-related. Download and present our Shapes PowerPoint Templates because the atmosphere in the worplace is electric.Use these PowerPoint slides for presentations relating to arrow, arrows, block, business, chart, design, development, diagram, direction, element, flow, flowchart, graph, linear, management, organization, process, program, section, sign, solution, symbol. The prominent colors used in the PowerPoint template are Blue, Gray, Black. Professionals tell us our 5 reinforcing components arrow diagram chart business prototyping PowerPoint Slides are Efficacious. The feedback we get is that our block PowerPoint templates and PPT Slides are Appealing. We assure you our 5 reinforcing components arrow diagram chart business prototyping PowerPoint Slides are designed by professionals Customers tell us our chart PowerPoint templates and PPT Slides are Fantastic. Presenters tell us our 5 reinforcing components arrow diagram chart business prototyping PowerPoint Slides are Fun. People tell us our block PowerPoint templates and PPT Slides are Nice.

Chart For Cash Flow In Business Investment Ideas PDF
Pitch your topic with ease and precision using this chart for cash flow in business investment ideas pdf. This layout presents information on operating account, designated account, capital returns. It is also available for immediate download and adjustment. So, changes can be made in the color, design, graphics or any other component to create a unique layout.
Price Catalogue Chart Icon Of Automobile Company Demonstration PDF
Persuade your audience using this price catalogue chart icon of automobile company demonstration pdf. This PPT design covers three stages, thus making it a great tool to use. It also caters to a variety of topics including price catalogue chart icon of automobile company. Download this PPT design now to present a convincing pitch that not only emphasizes the topic but also showcases your presentation skills.
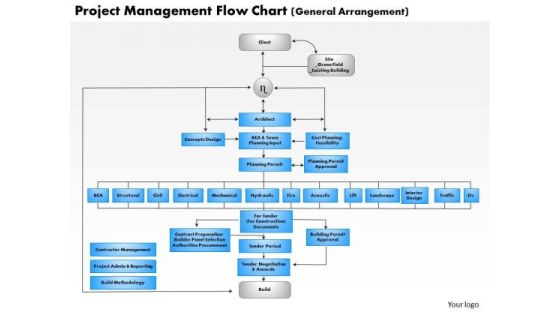
Business Framework Project Management Flow Chart PowerPoint Presentation
This diagram displays profitability ratio calculation template. Use this diagram in business and marketing presentations to depict profit ratio. This diagram will enhance the quality of your presentations.
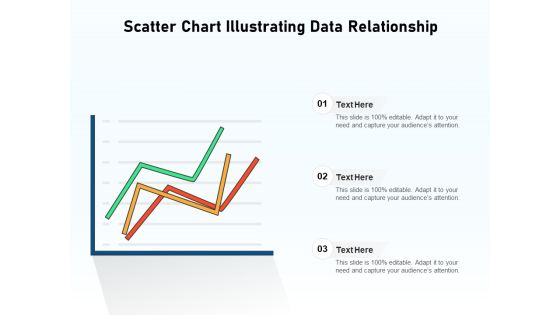
Scatter Chart Illustrating Data Relationship Ppt PowerPoint Presentation Microsoft PDF
Persuade your audience using this scatter chart illustrating data relationship ppt powerpoint presentation microsoft pdf. This PPT design covers three stages, thus making it a great tool to use. It also caters to a variety of topics including scatter chart illustrating data relationship. Download this PPT design now to present a convincing pitch that not only emphasizes the topic but also showcases your presentation skills.

Organizational Stakeholder Engagement And Management Comparative Analysis Chart Professional PDF
This slide exhibits stakeholder analysis comparative chart. It includes stakeholder name, position role, power, interest and support of stakeholders. Showcasing this set of slides titled Organizational Stakeholder Engagement And Management Comparative Analysis Chart Professional PDF. The topics addressed in these templates are Finance Manager, Operation Manager, Developer. All the content presented in this PPT design is completely editable. Download it and make adjustments in color, background, font etc. as per your unique business setting.

Cyber Computing Services Risk Analysis Software Status Chart Portrait PDF
This slide illustrates different digitally enabled cyber computing applications. It includes risk severity chart, action cost along with risk owner details and implementation due date. Showcasing this set of slides titled Cyber Computing Services Risk Analysis Software Status Chart Portrait PDF. The topics addressed in these templates are Risk Treatment, Risk Owner, Implementation. All the content presented in this PPT design is completely editable. Download it and make adjustments in color, background, font etc. as per your unique business setting.

PMP Process Chart With Progress Groups Ppt Pictures Deck PDF
Following slide displays project management process chart along with the details about progress groups namely initiating, planning, executing, monitoring and controlling and closing. Deliver an awe inspiring pitch with this creative pmp process chart with progress groups ppt pictures deck pdf bundle. Topics like management, integration, schedule can be discussed with this completely editable template. It is available for immediate download depending on the needs and requirements of the user.

RACI Chart For Launching Advertising Campaign Ideas PDF
The purpose of this template is to provide RACI chart for launching marketing campaigns . It covers information about responsible, accountable, consulted and informed team members. Pitch your topic with ease and precision using this RACI Chart For Launching Advertising Campaign Ideas PDF. This layout presents information on Project Management, Webpage Design, Tracking And Reporting. It is also available for immediate download and adjustment. So, changes can be made in the color, design, graphics or any other component to create a unique layout.

Data Visualization And Predictive Analysis Chart Ppt Slides
This is a data visualization and predictive analysis chart ppt slides. This is a nine stage process. The stages in this process are business requirement, data exploration, data selection, data preparation, design model, validate model, deploy model, analyze results, update model, revalidate.

Explain Parallel Processing 10 Stages Flow Chart PowerPoint Templates
We present our explain parallel processing 10 stages flow chart PowerPoint templates.Download and present our Business PowerPoint Templates because Our PowerPoint Templates and Slides will let Your superior ideas hit the target always and everytime. Download and present our Arrows PowerPoint Templates because Our PowerPoint Templates and Slides will steer your racing mind. Hit the right buttons and spur on your audience. Present our Shapes PowerPoint Templates because You can Stir your ideas in the cauldron of our PowerPoint Templates and Slides. Cast a magic spell on your audience. Use our Success PowerPoint Templates because Our PowerPoint Templates and Slides are focused like a searchlight beam. They highlight your ideas for your target audience. Download and present our Signs PowerPoint Templates because You will get more than you ever bargained for. Use these PowerPoint slides for presentations relating to 3d, achievement, aim, arrows, business, career, chart, competition,development, direction, education, financial, forecast, forward, glossy, graph,group, growth, higher, icon, increase, investment, leader, leadership, moving,onwards, outlook, path, plan, prediction, price, profit, progress, property, race,sales, series, success, target, team, teamwork, turn, up, upwards, vector, win,winner. The prominent colors used in the PowerPoint template are Tan, Gray, White. We assure you our explain parallel processing 10 stages flow chart PowerPoint templates are designed by professionals PowerPoint presentation experts tell us our arrows PowerPoint templates and PPT Slides will save the presenter time. The feedback we get is that our explain parallel processing 10 stages flow chart PowerPoint templates look good visually. We assure you our chart PowerPoint templates and PPT Slides have awesome images to get your point across. PowerPoint presentation experts tell us our explain parallel processing 10 stages flow chart PowerPoint templates will make you look like a winner. We assure you our arrows PowerPoint templates and PPT Slides are specially created by a professional team with vast experience. They diligently strive to come up with the right vehicle for your brilliant Ideas.
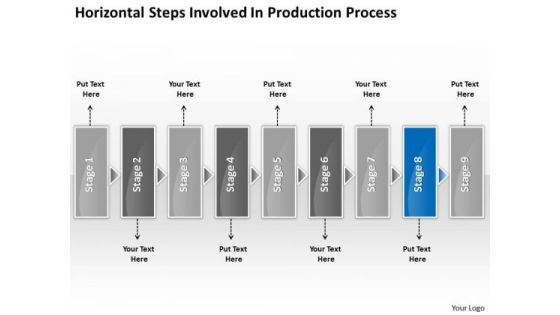
Horizontal Steps Involved Production Processs Business Fishbone Chart PowerPoint Templates
We present our horizontal steps involved production processs business fishbone chart PowerPoint templates.Download and present our Arrows PowerPoint Templates because this layout helps you to see satisfaction spread across the room as they unravel your gifted views. Use our Shapes PowerPoint Templates because you should take your team soaring to the pinnacle they crave. Present our Business PowerPoint Templates because this is the unerring accuracy in reaching the target. the effortless ability to launch into flight. Use our Boxes PowerPoint Templates because your listeners do not have to put on their thinking caps. Download our Communication PowerPoint Templates because you can gain the success to desired levels in one go.Use these PowerPoint slides for presentations relating to abstract, arrow, blank, business, chart, circular, circulation, concept, conceptual, design, diagram, executive, flow, horizontal, icon, idea, illustration, management, model, numbers, organization, process, progression, resource, sequence, stages, steps, strategy. The prominent colors used in the PowerPoint template are Blue, Gray, Black. The feedback we get is that our horizontal steps involved production processs business fishbone chart PowerPoint templates are Magnificent. PowerPoint presentation experts tell us our chart PowerPoint templates and PPT Slides are Elegant. People tell us our horizontal steps involved production processs business fishbone chart PowerPoint templates are Nice. Professionals tell us our circulation PowerPoint templates and PPT Slides are Colorful. You can be sure our horizontal steps involved production processs business fishbone chart PowerPoint templates are Fun. We assure you our concept PowerPoint templates and PPT Slides are designed by a team of presentation professionals.

Dollar Chart Business PowerPoint Themes And PowerPoint Slides 0611
Microsoft PowerPoint Theme and Slide with red and blue charts and a dollar sign with an arrow

Dollar Chart Business PowerPoint Templates And PowerPoint Backgrounds 0611
Microsoft PowerPoint Template and Background with red and blue charts and a dollar sign with an arrow
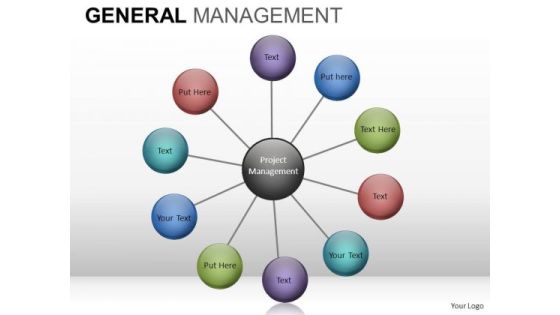
Wheel Chart Diagram PowerPoint Slides And Editable Ppt Templates Download
Wheel_Chart_Diagram_PowerPoint_slides_and_Editable_PPT_templates_Download-These high quality powerpoint pre-designed slides and powerpoint templates have been carefully created by our professional team to help you impress your audience. All slides have been created and are 100% editable in powerpoint. Each and every property of any graphic - color, size, orientation, shading, outline etc. can be modified to help you build an effective powerpoint presentation. Any text can be entered at any point in the powerpoint template or slide. Simply DOWNLOAD, TYPE and PRESENT! These PowerPoint presentation slides can be used to represent themes relating to --Abstract, action, analysis, blank, business, chart, clipart, commerce, concept, conceptual, design, diagram, direction, flow, generic, goals, guide, guidelines, heirarchy, icon, idea, illustration, lingakes, links, manage, management, mba, model, organization, performance, plan, process, project, relationship, representation, resource, steps, strategy, success, tactics, theoretical, theory, tool, workflow-Wheel_Chart_Diagram_PowerPoint_slides_and_Editable_PPT_templates_Download
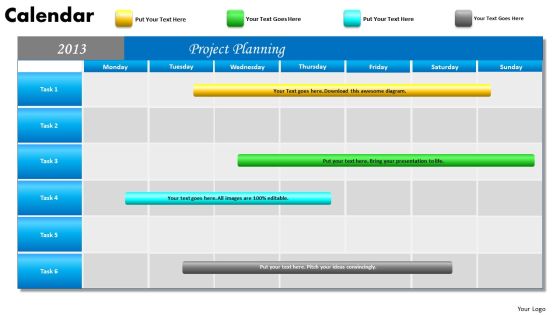
Project Planning Gantt Chart 2013 Calendar PowerPoint Slides Ppt Templates
We present our Project Planning Gantt Chart 2013 Calendar PowerPoint Slides PPT templates.Download and present our Calendars PowerPoint Templates because this slide depicts the occasion for gifting and giving. Present our New Year PowerPoint Templates because our templates emphasises your views. Use our Timelines PowerPoint Templates because this one depicts the popular chart. Use our Targets PowerPoint Templates because you can asked to strive to give true form to your great dream. Use our Time Planning PowerPoint Templates because you can Help your viewers automatically emphathise with your thoughts.Use these PowerPoint slides for presentations relating to 2013, Abstract, Agenda, Annual, April, Background, Book, Business, Calendar, Calendar, Content, Date, Day, Design, Desk, Diary, Document, Editable, Element, Eps10, Graphic, Green, Icon, Illustration, Layout, Monday, Month, Monthly, New, Note, Notepaper, Number, Old, Organizer, Paper, Plan, Planner. The prominent colors used in the PowerPoint template are Blue, Green, Yellow. PowerPoint presentation experts tell us our Project Planning Gantt Chart 2013 Calendar PowerPoint Slides PPT templates are Amazing. You can be sure our April PowerPoint templates and PPT Slides will make the presenter look like a pro even if they are not computer savvy. Presenters tell us our Project Planning Gantt Chart 2013 Calendar PowerPoint Slides PPT templates are Ritzy. We assure you our Calendar PowerPoint templates and PPT Slides are Tranquil. Professionals tell us our Project Planning Gantt Chart 2013 Calendar PowerPoint Slides PPT templates are Nice. The feedback we get is that our Business PowerPoint templates and PPT Slides are Tranquil.

Human Resource Value Chain Chart Showing Impact Slides PDF
This slide shows HR value chain chart to show value addition in organizational goals. It includes elements such as process, effectiveness, and impact. Persuade your audience using this Human Resource Value Chain Chart Showing Impact Slides PDF. This PPT design covers three stages, thus making it a great tool to use. It also caters to a variety of topics including Process, Effectivenes, Impact. Download this PPT design now to present a convincing pitch that not only emphasizes the topic but also showcases your presentation skills.

Leverage Securities Estimation Chart Ppt PowerPoint Presentation File Format
Presenting this set of slides with name leverage securities estimation chart ppt powerpoint presentation file format. The topics discussed in these slides are marketing, process, management, planning, strategy. This is a completely editable PowerPoint presentation and is available for immediate download. Download now and impress your audience.

Column Chart Finance Marketing Ppt PowerPoint Presentation Inspiration Graphic Images
Presenting this set of slides with name column chart finance marketing ppt powerpoint presentation inspiration graphic images. The topics discussed in these slides are finance, marketing, management, investment, analysis. This is a completely editable PowerPoint presentation and is available for immediate download. Download now and impress your audience.
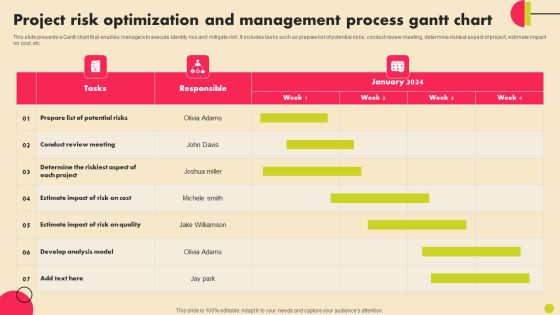
Project Risk Optimization And Management Process Gantt Chart Introduction PDF
This slide presents a Gantt chart that enables managers to execute identity risk and mitigate risk. It includes tasks such as prepare list of potential risks, conduct review meeting, determine riskiest aspect of project, estimate impact on cost, etc. Pitch your topic with ease and precision using this Project Risk Optimization And Management Process Gantt Chart Introduction PDF. This layout presents information on Determine, Develop Analysis Model, Potential Risks. It is also available for immediate download and adjustment. So, changes can be made in the color, design, graphics or any other component to create a unique layout.
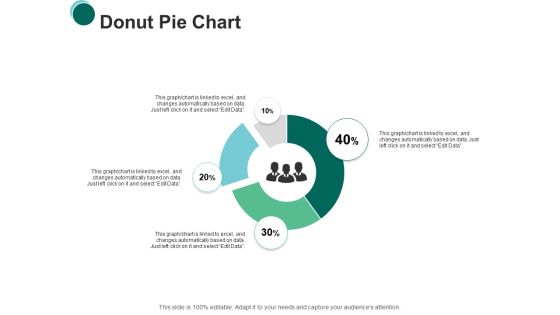
Donut Pie Chart Finance Ppt PowerPoint Presentation Infographics Slides
Presenting this set of slides with name donut pie chart finance ppt powerpoint presentation infographics slides. This is a four stage process. The stages in this process are finance, marketing, management, investment, analysis. This is a completely editable PowerPoint presentation and is available for immediate download. Download now and impress your audience.

Construction Project Administration Strategy With Gantt Chart Topics PDF
This slide covers a Gantt Chart which will help project leaders in tracking the status of the tasked involved in the project. It also includes project name, start date, end date, projects assigned to and percentage of task completion.Pitch your topic with ease and precision using this Construction Project Administration Strategy With Gantt Chart Topics PDF. This layout presents information on Estimate Complete, Basement Demolition, Contract Signed. It is also available for immediate download and adjustment. So, changes can be made in the color, design, graphics or any other component to create a unique layout.
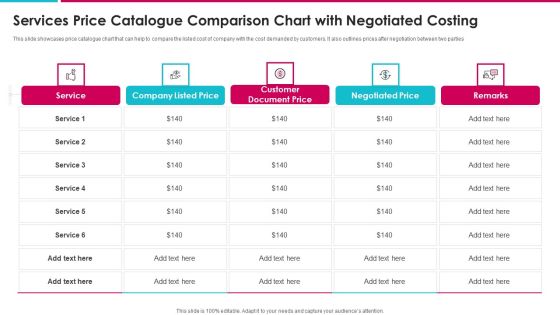
Services Price Catalogue Comparison Chart With Negotiated Costing Topics PDF
This slide showcases price catalogue chart that can help to compare the listed cost of company with the cost demanded by customers. It also outlines prices after negotiation between two parties Pitch your topic with ease and precision using this services price catalogue comparison chart with negotiated costing topics pdf. This layout presents information on service, company listed price, customer document price, negotiated price. It is also available for immediate download and adjustment. So, changes can be made in the color, design, graphics or any other component to create a unique layout.

Company Product Sales Forecast Chart Ppt Gallery Design Templates PDF
This slide shows the Product sales forecast table with Product names along with price per unit and total units sold for the current as well as the projected period till the year 2023. Deliver and pitch your topic in the best possible manner with this company product sales forecast chart ppt gallery design templates pdf. Use them to share invaluable insights on active sports wear, gaming consoles, deodorants, product and impress your audience. This template can be altered and modified as per your expectations. So, grab it now.

Two Layered Venn Diagram Cycle Chart PowerPoint Slides
We present our two layered venn diagram Cycle Chart PowerPoint Slides.Use our Marketing PowerPoint Templates because Our PowerPoint Templates and Slides will let you Clearly mark the path for others to follow. Present our Business PowerPoint Templates because maximising sales of your product is the intended destination. Use our Shapes PowerPoint Templates because you know what it takes to keep it fit and healthy. Use our Finance PowerPoint Templates because you envisage some areas of difficulty in the near future. The overall financial situation could be a source of worry. Download our Symbol PowerPoint Templates because this helps you to put all your brilliant views to your audience.Use these PowerPoint slides for presentations relating to Background, Black, Blue, Business, Chart, Circle, Diagram, Drop, Financial, Green, Icon, Isolated, Overlapping, Process, Red, Round, Shadow, Shape, Three, Transparency, Vector, Venn, White. The prominent colors used in the PowerPoint template are Blue, Green, Black. We assure you our two layered venn diagram Cycle Chart PowerPoint Slides are Awesome. Customers tell us our Diagram PowerPoint templates and PPT Slides are Attractive. The feedback we get is that our two layered venn diagram Cycle Chart PowerPoint Slides are Luxuriant. We assure you our Business PowerPoint templates and PPT Slides are Amazing. People tell us our two layered venn diagram Cycle Chart PowerPoint Slides are Excellent. We assure you our Blue PowerPoint templates and PPT Slides are Tasteful.

Action Management Chart For Project Status Progress Background PDF
This slide exhibits project action planning chart illustrating action steps, goal, department responsible etc that helps organization to monitor and track project progress and take immediate required steps to make procedure more efficient. Showcasing this set of slides titled Action Management Chart For Project Status Progress Background PDF. The topics addressed in these templates are Web Development, Marketing, Resources Required. All the content presented in this PPT design is completely editable. Download it and make adjustments in color, background, font etc. as per your unique business setting.
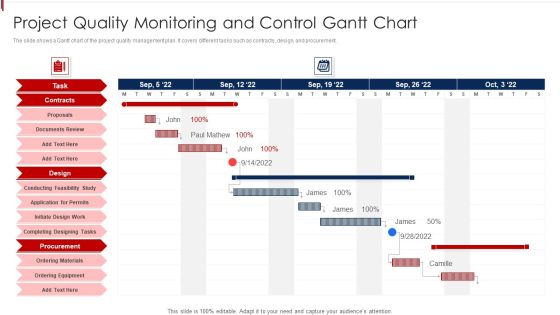
Project Quality Monitoring And Control Gantt Chart Clipart PDF
The slide shows a Gantt chart of the project quality management plan. It covers different tasks such as contracts, design, and procurement. Introducing our Project Quality Monitoring And Control Gantt Chart Clipart PDF that is designed to showcase some of the vital components that will help you create timelines, roadmaps, and project plans. In addition, also communicate your project durations, milestones, tasks, subtasks, dependencies, and other attributes using this well structured Project Quality Monitoring And Control Gantt Chart Clipart PDF template. You can also exhibit preeminence against time by deploying this easily adaptable slide to your business presentation. Our experts have designed this template in such a way that it is sure to impress your audience. Thus, download it and steer your project meetings, meetups, and conferences.

Project Performance Progress Monitoring Calendar Chart Pictures PDF
This slide covers the project performance measurement schedule chart. It includes the project details along with the project status, task assigned to, start date, end date, and duration of completing each task. Showcasing this set of slides titled Project Performance Progress Monitoring Calendar Chart Pictures PDF. The topics addressed in these templates are Plan Risk Management, Project Definition And Planning, Execution. All the content presented in this PPT design is completely editable. Download it and make adjustments in color, background, font etc. as per your unique business setting.

Project Time Scheduling Chart With Task Details Pictures PDF
This slide delineates project time management chart with task details that businesses can use during their routine projects . It also contains information about analysis, design, development and testing which can assist project managers in effective time management. Showcasing this set of slides titled project time scheduling chart with task details pictures pdf. The topics addressed in these templates are design, analysis, development. All the content presented in this PPT design is completely editable. Download it and make adjustments in color, background, font etc. as per your unique business setting.

5 Year Selling Forecasts Conversion Rate Chart Microsoft PDF
This slide covers forecast for sales conversion rates. It includes elements such as units in pipeline, pipeline growth rate, sales conversion rate, annual units sold, price per unit, forecast on revenue generation, etc. Pitch your topic with ease and precision using this 5 Year Selling Forecasts Conversion Rate Chart Microsoft PDF. This layout presents information on Conversion Rate, Price Per Unit, Growth Rate. It is also available for immediate download and adjustment. So, changes can be made in the color, design, graphics or any other component to create a unique layout.

Weekly Project Monitoring Calendar Performance Gantt Chart Formats PDF
This template covers the project implementation chart with various project stages. It also includes the project task completion status with task start date, end date, target days, days taken to complete the task, percentage of the job finished, etc. Showcasing this set of slides titled Weekly Project Monitoring Calendar Performance Gantt Chart Formats PDF. The topics addressed in these templates are Plan, Execution, Analysis. All the content presented in this PPT design is completely editable. Download it and make adjustments in color, background, font etc. as per your unique business setting.

Sales Techniques Playbook Different Products Price Comparison Chart Demonstration PDF
This slide provides information regarding product price comparison chart that captures information about price per unit, change over list price, reason for proposed price, volumes sold, forecasted growth. This is a sales techniques playbook different products price comparison chart demonstration pdf template with various stages. Focus and dispense information on two stages using this creative set, that comes with editable features. It contains large content boxes to add your information on topics like product, consumer, price, growth. You can also showcase facts, figures, and other relevant content using this PPT layout. Grab it now.

Sales Techniques Playbook Different Products Price Comparison Chart Graphics PDF
This slide provides information regarding product price comparison chart that captures information about price per unit, change over list price, reason for proposed price, volumes sold, forecasted growth. This is a sales techniques playbook different products price comparison chart graphics pdf template with various stages. Focus and dispense information on one stage using this creative set, that comes with editable features. It contains large content boxes to add your information on topics like ensuring effective communication among sales management team You can also showcase facts, figures, and other relevant content using this PPT layout. Grab it now.
Project Incremental Life Cycles Gantt Chart Icon Information PDF
This slide covers spiral model that puts focus on thorough risk assessment. It includes spiral iteration starting with four activities such as thorough planning, risk analysis, prototypes creation and evaluation of part previously delivered. Pitch your topic with ease and precision using this Project Incremental Life Cycles Gantt Chart Icon Information PDF. This layout presents information on Project Incremental, Life Cycles Gantt, Chart Icon. It is also available for immediate download and adjustment. So, changes can be made in the color, design, graphics or any other component to create a unique layout.

Project Timeline Gantt Chart For Weekly Themes PDF
Introducing our project timeline gantt chart for weekly themes pdf that is designed to showcase some of the vital components that will help you create timelines, roadmaps, and project plans. In addition, also communicate your project durations, milestones, tasks, subtasks, dependencies, and other attributes using this well structured project timeline gantt chart for weekly themes pdf template. You can also exhibit preeminence against time by deploying this easily adaptable slide to your business presentation. Our experts have designed this template in such a way that it is sure to impress your audience. Thus, download it and steer your project meetings, meetups, and conferences.
Project Task Management Chart For Tracking Progress Themes PDF
This slide exhibits project task planning chart for tracking progress illustrating task description, starting date, planned ending date, actual end date, planned work days etc that helps in tracking project progress. Showcasing this set of slides titled Project Task Management Chart For Tracking Progress Themes PDF. The topics addressed in these templates are Requirements Analysis, Business Case, Configuration Management. All the content presented in this PPT design is completely editable. Download it and make adjustments in color, background, font etc. as per your unique business setting.

Web Design Development Project Strategy Gantt Chart Information PDF
The slide showcases a website design project Gantt chart help visualizing project plan over the course of several weeks or even months. It covers aspects such as key tasks, progress and assigned teams. Pitch your topic with ease and precision using this Web Design Development Project Strategy Gantt Chart Information PDF. This layout presents information on Content Design, Develop Content, Web Design Project. It is also available for immediate download and adjustment. So, changes can be made in the color, design, graphics or any other component to create a unique layout.

Agile Project Incremental Life Cycles Plan Gantt Chart Guidelines PDF
This slide covers gantt chart of agile project iteration tasks. It includes tasks such as sprint planning, set up staging environment, configure multilingual features, create base theme, etc. Along with assigned persons and task progress bars. Showcasing this set of slides titled Agile Project Incremental Life Cycles Plan Gantt Chart Guidelines PDF. The topics addressed in these templates are Agile Project Plan, Sprint Planning, Assemble Template. All the content presented in this PPT design is completely editable. Download it and make adjustments in color, background, font etc. as per your unique business setting.

Financial Growth Examples Flow Chart Diagram Powerpoint Slide Graphics
This is a financial growth examples flow chart diagram powerpoint slide graphics. This is a six stage process. The stages in this process are increase in productivity, economic growth and development, increase in flow of goods and services in economy, consumption rises, size of market increase, inducement to invest for firms.
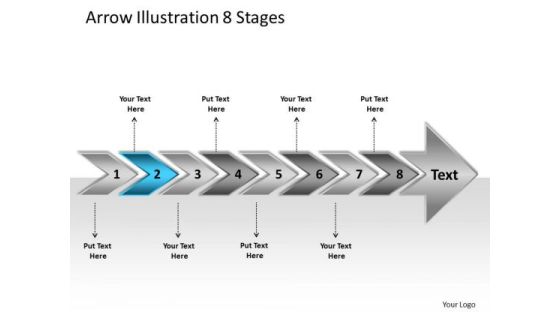
Arrow Illustration 8 Stages Business Flow Chart Slides PowerPoint
We present our arrow illustration 8 stages business flow chart Slides PowerPoint. Use our Arrows PowerPoint Templates because, the color coding of our templates are specifically designed to highlight you points. Use our Business PowerPoint Templates because, Now use this slide to bullet point your views. Use our Shapes PowerPoint Templates because; unravel the desired and essential elements of your overall strategy. Use our Finance PowerPoint Templates because, Goal Pie Chart Template: - You have a clear vision of the cake you want. Use our Process and Flows PowerPoint Templates because, you have the entire picture in mind. Use these PowerPoint slides for presentations relating to 3d arrow background bullet business chart checkmark chevron diagram drop eps10 financial five glass graphic gray icon illustration management point process project reflection set shadow stage text transparency vector white. The prominent colors used in the PowerPoint template are Blue, Gray, and Black
Business Diagram Pie Chart With Icons For Finance Presentation Template
Our professionally designed business diagram is as an effective tool for communicating business ideas and strategies for corporate planning. It contains graphics of pie chart with icons. Convey your views with this diagram slide. It will amplify the strength of your logic.
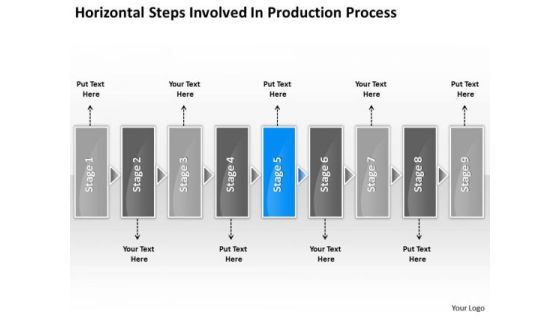
Horizontal Steps Involved Production Process Slides Flow Chart PowerPoint Templates
We present our horizontal steps involved production process Slides flow chart PowerPoint templates.Download our Arrows PowerPoint Templates because it gives a core idea about various enveloping layers. Download our Shapes PowerPoint Templates because you can Take your team along by explaining your plans. Use our Business PowerPoint Templates because maximising sales of your product is the intended destination. Use our Boxes PowerPoint Templates because our template will help pinpoint their viability. Use our Communication PowerPoint Templates because it can illustrate your chain of ideas focusing on that aspect or resource in order to enhance the quality of your product.Use these PowerPoint slides for presentations relating to abstract, arrow, blank, business, chart, circular, circulation, concept, conceptual, design, diagram, executive, flow, horizontal, icon, idea, illustration, management, model, numbers, organization, process, progression, resource, sequence, stages, steps, strategy. The prominent colors used in the PowerPoint template are Blue, Gray, Black. The feedback we get is that our horizontal steps involved production process Slides flow chart PowerPoint templates are Magnificent. PowerPoint presentation experts tell us our circulation PowerPoint templates and PPT Slides are Second to none. People tell us our horizontal steps involved production process Slides flow chart PowerPoint templates are Spiffy. Professionals tell us our concept PowerPoint templates and PPT Slides are Breathtaking. You can be sure our horizontal steps involved production process Slides flow chart PowerPoint templates are No-nonsense. We assure you our concept PowerPoint templates and PPT Slides are Radiant.

Project Gantt Chart For Online Promotion Activities Graphics PDF
Introducing our project gantt chart for online promotion activities graphics pdf that is designed to showcase some of the vital components that will help you create timelines, roadmaps, and project plans. In addition, also communicate your project durations, milestones, tasks, subtasks, dependencies, and other attributes using this well structured project gantt chart for online promotion activities graphics pdf template. You can also exhibit preeminence against time by deploying this easily adaptable slide to your business presentation. Our experts have designed this template in such a way that it is sure to impress your audience. Thus, download it and steer your project meetings, meetups, and conferences.

Executing Operation Administration Project Flow Chart Clipart PDF
This slide shows the flowchart for carrying out an operation management project which assist in enhancing process standardization. It passes through various stages such as establishing project team, communication charts, quality check, etc. Presenting Executing Operation Administration Project Flow Chart Clipart PDF to dispense important information. This template comprises one stages. It also presents valuable insights into the topics including Executing Security, Establish Project Team. This is a completely customizable PowerPoint theme that can be put to use immediately. So, download it and address the topic impactfully.
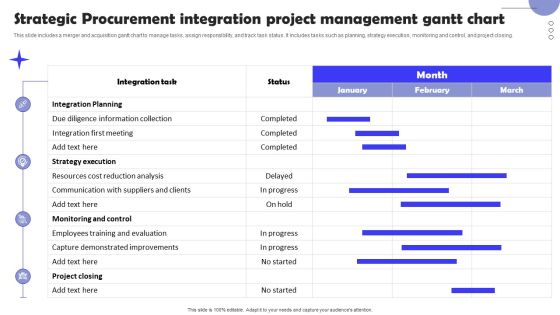
Strategic Procurement Integration Project Management Gantt Chart Summary PDF
This slide includes a merger and acquisition gantt chart to manage tasks, assign responsibility, and track task status. It includes tasks such as planning, strategy execution, monitoring and control, and project closing. Showcasing this set of slides titled Strategic Procurement Integration Project Management Gantt Chart Summary PDF. The topics addressed in these templates are Integration Planning, Monitoring And Control, Strategy Execution. All the content presented in this PPT design is completely editable. Download it and make adjustments in color, background, font etc. as per your unique business setting.

Software Implementation Project Gantt Chart Ppt Gallery Pictures PDF
This slide represents the Gantt chart showing effective implementation of software development project. It includes details related to analysis, design, development, testing, implementation etc. of the software development project. Make sure to capture your audiences attention in your business displays with our gratis customizable Software Implementation Project Gantt Chart Ppt Gallery Pictures PDF. These are great for business strategies, office conferences, capital raising or task suggestions. If you desire to acquire more customers for your tech business and ensure they stay satisfied, create your own sales presentation with these plain slides.

Gantt Chart For Application Data Migration Project Elements PDF
This slide showcases gantt. chart that can help organization to keep track of key milestones of application migration project and ensure efficient implementation of whole process. Its key components are starts date, end date and duration in days. Pitch your topic with ease and precision using this Gantt Chart For Application Data Migration Project Elements PDF. This layout presents information on Data Migration Requirements, Application Dependencies, Application Installation. It is also available for immediate download and adjustment. So, changes can be made in the color, design, graphics or any other component to create a unique layout.

Gantt Chart Presenting Waterfall Project Management In Healthcare Pictures PDF
This slide shows the Gantt chart that is presenting waterfall project management in healthcare which covers name of the tasks such as analysis, designing, development, testing, implementation with on site meetings, documenting current system, designing database, etc. Showcasing this set of slides titled Gantt Chart Presenting Waterfall Project Management In Healthcare Pictures PDF. The topics addressed in these templates are Documenting Current System, Designing Database, Development. All the content presented in this PPT design is completely editable. Download it and make adjustments in color, background, font etc. as per your unique business setting.

Combo Chart Finance Ppt PowerPoint Presentation Icon Graphics Pictures
Presenting this set of slides with name combo chart finance ppt powerpoint presentation icon graphics pictures. The topics discussed in these slides are marketing, business, management, planning, strategy. This is a completely editable PowerPoint presentation and is available for immediate download. Download now and impress your audience.

Bar Chart Finance Ppt PowerPoint Presentation Icon Introduction
Presenting this set of slides with name bar chart finance ppt powerpoint presentation icon introduction. The topics discussed in these slides are marketing, business, management, planning, strategy. This is a completely editable PowerPoint presentation and is available for immediate download. Download now and impress your audience.
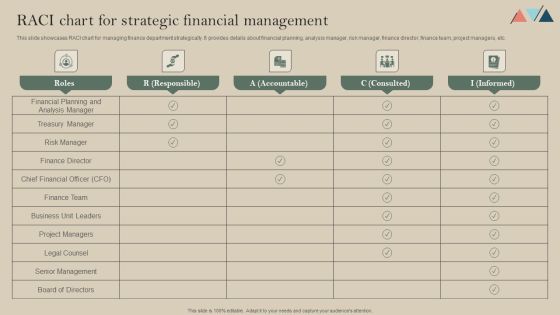
RACI Chart For Strategic Financial Management Diagrams PDF
This slide showcases RACI chart for managing finance department strategically. It provides details about financial planning, analysis manager, risk manager, finance director, finance team, project managers, etc. Here you can discover an assortment of the finest PowerPoint and Google Slides templates. With these templates, you can create presentations for a variety of purposes while simultaneously providing your audience with an eye-catching visual experience. Download RACI Chart For Strategic Financial Management Diagrams PDF to deliver an impeccable presentation. These templates will make your job of preparing presentations much quicker, yet still, maintain a high level of quality. Slidegeeks has experienced researchers who prepare these templates and write high-quality content for you. Later on, you can personalize the content by editing the RACI Chart For Strategic Financial Management Diagrams PDF.
Gantt Chart For Medical Consultancy Proposal Ppt Icon Designs PDF
Elucidate your project plan using our gantt chart for implementing primary health care ppt professional graphics design pdf. Capture the timeframe for every release by outlining crucial details like project beginning and end date, status, and assigned team. Establish coordination with other team members share your product plans, and discuss the project progress with the executives using this template. Furthermore, this task management chart helps you align your activities efficiently. Utilize the versatile nature of this template to initiate high-level resource planning and implement it flexibly for the benefit of your business. The slide is easy-to-edit so download it and schedule your projects resourcefully.

Monthly Content Calendar Roadmap With Gantt Chart Professional PDF
This slide covers a content calendar roadmap illustrating upcoming campaigns content. It also includes the progress chart to determine the current completion status of each enlisted activity. Introducing our Monthly Content Calendar Roadmap With Gantt Chart Professional PDF that is designed to showcase some of the vital components that will help you create timelines, roadmaps, and project plans. In addition, also communicate your project durations, milestones, tasks, subtasks, dependencies, and other attributes using this well structured Monthly Content Calendar Roadmap With Gantt Chart Professional PDF template. You can also exhibit preeminence against time by deploying this easily adaptable slide to your business presentation. Our experts have designed this template in such a way that it is sure to impress your audience. Thus, download it and steer your project meetings, meetups, and conferences.
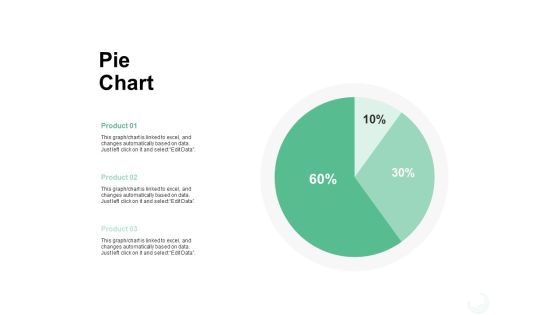
Pie Chart Analysis Ppt PowerPoint Presentation Styles Vector
Presenting this set of slides with name pie chart analysis ppt powerpoint presentation styles vector. The topics discussed in these slides are finance, marketing, management, investment, analysis. This is a completely editable PowerPoint presentation and is available for immediate download. Download now and impress your audience.

Area Chart Analysis Ppt PowerPoint Presentation Gallery Picture
Presenting this set of slides with name area chart analysis ppt powerpoint presentation gallery picture. The topics discussed in these slides are finance, marketing, management, investment, analysis. This is a completely editable PowerPoint presentation and is available for immediate download. Download now and impress your audience.

Combo Chart Analysis Ppt PowerPoint Presentation Infographic Template Infographics
Presenting this set of slides with name combo chart analysis ppt powerpoint presentation infographic template infographics. The topics discussed in these slides are finance, marketing, management, investment, analysis. This is a completely editable PowerPoint presentation and is available for immediate download. Download now and impress your audience.
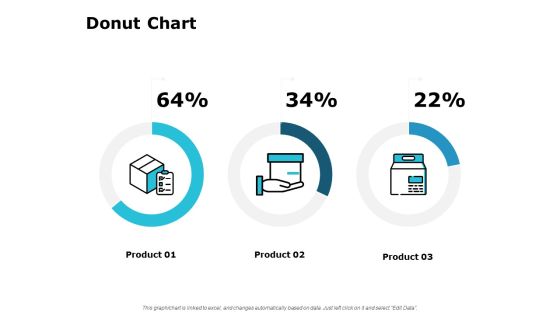
Donut Chart Analysis Ppt PowerPoint Presentation Professional Inspiration
Presenting this set of slides with name donut chart analysis ppt powerpoint presentation professional inspiration. The topics discussed in these slides are finance, marketing, management, investment, analysis. This is a completely editable PowerPoint presentation and is available for immediate download. Download now and impress your audience.

Donut Chart Finance Ppt PowerPoint Presentation Pictures Infographics
Presenting this set of slides with name donut chart finance ppt powerpoint presentation pictures infographics. The topics discussed in these slides are marketing, business, management, planning, strategy. This is a completely editable PowerPoint presentation and is available for immediate download. Download now and impress your audience.
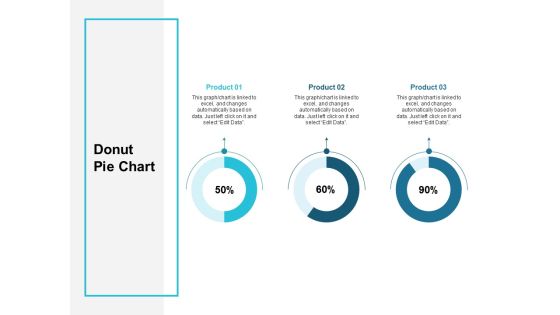
Donut Pie Chart Finance Ppt PowerPoint Presentation File Demonstration
Presenting this set of slides with name donut pie chart finance ppt powerpoint presentation file demonstration. The topics discussed in these slides are marketing, business, management, planning, strategy. This is a completely editable PowerPoint presentation and is available for immediate download. Download now and impress your audience.

Gantt Chart Finance Ppt PowerPoint Presentation Outline Elements
Presenting this set of slides with name gantt chart finance ppt powerpoint presentation outline elements. The topics discussed in these slides are business, planning, strategy, marketing, management. This is a completely editable PowerPoint presentation and is available for immediate download. Download now and impress your audience.

Horizontal Steps Involved Production Processs Fishbone Chart PowerPoint Templates
We present our horizontal steps involved production processs fishbone chart PowerPoint templates.Download and present our Arrows PowerPoint Templates because they are the stepping stones of our journey till date. Download our Shapes PowerPoint Templates because this business powerpoint template helps expound on the logic of your detailed thought process to take your company forward. Use our Business PowerPoint Templates because they highlight the depth of your thought process. Download our Boxes PowerPoint Templates because you can enlighten your skills with the help of our topical templates. Download and present our Communication PowerPoint Templates because the plans are in your head, stage by stage, year by year.Use these PowerPoint slides for presentations relating to abstract, arrow, blank, business, chart, circular, circulation, concept, conceptual, design, diagram, executive, flow, horizontal, icon, idea, illustration, management, model, numbers, organization, process, progression, resource, sequence, stages, steps, strategy. The prominent colors used in the PowerPoint template are Blue, Gray, Black. The feedback we get is that our horizontal steps involved production processs fishbone chart PowerPoint templates are Wonderful. PowerPoint presentation experts tell us our conceptual PowerPoint templates and PPT Slides are Fabulous. People tell us our horizontal steps involved production processs fishbone chart PowerPoint templates are visually appealing. Professionals tell us our concept PowerPoint templates and PPT Slides are Exuberant. You can be sure our horizontal steps involved production processs fishbone chart PowerPoint templates are Wonderful. We assure you our business PowerPoint templates and PPT Slides are Beautiful.

7 Arrows Diverging Representing Process Model Circular Chart PowerPoint Templates
We present our 7 arrows diverging representing process model Circular Chart PowerPoint templates.Use our Sale PowerPoint Templates because you can Highlight the key components of your entire manufacturing/ business process. Download our Arrows PowerPoint Templates because this template with an image of helps you chart the course of your presentation. Present our Process and Flows PowerPoint Templates because our creative template will lay down your views. Present our Business PowerPoint Templates because you too have got the framework of your companys growth in place. Download and present our Shapes PowerPoint Templates because your listeners do not have to put on their thinking caps.Use these PowerPoint slides for presentations relating to Abstract, Arrow, Art, Artistic, Background, Banner, Boost, Box, Business, Clip Art, Color, Colorful, Concept, Cover, Creative, Decide, Decision, Design, Direction, Finance, Futuristic, Graphic, Icon, Idea, Illustration, Increase, Info, Information, Journey, Label, Modern, Path, Pattern, Pop, Print, Process, Sale, Solution, Statistic, Sticker, Stylish, Template. The prominent colors used in the PowerPoint template are Blue, Gray, Black. PowerPoint presentation experts tell us our 7 arrows diverging representing process model Circular Chart PowerPoint templates are Radiant. People tell us our Background PowerPoint templates and PPT Slides are Upbeat. People tell us our 7 arrows diverging representing process model Circular Chart PowerPoint templates are Sparkling. Presenters tell us our Background PowerPoint templates and PPT Slides are Functional. Customers tell us our 7 arrows diverging representing process model Circular Chart PowerPoint templates are Delightful. The feedback we get is that our Boost PowerPoint templates and PPT Slides are Festive.

Strategic Management Gantt Chart Ppt Portfolio Outline PDF
Elucidate your project plan using our strategic management gantt chart ppt portfolio outline pdf. Capture the timeframe for every release by outlining crucial details like project beginning and end date, status, and assigned team. Establish coordination with other team members share your product plans, and discuss the project progress with the executives using this template. Furthermore, this task management chart helps you align your activities efficiently. Utilize the versatile nature of this template to initiate high-level resource planning and implement it flexibly for the benefit of your business. The slide is easy to edit so download it and schedule your projects resourcefully.

6 Stages Sequentially Described Strategic Planning Flow Chart PowerPoint Slides
We present our 6 stages sequentially described strategic planning flow chart PowerPoint Slides.Download and present our Arrows PowerPoint Templates because you can Refine them all as you take them through the numerous filtering stages of the funnel of your quality control process. Use our Business PowerPoint Templates because project your ideas to you colleagues and complete the full picture. Use our Competition PowerPoint Templates because it shows various choices to be made. Present our Design PowerPoint Templates because Our PowerPoint Templates and Slides will Embellish your thoughts. They will help you illustrate the brilliance of your ideas. Use our Shapes PowerPoint Templates because Our PowerPoint Templates and Slides offer you the needful to organise your thoughts. Use them to list out your views in a logical sequence.Use these PowerPoint slides for presentations relating to arrow, arrows, block, business, chart, design, development, diagram, direction, element, flow, flowchart, graph, linear, management, organization, process, program, section, sign, solution, symbol. The prominent colors used in the PowerPoint template are Green, Gray, Black. Professionals tell us our 6 stages sequentially described strategic planning flow chart PowerPoint Slides are Romantic. The feedback we get is that our business PowerPoint templates and PPT Slides are Festive. We assure you our 6 stages sequentially described strategic planning flow chart PowerPoint Slides are Attractive. Customers tell us our chart PowerPoint templates and PPT Slides will make you look like a winner. Presenters tell us our 6 stages sequentially described strategic planning flow chart PowerPoint Slides are Fun. People tell us our business PowerPoint templates and PPT Slides are topically designed to provide an attractive backdrop to any subject.

Inventory Management Costs Planning Chart Ppt Portfolio Background Image PDF
Introducing our inventory management costs planning chart ppt portfolio background image pdf set of slides. The topics discussed in these slides are inventory carrying costs, business logistics, costs. This is an immediately available PowerPoint presentation that can be conveniently customized. Download it and convince your audience.

Cost Benefit Analysis Chart Ppt PowerPoint Presentation Summary Graphics Example
Presenting this set of slides with name cost benefit analysis chart ppt powerpoint presentation summary graphics example. The topics discussed in these slides are increase salary, operating cost, loss of sales and salary, gross profit increase, reduced costs. This is a completely editable PowerPoint presentation and is available for immediate download. Download now and impress your audience.

Cost Benefit Analysis Chart Ppt PowerPoint Presentation Gallery File Formats
Presenting this set of slides with name cost benefit analysis chart ppt powerpoint presentation gallery file formats. The topics discussed in these slides are operating cost, loss sales and salary, gross profit increase, reduced costs. This is a completely editable PowerPoint presentation and is available for immediate download. Download now and impress your audience.

Cost Benefit Analysis Chart Ppt PowerPoint Presentation Portfolio Aids
Presenting this set of slides with name cost benefit analysis chart ppt powerpoint presentation portfolio aids. The topics discussed in these slides are increase salary, operating cost, loss sales and salary, benefits, gross profit increase. This is a completely editable PowerPoint presentation and is available for immediate download. Download now and impress your audience.

Cost Benefit Analysis Chart Ppt PowerPoint Presentation Gallery Example Introduction
Presenting this set of slides with name cost benefit analysis chart ppt powerpoint presentation gallery example introduction. The topics discussed in these slides are increase salary, operating cost, loss sales and salary, benefits, gross profit increase. This is a completely editable PowerPoint presentation and is available for immediate download. Download now and impress your audience.

Cost Benefit Analysis Chart Ppt PowerPoint Presentation File Backgrounds
Presenting this set of slides with name cost benefit analysis chart ppt powerpoint presentation file backgrounds. The topics discussed in these slides are increase salary, operating cost, loss sales and salary, benefits, gross profit increase. This is a completely editable PowerPoint presentation and is available for immediate download. Download now and impress your audience.
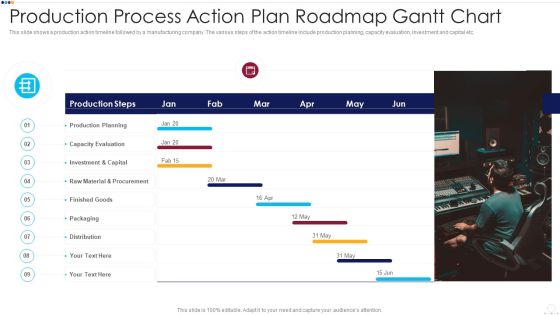
Production Process Action Plan Roadmap Gantt Chart Professional PDF
This slide shows a production action timeline followed by a manufacturing company. The various steps of the action timeline include production planning, capacity evaluation, investment and capital etc. Presenting production process action plan roadmap gantt chart professional pdf to provide visual cues and insights. Share and navigate important information on nine stages that need your due attention. This template can be used to pitch topics like production process action plan roadmap gantt chart. In addtion, this PPT design contains high resolution images, graphics, etc, that are easily editable and available for immediate download.
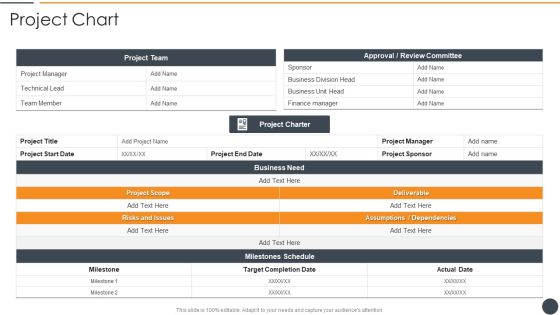
Effective Initiation Of Information Technology Project Project Chart Introduction PDF
Deliver and pitch your topic in the best possible manner with this effective initiation of information technology project project chart introduction pdf. Use them to share invaluable insights on project team, business need, milestones schedule, target completion and impress your audience. This template can be altered and modified as per your expectations. So, grab it now.

Role Resource Allocation Chart For Project Management Formats PDF
This slide showcase the project job allocation sheet. It covers roles such as project architect, interior designer, landscape architect, etc., to ensure relevant project tasks have been assigned to members. Showcasing this set of slides titled Role Resource Allocation Chart For Project Management Formats PDF. The topics addressed in these templates are Information, Material, Project Architect. All the content presented in this PPT design is completely editable. Download it and make adjustments in color, background, font etc. as per your unique business setting.

In Business PowerPoint Presentations Process Circular Chart Slides
We present our in business powerpoint presentations process Circular Chart Slides.Present our Arrows PowerPoint Templates because it demonstrates to your audience how the best and most refined ideas pass through. Download and present our Business PowerPoint Templates because it helps you to explain your plans in all earnest to your colleagues and raise the bar for all. Present our Signs PowerPoint Templates because support groups are an essential element of the on going struggle against cancer. Download and present our Shapes PowerPoint Templates because this slide represents the tools of the trade. Use our Spheres PowerPoint Templates because honesty is the best policy has an ardent follower in you.Use these PowerPoint slides for presentations relating to Arrows, Business, Chart, Circular, Commerce, Concept, Contribution, Cycle, Development, Diagram, Global, Idea, Informative, Internet, Join, Making, Manage, Management, Market, Marketing, Partner, Paying, Performance, Plans, Process, Productive, Productivity, Profit, Profitable, Project. The prominent colors used in the PowerPoint template are Green, Black, Gray. Professionals tell us our in business powerpoint presentations process Circular Chart Slides are Zippy. You can be sure our Chart PowerPoint templates and PPT Slides are Attractive. Customers tell us our in business powerpoint presentations process Circular Chart Slides will help you be quick off the draw. Just enter your specific text and see your points hit home. Professionals tell us our Circular PowerPoint templates and PPT Slides are Classic. People tell us our in business powerpoint presentations process Circular Chart Slides will generate and maintain the level of interest you desire. They will create the impression you want to imprint on your audience. People tell us our Cycle PowerPoint templates and PPT Slides are Nostalgic.

Packaged Food Firm Description Organization Chart Topics PDF
The slide highlights the organizational hierarchy chart for company. It depicts board of directors, chairman, chief executing officer, president, chief operating officer, chief of research and development,, chief of operations, chief of finance, chief of corporate compliance and chief of human resource.This is a Packaged Food Firm Description Organization Chart Topics PDF template with various stages. Focus and dispense information on six stages using this creative set, that comes with editable features. It contains large content boxes to add your information on topics like Asia Accounts, Average Rating, Key Insights. You can also showcase facts, figures, and other relevant content using this PPT layout. Grab it now.

Business Diagram Examples PowerPoint Presentations Process Chart Templates
We present our business diagram examples powerpoint presentations process chart templates.Download our Advertising PowerPoint Templates because you can Adorn them with your ideas and thoughts. Download our Business PowerPoint Templates because maximising sales of your product is the intended destination. Use our Marketing PowerPoint Templates because The marketplace is the merger of your dreams and your ability. Download our Finance PowerPoint Templates because you have a handle on all the targets, a master of the game, the experienced and consummate juggler. Present our Shapes PowerPoint Templates because this is Aesthetically designed to make a great first impression this template highlights .Use these PowerPoint slides for presentations relating to Analysis, Business, Concept, Design, Diagram, Direction, Goals, Guide, Icon, Idea, Management, Model, Opportunity, Organization, Performance, Plan, Process, Project, Representation, Resource, Strategy, Swot. The prominent colors used in the PowerPoint template are Blue, Black, Gray. PowerPoint presentation experts tell us our business diagram examples powerpoint presentations process chart templates are Efficacious. Professionals tell us our Diagram PowerPoint templates and PPT Slides are Endearing. People tell us our business diagram examples powerpoint presentations process chart templates provide great value for your money. Be assured of finding the best projection to highlight your words. We assure you our Diagram PowerPoint templates and PPT Slides are Attractive. PowerPoint presentation experts tell us our business diagram examples powerpoint presentations process chart templates are Graceful. Professionals tell us our Direction PowerPoint templates and PPT Slides are Splendid.

Line Chart Analysis Ppt PowerPoint Presentation Inspiration Files
Presenting this set of slides with name line chart analysis ppt powerpoint presentation inspiration files. The topics discussed in these slides are finance, marketing, management, investment, analysis. This is a completely editable PowerPoint presentation and is available for immediate download. Download now and impress your audience.
SIPOC Action Plan Chart For Fast Food Restaurant Sample PDF
This slide consists of a supplier, input, process, output, and customer action plan chart that can be implemented by restaurant staff in order to streamline processes. Key elements include supplier, input, process, output, and customer. Presenting SIPOC Action Plan Chart For Fast Food Restaurant Sample PDF to dispense important information. This template comprises five stages. It also presents valuable insights into the topics including Resources Required, Resource Providers, Customer. This is a completely customizable PowerPoint theme that can be put to use immediately. So, download it and address the topic impactfully.
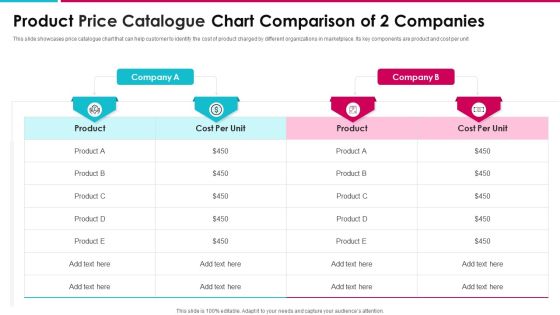
Product Price Catalogue Chart Comparison Of 2 Companies Elements PDF
This slide showcases price catalogue chart that can help customer to identify the cost of product charged by different organizations in marketplace. Its key components are product and cost per unit Showcasing this set of slides titled product price catalogue chart comparison of 2 companies elements pdf. The topics addressed in these templates are product, cost per unit, company. All the content presented in this PPT design is completely editable. Download it and make adjustments in color, background, font etc. as per your unique business setting.
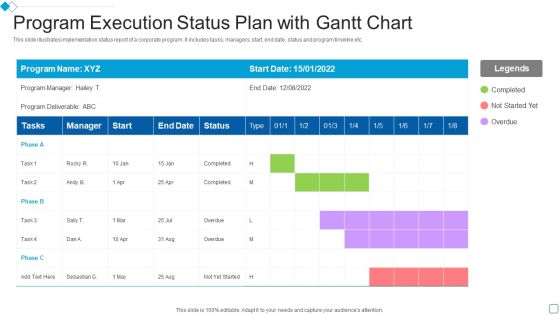
Program Execution Status Plan With Gantt Chart Designs PDF
Introducing our Program Execution Status Plan With Gantt Chart Designs PDF that is designed to showcase some of the vital components that will help you create timelines, roadmaps, and project plans. In addition, also communicate your project durations, milestones, tasks, subtasks, dependencies, and other attributes using this well structured Program Execution Status Plan With Gantt Chart Designs PDF template. You can also exhibit preeminence against time by deploying this easily adaptable slide to your business presentation. Our experts have designed this template in such a way that it is sure to impress your audience. Thus, download it and steer your project meetings, meetups, and conferences

7 Step Workflow Chart For Software Deployment Introduction PDF
This slide consists of a seven step flow chart for deployment of a software program. The elements covered in the slide are software requirements analysis, resource planning, software maintenance and updates, designing and prototyping etc. Persuade your audience using this 7 Step Workflow Chart For Software Deployment Introduction PDF. This PPT design covers Seven stages, thus making it a great tool to use. It also caters to a variety of topics including Software Requirements Analysis, Resource Planning, Designing And Prototyping. Download this PPT design now to present a convincing pitch that not only emphasizes the topic but also showcases your presentation skills.
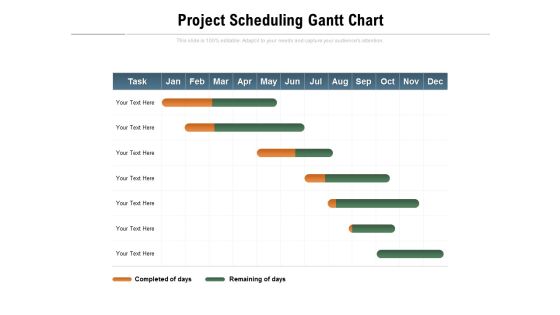
Project Scheduling Gantt Chart Ppt PowerPoint Presentation Professional Master Slide
Presenting this set of slides with name project scheduling gantt chart ppt powerpoint presentation professional master slide. The topics discussed in these slides are completed days, remaining days. This is a completely editable PowerPoint presentation and is available for immediate download. Download now and impress your audience.
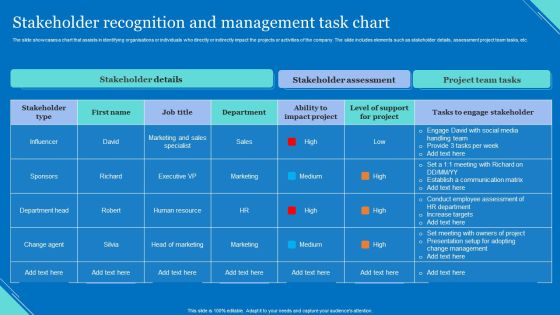
Stakeholder Recognition And Management Task Chart Clipart PDF
The slide showcases a chart that assists in identifying organisations or individuals who directly or indirectly impact the projects or activities of the company. The slide includes elements such as stakeholder details, assessment project team tasks, etc. Showcasing this set of slides titled Stakeholder Recognition And Management Task Chart Clipart PDF. The topics addressed in these templates are Stakeholder Details, Stakeholder Assessment, Project Team Tasks. All the content presented in this PPT design is completely editable. Download it and make adjustments in color, background, font etc. as per your unique business setting.

3d Illustration Of Three Steps Planning Flow Chart PowerPoint Templates
We present our 3d illustration of three steps planning flow chart PowerPoint templates.Download and present our Arrows PowerPoint Templates because it shows you the vision of a desired destination and the best road to take to reach that goal. Download our Business PowerPoint Templates because it helps you to project your enthusiasm and single mindedness to your colleagues. Download and present our Shapes PowerPoint Templates because getting it done in time is the key to success. Use our Leadership PowerPoint Templates because there are various viable propositions available to further your commercial interests. Use our Marketing PowerPoint Templates because customer satisfaction is a mantra of the marketplace. Building a loyal client base is an essential element of your business.Use these PowerPoint slides for presentations relating to Abstract, Arrow, Arrows, Business, Chart, Design, Development, Diagram, Direction, Element, Flow, Flowchart, Graph, Linear, Management, Model, Motion, Organization, Plan, Process, Program, Section, Segment, Set, Sign, Solution, Strategy, Symbol, Technology. The prominent colors used in the PowerPoint template are Yellow, Green, Blue. Customers tell us our 3d illustration of three steps planning flow chart PowerPoint templates are Dazzling. The feedback we get is that our Arrows PowerPoint templates and PPT Slides are Striking. Professionals tell us our 3d illustration of three steps planning flow chart PowerPoint templates are designed to make your presentations professional. People tell us our Development PowerPoint templates and PPT Slides are designed by a team of presentation professionals. Customers tell us our 3d illustration of three steps planning flow chart PowerPoint templates are Handsome. Professionals tell us our Chart PowerPoint templates and PPT Slides are Radiant.
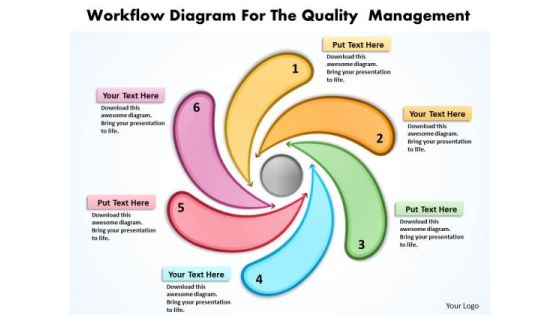
Workflow Diagram For The Quality Management Radial Chart PowerPoint Templates
We present our workflow diagram for the quality management Radial Chart PowerPoint templates.Present our Marketing PowerPoint Templates because Our PowerPoint Templates and Slides will let Your superior ideas hit the target always and everytime. Download and present our Business PowerPoint Templates because infrastructure growth is an obvious requirement of today.inform your group on how exactly this potential is tailor made for you. Download our Shapes PowerPoint Templates because you should Demonstrate how you think out of the box. Use our Finance PowerPoint Templates because you can see clearly through to the bigger bowl ahead. Time your jump to perfection and hit the nail on the head. Use our Symbol PowerPoint Templates because you can see In any endeavour people matter most.Use these PowerPoint slides for presentations relating to Arrow, Art, Business, Chart, Design, Development, Diagram, Flow, Flowchart, Graphic, Gray, Idea, Info, Management, Method, Model, Process, Quality, Rainbow, Research, Sign, Software, Strategy, Success, System, Template, Text, Vector, Work. The prominent colors used in the PowerPoint template are Red, Blue, Yellow. We assure you our workflow diagram for the quality management Radial Chart PowerPoint templates are incredible easy to use. Customers tell us our Flow PowerPoint templates and PPT Slides will make the presenter successul in his career/life. The feedback we get is that our workflow diagram for the quality management Radial Chart PowerPoint templates effectively help you save your valuable time. We assure you our Chart PowerPoint templates and PPT Slides are Splendid. People tell us our workflow diagram for the quality management Radial Chart PowerPoint templates are Classic. We assure you our Diagram PowerPoint templates and PPT Slides are Fabulous.
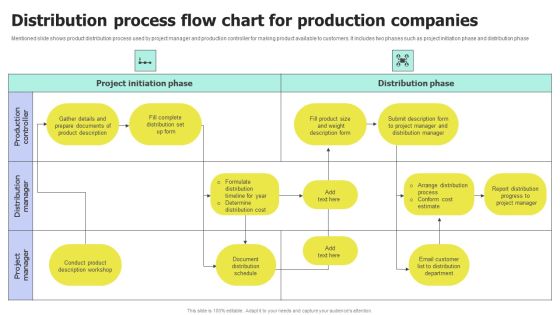
Distribution Process Flow Chart For Production Companies Portrait PDF
Mentioned slide shows product distribution process used by project manager and production controller for making product available to customers. It includes two phases such as project initiation phase and distribution phase. Showcasing this set of slides titled Distribution Process Flow Chart for Production Companies Portrait PDF. The topics addressed in these templates are Process Flow Chart, Production Companies. All the content presented in this PPT design is completely editable. Download it and make adjustments in color, background, font etc. as per your unique business setting.

Enterprise Development Training Plan Chart With Target Employee Structure PDF
The following slide highlights the corporate development training chart for employees to upskill and reskill their skillset. It constitutes of elements such as target department, employee title and the number of people etc. Persuade your audience using this Enterprise Development Training Plan Chart With Target Employee Structure PDF. This PPT design covers three stages, thus making it a great tool to use. It also caters to a variety of topics including Department, Finance, Marketing And Sales. Download this PPT design now to present a convincing pitch that not only emphasizes the topic but also showcases your presentation skills.
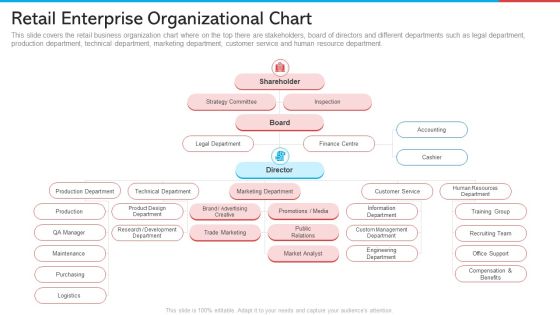
Retail Enterprise Organizational Chart Retail Marketing Demonstration PDF
This slide covers the retail business organization chart where on the top there are stakeholders, board of directors and different departments such as legal department, production department, technical department, marketing department, customer service and human resource department. Deliver an awe inspiring pitch with this creative retail enterprise organizational chart retail marketing demonstration pdf bundle. Topics like marketing department, trade marketing, development, strategy committee, accounting can be discussed with this completely editable template. It is available for immediate download depending on the needs and requirements of the user.

Cross Functional Hr And Accounting Procedure Flow Chart Sample PDF
This slide consists of a diagrammatical representation of cross functional flow chart which provides insights about the human resource and accounting process. The elements are closed payroll cycle, enter new employee information, enter correct information, verify, send for review etc. Showcasing this set of slides titled Cross Functional Hr And Accounting Procedure Flow Chart Sample PDF. The topics addressed in these templates are Correct Information, Employee Information, Overtime Approval. All the content presented in this PPT design is completely editable. Download it and make adjustments in color, background, font etc. as per your unique business setting.

Business Framework Pyramid Diagram Hierarchy Map Org Chart PowerPoint Presentation
This business diagram displays framework of pyramid diagram hierarchy map chart. It contains graphic of hierarchy map as a organizational chart. This slide displays concept of organizational and business hierarchy. Use this diagram for your business and management related presentations.

Flow Chart Depicting Working Of Product Development Strategy Sample PDF
This slide showcases a flow chart depicting a product development strategy that assists in turning a concept into a product. It also includes stages such as analyzing current market, identifying potential new markets, getting new ideas, etc. Showcasing this set of slides titled Flow Chart Depicting Working Of Product Development Strategy Sample PDF. The topics addressed in these templates are Existing Market, Profitability, Production Cost. All the content presented in this PPT design is completely editable. Download it and make adjustments in color, background, font etc. as per your unique business setting.

Responsibility Chart For Project Scope Management Strategy Information PDF
Presenting Responsibility Chart For Project Scope Management Strategy Information PDF to dispense important information. This template comprises one stage. It also presents valuable insights into the topics including Responsibilities, Determining Project, Acceptance Of Project. This is a completely customizable PowerPoint theme that can be put to use immediately. So, download it and address the topic impactfully.

Horizontal Steps Involved Production Processs Flowchart Fishbone Chart PowerPoint Templates
We present our horizontal steps involved production processs flowchart fishbone chart PowerPoint templates.Download our Arrows PowerPoint Templates because the gears of youthful minds are useful, therefore set them in motion. Download and present our Shapes PowerPoint Templates because this is Aesthetically designed to make a great first impression this template highlights . Download our Business PowerPoint Templates because you can Flutter your wings and enchant the world. Impress them with the innate attractiveness of your thoughts and words. Download and present our Boxes PowerPoint Templates because you will be able to Highlight the various ways in which we can maintain its efficiency. Present our Communication PowerPoint Templates because if making a mark is your obsession, then let others get Obsessed with you.Use these PowerPoint slides for presentations relating to abstract, arrow, blank, business, chart, circular, circulation, concept, conceptual, design, diagram, executive, flow, horizontal, icon, idea, illustration, management, model, numbers, organization, process, progression, resource, sequence, stages, steps, strategy. The prominent colors used in the PowerPoint template are Blue, Gray, Black. The feedback we get is that our horizontal steps involved production processs flowchart fishbone chart PowerPoint templates are Tasteful. PowerPoint presentation experts tell us our business PowerPoint templates and PPT Slides are Second to none. People tell us our horizontal steps involved production processs flowchart fishbone chart PowerPoint templates are Fun. Professionals tell us our blank PowerPoint templates and PPT Slides are Tasteful. You can be sure our horizontal steps involved production processs flowchart fishbone chart PowerPoint templates are specially created by a professional team with vast experience. They diligently strive to come up with the right vehicle for your brilliant Ideas. We assure you our chart PowerPoint templates and PPT Slides are Reminiscent.
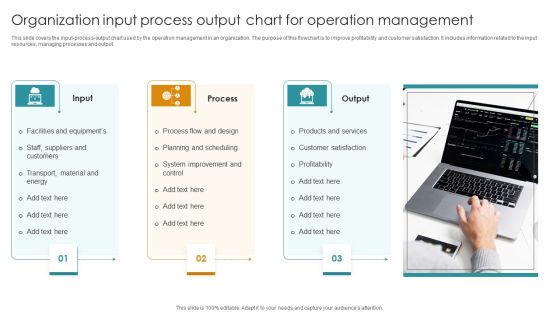
Organization Input Process Output Chart For Operation Management Designs PDF
This slide covers the input-process-output chart used by the operation management in an organization. The purpose of this flowchart is to improve profitability and customer satisfaction. It includes information related to the input resources, managing processes and output. Presenting Organization Input Process Output Chart For Operation Management Designs PDF to dispense important information. This template comprises Three stages. It also presents valuable insights into the topics including Process Flow And Design, Products And Services Transport, Material And Energy. This is a completely customizable PowerPoint theme that can be put to use immediately. So, download it and address the topic impactfully.

Input Process Output Chart Analysis In Recruitment Process Sample PDF
This slide covers the IPO chart analysis used in recruitment process by the human resource department. The purpose of this table is improve the hiring process of an organization. It includes information related to the input, process, output and HR. Showcasing this set of slides titled Input Process Output Chart Analysis In Recruitment Process Sample PDF. The topics addressed in these templates are Business Leaders, Manager, Recruiter, Agency. All the content presented in this PPT design is completely editable. Download it and make adjustments in color, background, font etc. as per your unique business setting.
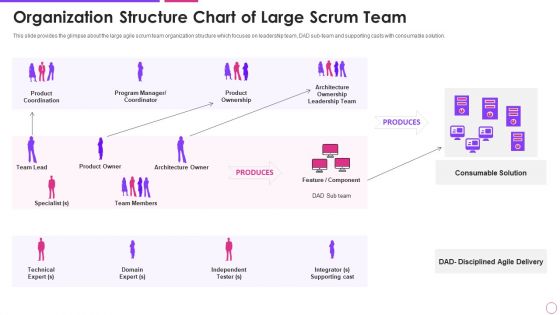
Organization Structure Chart Agile Project Management Framework Introduction PDF
Deliver an awe inspiring pitch with this creative organization structure chart agile project management framework introduction pdf bundle. Topics like product coordination, product ownership, team, consumable solution can be discussed with this completely editable template. It is available for immediate download depending on the needs and requirements of the user.

Website Development Project Biyearly Gantt Chart Icons PDF
Persuade your audience using this Website Development Project Biyearly Gantt Chart Icons PDF. This PPT design covers one stages, thus making it a great tool to use. It also caters to a variety of topics including Development, Design, Layout. Download this PPT design now to present a convincing pitch that not only emphasizes the topic but also showcases your presentation skills.

Biyearly Gantt Chart For Project Analysis And Evaluation Structure PDF
Showcasing this set of slides titled Biyearly Gantt Chart For Project Analysis And Evaluation Structure PDF. The topics addressed in these templates are Project Planning, Project Design, Project Implementation. All the content presented in this PPT design is completely editable. Download it and make adjustments in color, background, font etc. as per your unique business setting.

Project Monthly Gantt Bar Chart With Priority Inspiration PDF
Showcasing this set of slides titled Project Monthly Gantt Bar Chart With Priority Inspiration PDF. The topics addressed in these templates are Project Conception And Initiation, Project Definition And Planning, Project Launch Of Execution. All the content presented in this PPT design is completely editable. Download it and make adjustments in color, background, font etc. as per your unique business setting.
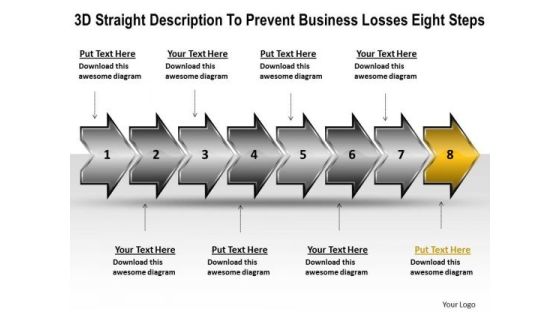
Business PowerPoint Presentation Losses Eight Steps Flow Chart Slides
We present our business powerpoint presentation losses eight steps flow chart Slides.Download our Finance PowerPoint Templates because they represent the proress in our lives. Download our Business PowerPoint Templates because watch the excitement levels rise as they realise their worth. Download our Process and Flows PowerPoint Templates because it demonstrates to your audience how the best and most refined ideas pass through. Present our Arrows PowerPoint Templates because you can Educate your listeners on the means to keep it ticking over. Present our Shapes PowerPoint Templates because this diagram depicts the essence of this chain reaction like sequence of events.Use these PowerPoint slides for presentations relating to 3d, Abstract, Around, Arrows, Business, Center, Circle, Circular, Concept, Connections, Curve, Cycle, Directions, Distribution, Illustration, Management, Middle, Objects, Plan, Process, Recycle, Rounded, Shadows, Space, System. The prominent colors used in the PowerPoint template are Yellow, Gray, Black. People tell us our business powerpoint presentation losses eight steps flow chart Slides provide great value for your money. Be assured of finding the best projection to highlight your words. PowerPoint presentation experts tell us our Circle PowerPoint templates and PPT Slides are Lush. Presenters tell us our business powerpoint presentation losses eight steps flow chart Slides are Nifty. The feedback we get is that our Circle PowerPoint templates and PPT Slides are Multicolored. You can be sure our business powerpoint presentation losses eight steps flow chart Slides are Romantic. Professionals tell us our Center PowerPoint templates and PPT Slides are Elegant.

 Home
Home