Budget Chart
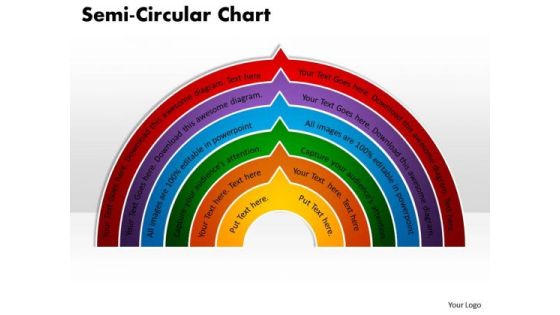
Marketing Diagram Semi Circular Chart PowerPoint Slides And Sales Diagram
Delight Them With Our Marketing Diagram Semi Circular Chart PowerPoint Slides And Sales Diagram Powerpoint Templates. Your Audience Will Be Ecstatic. Our Marketing Diagram Semi Circular Chart PowerPoint Slides And Sales Diagram Powerpoint Templates Are Created Cost Effective. They Understand The Need For Economy.

Reach Your Target Audience Pie Chart Ppt Show Model PDF
This is a reach your target audience pie chart ppt show model pdf template with various stages. Focus and dispense information on four stages using this creative set, that comes with editable features. It contains large content boxes to add your information on topics like pie chart. You can also showcase facts, figures, and other relevant content using this PPT layout. Grab it now.
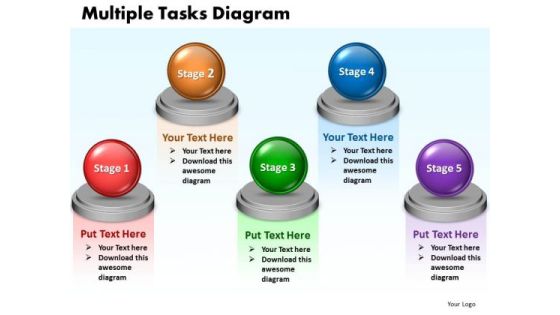
Ppt Multiple Tasks Chart 5 Stages PowerPoint Templates 2003
PPT multiple tasks chart 5 stages powerpoint templates 2003 0812-This diagram will help you to organize information, organize and run effective meetings, and generate useful member contributions.-PPT multiple tasks chart 5 stages powerpoint templates 2003 0812-3d, Abstract, Backgrounds, Ball, Business, Choice, Comparison, Concept, Descriptive, Equilibrium, Grow, Illustrations, Instrument, Measurement, Metallic, Part, Partnership, Pattern, Progress, Reflections, Scales, Several, Sphere, Strategy, Success
Variables Correlation Scatter Chart Ppt PowerPoint Presentation Model Smartart PDF
Presenting variables correlation scatter chart ppt powerpoint presentation model smartart pdf to dispense important information. This template comprises three stages. It also presents valuable insights into the topics including variables correlation scatter chart. This is a completely customizable PowerPoint theme that can be put to use immediately. So, download it and address the topic impactfully.

Business Objective Presentation Chart Of Provenance Data Download PDF
Presenting business objective presentation chart of provenance data download pdf to dispense important information. This template comprises five stages. It also presents valuable insights into the topics including business objective presentation chart of provenance data. This is a completely customizable PowerPoint theme that can be put to use immediately. So, download it and address the topic impactfully.

Statistical Data Analysis Chart Of Collected Data Formats PDF
Presenting statistical data analysis chart of collected data formats pdf to dispense important information. This template comprises four stages. It also presents valuable insights into the topics including statistical data analysis chart of collected data. This is a completely customizable PowerPoint theme that can be put to use immediately. So, download it and address the topic impactfully.

Risk Mitigation Chart Ppt PowerPoint Presentation Background Designs
Presenting this set of slides with name risk mitigation chart ppt powerpoint presentation background designs. The topics discussed in these slides are risk mitigation chart, insufficient, resources, success, performance. This is a completely editable PowerPoint presentation and is available for immediate download. Download now and impress your audience.

Gantt Chart Timeline Ppt PowerPoint Presentation Slides Structure
Presenting this set of slides with name gantt chart timeline ppt powerpoint presentation slides structure. The topics discussed in these slides are gantt chart timeline, project schedule. This is a completely editable PowerPoint presentation and is available for immediate download. Download now and impress your audience.

Quality Cost Report Trend Chart Ppt PowerPoint Presentation Pictures Themes
This is a quality cost report trend chart ppt powerpoint presentation pictures themes. This is a four stage process. The stages in this process are finance, strategy, marketing, management, business.
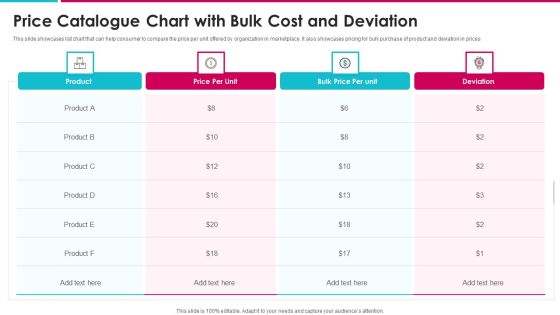
Price Catalogue Chart With Bulk Cost And Deviation Background PDF
This slide showcases list chart that can help consumer to compare the price per unit offered by organization in marketplace. It also showcases pricing for bulk purchase of product and deviation in prices Showcasing this set of slides titled price catalogue chart with bulk cost and deviation background pdf. The topics addressed in these templates are price catalogue chart with bulk cost and deviation. All the content presented in this PPT design is completely editable. Download it and make adjustments in color, background, font etc. as per your unique business setting.
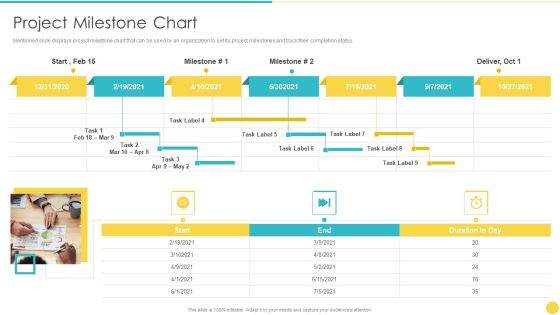
Project Management Professional Toolset IT Project Milestone Chart Download PDF
Mentioned slide displays project milestone chart that can be used by an organization to set its project milestones and track their completion status. This is a project management professional toolset it project milestone chart download pdf template with various stages. Focus and dispense information on one stages using this creative set, that comes with editable features. It contains large content boxes to add your information on topics like project milestone chart. You can also showcase facts, figures, and other relevant content using this PPT layout. Grab it now.
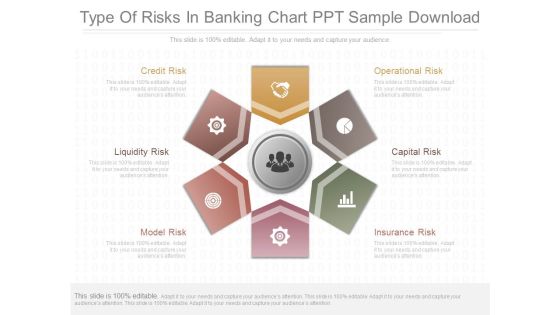
Type Of Risks In Banking Chart Ppt Sample Download
This is a type of risks in banking chart ppt sample download. This is a six stage process. The stages in this process are credit risk, liquidity risk, model risk, operational risk, capital risk, insurance risk.

Truck Succession Plan Chart With Estimated Cost Pictures PDF
This slide displays the replacement planning of trucks in an organisation for better transportation facilities and smooth functioning. It also includes the various types of vehicles with their building year , expected replacement and next replacement year and estimated cost incurred during this process. Pitch your topic with ease and precision using this Truck Succession Plan Chart With Estimated Cost Pictures PDF. This layout presents information on Cost, Truck, Chart. It is also available for immediate download and adjustment. So, changes can be made in the color, design, graphics or any other component to create a unique layout.
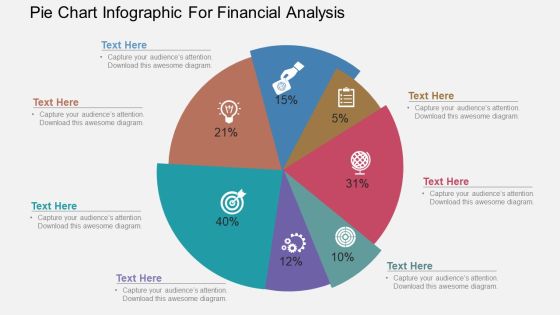
Pie Chart Infographic For Financial Analysis Powerpoint Template
Our above PowerPoint template has been designed with pie chart infographic. This slide is suitable to present financial analysis. Use this business diagram to present your work in a more smart and precise manner.
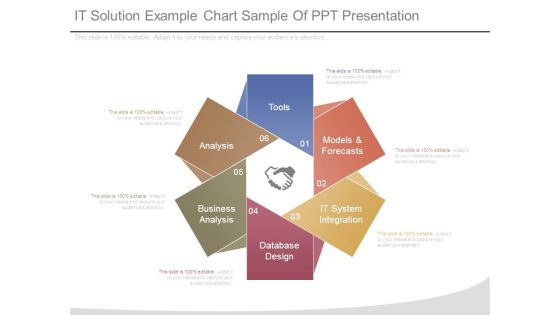
It Solution Example Chart Sample Of Ppt Presentation
This is a it solution example chart sample of ppt presentation. This is a six stage process. The stages in this process are tools, models and forecasts, it system integration, database design, business analysis, analysis.

Yearly Price List Data Comparison Chart Structure PDF
This slide showcases price catalogue chart that can help in comparing the cost of product in different financial years and calculate the price hiked by organization. It also outlines percentage change in prices Showcasing this set of slides titled yearly price list data comparison chart structure pdf. The topics addressed in these templates are yearly price list data comparison chart. All the content presented in this PPT design is completely editable. Download it and make adjustments in color, background, font etc. as per your unique business setting.

Scatter Bubble Chart Graph Ppt PowerPoint Presentation Infographic Template Maker
This is a scatter bubble chart graph ppt powerpoint presentation infographic template maker. This is a two stage process. The stages in this process are finance, marketing, management, investment, analysis.

Combo Chart Graph Ppt PowerPoint Presentation Infographic Template Layout Ideas
This is a combo chart graph ppt powerpoint presentation infographic template layout ideas. This is a three stage process. The stages in this process are finance, marketing, analysis, investment, million.

Quarterly Resource Management Allocation Plan Chart Ppt Summary Visuals PDF
This slide illustrates task and resource allocation chart of a corporation. It includes department namely administration, accounts, IT, etc. Pitch your topic with ease and precision using this Quarterly Resource Management Allocation Plan Chart Ppt Summary Visuals PDF. This layout presents information on Quarter, Year, Accounts. It is also available for immediate download and adjustment. So, changes can be made in the color, design, graphics or any other component to create a unique layout.
Human Resource Management Responsibilities Icon With Hierarchy Chart Guidelines PDF
Persuade your audience using this Human Resource Management Responsibilities Icon With Hierarchy Chart Guidelines PDF This PPT design covers four stages, thus making it a great tool to use. It also caters to a variety of topics including Human Resource Management Responsibilities Icon With Hierarchy Chart Download this PPT design now to present a convincing pitch that not only emphasizes the topic but also showcases your presentation skills.

Sustainable Resource Recovery Blueprint Process Through Flow Chart Inspiration PDF
This template shows the flow chart of the recycling process. The includes the stages such as product evaluation, monitor, ecological assessment, etc. Pitch your topic with ease and precision using this Sustainable Resource Recovery Blueprint Process Through Flow Chart Inspiration PDF. This layout presents information on Procurement, Manufacturing, Suppliers. It is also available for immediate download and adjustment. So, changes can be made in the color, design, graphics or any other component to create a unique layout.

Donut Pie Chart Product Finance Ppt PowerPoint Presentation Diagram Ppt
This is a donut pie chart product finance ppt powerpoint presentation diagram ppt. This is a three stage process. The stages in this process are finance, management, strategy, analysis, marketing.
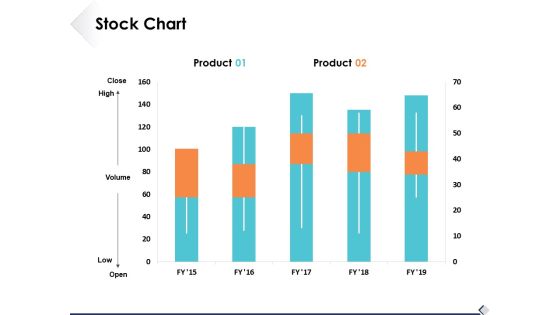
Stock Chart Finance Ppt PowerPoint Presentation Styles Background Image
This is a stock chart finance ppt powerpoint presentation styles background image. This is a two stage process. The stages in this process are analysis, marketing, icons, finance, strategy.
Hexagonal Chart With Finance And Communication Icons Powerpoint Template
Our above slide contains hexagonal chart with finance and communication icons. This PowerPoint template helps to display communication steps. Use this diagram to impart more clarity to data and to create more sound impact on viewers.
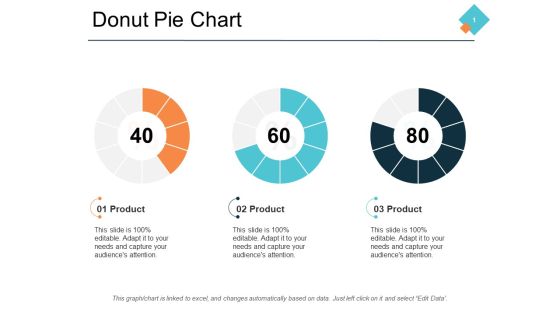
Donut Pie Chart Finance Ppt PowerPoint Presentation Portfolio Model
This is a donut pie chart finance ppt powerpoint presentation portfolio model. This is a three stage process. The stages in this process are finance, management, strategy, analysis, marketing.

Combo Chart Marketing Analysis Ppt Powerpoint Presentation Pictures Icons
This is a combo chart marketing analysis ppt powerpoint presentation pictures icons. This is a three stage process. The stages in this process are finance, marketing, management, investment, analysis.

Flow Chart Plan For Client Project Communication Download PDF
This slide presents a flow chart plan that can be used by managers for streamlining project communication among customers. Major elements include monthly status reports, monthly analytics, weekly analytics, etc. Presenting Flow Chart Plan For Client Project Communication Download PDF to dispense important information. This template comprises one stages. It also presents valuable insights into the topics including Flow Chart Plan, Client Project Communication. This is a completely customizable PowerPoint theme that can be put to use immediately. So, download it and address the topic impactfully.
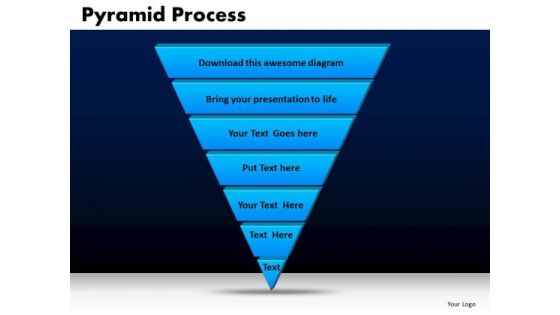
Business Triangles PowerPoint Templates Chart Pyramid Process Ppt Slides
Business Triangles PowerPoint Templates Chart Pyramid Process PPT Slides-A Pyramid Diagram may be defined as representation of data in the form of a triangle separated by horizontal lines. The widest section may contain the general topic while the narrowest section may contain a much more specific topic. -Business Triangles PowerPoint Templates Chart Pyramid Process PPT Slides-This template can be used for presentations relating to 3d, Bar, Business, Chart, Class, Conceptual, Corner, FInance, Graph, Graphic, Hierarchy, Investment, Layer, Level, Performance, Planner, Priority, Progress, Pyramid, Render, Status, Strategy, System, Triangle
Mutual Fund Operation Flow Chart Diagram Ppt Icon
This is a mutual fund operation flow chart diagram ppt icon. This is a four stage process. The stages in this process are return, securities, investors, fund, mutual fund operation.

Pie Chart Finance Ppt PowerPoint Presentation Styles Graphics Template
This is a pie chart finance ppt powerpoint presentation styles graphics template. This is a three stage process. The stages in this process are financial, minimum, medium, maximum, marketing.

Scatter Bubble Chart Finance Ppt Powerpoint Presentation Layouts Summary
This is a scatter bubble chart finance ppt powerpoint presentation layouts summary. This is a two stage process. The stages in this process are financial, minimum, maximum, marketing, strategy.

Combo Chart Finance Ppt PowerPoint Presentation Styles Background Image
This is a combo chart finance ppt powerpoint presentation styles background image. The topics discussed in this diagram are marketing, business, management, planning, strategy This is a completely editable PowerPoint presentation, and is available for immediate download

Area Chart Finance Ppt PowerPoint Presentation File Slide
This is a area chart finance ppt powerpoint presentation file slide. The topics discussed in this diagram are marketing, business, management, planning, strategy This is a completely editable PowerPoint presentation, and is available for immediate download.

Column Chart Finance Ppt PowerPoint Presentation Show Background
This is a column chart finance ppt powerpoint presentation show background. The topics discussed in this diagram are marketing, business, management, planning, strategy This is a completely editable PowerPoint presentation, and is available for immediate download.

Donut Pie Chart Ppt PowerPoint Presentation Ideas Design Templates
This is a donut pie chart ppt powerpoint presentation ideas design templates. This is a four stage process. The stages in this process are analysis finance, investment, business, planning, marketing.

Basic Gap Analysis Chart Ppt PowerPoint Presentation Pictures Design Ideas
This is a basic gap analysis chart ppt powerpoint presentation pictures design ideas. This is a five stage process. The stages in this process are business, finance, marketing, analysis, investment.

Scatter Bubble Chart Ppt PowerPoint Presentation Inspiration Graphics Tutorials
This is a scatter bubble chart ppt powerpoint presentation inspiration graphics tutorials. This is a two stage process. The stages in this process are finance, marketing, management, investment, analysis.
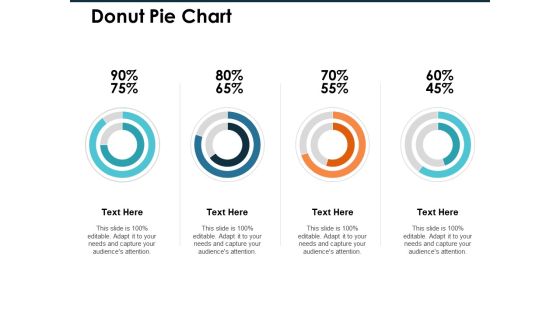
Donut Pie Chart Ppt PowerPoint Presentation Infographic Template Professional
This is a donut pie chart ppt powerpoint presentation infographic template professional. This is a four stage process. The stages in this process are finance, marketing, management, investment, analysis.

Area Chart Ppt PowerPoint Presentation Infographic Template Clipart Images
This is a area chart ppt powerpoint presentation infographic template clipart images. This is a two stage process. The stages in this process are finance, marketing, management, investment, analysis.

Volume High Low Close Chart Ppt PowerPoint Presentation Pictures Objects
This is a volume high low close chart ppt powerpoint presentation pictures objects. This is a one stage process. The stages in this process are finance, marketing, management, investment, analysis.

Volume High Low Close Chart Ppt Powerpoint Presentation Slides Images
This is a volume high low close chart ppt powerpoint presentation slides images. This is a five stage process. The stages in this process are finance, marketing, management, investment, analysis.
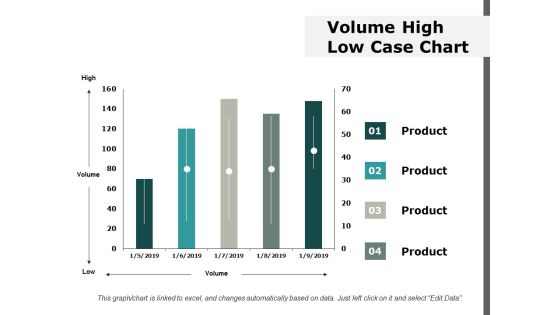
Volume High Low Case Chart Ppt Powerpoint Presentation Ideas Information
This is a volume high low case chart ppt powerpoint presentation ideas information. This is a four stage process. The stages in this process are finance, marketing, management, investment, analysis.

Scatter Chart Analysis Marketing Ppt Powerpoint Presentation Summary Infographic Template
This is a scatter chart analysis marketing ppt powerpoint presentation summary infographic template. This is a two stage process. The stages in this process are finance, marketing, management, investment, analysis.

Stacked Column Chart Analysis Ppt PowerPoint Presentation Slides Graphics Design
This is a stacked column chart analysis ppt powerpoint presentation slides graphics design. This is a three stage process. The stages in this process are finance, marketing, management, investment, analysis.

Bar Chart Business Management Ppt PowerPoint Presentation Ideas Example Introduction
This is a bar chart business management ppt powerpoint presentation ideas example introduction. This is a three stage process. The stages in this process are finance, marketing, management, investment, analysis.

Column Chart And Graph Ppt PowerPoint Presentation File Introduction
This is a column chart and graph ppt powerpoint presentation file introduction. This is a three stage process. The stages in this process are finance, marketing, management, investment, analysis.

Combo Chart Marketing Ppt Powerpoint Presentation Ideas Format Ideas Cpb
This is a combo chart marketing ppt powerpoint presentation ideas format ideas cpb. This is a three stage process. The stages in this process are finance, marketing, management, investment, analysis.
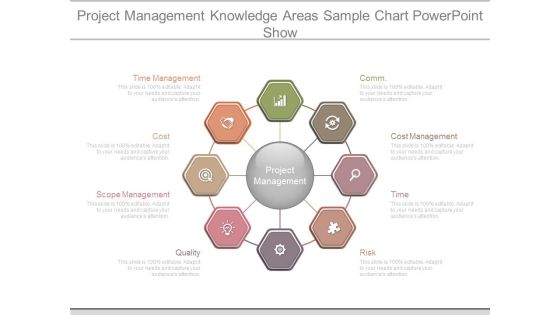
Project Management Knowledge Areas Sample Chart Powerpoint Show
This is a project management knowledge areas sample chart powerpoint show. This is a eight stage process. The stages in this process are comm, cost management, time, risk, quality, scope management, cost, time management, project management.

Cycle Chart Of Mutual Funds Sample Diagram Ppt Images
This is a cycle chart of mutual funds sample diagram ppt images. This is a five stage process. The stages in this process are reinvestment, returns, investors, fund manager, financial securities.

Cash Flow From Operations Chart Ppt Sample Presentations
This is a cash flow from operations chart ppt sample presentations. This is a six stage process. The stages in this process are uses of cash, operating activities, sources of cash, financing activities, investing activities, change in cash balance.

Donut Pie Chart Graph Ppt PowerPoint Presentation File Styles
This is a donut pie chart graph ppt powerpoint presentation file styles. This is a three stage process. The stages in this process are finance, marketing, management, investment, analysis.

Donut Pie Chart Graph Ppt PowerPoint Presentation Ideas Guidelines
This is a donut pie chart graph ppt powerpoint presentation ideas guidelines. This is a three stage process. The stages in this process are finance, marketing, management, investment, analysis.

Combo Chart Graph Ppt PowerPoint Presentation Gallery Designs Download
This is a combo chart graph ppt powerpoint presentation gallery designs download. This is a three stage process. The stages in this process are finance, marketing, analysis, investment, million.
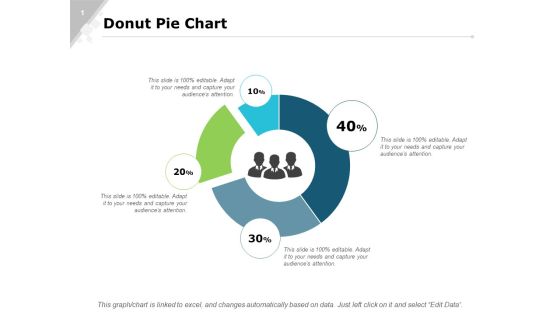
Donut Pie Chart Bar Ppt PowerPoint Presentation Infographics Slide Portrait
This is a donut pie chart bar ppt powerpoint presentation infographics slide portrait. This is a four stage process. The stages in this process are finance, marketing, analysis, investment, million.

Area Chart Graph Ppt PowerPoint Presentation Professional Format Ideas
This is a column chart graph ppt powerpoint presentation slides file formats. This is a stage three process. The stages in this process are finance, marketing, analysis, investment, million.

Column Chart Marketing Management Ppt PowerPoint Presentation Professional Images
This is a column chart marketing management ppt powerpoint presentation professional images. This is a three stage process. The stages in this process are finance, marketing, management, investment, analysis.
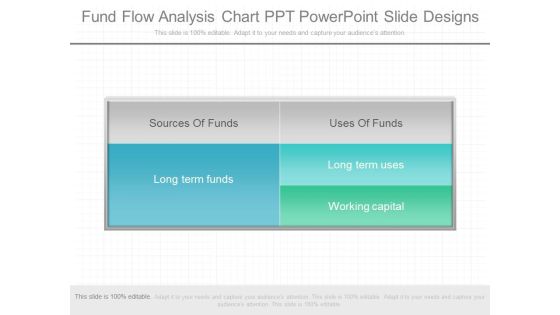
Fund Flow Analysis Chart Ppt Powerpoint Slide Designs
This is a fund flow analysis chart ppt powerpoint slide designs. This is a five stage process. The stages in this process are sources of funds, long term funds, uses of funds, long term uses, working capital.

Project Gantt Chart Showing Design Blueprint Rules PDF
Design a highly optimized project management report using this well-researched project gantt chart showing design blueprint rules pdf. This layout can be used to present the professional details of a task or activity. Showcase the activities allocated to the business executives with this Gantt Chart PowerPoint theme. List down the column tasks in various timeframes and allocate time for each. In addition, also monitor the actual time and make comparisons to interpret the final progress using this innovative Gantt Chart Template. Showcase the work breakdown structure to attract your audience. Download and share it using Google Slides, if it suits your requirement.

PMP Toolkit Project Milestone Chart Ppt Layouts Templates PDF
Mentioned slide displays project milestone chart that can be used by an organization to set its project milestones and track their completion status. This is a pmp toolkit project milestone chart ppt layouts templates pdf template with various stages. Focus and dispense information on one stages using this creative set, that comes with editable features. It contains large content boxes to add your information on topics like project milestone chart. You can also showcase facts, figures, and other relevant content using this PPT layout. Grab it now.

Business Plan For Funding Chart Ppt Slides Examples
This is a business plan for funding chart ppt slides examples. This is a five stage process. The stages in this process are saving, credit, donations, subsidies, grants, taxes.

Cost Benefit Analysis Chart Ppt PowerPoint Presentation Slides Example File
This is a cost benefit analysis chart ppt powerpoint presentation slides example file. This is a two stage process. The stages in this process are increase salary, cost benefit, reduced costs, analysis, operating cost.

Cost Benefit Analysis Chart Ppt PowerPoint Presentation Ideas Shapes
This is a cost benefit analysis chart ppt powerpoint presentation ideas shapes. This is a two stage process. The stages in this process are reduced costs, operating cost, benefits, costs, increase salary.

Cost Benefit Analysis Chart With Icons Powerpoint Layout
This is a cost benefit analysis chart with icons powerpoint layout. This is a two stage process. The stages in this process are balance scale, compare, business, marketing, management.
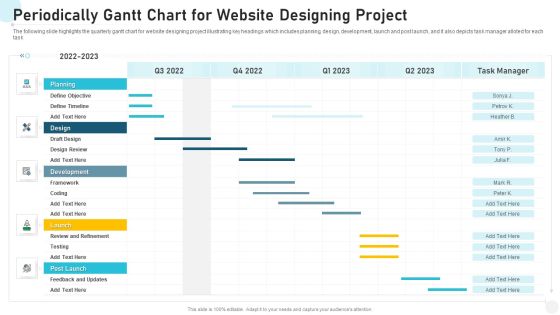
Periodically Gantt Chart For Website Designing Project Portrait PDF
The following slide highlights the quarterly gantt chart for website designing project illustrating key headings which includes planning, design, development, launch and post launch, and it also depicts task manager alloted for each task Showcasing this set of slides titled periodically gantt chart for website designing project portrait pdf. The topics addressed in these templates are periodically gantt chart for website designing project. All the content presented in this PPT design is completely editable. Download it and make adjustments in color, background, font etc. as per your unique business setting.

Quality Cost Report Trend Chart Ppt PowerPoint Presentation Portfolio Maker
This is a quality cost report trend chart ppt powerpoint presentation portfolio maker. This is a two stage process. The stages in this process are compare, marketing, business, strategy, planning.
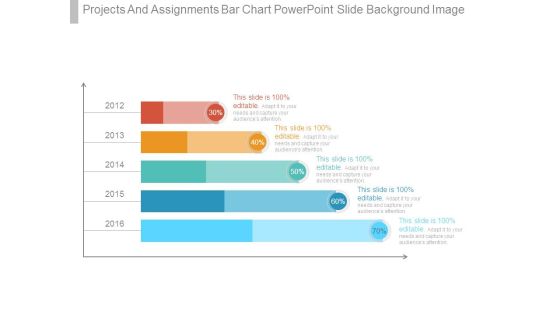
Projects And Assignments Bar Chart Powerpoint Slide Background Image
This is a projects and assignments bar chart powerpoint slide background image. This is a five stage process. The stages in this process are finance, presentation, business, strategy, marketing.

Feasibility Analysis Template Different Projects Hospital Organizational Chart Download PDF
This slide provides the glimpse of the hospital organizational chart that is required to built a solid foundation and recruit qualified professionals. Presenting feasibility analysis template different projects hospital organizational chart download pdf to provide visual cues and insights. Share and navigate important information on one stages that need your due attention. This template can be used to pitch topics like hospital organizational chart. In addtion, this PPT design contains high resolution images, graphics, etc, that are easily editable and available for immediate download.
Project Charter Linear Chart With Icons Powerpoint Slide Background
This is a project charter linear chart with icons powerpoint slide background. This is a five stage process. The stages in this process are resources team roles, project milestone, project scope, problem statement goal statement, business case.

PowerPoint Template Business Process Chart Editable Ppt Design Slides
PowerPoint Template Business Process Chart Editable PPT Design Slides-The Circle of Life - a concept emmbedded in our minds and hence easy to comprehend. Life and Business is made up of processes comprising stages that flow from one to another. An excellent graphic to attract the attention of and understanding by your audience to improve earnings-PowerPoint Template Business Process Chart Editable PPT Design Slides-This ppt can be used for presentations relating to-Arrow, Bond, Business, Button, Buying, Career, Change, Chart, Children, Circle, College, Death, Diagram, Education, Financial, Future, Graphic, House, Illustration, Investing, Investment, Marriage, Menu, Personal, Plan, Process
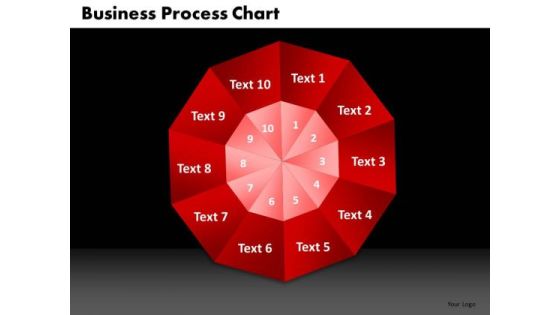
PowerPoint Templates Process Chart Business Ppt Design Slides
PowerPoint Templates Process Chart Business PPT Design Slides-The Circle of Life - a concept emmbedded in our minds and hence easy to comprehend. Life and Business is made up of processes comprising stages that flow from one to another. An excellent graphic to attract the attention of and understanding by your audience to improve earnings-PowerPoint Templates Process Chart Business PPT Design Slides-This ppt can be used for presentations relating to-Arrow, Bond, Business, Button, Buying, Career, Change, Chart, Children, Circle, College, Death, Diagram, Education, Financial, Future, Graphic, House, Illustration, Investing, Investment, Marriage, Menu, Personal, Plan, Process
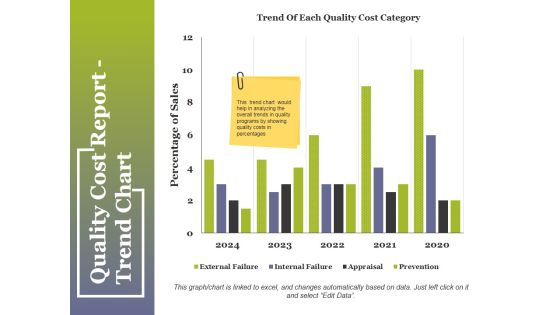
Quality Cost Report Trend Chart Ppt PowerPoint Presentation Summary Pictures
This is a quality cost report trend chart ppt powerpoint presentation summary pictures. This is a two stage process. The stages in this process are compare, business, table, marketing, strategy.

Audit Process Workflow Chart For Finance Management Summary PDF
This template consists of a flowchart which depicts audit process to be followed by brand managers for finance management. Key elements include initiate audit process, prepare for auditing, develop audit plan, assign work to auditors etc.
Project Management Gantt Chart Ppt PowerPoint Presentation Icon Example
This is a project management gantt chart ppt powerpoint presentation icon example. This is a ten stage process. The stages in this process are lists, table, data, management, marketing.
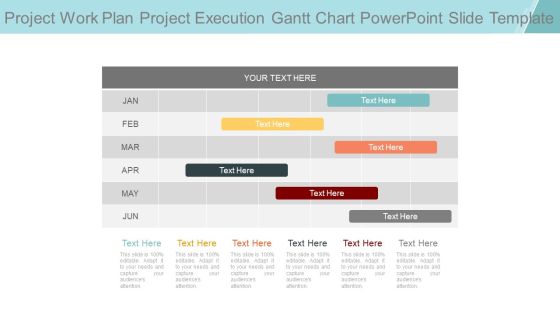
Project Work Plan Project Execution Gantt Chart Powerpoint Slide Template
This is a project work plan project execution gantt chart powerpoint slide template. This is a six stage process. The stages in this process are jan, feb, mar, apr, may, jun.

Collaboration Funding Proposal Gantt Chart One Pager Sample Example Document
Presenting you an exemplary Collaboration Funding Proposal Gantt Chart One Pager Sample Example Document. Our one-pager comprises all the must-have essentials of an inclusive document. You can edit it with ease, as its layout is completely editable. With such freedom, you can tweak its design and other elements to your requirements. Download this Collaboration Funding Proposal Gantt Chart One Pager Sample Example Document brilliant piece now.

Cost Curve Chart Ppt PowerPoint Presentation Portfolio Pictures Cpb Pdf
Presenting this set of slides with name cost curve chart ppt powerpoint presentation portfolio pictures cpb pdf. This is an editable Powerpoint four stages graphic that deals with topics like cost curve chart to help convey your message better graphically. This product is a premium product available for immediate download and is 100 percent editable in Powerpoint. Download this now and use it in your presentations to impress your audience.
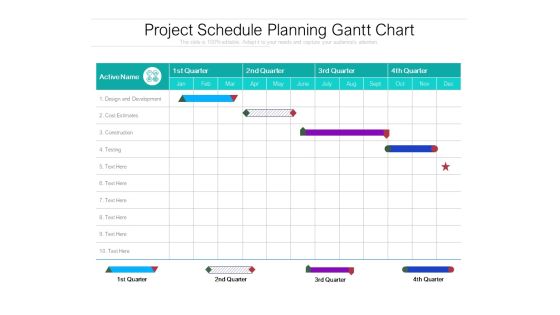
Project Schedule Planning Gantt Chart Ppt PowerPoint Presentation Pictures Guide
Make a highly optimized project management report using this content-ready Gantt Chart PPT Diagram. Effortless yet very clear, this layout proves a useful tool to present the professional details of a task or activity. Showcase the activities and allotted time to the business executives with this Gantt Chart PowerPoint theme. List down the column tasks in various timeframes and the activities associated with each of them here. Further, plot time allocation for various tasks, monitor their actual time and make comparisons to interpret the final progress with this well-structured Gantt Chart Excel Template. You can add all the significant details of a particular project in this chart and showcase it to all the project members so that they can participate in the overall development. Not only this but also our PPT template can help you showcase the work breakdown structure of your project.

Dollar Chart Business PowerPoint Background And Template 1210
Microsoft PowerPoint Template and Background with abstract 3d illustration of dollar symbol charts and red arrow
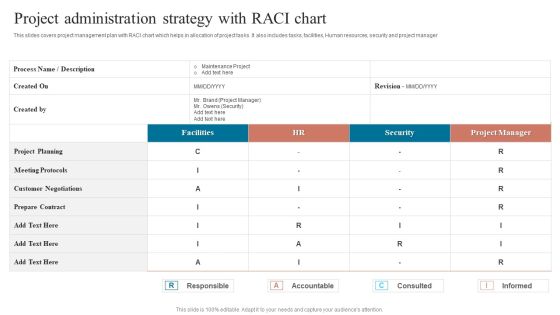
Project Administration Strategy With Raci Chart Rules PDF
This slides covers project management plan with RACI chart which helps in allocation of project tasks. It also includes tasks, facilities, Human resources, security and project manager. Showcasing this set of slides titled Project Administration Strategy With Raci Chart Rules PDF. The topics addressed in these templates are Meeting Protocols, Customer Negotiations, Meeting Protocols. All the content presented in this PPT design is completely editable. Download it and make adjustments in color, background, font etc. as per your unique business setting.

Salesman Principles Playbook Different Products Price Comparison Chart Slides PDF
This slide provides information regarding product price comparison chart that captures information about price per unit, change over list price, reason for proposed price, volumes sold, forecasted growth. Deliver an awe inspiring pitch with this creative salesman principles playbook different products price comparison chart slides pdf bundle. Topics like weekly updates meets, monthly review meetings, quarterly review meetings can be discussed with this completely editable template. It is available for immediate download depending on the needs and requirements of the user.
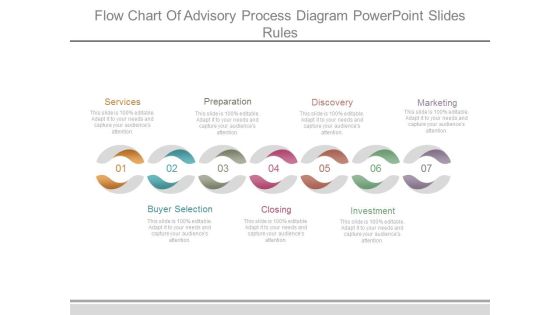
Flow Chart Of Advisory Process Diagram Powerpoint Slides Rules
This is a flow chart of advisory process diagram powerpoint slides rules. This is a seven stage process. The stages in this process are services, buyer selection, preparation, closing, discovery, investment, marketing.

Financial Planning Steps Infographic Chart Ppt Samples Download
This is a financial planning steps infographic chart ppt samples download. This is a five stage process. The stages in this process are investments, retirement, estate planning, risk management, cash flow.
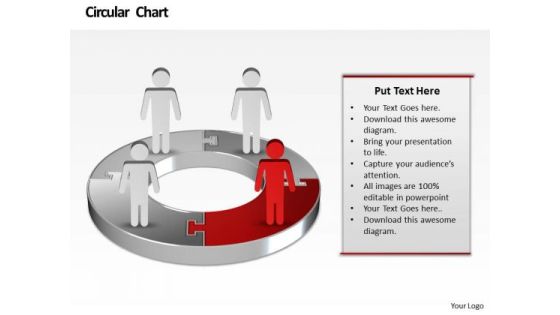
Ppt Illustration Of Financial Pie Chart Marketing Presentation PowerPoint Templates
PPT illustration of financial pie chart marketing presentation powerpoint Templates-You have the people in place, selected the team leaders and all are raring to go. You have the plans ready for them to absorb and understand. Educate your team with your thoughts and logic. -PPT illustration of financial pie chart marketing presentation powerpoint Templates-Abstract, Access, Arrow, Background, Business, Chart, Circle, Concept, Conceptual, Connection, Corporate, Creative, Cycle, Design, Different, Element, Empty, Form, Frame, Graphic, Group, Idea, Illustration, Part, Piece, Place, Process, Red, Shapes, Solution, Special, Speech, Strategy, Symbol
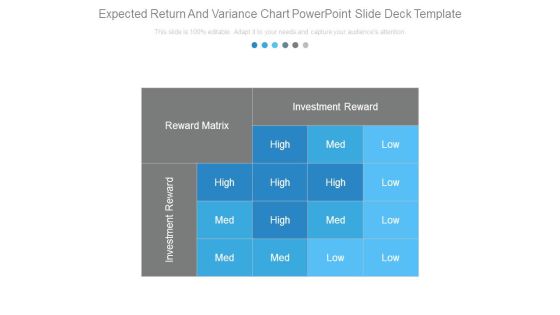
Expected Return And Variance Chart Powerpoint Slide Deck Template
This is a expected return and variance chart powerpoint slide deck template. This is a one stage process. The stages in this process are investment reward, reward matrix, high, med, low.
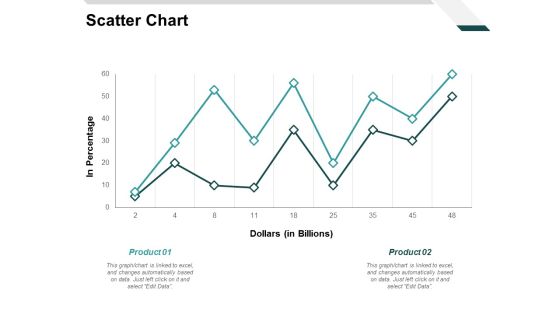
Scatter Chart Investment Ppt PowerPoint Presentation Portfolio Gallery
Presenting this set of slides with name scatter chart investment ppt powerpoint presentation portfolio gallery. The topics discussed in these slides are finance, marketing, management, investment, analysis. This is a completely editable PowerPoint presentation and is available for immediate download. Download now and impress your audience.
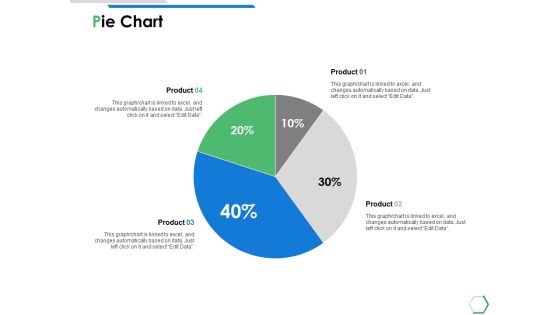
Pie Chart Investment Ppt PowerPoint Presentation Inspiration Graphics
Presenting this set of slides with name pie chart investment ppt powerpoint presentation inspiration graphics. The topics discussed in these slides are finance, marketing, management, investment, analysis. This is a completely editable PowerPoint presentation and is available for immediate download. Download now and impress your audience.
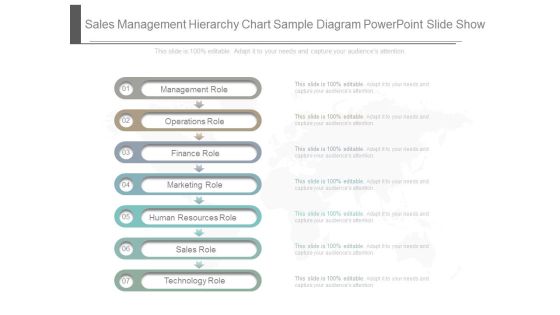
Sales Management Hierarchy Chart Sample Diagram Powerpoint Slide Show
This is a sales management hierarchy chart sample diagram powerpoint slide show. This is a seven stage process. The stages in this process are management role, operations role, finance role, marketing role, human resources role, sales role, technology role.
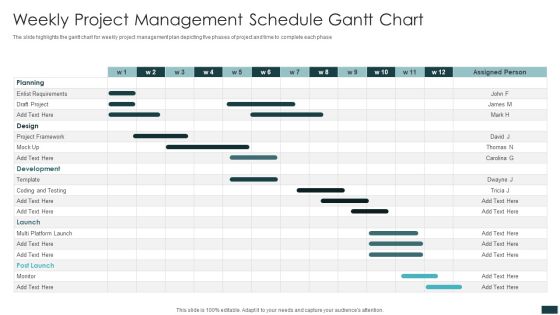
Weekly Project Management Schedule Gantt Chart Information PDF
The slide highlights the gantt chart for weekly project management plan depicting five phases of project and time to complete each phase. Pitch your topic with ease and precision using this Weekly Project Management Schedule Gantt Chart Information PDF. This layout presents information on Project Framework, Design, Planning. It is also available for immediate download and adjustment. So, changes can be made in the color, design, graphics or any other component to create a unique layout.

Weekly Project Schedule Progress Tracking Gantt Chart Infographics PDF
The slide highlights the weekly project plan progress tracking Gantt chart depicting development phase, testing phase and launch phase. Showcasing this set of slides titled Weekly Project Schedule Progress Tracking Gantt Chart Infographics PDF. The topics addressed in these templates are Development, Increased Demand, Increased Anticipation. All the content presented in this PPT design is completely editable. Download it and make adjustments in color, background, font etc. as per your unique business setting.

Work Flow Chart Of An Online Transaction Payment Inspiration PDF
The following slide shows the task flow chart of transaction payment. It includes information about recipient details, amount of money to be sent, confirming and sending the amount. Presenting Work Flow Chart Of An Online Transaction Payment Inspiration PDF to dispense important information. This template comprises one stages. It also presents valuable insights into the topics including Work Flow Chart, Online Transaction Payment. This is a completely customizable PowerPoint theme that can be put to use immediately. So, download it and address the topic impactfully.

Chart For Cash Flow In Mutual Investment Ideas PDF
Presenting chart for cash flow in mutual investment ideas pdf to dispense important information. This template comprises four stages. It also presents valuable insights into the topics including investors, mutual fund, fund manager. This is a completely customizable PowerPoint theme that can be put to use immediately. So, download it and address the topic impactfully.
Project Management Gantt Chart Ppt PowerPoint Presentation Icon Images
This is a project management gantt chart ppt powerpoint presentation icon images. The topics discussed in this diagram are business, management, marketing, compare. This is a completely editable PowerPoint presentation, and is available for immediate download.

International Market Segmentation Sample Flow Chart Powerpoint Layout
This is a international market segmentation sample flow chart powerpoint layout. This is a six stage process. The stages in this process are geographic, cultural, the firm, economic, industrial markets, political legal.

IT Software Web Development Gantt Chart Topics PDF
This slide presents a Gantt chart highlighting various phases of website design plan to help project managers deliver the project on time. It includes phases such as project definition, content, design, development and review. Pitch your topic with ease and precision using this IT Software Web Development Gantt Chart Topics PDF. This layout presents information on Chart, Software, Development. It is also available for immediate download and adjustment. So, changes can be made in the color, design, graphics or any other component to create a unique layout.
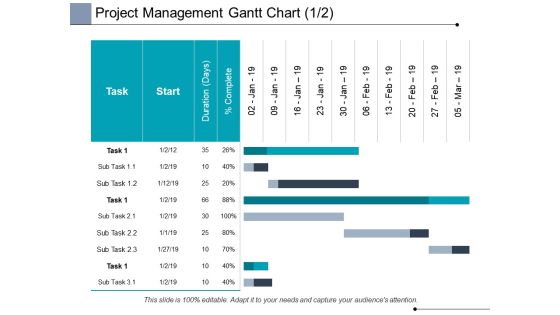
Project Management Gantt Chart Planning Ppt PowerPoint Presentation Visuals
This is a project management gantt chart planning ppt powerpoint presentation visuals. This is a three stage process. The stages in this process are business, planning, strategy, marketing, management.
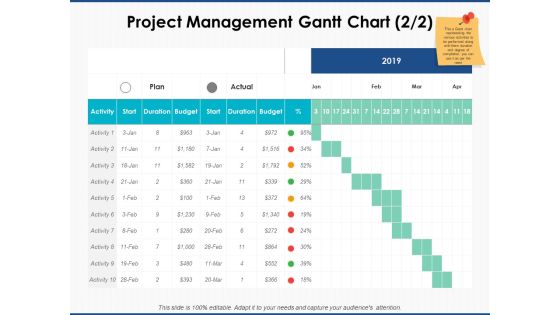
Project Management Gantt Chart Business Ppt PowerPoint Presentation Portfolio Show
This is a project management gantt chart business ppt powerpoint presentation portfolio show. The topics discussed in this diagram are marketing, business, management, planning, strategy This is a completely editable PowerPoint presentation, and is available for immediate download.
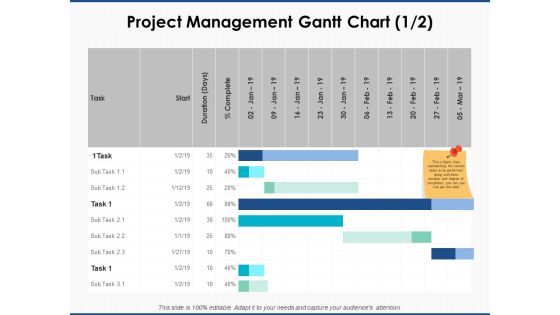
Project Management Gantt Chart Marketing Ppt PowerPoint Presentation Professional Ideas
This is a project management gantt chart marketing ppt powerpoint presentation professional ideas. The topics discussed in this diagram are marketing, business, management, planning, strategy This is a completely editable PowerPoint presentation, and is available for immediate download.

Chart Of Careers In Finance Ppt Sample Presentations
This is a chart of careers in finance ppt sample presentations. This is a ten stage process. The stages in this process are investment banking, fund management, trading, insurance, actuarial, compliance and risk, corporate law, management consultancy, accountancy and tax, retail banking, finance careers.

Project Timeline Chart Ppt PowerPoint Presentation Portfolio Gridlines
This is a project timeline chart ppt powerpoint presentation portfolio gridlines. This is a nine stage process. The stages in this process are description, process, project step, table, business.

Process Flow Chart Project Execution Analysis Ppt Ideas
This is a process flow chart project execution analysis ppt ideas. This is a six stage process. The stages in this process are functional design, testing, test plan, user requirements, implementation, commissioning and start up.
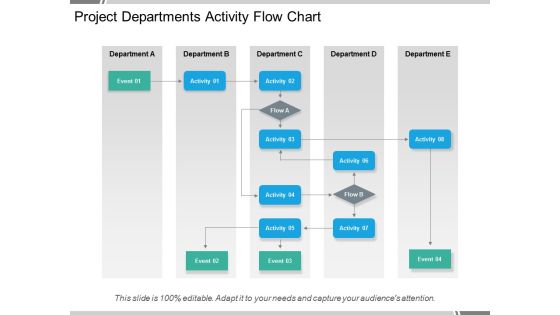
Project Departments Activity Flow Chart Ppt PowerPoint Presentation Pictures Show
This is a project departments activity flow chart ppt powerpoint presentation pictures show. This is a five stage process. The stages in this process are operational excellence, operational plan, operational process.
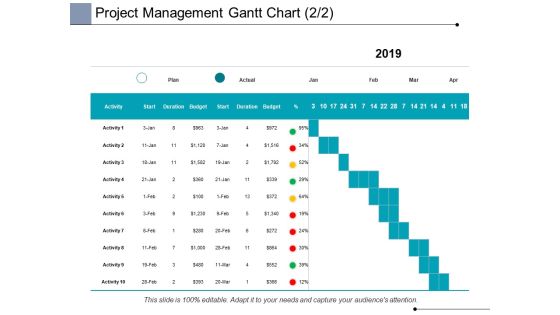
Project Management Gantt Chart Business Ppt PowerPoint Presentation Portfolio
This is a project management gantt chart business ppt powerpoint presentation portfolio. This is a four stage process. The stages in this process are business, planning, strategy, marketing, management.

Project Management Gantt Chart Marketing Ppt PowerPoint Presentation Styles Files
This is a project management gantt chart marketing ppt powerpoint presentation styles files. This is a two stage process. The stages in this process are business, planning, strategy, marketing, management.

Project Management Gantt Chart Ppt PowerPoint Presentation Show Gridlines
This is a project management gantt chart ppt powerpoint presentation show gridlines. This is a two stage process. The stages in this process are business, planning, strategy, marketing, management.
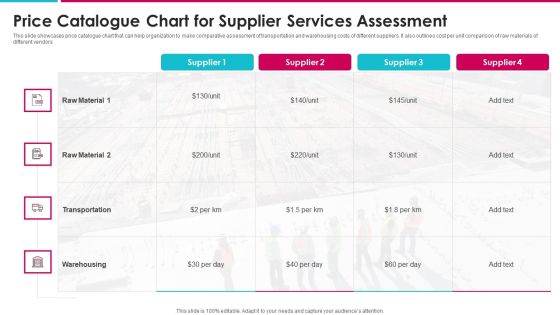
Price Catalogue Chart For Supplier Services Assessment Inspiration PDF
This slide showcases price catalogue chart that can help organization to make comparative assessment of transportation and warehousing costs of different suppliers. It also outlines cost per unit comparison of raw materials of Showcasing this set of slides titled price catalogue chart for supplier services assessment inspiration pdf. The topics addressed in these templates are price catalogue chart for supplier services assessment. All the content presented in this PPT design is completely editable. Download it and make adjustments in color, background, font etc. as per your unique business setting.

Project Management Gantt Chart Marketing Ppt PowerPoint Presentation Show Guide
This is a project management gantt chart marketing ppt powerpoint presentation show guide. This is a three stage process. The stages in this process are business, management, marketing, compare.
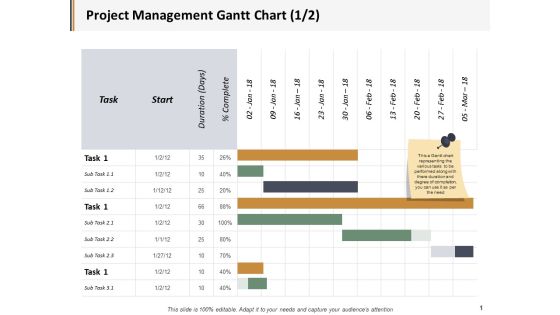
Project Management Gantt Chart Ppt PowerPoint Presentation File Graphic Images
This is a project management gantt chart ppt powerpoint presentation file graphic images. This is a three stage process. The stages in this process are business, management, marketing, compare.
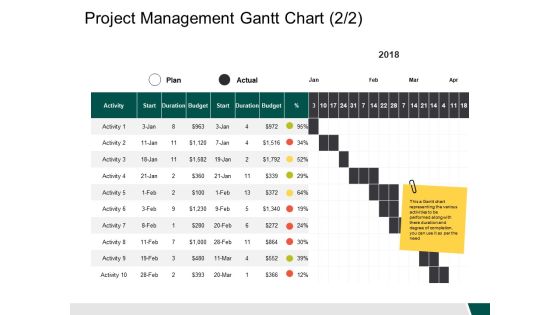
Project Management Gantt Chart Activity Ppt PowerPoint Presentation Inspiration Samples
This is a project management gantt chart activity ppt powerpoint presentation inspiration samples. This is a ten stage process. The stages in this process are business, management, strategy, analysis, marketing.

Project Progress Gannt Chart Report Ppt PowerPoint Presentation Outline Images
This is a project progress gannt chart report ppt powerpoint presentation outline images. This is a eight stage process. The stages in this process are activity tracker, business, marketing.

Comprehensive Solution Analysis Solution Assessment Criteria Analysis Chart Mockup PDF
This slide shows the solution assessment criteria analysis chart whose purpose is to evaluate the options available for a particular solution based on management receptivity, degree of risk and feasibility, solution cost etc.. along with the total score of each solution. This is a comprehensive solution analysis solution assessment criteria analysis chart mockup pdf template with various stages. Focus and dispense information on one stage using this creative set, that comes with editable features. It contains large content boxes to add your information on topics like solution assessment criteria analysis chart. You can also showcase facts, figures, and other relevant content using this PPT layout. Grab it now.
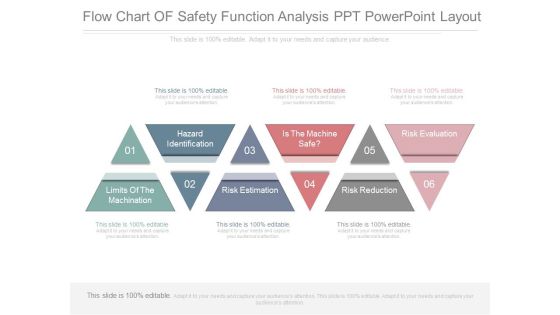
Flow Chart Of Safety Function Analysis Ppt Powerpoint Layout
This is a flow chart of safety function analysis ppt powerpoint layout. This is a six stage process. The stages in this process are hazard identification, limits of the machination, risk estimation, is the machine safe, risk reduction, risk evaluation.
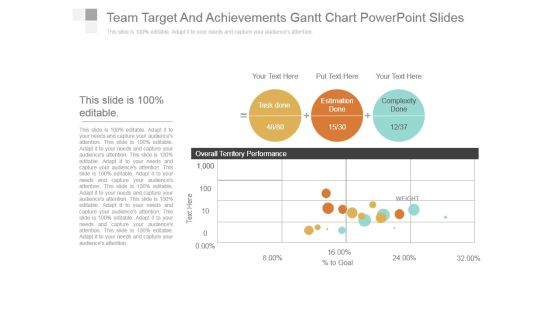
Team Target And Achievements Gantt Chart Powerpoint Slides
This is a team target and achievements gantt chart powerpoint slides. This is a three stage process. The stages in this process are task done, estimation done, complexity done, overall territory performance.

Team Target And Achievements Scatter Chart Ppt PowerPoint Presentation Example
This is a team target and achievements scatter chart ppt powerpoint presentation example. This is a three stage process. The stages in this process are overall territory performance, task done, estimation done, complexity done.

Calculating Customer Lifetime Value Clv Chart Powerpoint Templates
This is a calculating customer lifetime value clv chart powerpoint templates. This is a five stage process. The stages in this process are complete clv year, average acquisition cost, average customer revenue, average customer costs, average customer profit, customer retention rate, cumulative retention rate, likely customer profit, discount rate, clv per year, cumulative clv.

Gantt Chart For Effective Project Administration Strategy Graphics PDF
This slide covers a Gantt chart which will help in successfully planning a project schedule. It also helps in outlining the project activities.Showcasing this set of slides titled Gantt Chart For Effective Project Administration Strategy Graphics PDF. The topics addressed in these templates are Needs Assessment, Project Agreement, Cross Browser. All the content presented in this PPT design is completely editable. Download it and make adjustments in color, background, font etc. as per your unique business setting.

Gantt Chart Of Project Tracking And Management Template PDF
This slide illustrates timeline for various tasks of project. It shows monthly time limit of tasks assigned. Showcasing this set of slides titled Gantt Chart Of Project Tracking And Management Template PDF. The topics addressed in these templates are Gantt Chart, Project Tracking And Management. All the content presented in this PPT design is completely editable. Download it and make adjustments in color, background, font etc. as per your unique business setting.
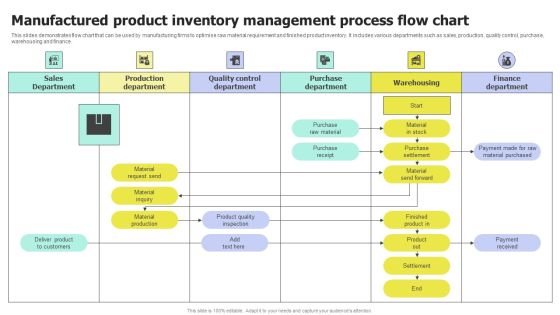
Manufactured Product Inventory Management Process Flow Chart Microsoft PDF
This slide demonstrates flow chart that can be used by manufacturing firms to optimise raw material requirement and finished product inventory. It includes various departments such as sales, production, quality control, purchase, warehousing and finance. Pitch your topic with ease and precision using this Manufactured Product Inventory Management Process Flow Chart Microsoft PDF. This layout presents information on Manufactured Product, Inventory Management, Process Flow Chart. It is also available for immediate download and adjustment. So, changes can be made in the color, design, graphics or any other component to create a unique layout.

Risk Response Chart Of The Production One Pager Documents
This one pager covers the risk response chart of the company with details on risks, probability low, medium or high, risk impact and strategies to overcome risk. Presenting you a fantastic Risk Response Chart Of The Production One Pager Documents. This piece is crafted on hours of research and professional design efforts to ensure you have the best resource. It is completely editable and its design allow you to rehash its elements to suit your needs. Get this Risk Response Chart Of The Production One Pager Documents A4 One-pager now.
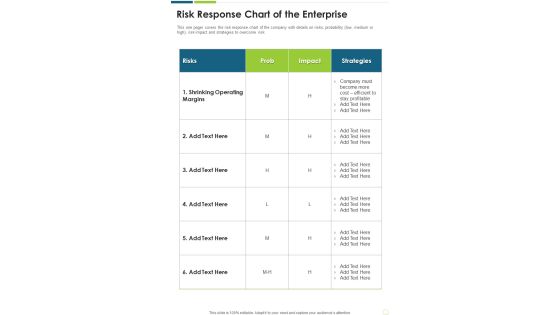
Risk Response Chart Of The Enterprise One Pager Documents
This one pager covers the risk response chart of the company with details on risks, probability low, medium or high, risk impact and strategies to overcome risk. Presenting you a fantastic Risk Response Chart Of The Enterprise One Pager Documents. This piece is crafted on hours of research and professional design efforts to ensure you have the best resource. It is completely editable and its design allow you to rehash its elements to suit your needs. Get this Risk Response Chart Of The Enterprise One Pager Documents A4 One-pager now.
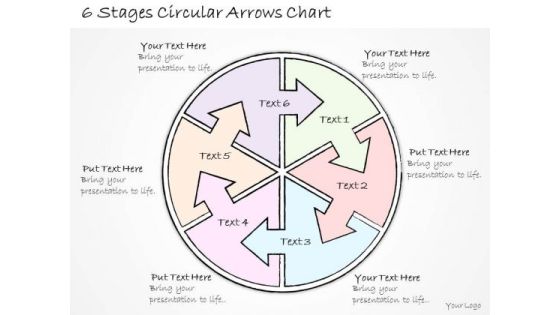
Ppt Slide 6 Stages Circular Arrows Chart Marketing Plan
Get The Doers Into Action. Activate Them With Our PPT Slide 6 Stages Circular Arrows Chart Marketing Plan Powerpoint Templates. Put Your Money On Our Business Plan Powerpoint Templates. Your Ideas Will Rake In The Dollars.
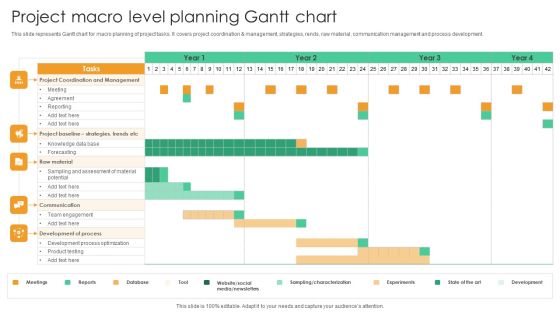
Project Macro Level Planning Gantt Chart Guidelines PDF
This slide represents Gantt chart for macro planning of project tasks. It covers project coordination and management, strategies, rends, raw material, communication management and process development. Pitch your topic with ease and precision using this Project Macro Level Planning Gantt Chart Guidelines PDF. This layout presents information on Project Coordination Management, Raw Material. It is also available for immediate download and adjustment. So, changes can be made in the color, design, graphics or any other component to create a unique layout.

Project Status Report Gantt Chart With Milestones Information PDF
This slide showcases the project status reporting summary gantt chart. Its key element is task timeline that can help organization to track any disparity in schedule of project. Showcasing this set of slides titled Project Status Report Gantt Chart With Milestones Information PDF. The topics addressed in these templates are Research, Sitemap Creation, Content Creation. All the content presented in this PPT design is completely editable. Download it and make adjustments in color, background, font etc. as per your unique business setting.
Revenue Projection Icon With Bar Chart Ppt Ideas Designs PDF
Persuade your audience using this revenue projection icon with bar chart ppt ideas designs pdf. This PPT design covers three stages, thus making it a great tool to use. It also caters to a variety of topics including revenue projection icon with bar chart. Download this PPT design now to present a convincing pitch that not only emphasizes the topic but also showcases your presentation skills.

Gantt Chart For Business Promotion Activities Sample PDF
Design a highly optimized project management report using this well-researched gantt chart for business promotion activities sample pdf. This layout can be used to present the professional details of a task or activity. Showcase the activities allocated to the business executives with this Gantt Chart PowerPoint theme. List down the column tasks in various timeframes and allocate time for each. In addition, also monitor the actual time and make comparisons to interpret the final progress using this innovative Gantt Chart Template. Showcase the work breakdown structure to attract your audience. Download and share it using Google Slides, if it suits your requirement.

Circle Chart For Business Strategy Plan Powerpoint Slides
This PowerPoint template has been designed with four steps circle chart with finance icons. This PPT slide can be used to display business strategy plan. You can download finance PowerPoint template to prepare awesome presentations.

Project Chart Ppt PowerPoint Presentation Ideas Design Ideas Cpb
Presenting this set of slides with name project chart ppt powerpoint presentation ideas design ideas cpb. This is an editable Powerpoint four stages graphic that deals with topics like project chart to help convey your message better graphically. This product is a premium product available for immediate download and is 100 percent editable in Powerpoint. Download this now and use it in your presentations to impress your audience.
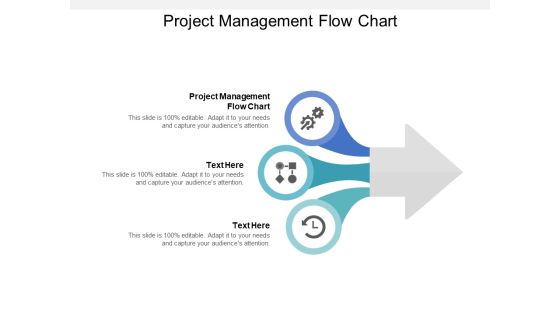
Project Management Flow Chart Ppt PowerPoint Presentation Show Pictures
Presenting this set of slides with name project management flow chart ppt powerpoint presentation show pictures. This is an editable Powerpoint three stages graphic that deals with topics like project management flow chart to help convey your message better graphically. This product is a premium product available for immediate download and is 100 percent editable in Powerpoint. Download this now and use it in your presentations to impress your audience.

Project Gantt Chart For Assessing Department Progress Brochure PDF
This slide represents the project Gantt chart that enables monitoring the progress status of departments. It covers the website team, mobile team, and marketing team. Showcasing this set of slides titled Project Gantt Chart For Assessing Department Progress Brochure PDF. The topics addressed in these templates are Third Party Integration, New Admin Console, Security Upgrade. All the content presented in this PPT design is completely editable. Download it and make adjustments in color, background, font etc. as per your unique business setting.

Agile Kanban Methodology Chart With Stories Ppt Model Show PDF
This slide explains Kanban Methodology through a chart that shows User Story Details, Tasks to be done, Tasks in progress Product Development, Software Quality Check, Testing to be done Automation Processes, Cycle Time Analysis and the activities that are ready to be deployed. Deliver an awe inspiring pitch with this creative agile kanban methodology chart with stories ppt model show pdf bundle. Topics like product development, process enhancements to timely deliver the project, agile kanban methodology chart with stories can be discussed with this completely editable template. It is available for immediate download depending on the needs and requirements of the user.
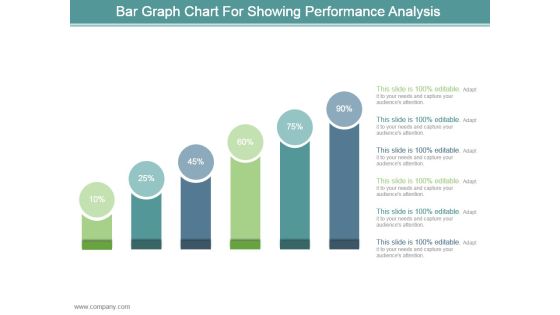
Bar Graph Chart For Showing Performance Analysis Ppt Design
This is a bar graph chart for showing performance analysis ppt design. This is a six stage process. The stages in this process are business, marketing, process, success, presentation.

Monetary Strategy Implementation Process Flow Chart Brochure PDF
This slide shows the monetary strategy implementation flow chart. It includes external and internal monetary environment analysis, monetary goals development, monetary strategy development, dividend policy, etc. Pitch your topic with ease and precision using this Monetary Strategy Implementation Process Flow Chart Brochure PDF. This layout presents information on Dividend Policy, Investment Policy, Asset Management. It is also available for immediate download and adjustment. So, changes can be made in the color, design, graphics or any other component to create a unique layout.

Break Point Chart For Quality Analysis Powerpoint Slide Show
This is a break point chart for quality analysis powerpoint slide show. This is a one stage process. The stages in this process are total variable costs, fixed costs, quality sold.
Business Diagram Icons Around Pie Chart Presentation Template
Strategy and planning can be displayed with this business diagram. This slide contains the graphic of icons around pie chart Use this editable slide to build quality presentation for your viewers.

Bar Chart Ppt PowerPoint Presentation Pictures Background Image
This is a bar chart ppt powerpoint presentation pictures background image. This is a seven stage process. The stages in this process are financial years, sales in percentage, graph, business.
Donut Pie Chart Ppt PowerPoint Presentation Icon Background Images
This is a donut pie chart ppt powerpoint presentation icon background images. This is a four stage process. The stages in this process are donut, process, planning, percentage, finance.
High Low Close Chart Ppt PowerPoint Presentation Icon Background Images
This is a high low close chart ppt powerpoint presentation icon background images. This is a ten stage process. The stages in this process are finance, analysis, planning, business, process.
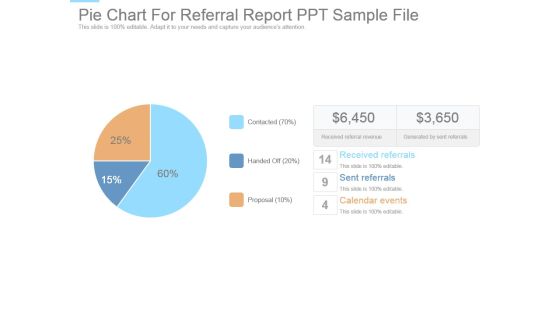
Pie Chart For Referral Report Ppt Sample File
This is a pie chart for referral report ppt sample file. This is a three stage process. The stages in this process are received referrals, sent referrals, calendar events, proposal, handed off, contacted, received referral revenue, generated by sent referrals.
Donut Pie Chart Ppt PowerPoint Presentation Icon Slide Portrait
This is a donut pie chart ppt powerpoint presentation icon slide portrait. This is a five stage process. The stages in this process are product, percentage, finance, donut, business.
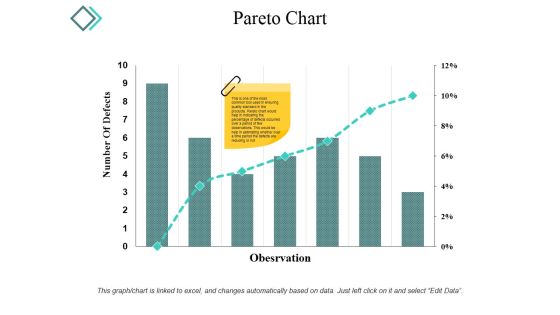
Pareto Chart Ppt PowerPoint Presentation Infographic Template Microsoft
This is a pareto chart ppt powerpoint presentation infographic template microsoft. This is a seven stage process. The stages in this process are number of defects, observation, graph, percentage, business.

Gantt Chart For Change Management Training Calendar Diagrams PDF
This slide displays Gantt chart for change management training, planning and scheduling in organization. It includes details about target audience, workshops, training and communications. Presenting Gantt Chart For Change Management Training Calendar Diagrams PDF to dispense important information. This template comprises one stages. It also presents valuable insights into the topics including Targeted Audience, Workshops, Training, Communications. This is a completely customizable PowerPoint theme that can be put to use immediately. So, download it and address the topic impactfully.

Comparison Chart For Strategic Planning Analysis Ppt PowerPoint Presentation Example
This is a comparison chart for strategic planning analysis ppt powerpoint presentation example. This is a two stage process. The stages in this process are business, finance, marketing, strategy, success.

Pie Chart Ppt PowerPoint Presentation Summary Background Image
This is a pie chart ppt powerpoint presentation summary background image. This is a five stage process. The stages in this process are business, marketing, product, finance, strategy, planning.

combo chart template 2 ppt powerpoint presentation background images
This is a combo chart template 2 ppt powerpoint presentation background images. This is a four stage process. The stages in this process are business, marketing, finance, timeline, product.
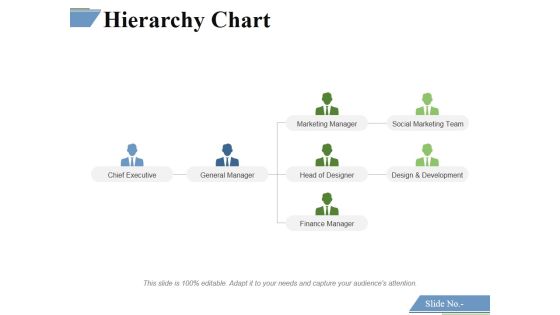
Hierarchy Chart Ppt PowerPoint Presentation Infographic Template Themes
This is a hierarchy chart ppt powerpoint presentation infographic template themes. This is a four stage process. The stages in this process are chief executive, general manager, marketing manager, head of designer, finance manager, design and development, social marketing team.

Staked Line Chart Ppt PowerPoint Presentation Model Graphics Download
This is a staked line chart ppt powerpoint presentation model graphics download. This is a two stage process. The stages in this process are business, marketing, growth, finance, management.
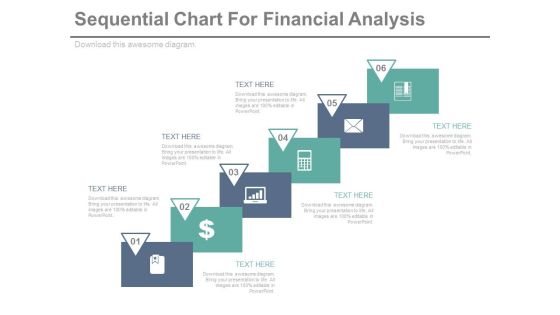
Sequential Steps Chart For Data Analysis Powerpoint Slides
This PowerPoint template has been designed sequential steps chart with icons. This PPT slide can be used to display corporate level financial strategy. You can download finance PowerPoint template to prepare awesome presentations.

Volume High Low Close Chart Ppt PowerPoint Presentation Gallery Shapes
This is a volume high low close chart ppt powerpoint presentation gallery shapes. This is a five stage process. The stages in this process are high, volume, low, close, finance.

Open High Low Close Chart Ppt PowerPoint Presentation Professional Inspiration
This is a open high low close chart ppt powerpoint presentation professional inspiration. This is a five stage process. The stages in this process are high, low, close, business, finance.

Donut Pie Chart Ppt PowerPoint Presentation Show Graphics Download
This is a donut pie chart ppt powerpoint presentation show graphics download. This is a three stage process. The stages in this process are percentage, finance, donut, business, marketing.
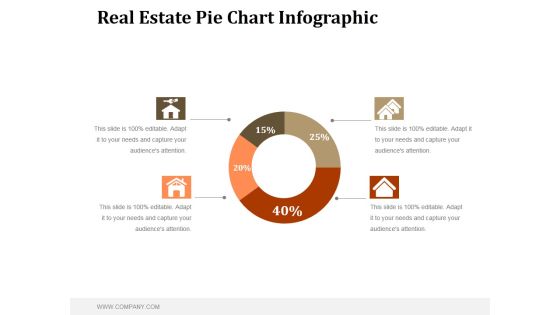
Real Estate Pie Chart Infographic Ppt PowerPoint Presentation Shapes
This is a real estate pie chart infographic ppt powerpoint presentation shapes. This is a four stage process. The stages in this process are business, marketing, management, finance, planning.

Email Marketing Performance Chart Ppt Powerpoint Presentation Pictures Show
This is a email marketing performance chart ppt powerpoint presentation pictures show. This is a nine stage process. The stages in this process are finance, planning, marketing, business, management, strategy.

Line Chart Ppt PowerPoint Presentation File Graphic Images
This is a line chart ppt powerpoint presentation file graphic images. This is a two stage process. The stages in this process are business, strategy, marketing, planning, growth strategy, finance.
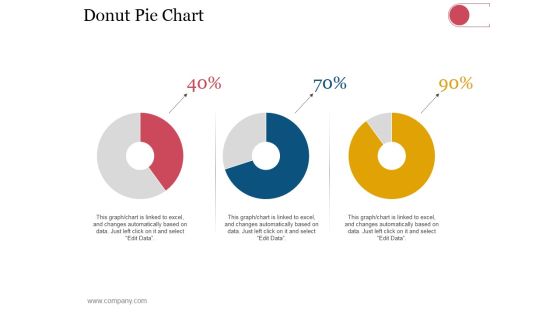
Donut Pie Chart Ppt PowerPoint Presentation Infographics Outfit
This is a donut pie chart ppt powerpoint presentation infographics outfit. This is a three stage process. The stages in this process are business, strategy, analysis, planning, dashboard, finance.
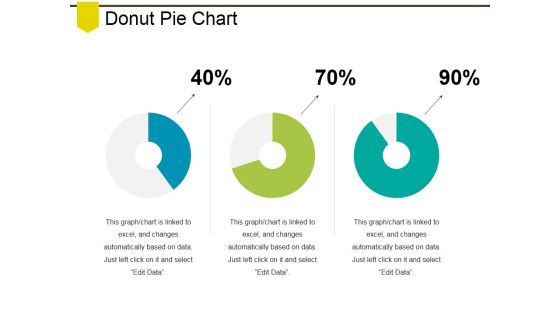
Donut Pie Chart Ppt PowerPoint Presentation File Example Introduction
This is a donut pie chart ppt powerpoint presentation file example introduction. This is a three stage process. The stages in this process are business, marketing, finance, planning, analysis.
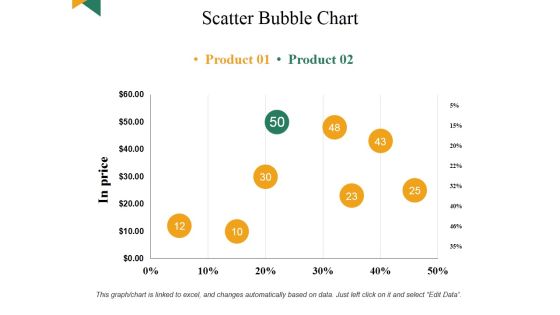
Scatter Bubble Chart Ppt PowerPoint Presentation Summary Visual Aids
This is a scatter bubble chart ppt powerpoint presentation summary visual aids. This is a eight stage process. The stages in this process are business, marketing, finance, analysis, planning.
Mountain Chart With Social Media Icons Powerpoint Slides
The above PPT template displays mountain chart with social media icons. This PowerPoint template has been designed to exhibit users of social media. Download this PPT slide to attract the attention of your audience.
Market Trends Chart With Percentage And Icons Powerpoint Slides
This PowerPoint template has been designed with graphics of chart with percentage values and icons. This PowerPoint template may be used to market trends and financial analysis. Prove the viability of your ideas using this impressive slide.
Six Steps Circular Chart With Icons Powerpoint Slides
This PowerPoint template has been designed with six steps circular chart with icons. This PPT slide may be used to display business and management functions. Download this slide to build unique presentation.

Hiring Plan Bar Chart Powerpoint Slide Background Image
This is a hiring plan bar chart powerpoint slide background image. This is a five stage process. The stages in this process are engineering, sales, marketing, product, support, finance.

Stock Photo Corporate Business Strategy 50 Percentage Pie Chart Images
Extract admiration from the audience. Create a forceful impact with our stock photo corporate business strategy 50 percentage pie chart images. Force doors open with our finance. The audience will decide to let your thoughts enter.

Pie Chart For Current Sources Of Profit Ppt Background Template
This is a pie chart for current sources of profit ppt background template. This is a five stage process. The stages in this process are finance, success, business, marketing, percentage, donut.
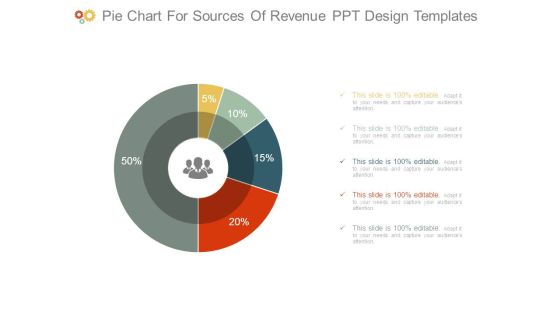
Pie Chart For Sources Of Revenue Ppt Design Templates
This is a pie chart for sources of revenue ppt design templates. This is a five stage process. The stages in this process are finance, success, business, marketing, percentage, donut.
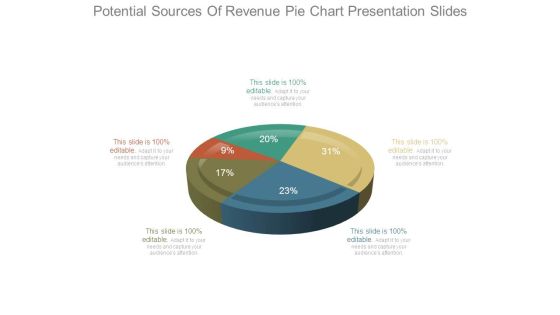
Potential Sources Of Revenue Pie Chart Presentation Slides
This is a potential sources of revenue pie chart presentation slides. This is a five stage process. The stages in this process are finance, success, business, marketing, percentage, pie.

Financial Reporting And Analysis Pie Chart Ppt PowerPoint Presentation Guidelines
This is a financial reporting and analysis pie chart ppt powerpoint presentation guidelines. This is a four stage process. The stages in this process are process, percentage, business, marketing, finance.
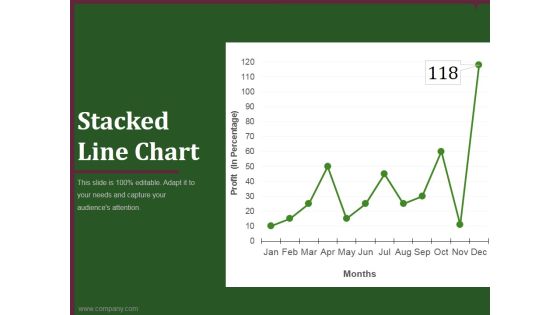
Stacked Line Chart Ppt PowerPoint Presentation Background Image
This is a stacked line chart ppt powerpoint presentation background image. This is a twelve stage process. The stages in this process are business, marketing, analysis, finance, growth strategy.
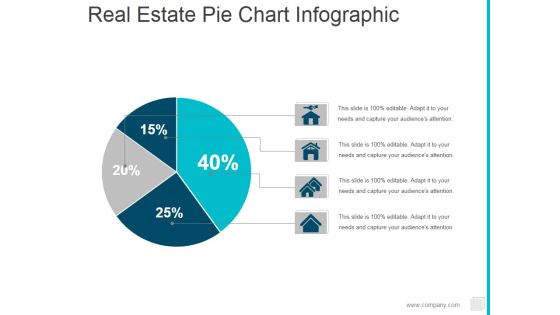
Real Estate Pie Chart Infographic Ppt PowerPoint Presentation Ideas Shapes
This is a real estate pie chart infographic ppt powerpoint presentation ideas shapes. This is a four stage process. The stages in this process are pie, finance, marketing, percentage.

Line Bubble Chart Ppt PowerPoint Presentation Professional Infographic Template
This is a line bubble chart ppt powerpoint presentation professional infographic template. This is a five stage process. The stages in this process are product, in price, highest sale, business, finance.

Column Chart Ppt PowerPoint Presentation Styles Graphic Tips
This is a column chart ppt powerpoint presentation styles graphic tips. This is a six stage process. The stages in this process are slide bar, business, marketing, strategy, finance.

Donut Pie Chart Ppt PowerPoint Presentation Infographics Background Designs
This is a donut pie chart ppt powerpoint presentation infographics background designs. This is a three stage process. The stages in this process are finance, business, marketing, strategy, percentage.
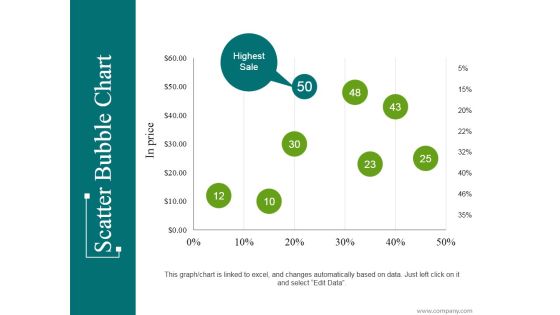
Scatter Bubble Chart Ppt PowerPoint Presentation Infographic Template Introduction
This is a scatter bubble chart ppt powerpoint presentation infographic template introduction. This is a eight stage process. The stages in this process are highest sale, business, marketing, percentage, finance.
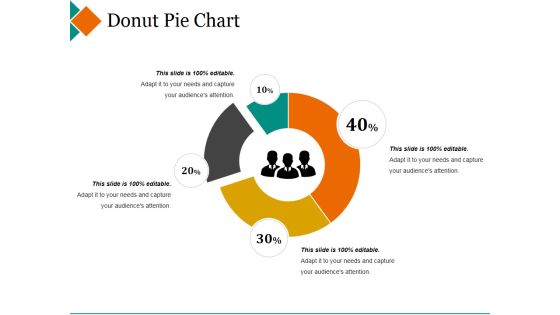
Donut Pie Chart Ppt PowerPoint Presentation Pictures Design Inspiration
This is a donut pie chart ppt powerpoint presentation pictures design inspiration. This is a four stage process. The stages in this process are maximum, donut, minimum, percentage, finance.
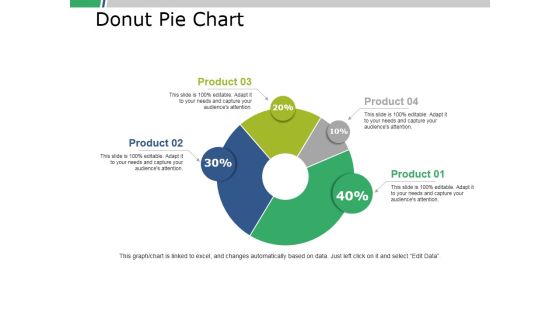
Donut Pie Chart Ppt PowerPoint Presentation Portfolio Slide Download
This is a donut pie chart ppt powerpoint presentation portfolio slide download. This is a four stage process. The stages in this process are business, marketing, finance, percent, donut.

Column Chart Ppt PowerPoint Presentation Infographic Template Example File
This is a column chart ppt powerpoint presentation infographic template example file. This is a two stage process. The stages in this process are growth, finance, business, marketing, analysis.
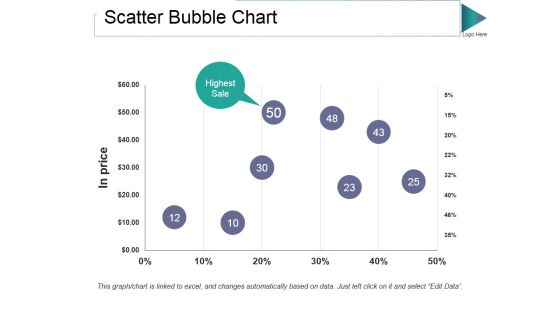
Scatter Bubble Chart Ppt PowerPoint Presentation Gallery Guidelines
This is a scatter bubble chart ppt powerpoint presentation gallery guidelines. This is a one stage process. The stages in this process are in price, highest sale, percentage, finance, business.

Donut Pie Chart Ppt PowerPoint Presentation Professional Graphic Images
This is a donut pie chart ppt powerpoint presentation professional graphic images. This is a three stage process. The stages in this process are percentage, finance, donut, business, marketing.
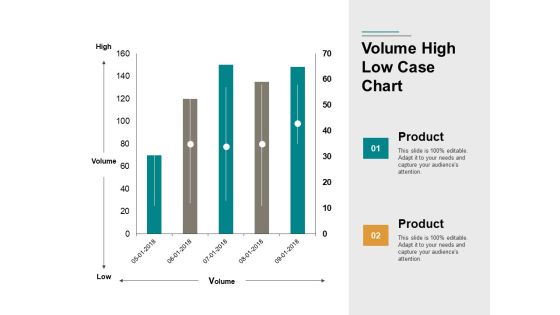
Volume High Low Case Chart Ppt PowerPoint Presentation Portfolio Images
This is a volume high low case chart ppt powerpoint presentation portfolio images. This is a two stage process. The stages in this process are finance, business, marketing, management.

Bubble Chart Marketing Business Ppt PowerPoint Presentation Model Sample
This is a bubble chart marketing business ppt powerpoint presentation model sample. This is a two stage process. The stages in this process are finance, business, management, strategy, analysis.

Bar Chart Ppt PowerPoint Presentation Infographic Template Skills
This is a bar chart ppt powerpoint presentation infographic template skills. This is a nine stage process. The stages in this process are sales in percentage, finance, business, marketing, strategy, success.

Volume High Low Close Chart Ppt PowerPoint Presentation Show Outfit
This is a volume high low close chart ppt powerpoint presentation show outfit. This is a five stage process. The stages in this process are business, strategy, marketing, success, finance, growth.
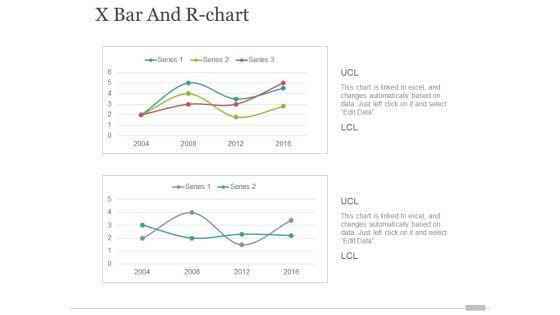
x bar and r chart ppt powerpoint presentation portfolio elements
This is a x bar and r chart ppt powerpoint presentation portfolio elements. This is a two stage process. The stages in this process are finance, business, marketing, growth.

 Home
Home