Budget Chart

Combo Chart Ppt PowerPoint Presentation Layouts Example Topics
This is a combo chart ppt powerpoint presentation layouts example topics. This is a two stage process. The stages in this process are finance, marketing, management, investment, analysis.
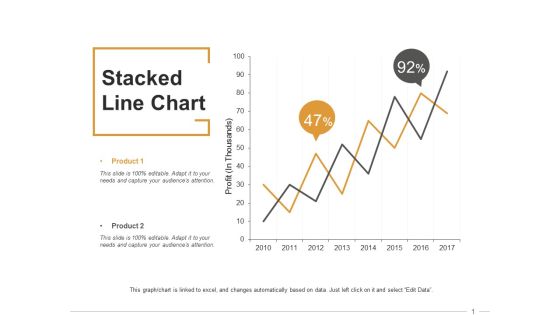
Stacked Line Chart Ppt PowerPoint Presentation Inspiration Format
This is a stacked line chart ppt powerpoint presentation inspiration format. This is a two stage process. The stages in this process are finance, marketing, management, investment, analysis.
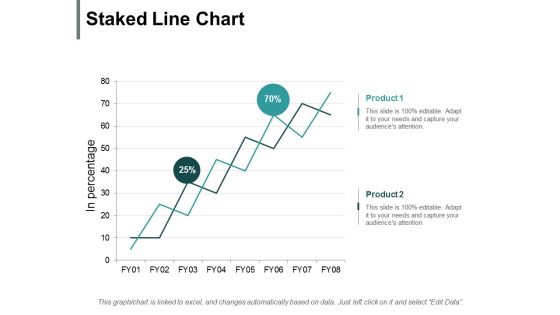
Staked Line Chart Ppt PowerPoint Presentation Ideas Influencers
This is a staked line chart ppt powerpoint presentation ideas influencers. This is a two stage process. The stages in this process are finance, marketing, management, investment, analysis.

Donut Chart Management Ppt Powerpoint Presentation Slides Aids
This is a donut chart management ppt powerpoint presentation slides aids. This is a six stage process. The stages in this process are finance, marketing, management, investment, analysis.

Stock Chart Graph Ppt PowerPoint Presentation Ideas Demonstration
This is a stock chart graph ppt powerpoint presentation ideas demonstration. This is a three stage process. The stages in this process are finance, marketing, management, investment, analysis.
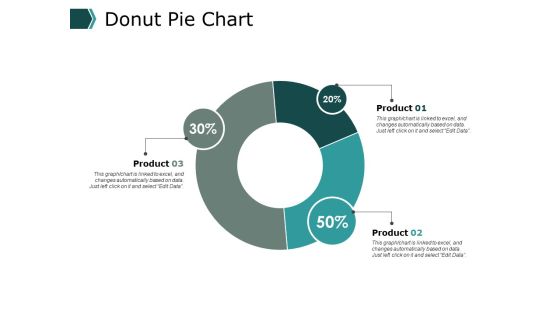
Donut Pie Chart Ppt PowerPoint Presentation Model Deck
This is a donut pie chart ppt powerpoint presentation model deck. This is a three stage process. The stages in this process are finance, marketing, management, investment, analysis.

Clustered Chart Graph Ppt PowerPoint Presentation Gallery Backgrounds
This is a clustered chart graph ppt powerpoint presentation gallery backgrounds. This is a three stage process. The stages in this process are finance, marketing, analysis, investment, million.

Combo Chart Graph Ppt PowerPoint Presentation Professional Guidelines
This is a combo chart graph ppt powerpoint presentation professional guidelines. This is a three stage process. The stages in this process are finance, marketing, analysis, investment, million.

Pie Chart Bar Ppt PowerPoint Presentation Layouts Examples
This is a pie chart bar ppt powerpoint presentation layouts examples. This is a three stage process. The stages in this process are finance, marketing, analysis, investment, million.

Security Agency Business Profile Organization Chart Topics PDF
This slide highlights the organization structure of security company which includes managing director, HR and finance department, training and operations department with site supervisor. This is a Security Agency Business Profile Organization Chart Topics PDF template with various stages. Focus and dispense information on six stages using this creative set, that comes with editable features. It contains large content boxes to add your information on topics like Operations Supervisor, Security Personnel, Relief Security Personnel. You can also showcase facts, figures, and other relevant content using this PPT layout. Grab it now.
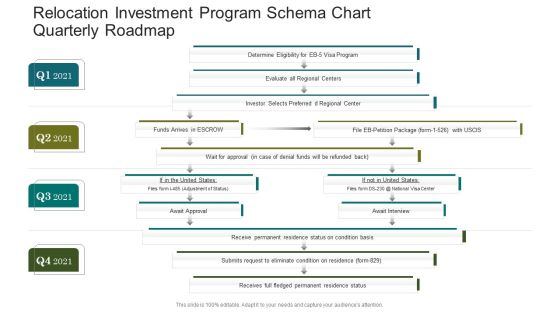
Relocation Investment Program Schema Chart Quarterly Roadmap Diagrams
Presenting the relocation investment program schema chart quarterly roadmap diagrams. The template includes a roadmap that can be used to initiate a strategic plan. Not only this, the PowerPoint slideshow is completely editable and you can effortlessly modify the font size, font type, and shapes according to your needs. This PPT slide can be easily reached in standard screen and widescreen aspect ratios. The set is also available in various formats like PDF, PNG, and JPG. So download and use it multiple times as per your knowledge.

Business Finance Strategy Development Business Chart Marketing Diagram
Document The Process On Our Business Finance Strategy Development Business Chart Marketing Diagram Powerpoint Templates. Make A Record Of Every Detail.
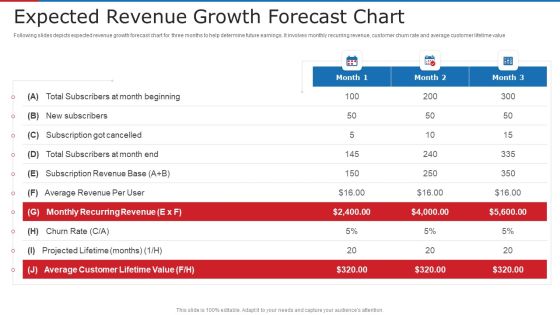
Expected Revenue Growth Forecast Chart Ppt Professional Graphics Tutorials PDF
Following slides depicts expected revenue growth forecast chart for three months to help determine future earnings. It involves monthly recurring revenue, customer churn rate and average customer lifetime value Deliver an awe inspiring pitch with this creative expected revenue growth forecast chart ppt professional graphics tutorials pdf bundle. Topics like average, revenue, rate can be discussed with this completely editable template. It is available for immediate download depending on the needs and requirements of the user.
Business Finance Strategy Development Arrangement Chart Diagram Sales Diagram
Put In A Dollop Of Our Business Finance Strategy Development Arrangement Chart Diagram Sales Diagram Powerpoint Templates. Give Your Thoughts A Distinctive Flavor.
Sales Diagram Six Concept Diagrams Chart Business Finance Strategy Development
Your Listeners Will Never Doodle. Our Sales Diagram Six Concept Diagrams Chart Business Finance Strategy Development Powerpoint Templates Will Hold Their Concentration.
Business Finance Strategy Development Matrix Chart Business Diagram
Get The Domestics Right With Our Business Finance Strategy Development Matrix Chart Business Diagram Powerpoint Templates. Create The Base For Thoughts To Grow.

Area Chart Product Finance Ppt PowerPoint Presentation Guide
This is a area chart product finance ppt powerpoint presentation guide. This is a four stage process. The stages in this process are business, management, financial, marketing, sales.

Mutual Fund Operation Flow Chart Diagram Ppt Ideas
This is a mutual fund operation flow chart diagram ppt ideas. This is a four stage process. The stages in this process are returns, securities, investors, fund manager.
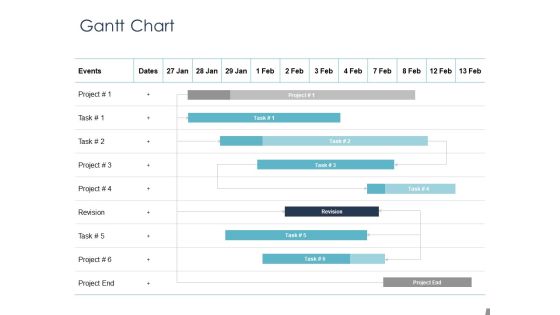
Job Estimate Gantt Chart Ppt Ideas Visuals PDF
Presenting this set of slides with name job estimate gantt chart ppt ideas visuals pdf. The topics discussed in these slides are gantt chart. This is a completely editable PowerPoint presentation and is available for immediate download. Download now and impress your audience.
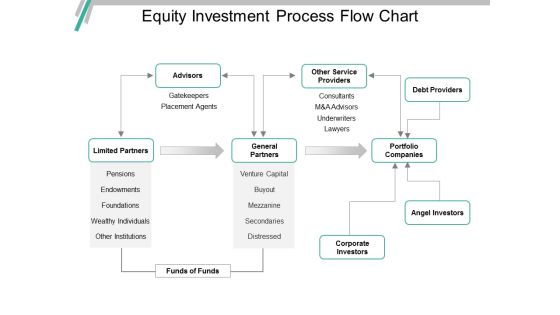
Equity Investment Process Flow Chart Ppt PowerPoint Presentation Ideas
This is a equity investment process flow chart ppt powerpoint presentation ideas. This is a three stage process. The stages in this process are investment, funding, private equity, venture capital.
E Commerce Flow Chart Ppt PowerPoint Presentation Icon Gallery PDF
Presenting E Commerce Flow Chart Ppt PowerPoint Presentation Icon Gallery PDF to dispense important information. This template comprises one stages. It also presents valuable insights into the topics including E Commerce, Flow Chart. This is a completely customizable PowerPoint theme that can be put to use immediately. So, download it and address the topic impactfully.

Business Organizational Chart Template Ppt PowerPoint Templates Backgrounds For Slides
We present our business organizational chart template ppt PowerPoint templates backgrounds for slides.Download and present our Communication PowerPoint Templates because Watching this your Audience will Grab their eyeballs, they wont even blink. Present our Finance PowerPoint Templates because Our PowerPoint Templates and Slides will let Your superior ideas hit the target always and everytime. Use our Circle Charts PowerPoint Templates because You are well armed with penetrative ideas. Our PowerPoint Templates and Slides will provide the gunpowder you need. Download our Business PowerPoint Templates because Our PowerPoint Templates and Slides provide you with a vast range of viable options. Select the appropriate ones and just fill in your text. Download our Shapes PowerPoint Templates because Our PowerPoint Templates and Slides will generate and maintain the level of interest you desire. They will create the impression you want to imprint on your audience.Use these PowerPoint slides for presentations relating to pencil, isolated, wallpaper, decoration, vibrant, sketching, row, blank, concept, vector, line, spectrum, bright, template, circle, ring, graphic, pastel, drawing, paint, multicolor, card, assortment, vertical, idea, equipment, multicolored, creative, arrangement, palette, illustration, object, wood, backdrop, design, group, tape, school, pointing, education, draw, art, stripe, wooden, instrument, college, rainbow. The prominent colors used in the PowerPoint template are Yellow, Black, Gray.
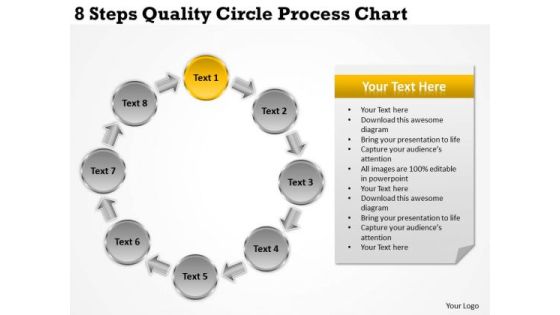
Internet Business Strategy 8 Steps Quality Circle Process Chart Model
We present our internet business strategy 8 steps quality circle process chart model.Present our Advertising PowerPoint Templates because Our PowerPoint Templates and Slides are Clear and concise. Use them and dispel any doubts your team may have. Download our Business PowerPoint Templates because Our PowerPoint Templates and Slides offer you the needful to organise your thoughts. Use them to list out your views in a logical sequence. Download and present our Arrows PowerPoint Templates because Our PowerPoint Templates and Slides will give you great value for your money. Be assured of finding the best projection to highlight your words. Download our Circle Charts PowerPoint Templates because Our PowerPoint Templates and Slides are Clear and concise. Use them and dispel any doubts your team may have. Download our Marketing PowerPoint Templates because You can Hit a home run with our PowerPoint Templates and Slides. See your ideas sail into the minds of your audience.Use these PowerPoint slides for presentations relating to Arrow, Diagram, Website, Search, Content, Green, Back Link, Red, Yellow, Vector, Code, Template, Circle, Orange, Process, Analysis, Violet, Engine, Tracking, Keyword, Illustration, Optimization, Purple, Visitor, Colorful, Blue, Background. The prominent colors used in the PowerPoint template are Yellow, Gray, Black.
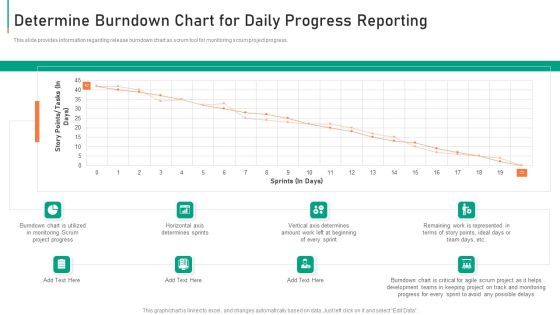
Determine Burndown Chart For Daily Progress Reporting Diagrams PDF
This slide provides information regarding release burndown chart as scrum tool for monitoring scrum project progress. Deliver and pitch your topic in the best possible manner with this determine burndown chart for daily progress reporting diagrams pdf. Use them to share invaluable insights on determine burndown chart for daily progress reporting and impress your audience. This template can be altered and modified as per your expectations. So, grab it now.
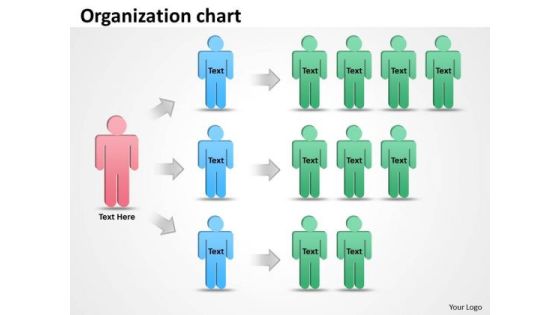
Business Finance Strategy Development Organization Staff Chart Business Cycle Diagram
Your Grasp Of Economics Is Well Known. Help Your Audience Comprehend Issues With Our Business Finance Strategy Development Organization staff chart Business Cycle Diagram Powerpoint Templates. Strike A Bargain With Our Business Finance Strategy Development Organization staff chart Business Cycle Diagram Powerpoint Templates. Your Thoughts Will Get A Winning Deal.

Chart For Business Development Ppt Plan PowerPoint Templates
We present our chart for business development ppt plan PowerPoint templates.Download and present our Process and Flows PowerPoint Templates because Our PowerPoint Templates and Slides will provide you the cutting edge. Slice through the doubts in the minds of your listeners. Present our Business PowerPoint Templates because You can safely bank on our PowerPoint Templates and Slides. They will provide a growth factor to your valuable thoughts. Download and present our Flow Charts PowerPoint Templates because You are well armed with penetrative ideas. Our PowerPoint Templates and Slides will provide the gunpowder you need. Download and present our Marketing PowerPoint Templates because It can Leverage your style with our PowerPoint Templates and Slides. Charm your audience with your ability. Download and present our Shapes PowerPoint Templates because Our PowerPoint Templates and Slides are endowed to endure. Ideas conveyed through them will pass the test of time.Use these PowerPoint slides for presentations relating to Collection, web, info, item, grade, business,, concept, vector, line, visual, presentation, internet, gradation, template, shadow, graphic, clean, element, simple, abstract, multicolored, modern, creative, illustration, backdrop, design, cover, color,, composition, set, banner, stripe, information, background. The prominent colors used in the PowerPoint template are Blue, Gray, Black.

Percentage Chart For Good Marketing Strategy Powerpoint Slides
This PowerPoint template has been designed with pie chart and percentage values. The PowerPoint template has a high quality design. You can download this PowerPoint slide to make good marketing strategy and business plans.
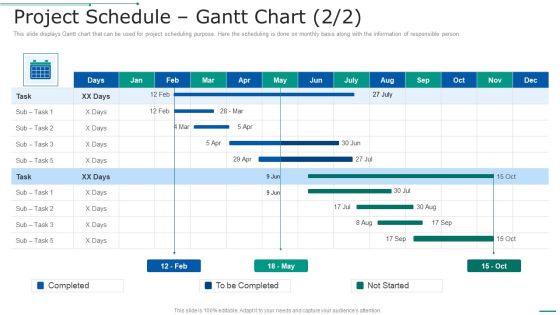
PMP Toolkit Project Schedule Gantt Chart Ppt Inspiration Slideshow PDF
This slide displays Gantt chart that can be used for project scheduling purpose. Here the scheduling is done on monthly basis along with the information of responsible person. Deliver and pitch your topic in the best possible manner with this project schedule gantt chart. Use them to share invaluable insights on project schedule gantt chart and impress your audience. This template can be altered and modified as per your expectations. So, grab it now.
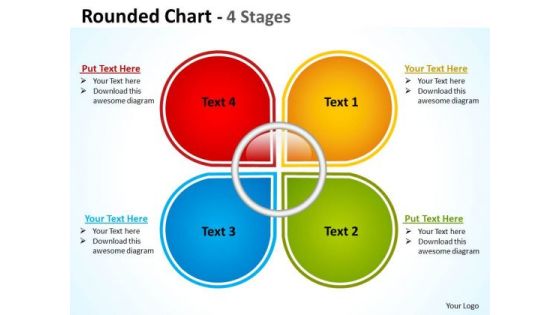
Marketing Diagram Rounded Chart With 4 Stages Strategic Management
Your Grasp Of Economics Is Well Known. Help Your Audience Comprehend Issues With Our Marketing Diagram Rounded Chart With 4 Stages Strategic Management Powerpoint Templates.
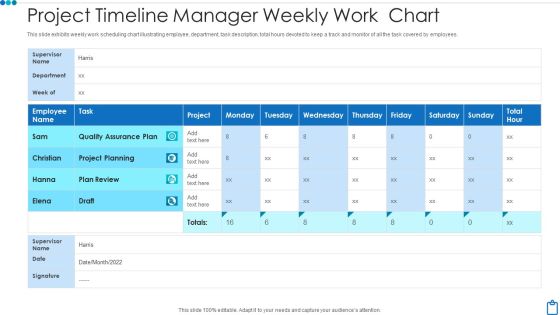
Project Timeline Manager Weekly Work Chart Demonstration PDF
This slide exhibits weekly work scheduling chart illustrating employee, department, task description, total hours devoted to keep a track and monitor of all the task covered by employees. Showcasing this set of slides titled project timeline manager weekly work chart demonstration pdf. The topics addressed in these templates are project timeline manager weekly work chart. All the content presented in this PPT design is completely editable. Download it and make adjustments in color, background, font etc. as per your unique business setting.
Human Resource Metrics Icon With Bar Chart Elements PDF
Presenting Human Resource Metrics Icon With Bar Chart Elements PDF to dispense important information. This template comprises three stages. It also presents valuable insights into the topics including Human Resource Metrics Icon, Bar Chart. This is a completely customizable PowerPoint theme that can be put to use immediately. So, download it and address the topic impactfully.
Project Management Gantt Chart Graph Ppt PowerPoint Presentation Styles Icon
This is a project management gantt chart graph ppt powerpoint presentation styles icon. This is a four stage process. The stages in this process are four.

Stock Photo Pie Chart And Bar Graph PowerPoint Template
Put In A Dollop Of Our stock photo Pie Chart And Bar Graph powerpoint template Powerpoint Templates. Give Your Thoughts A Distinctive Flavor.
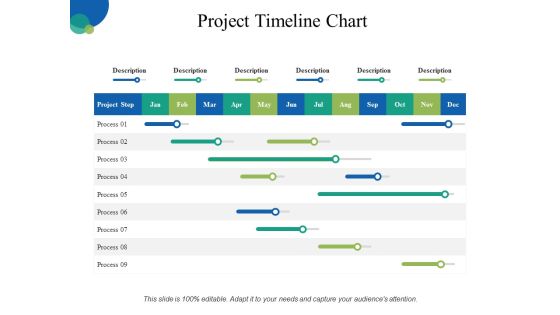
Project Timeline Chart Ppt PowerPoint Presentation Slides Graphics
This is a project timeline chart ppt powerpoint presentation slides graphics. This is a six stage process. The stages in this process are process, marketing, planning, strategy, timeline.
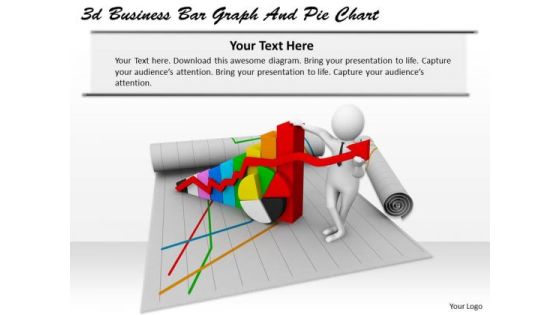
Business Intelligence Strategy 3d Bar Graph And Pie Chart Characters
Establish Your Dominion With Our Business Intelligence Strategy 3D Bar Graph And Pie Chart Characters Powerpoint Templates. Rule The Stage With Your Thoughts.

Project Management Gantt Chart Ppt PowerPoint Presentation Summary Images
This is a project management gantt chart ppt powerpoint presentation summary images. This is a two stage process. The stages in this process are marketing, business, management, compare.
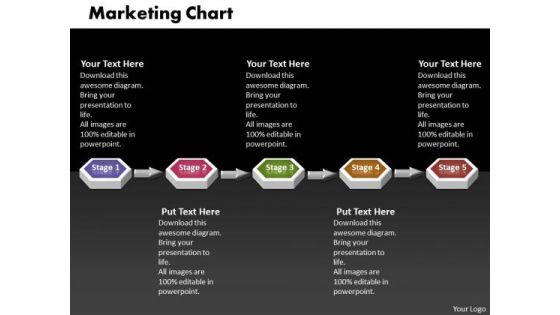
Ppt 3d Linear Mobile Marketing PowerPoint Presentation Flow Chart Templates
PPT 3d linear mobile marketing powerpoint presentation flow chart Templates-Use this 3D Animated PowerPoint Diagram to demonstrate the Marketing Flow Process step wise step. This Diagram imitates the following concept: connected, consecutive, continued, day and night, endless, everlasting, extended etc.-PPT 3d linear mobile marketing powerpoint presentation flow chart Templates-Abstract, Action, Attention, Business, Chart, Clipart, Commerce, Concept, Conceptual, Corporate, Customer, Design, Desire, Diagram, Flow, Goals, Guide, Icon, Idea, Illustration, Interest, Manage, Management, Map, Marketing, Mind, Mission, Model, Organization, Performance, Planning, Plans, Process

Bar Graph Chart Ppt PowerPoint Presentation Portfolio Templates
This is a bar graph chart ppt powerpoint presentation portfolio templates. This is a two stage process. The stages in this process are financial, minimum, medium, maximum.
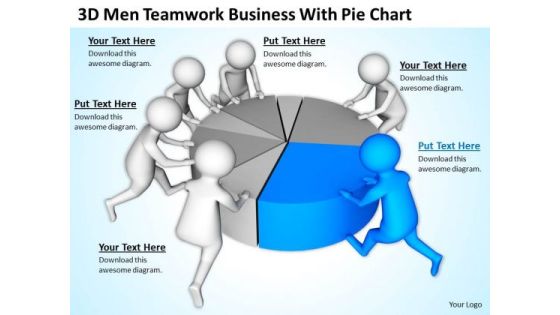
Pictures Of Business Men PowerPoint Presentation With Pie Chart Slides
We present our pictures of business men powerpoint presentation with pie chart Slides.Use our Business PowerPoint Templates because Our PowerPoint Templates and Slides will let Your superior ideas hit the target always and everytime. Present our Teamwork PowerPoint Templates because Our PowerPoint Templates and Slides ensures Effective communication. They help you put across your views with precision and clarity. Use our Pie Charts PowerPoint Templates because you can Break through with our PowerPoint Templates and Slides. Bring down the mental barriers of your audience. Download our Marketing PowerPoint Templates because It will let you Set new benchmarks with our PowerPoint Templates and Slides. They will keep your prospects well above par. Use our Success PowerPoint Templates because Our PowerPoint Templates and Slides are Clear and concise. Use them and dispel any doubts your team may have.Use these PowerPoint slides for presentations relating to 3d, accounting, banking, business, businessmen, chart, completing, concept, diagram, economy, financial, graph, illustration, investment, management, market, men, money, part, people, percent, pie, piece, profit, progress, pushing, report, results, sales, slice, statistics, strategy, success, symbol, team, teamwork, together, unite, white. The prominent colors used in the PowerPoint template are Blue, Gray, White.

Bar Chart Ppt PowerPoint Presentation Styles Graphics Example
This is a bar chart ppt powerpoint presentation styles graphics example. This is a nine stage process. The stages in this process are graph, growth, success, business, finance.

Growth Chart Business PowerPoint Templates And PowerPoint Themes 1012
Growth Chart Business PowerPoint Templates And PowerPoint Themes 1012-The above template displays a diagram of a colorful business chart outgoing. This image has been professionally designed to emphasize business concept. It signifies chart, finance, future, growth, profit, progress, statistics and success. Adjust the above image in your PPT presentations to visually support your content in your Marketing and Financial PPT slideshows. Our PPT images are so ideally designed that it reveals the very basis of our PPT template are an effective tool to make your clients understand.-Growth Chart Business PowerPoint Templates And PowerPoint Themes 1012-This PowerPoint template can be used for presentations relating to-Business growth and success graph, finance, business, success, competition, arrows
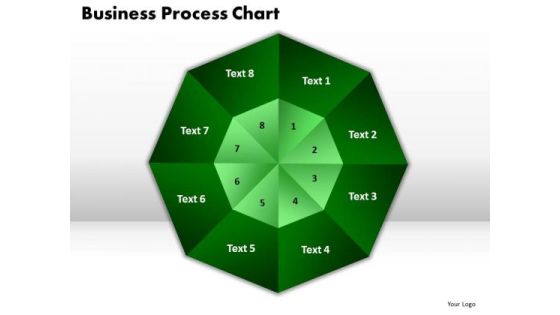
PowerPoint Template Business Process Chart Marketing Ppt Slides
PowerPoint Template Business Process Chart Marketing PPT Slides-The template offers an excellent background to build up the various stages of your business process. This PowerPoint Process Chart shows the eight Different Layers which are to be followed in any business. This Business Diagram can be used in Marketing, Banking, and Management etc. This Diagram explains eight different topics.-PowerPoint Template Business Process Chart Marketing PPT Slides

Business Diagram Pie Chart Showing Percentages Presentation Template
This image slide displays business consulting diagram of pie chart showing percentage. Pie Charts can be used to display a wide variety of information. When data is represented in the form of a pie chart the human eye finds it very easy to compare the data and quickly draw conclusions. In short they are a great visual aid and will add a touch of professionalism to any presentation which requires the display of data.

Career Growth Chart Success PowerPoint Templates And PowerPoint Themes 0912
Career Growth Chart Success PowerPoint Templates And PowerPoint Themes 0912-Microsoft Powerpoint Templates and Background with business or career growth-Business or career growth, finance, success, business, arrows, competition

Combo Chart Template 1 Ppt PowerPoint Presentation Themes
This is a combo chart template 1 ppt powerpoint presentation themes. This is a four stage process. The stages in this process are business, marketing, finance, timeline, management.

Money Growth Chart On Laptop With Mouse Powerpoint Template
This business slide displays money growth chart on laptop with mouse. This diagram is a data visualization tool that gives you a simple way to present statistical information. This slide helps your audience examine and interpret the data you present.
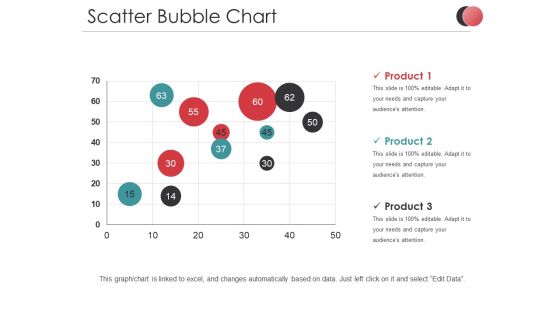
Scatter Bubble Chart Ppt PowerPoint Presentation Infographic Template Diagrams
This is a scatter bubble chart ppt powerpoint presentation infographic template diagrams. This is a three stage process. The stages in this process are product, business, marketing, finance.

Pie Chart Ppt Powerpoint Presentation Infographic Template Diagrams
This is a pie chart ppt powerpoint presentation infographic template diagrams. This is a three stage process. The stages in this process are business, marketing, finance, icons, management.
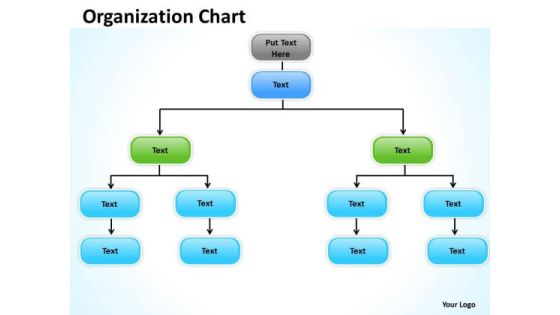
Business Finance Strategy Development Organization Chart Diagram Marketing Diagram
Double The Impact With Our Business Finance Strategy Development Organization chart diagram marketing diagram Powerpoint Templates. Your Thoughts Will Have An Imposing Effect. Knead The Dough With OurBusiness Finance Strategy Development Organization chart diagram marketing diagram Powerpoint Templates. Your Thoughts Will Come Up Well.
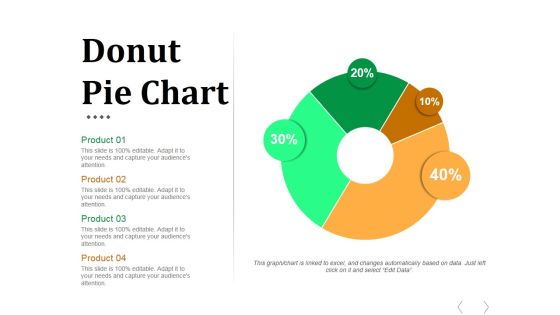
Donut Pie Chart Ppt PowerPoint Presentation Infographics Graphics
This is a donut pie chart ppt powerpoint presentation infographics graphics. This is a four stage process. The stages in this process are business, marketing, donut, finance, management.
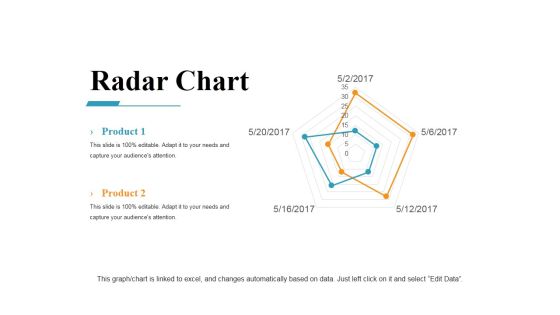
Radar Chart Ppt PowerPoint Presentation Ideas Master Slide
This is a radar chart ppt powerpoint presentation ideas master slide. This is a five stage process. The stages in this process are radar, business, marketing, strategy, finance.

Gantt Chart Finance Ppt PowerPoint Presentation Ideas Graphics
Presenting this set of slides with name gantt chart finance ppt powerpoint presentation ideas graphics. The topics discussed in these slides are gantt chart, finance, marketing, strategy, business. This is a completely editable PowerPoint presentation and is available for immediate download. Download now and impress your audience.

Area Chart Ppt PowerPoint Presentation Infographic Template Portrait
This is a area chart ppt powerpoint presentation infographic template portrait. This is a two stage process. The stages in this process are business, marketing, strategy, planning, finance.
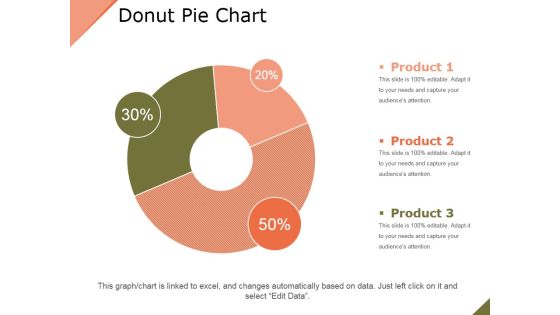
Donut Pie Chart Ppt PowerPoint Presentation Layouts Outfit
This is a donut pie chart ppt powerpoint presentation layouts outfit. This is a three stage process. The stages in this process are product, business, percentage, finance, marketing.
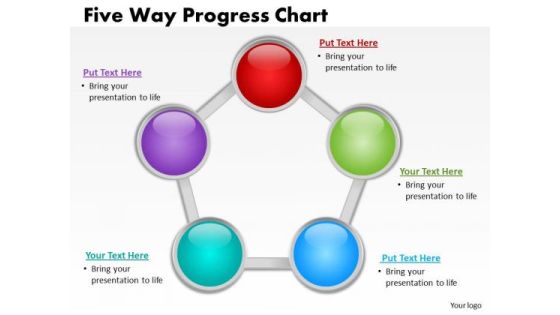
Business Finance Strategy Development Five Way Progress Chart Sales Diagram
Be the doer with our Business Finance Strategy Development Five Way Progress Chart Sales Diagram Powerpoint Templates. Put your thoughts into practice. Your ideas will do the trick. Wave the wand with our Business Finance Strategy Development Five Way Progress Chart Sales Diagram Powerpoint Templates.
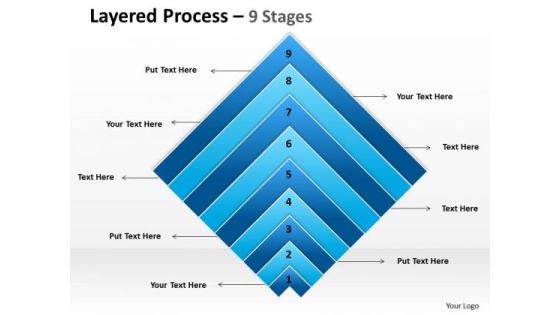
Business Finance Strategy Development Layered Chart Sales Diagram
Analyze Ailments On Our Business Finance Strategy Development Layered chart Sales Diagram Powerpoint Templates. Bring Out The Thinking Doctor In You. Dock Your Thoughts With Our Business Finance Strategy Development Layered chart Sales Diagram Powerpoint Templates. They Will Launch Them Into Orbit.
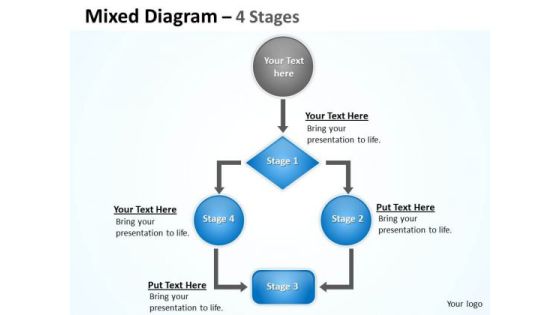
Business Finance Strategy Development Flow Chart Sales Diagram
Analyze Ailments On Our Business Finance Strategy Development Flow Chart Sales Diagram Powerpoint Templates. Bring Out The Thinking Doctor In You. Dock Your Thoughts With Our Business Finance Strategy Development Flow Chart Sales Diagram Powerpoint Templates. They Will Launch Them Into Orbit.
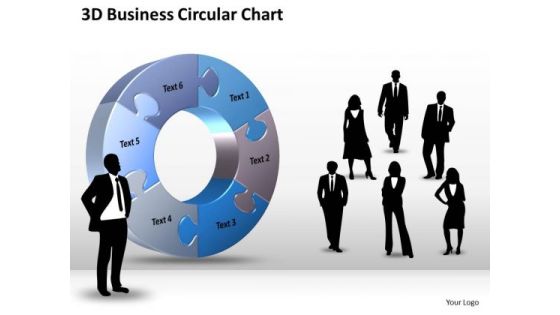
Business Finance Strategy Development 3d Business Circular Chart Sales Diagram
Analyze Ailments On Our Business Finance Strategy Development 3D Business Circular Chart Sales Diagram Powerpoint Templates. Bring Out The Thinking Doctor In You. Dock Your Thoughts With Our Business Finance Strategy Development 3D Business Circular Chart Sales Diagram Powerpoint Templates. They Will Launch Them Into Orbit.
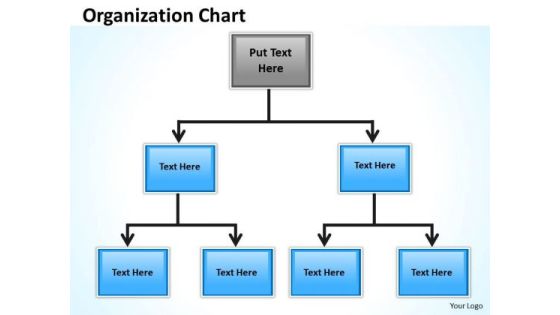
Business Cycle Diagram Origanization Chart Business Finance Strategy Development
Establish The Dominance Of Your Ideas. Our Business Cycle Diagram Origanization Chart Business Finance Strategy Development Powerpoint Templates Will Put Them On Top. Put Yourself In A Dominant Position. Our Business Cycle Diagram Origanization Chart Business Finance Strategy Development Powerpoint Templates Will Confirm Your Superiority.

Business Cycle Diagram Origanization Circular Chart Business Finance Strategy Development
Dominate Proceedings With Your Ideas. Our Business Cycle Diagram Origanization Circular Chart Business Finance Strategy Development Powerpoint Templates Will Empower Your Thoughts. Our Business Cycle Diagram Origanization Circular Chart Business Finance Strategy Development Powerpoint Templates Have A Domino Effect. Your Ideas Will Generate One After Another.
Chart Variations To Compare Quarterly Performance Ppt Icon
This is a chart variations to compare quarterly performance ppt icon. This is a five stage process. The stages in this process are series, business, marketing, finance, success.

Strategic Management Organization Chart Templates Business Finance Strategy Development
Draw Up Your Agenda On Our Strategic Management Organization chart templates Business Finance Strategy Development Powerpoint Templates. Coax Your Audience Into Acceptance. Draw The Debate To A Close. Arrive At Conclusions With Our Strategic Management Organization chart templates Business Finance Strategy Development Powerpoint Templates.

Selection Of The Optimal Portfolio Chart Ppt Slides
This is a selection of the optimal portfolio chart ppt slides. This is a five stage process. The stages in this process are business, finance, marketing.

Overall Revenue Analysis Bar Chart Powerpoint Slide Information
This is a overall revenue analysis bar chart powerpoint slide information. This is a nine stage process. The stages in this process are finance, success, business, marketing, percentage.
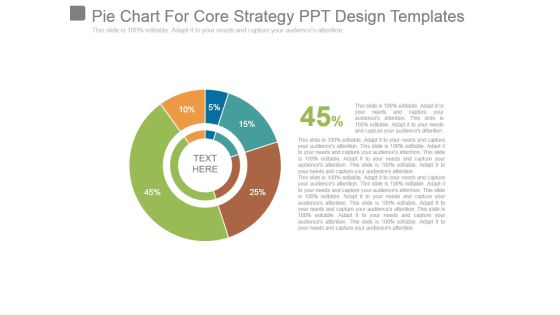
Pie Chart For Core Strategy Ppt Design Templates
This is a pie chart for core strategy ppt design templates. This is a five stage process. The stages in this process are business, marketing, strategy, finance, percentage.

Pie Chart For Result Analysis Ppt Example File
This is a pie chart for result analysis ppt example file. This is a seven stage process. The stages in this process are pie, marketing, strategy, finance, percentage.

combo chart template 1 ppt powerpoint presentation show
This is a combo chart template 1 ppt powerpoint presentation show. This is a four stage process. The stages in this process are business, marketing, finance, analysis, growth.
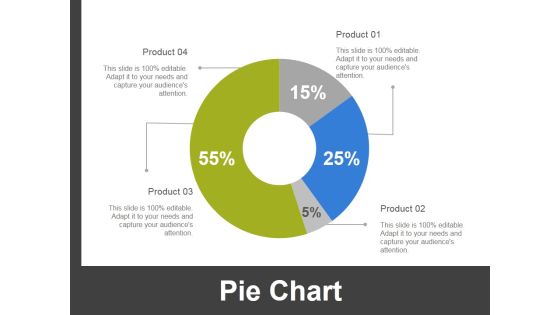
Pie Chart Ppt PowerPoint Presentation Infographic Template Deck
This is a pie chart ppt powerpoint presentation infographic template deck. This is a four stage process. The stages in this process are business, finance, marketing, strategy, analysis.

Area Chart Ppt PowerPoint Presentation Show Graphic Images
This is a area chart ppt powerpoint presentation show graphic images. This is a two stage process. The stages in this process are business, marketing, management, finance, growth.

Area Chart Ppt PowerPoint Presentation Gallery Example Topics
This is a area chart ppt powerpoint presentation gallery example topics. This is a two stage process. The stages in this process are product, growth, finance, management, business.
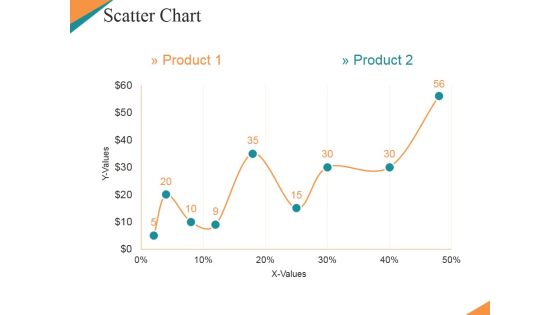
Scatter Chart Ppt PowerPoint Presentation Model Clipart Images
This is a scatter chart ppt powerpoint presentation model clipart images. This is a nine stage process. The stages in this process are finance, management, strategy, marketing, business.

Bar Chart Ppt PowerPoint Presentation Infographic Template Example
This is a bar chart ppt powerpoint presentation infographic template example. This is a seven stage process. The stages in this process are business, finance, marketing, percentage.

Donut Pie Chart Ppt PowerPoint Presentation Professional Templates
This is a donut pie chart ppt powerpoint presentation professional templates. This is a three stage process. The stages in this process are finance, donut, business, marketing, strategy.

Area Chart Ppt PowerPoint Presentation Gallery Clipart Images
This is a area chart ppt powerpoint presentation gallery clipart images. This is a two stage process. The stages in this process are product, profit, business, finance, marketing.

Donut Pie Chart Ppt PowerPoint Presentation Outline Graphics Example
This is a donut pie chart ppt powerpoint presentation outline graphics example. This is a five stage process. The stages in this process are percentage, finance, donut, business.

Pie Chart Ppt PowerPoint Presentation Slides Graphics Download
This is a pie chart ppt powerpoint presentation slides graphics download. This is a four stage process. The stages in this process are business, marketing, pie, finance, analysis.
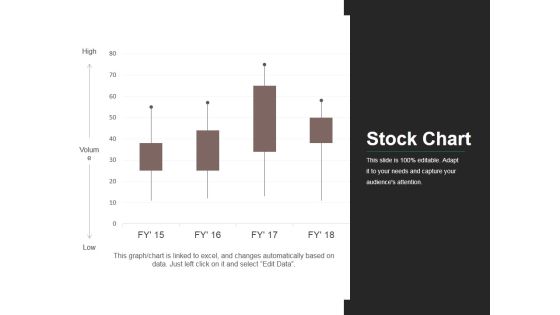
Stock Chart Ppt PowerPoint Presentation Infographic Template Elements
This is a stock chart ppt powerpoint presentation infographic template elements. This is a four stage process. The stages in this process are business, market, stock, finance, analysis.

Doughnut Chart Ppt PowerPoint Presentation Visual Aids Files
This is a doughnut chart ppt powerpoint presentation visual aids files. This is a three stage process. The stages in this process are finance, donut, percentage, business, marketing.

Radar Chart Ppt PowerPoint Presentation Portfolio Design Inspiration
This is a radar chart ppt powerpoint presentation portfolio design inspiration. This is a two stage process. The stages in this process are product, percentage, business, marketing, finance.

Radar Chart Ppt PowerPoint Presentation Summary Background Designs
This is a radar chart ppt powerpoint presentation summary background designs. This is a two stage process. The stages in this process are product, finance, business, marketing.

Area Chart Ppt PowerPoint Presentation Model Example Topics
This is a area chart ppt powerpoint presentation model example topics. This is a two stage process. The stages in this process are product, percentage, business, marketing, finance.
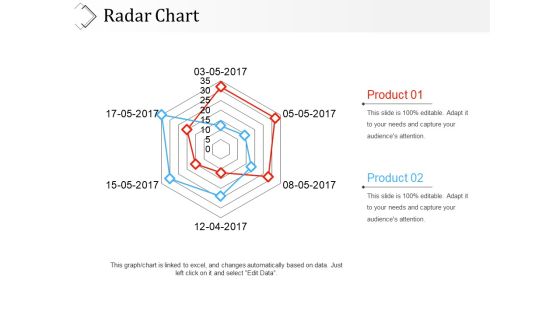
Radar Chart Ppt PowerPoint Presentation File Graphic Tips
This is a radar chart ppt powerpoint presentation file graphic tips. This is a two stage process. The stages in this process are product, finance, marketing, business.

Donut Pie Chart Ppt PowerPoint Presentation File Mockup
This is a donut pie chart ppt powerpoint presentation file mockup. This is a three stage process. The stages in this process are finance, business, percentage, marketing.
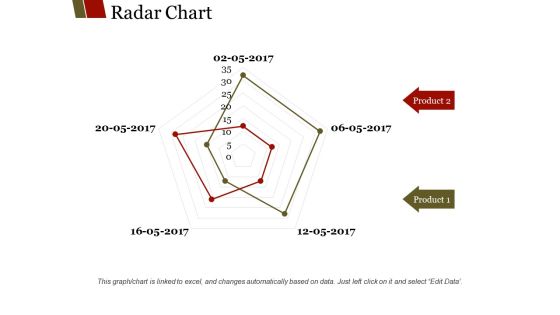
Radar Chart Ppt PowerPoint Presentation Summary Slide Portrait
This is a radar chart ppt powerpoint presentation summary slide portrait. This is a two stage process. The stages in this process are product, business, marketing, finance.
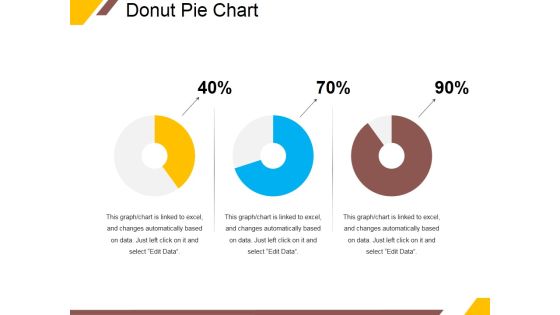
Donut Pie Chart Ppt PowerPoint Presentation Ideas Portrait
This is a donut pie chart ppt powerpoint presentation ideas portrait. This is a three stage process. The stages in this process are percentage, finance, donut, business.
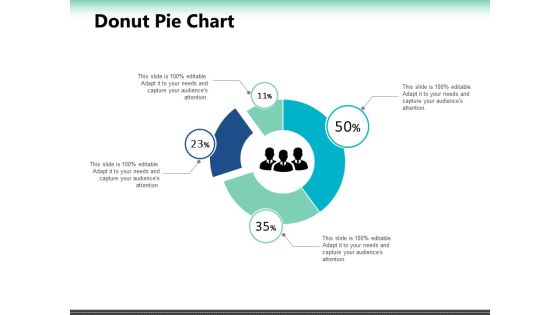
Donut Pie Chart Ppt PowerPoint Presentation Outline Deck
This is a donut pie chart ppt powerpoint presentation outline deck. This is a four stage process. The stages in this process are finance, business, marketing, management, percentage.

Combo Chart Template 2 Ppt PowerPoint Presentation Graphics
This is a combo chart template 2 ppt powerpoint presentation graphics. This is a three stage process. The stages in this process are business, marketing, finance, growth, management.

Rescue Pie Chart Business PowerPoint Templates And PowerPoint Themes 1112
Rescue Pie Chart Business PowerPoint Templates And PowerPoint Themes 1112-This Awesome PowerPoint template contains a diagram of lifesaver and pie chart. This image depicts the concept of statistics. Adjust the above image in your PPT presentations to visually support your content in your Business and Marketing PPT slideshows. Present your views using our innovative slides and be assured of leaving a lasting impression.-Rescue Pie Chart Business PowerPoint Templates And PowerPoint Themes 1112-This PowerPoint template can be used for presentations relating to-Lifesaver and Pie Chart, Symbol, Finance, Marketing, Business, Metaphor
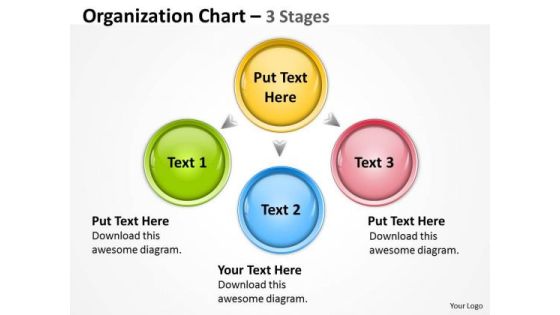
Business Finance Strategy Development Organization Chart Stages Business Framework Model
Plan For All Contingencies With OurBusiness Finance Strategy Development Organization Chart Stages Business Framework Model Powerpoint Templates. Douse The Fire Before It Catches. Generate Camaraderie With Our Business Finance Strategy Development Organization Chart Stages Business Framework Model Powerpoint Templates. Good Wishes Will Come Raining Down.

Activities And Functional Process Chart Powerpoint Slide Images
This is a activities and functional process chart powerpoint slide images. This is a four stage process. The stages in this process are marketing, finance, logistic, validate.
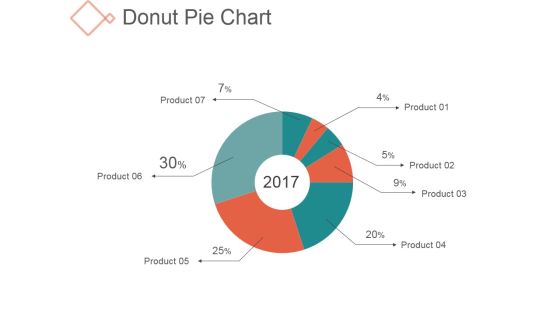
Donut Pie Chart Ppt PowerPoint Presentation Background Images
This is a donut pie chart ppt powerpoint presentation background images. This is a seven stage process. The stages in this process are management, business, finance, percentage.

Column Chart Ppt PowerPoint Presentation Portfolio Graphics Template
This is a column chart ppt powerpoint presentation portfolio graphics template. This is a six stage process. The stages in this process are product, finance, growth, success, business.

Combo Chart Ppt PowerPoint Presentation Professional Graphics Example
This is a combo chart ppt powerpoint presentation professional graphics example. This is a eight stage process. The stages in this process are product, finance, growth, success, business.

Stock Chart Ppt PowerPoint Presentation Summary Graphics Pictures
This is a stock chart ppt powerpoint presentation summary graphics pictures. This is a five stage process. The stages in this process are high, volume, low, close, finance.

Donut Pie Chart Ppt PowerPoint Presentation Slides Example
This is a donut pie chart ppt powerpoint presentation slides example. This is a five stage process. The stages in this process are product, finance, business, process.

Daunt Pie Chart Ppt PowerPoint Presentation Layouts Portrait
This is a daunt pie chart ppt powerpoint presentation layouts portrait. This is a three stage process. The stages in this process are percentage, finance, donut, business.

Donut Pie Chart Ppt PowerPoint Presentation Show Topics
This is a donut pie chart ppt powerpoint presentation show topics. This is a three stage process. The stages in this process are percentage, finance, donut, business.
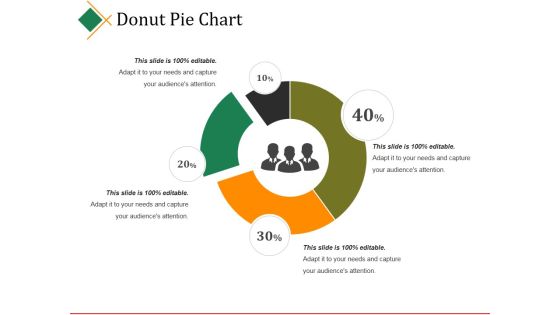
Donut Pie Chart Ppt PowerPoint Presentation Outline Microsoft
This is a donut pie chart ppt powerpoint presentation outline microsoft. This is a four stage process. The stages in this process are percentage, finance, donut, business.
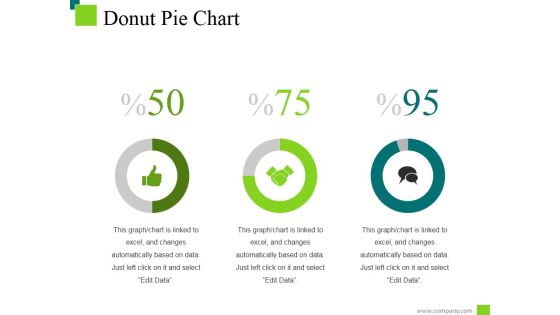
Donut Pie Chart Ppt PowerPoint Presentation Inspiration Deck
This is a donut pie chart ppt powerpoint presentation inspiration deck. This is a three stage process. The stages in this process are percentage, finance, donut, business.

Donut Pie Chart Ppt PowerPoint Presentation Model Pictures
This is a donut pie chart ppt powerpoint presentation model pictures. This is a six stage process. The stages in this process are product, percentage, finance, year, business.
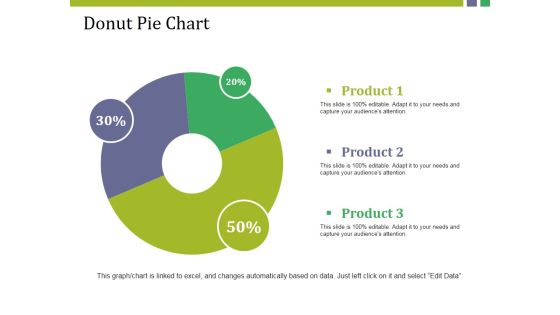
Donut Pie Chart Ppt PowerPoint Presentation Model Show
This is a donut pie chart ppt powerpoint presentation model show. This is a three stage process. The stages in this process are product, donut, percentage, finance, business.
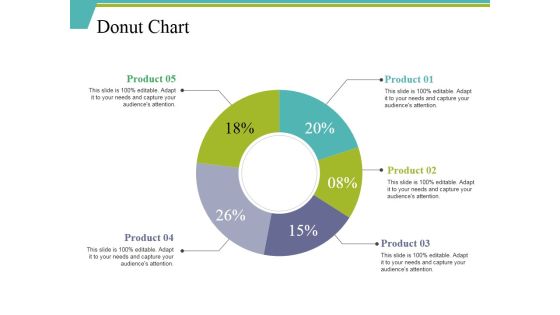
Donut Chart Ppt PowerPoint Presentation Ideas Background Designs
This is a donut chart ppt powerpoint presentation ideas background designs. This is a five stage process. The stages in this process are percentage, finance, donut, business, product.
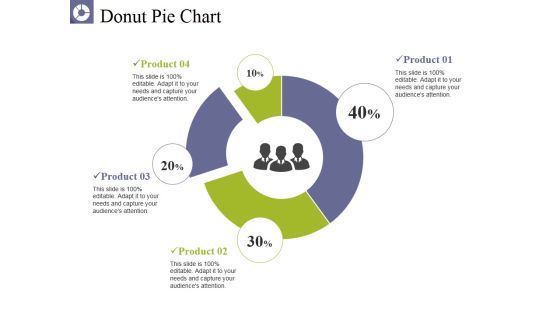
Donut Pie Chart Ppt PowerPoint Presentation Pictures Graphics
This is a donut pie chart ppt powerpoint presentation pictures graphics. This is a four stage process. The stages in this process are product, business, percentage, donut, finance.

Donut Pie Chart Ppt PowerPoint Presentation Outline Mockup
This is a donut pie chart ppt powerpoint presentation outline mockup. This is a four stage process. The stages in this process are product, donut, percentage, finance, business.
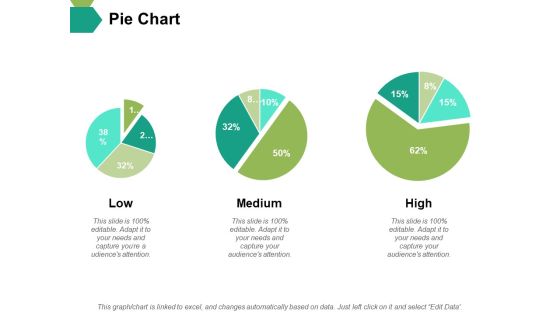
Pie Chart Ppt PowerPoint Presentation Slides Master Slide
This is a pie chart ppt powerpoint presentation slides master slide. This is a three stage process. The stages in this process are pie, process, percentage, finance, business.

Area Chart Analysis Ppt PowerPoint Presentation Layouts Graphics Design
Presenting this set of slides with name area chart analysis ppt powerpoint presentation layouts graphics design. The topics discussed in these slides are area chart, finance, marketing, management, investment. This is a completely editable PowerPoint presentation and is available for immediate download. Download now and impress your audience.

Bar Chart Analysis Ppt PowerPoint Presentation Infographic Template Infographics
Presenting this set of slides with name bar chart analysis ppt powerpoint presentation infographic template infographics. The topics discussed in these slides are bar chart, finance, marketing, management, investment. This is a completely editable PowerPoint presentation and is available for immediate download. Download now and impress your audience.
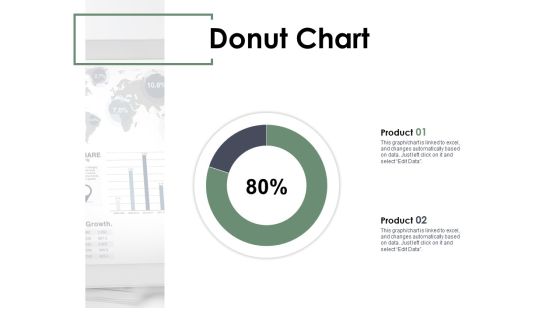
Donut Chart Analysis Ppt PowerPoint Presentation Summary Elements
Presenting this set of slides with name donut chart analysis ppt powerpoint presentation summary elements. The topics discussed in these slides are donut chart, finance, marketing, management, investment. This is a completely editable PowerPoint presentation and is available for immediate download. Download now and impress your audience.
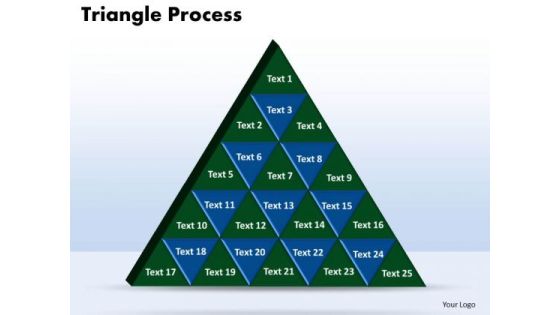
PowerPoint Slide Designs Triangle Process Chart Ppt Template
PowerPoint Slide Designs triangle process Chart PPT Template-Use this diagram to show containment, proportional, or interconnected relationships. You can add text in the triangular shapes-Business, chart, color, concept, conceptual, construction, corporate, creating, data, design, diagram, direction, focus, graph, group, growth, hierarchy, illustration, information, isolated, layer, layered, level, manage, management, model, object, organization, performance, population, presentation, principal, process, progress, pyramid, rank, resource, shape, stage, structure, support, symbol, top, triangle, vector-PowerPoint Slide Designs triangle process Chart PPT Template
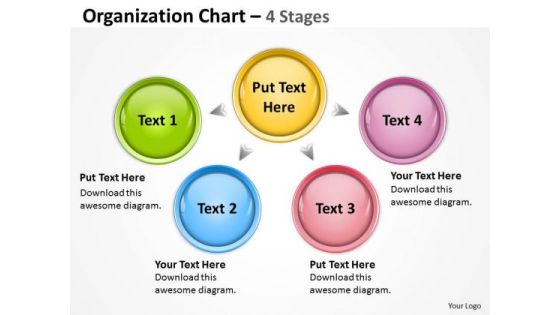
Business Finance Strategy Development Organization Chart Mba Models And Frameworks
Rake In The Dough With Your Ideas. Profits Will Rise With Our Business Finance Strategy Development Organization Chart MBA models and frameworks Powerpoint Templates. Dowse The Flames With Our Business Finance Strategy Development Organization Chart MBA models and frameworks Powerpoint Templates. Put Out The Fire Before It Starts.
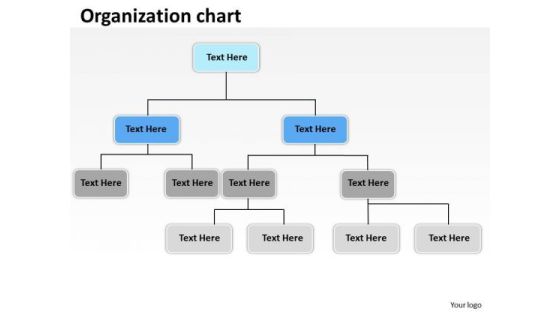
Business Framework Model Oraganization Chart Business Finance Strategy Development
Put Them On The Same Page With Our Business Framework Model Oraganization chart Business Finance Strategy Development Powerpoint Templates. Your Team Will Sing From The Same Sheet. Push The Envelope With Our Business Framework Model Oraganization chart Business Finance Strategy Development Powerpoint Templates. Let Your Thoughts Rise Above The Norm.
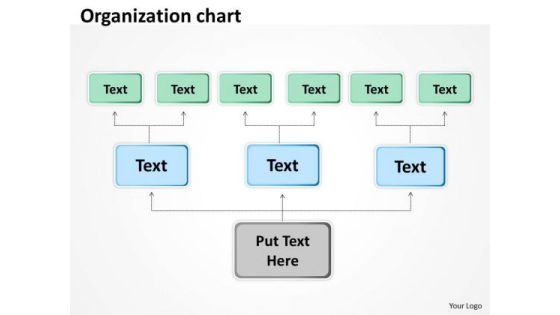
Strategic Management Organization Chart Colorful Business Finance Strategy Development
Lower The Drawbridge With Our Strategic Management Organization chart colorful Business Finance Strategy Development Powerpoint Templates. Capture The Minds Of Your Audience. Cajole Them With Our Strategic Management Organization chart colorful Business Finance Strategy Development Powerpoint Templates. Your Audience Will Be Drawn To Your Ideas.
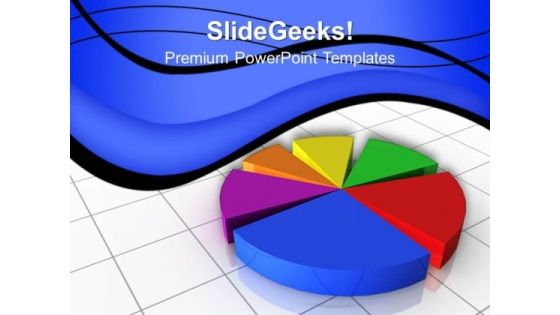
Pie Chart Marketing PowerPoint Templates And PowerPoint Themes 1012
Pie Chart Marketing PowerPoint Templates And PowerPoint Themes 1012-Use this Pie Chart Based PowerPoint Template to illustrate the main components required for the Growth of the Company. It shows seven major factors required. Now use this template to enlighten your team and colleagues on the critical factors involved. Use our PowerPoint templates to spread the good word, be assured by all you will be keenly heard.-Pie Chart Marketing PowerPoint Templates And PowerPoint Themes 1012-This PowerPoint template can be used for presentations relating to-Vector Pie Chart, Marketing, Business, Sales, Success, Competition
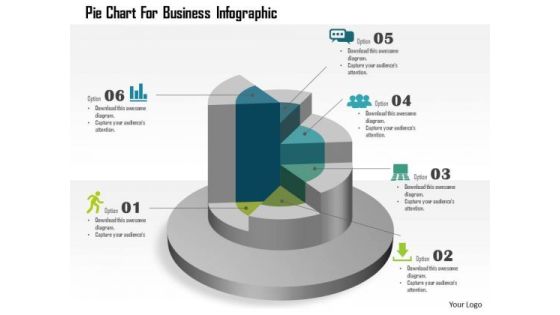
Business Diagram Pie Chart For Business Infographic Presentation Template
This template displays pie chart business infographic. You may download this business slide for result analysis. Amplify your thoughts via this appropriate business template.

Ppt Linear Work Flow Chart PowerPoint 7 Stages5 Templates
PPT linear work flow chart powerpoint 7 stages5 Templates-You can easily collaborate this PowerPoint diagram with colleagues to create detailed process diagrams and use them as a key element in streamlining your processes. -PPT linear work flow chart powerpoint 7 stages5 Templates-Abstract, Arrow, Blank, Business, Chart, Concept, Conceptual, Design, Diagram, Executive, Icon, Idea, Illustration, Management, Model, Numbers, Organization, Procedure, Process, Progression, Resource, Sequence, Sequential, Stages, Steps, Strategy

PowerPoint Design Slides Diagram Circular Chart Ppt Designs
PowerPoint Design Slides Diagram circular chart PPT Designs-The Circle of Life - a concept emmbedded in our minds and hence easy to comprehend. Life and Business is made up of processes comprising stages that flow from one to another. An excellent graphic to attract the attention of and understanding by your audience to improve earnings.-These amazing PowerPoint pre-designed slides and PowerPoint templates have been carefully created by our team of experts to help you impress your audience. Our stunning collection of Powerpoint slides are 100% editable and can easily fit in any PowerPoint presentations. By using these animations and graphics in PowerPoint and you can easily make professional presentations. Any text can be entered at any point in the PowerPoint template or slide. Just DOWNLOAD our awesome PowerPoint templates and you are ready to go.

Business Strategy Examples 3d Man With Growth Chart Concepts
Good Camaraderie Is A Key To Teamwork. Our business strategy examples 3d man with growth chart concepts Powerpoint Templates Can Be A Cementing Force.
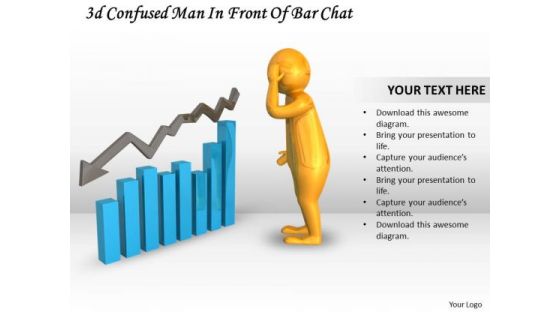
Marketing Concepts 3d Confused Man Front Of Bar Chart Characters
Drum It Up With Our marketing concepts 3d confused man front of bar chart characters Powerpoint Templates. Your Thoughts Will Raise The Tempo.
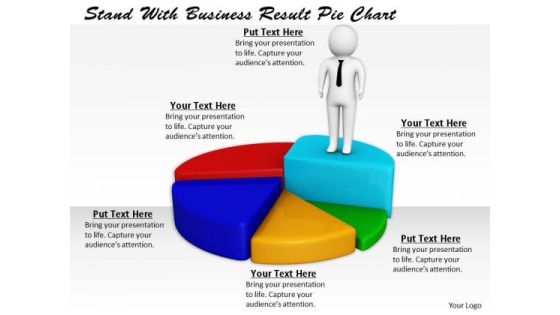
Business Strategy Execution Stand With Result Pie Chart Basic Concepts
Double The Impact With Our business strategy execution stand with result pie chart basic concepts Powerpoint Templates. Your Thoughts Will Have An Imposing Effect.

Stock Chart Ppt PowerPoint Presentation Gallery Graphic Images
This is a stock chart ppt powerpoint presentation gallery graphic images. This is a five stage process. The stages in this process are close, high, volume, low, open.
 Home
Home