Budget Chart

Column Chart Ppt PowerPoint Presentation Layouts Graphic Images
This is a column chart ppt powerpoint presentation layouts graphic images. This is a two stage process. The stages in this process are business, finance, years, graph, expenditure in, marketing.

Column Chart Ppt PowerPoint Presentation Outline Design Ideas
This is a column chart ppt powerpoint presentation outline design ideas. This is a two stage process. The stages in this process are business, years, expenditure in, marketing, finance.

Combo Chart Ppt PowerPoint Presentation Gallery Design Ideas
This is a combo chart ppt powerpoint presentation gallery design ideas. This is a three stage process. The stages in this process are business, financial years, sales in percentage, finance, graph.

Area Chart Ppt PowerPoint Presentation Outline Graphics Pictures
This is a area chart ppt powerpoint presentation outline graphics pictures. This is a two stage process. The stages in this process are financial year, in percentage, business, marketing, finance.

Area Chart Ppt PowerPoint Presentation Layouts Graphic Images
This is a area chart ppt powerpoint presentation layouts graphic images. This is a three stage process. The stages in this process are business, in years, marketing, in percentage, finance, graph.

Corporate Governance Flow Chart Ppt PowerPoint Presentation Show Diagrams
Presenting this set of slides with name corporate governance flow chart ppt powerpoint presentation show diagrams. This is a five stage process. The stages in this process are headquarters, manufacturing, marketing, finance, other functions. This is a completely editable PowerPoint presentation and is available for immediate download. Download now and impress your audience.

Column Chart Ppt PowerPoint Presentation Infographic Template Icon
This is a column chart ppt powerpoint presentation infographic template icon. This is a two stage process. The stages in this process are business, marketing, sales in percentage, financial year, graph.
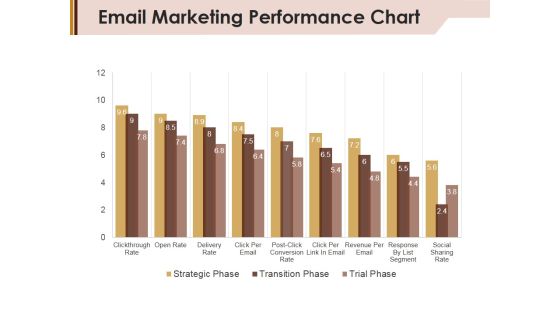
Email Marketing Performance Chart Ppt Powerpoint Presentation Layouts Graphics Pictures
This is a email marketing performance chart ppt powerpoint presentation layouts graphics pictures. This is a nine stage process. The stages in this process are strategic phase, transition phase, trial phase.
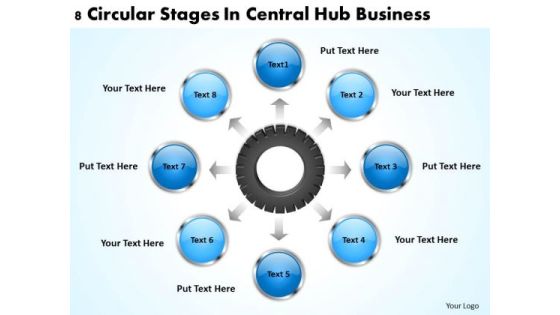
Business Process Flow Chart Examples Central Hub PowerPoint Theme Templates
We present our business process flow chart examples central hub powerpoint theme templates.Download our Advertising PowerPoint Templates because Our PowerPoint Templates and Slides will give good value for money. They also have respect for the value of your time. Use our Circle Charts PowerPoint Templates because Our PowerPoint Templates and Slides will fulfill your every need. Use them and effectively satisfy the desires of your audience. Download our Business PowerPoint Templates because You should Press the right buttons with our PowerPoint Templates and Slides. They will take your ideas down the perfect channel. Present our Process and Flows PowerPoint Templates because Our PowerPoint Templates and Slides will Embellish your thoughts. They will help you illustrate the brilliance of your ideas. Download our Arrows PowerPoint Templates because Our PowerPoint Templates and Slides provide you with a vast range of viable options. Select the appropriate ones and just fill in your text. Use these PowerPoint slides for presentations relating to 3d, Act, Arrow, Blue, Business, Chart, Circle, Concept, Control, Cycle, Design, Development, Diagram, Evaluate, Flow, Flow-Chart, Flowchart, Fresh, Graphic, Green, Idea, Infographic, Iterative, Life, Life-Cycle, Lifecycle, Management, Method, Model, Orange, Process, Purple, Quality, Rainbow, Red, Research, Schema, Spiral, Step, Strategy, Success, System, Vector, White, Work, Workflow, Yellow. The prominent colors used in the PowerPoint template are Blue, Blue light, Gray.
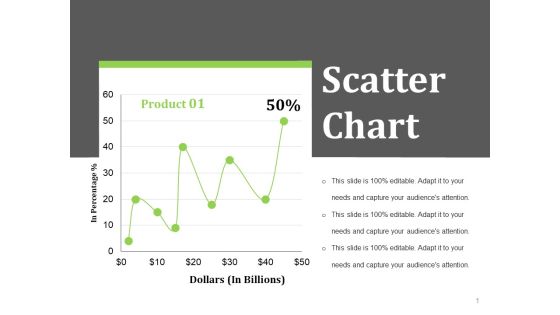
Scatter Chart Ppt PowerPoint Presentation Styles Layout Ideas
This is a scatter chart ppt powerpoint presentation styles layout ideas. This is a one stage process. The stages in this process are dollars in billions, in percentage, business, finance.

Donut Pie Chart Ppt PowerPoint Presentation Professional Example File
This is a donut pie chart ppt powerpoint presentation professional example file. This is a four stage process. The stages in this process are percentage, finance, donut, business, process.

Donut Pie Chart Ppt PowerPoint Presentation Visual Aids Model
This is a donut pie chart ppt powerpoint presentation visual aids model. This is a four stage process. The stages in this process are product, percentage, finance, donut, business.

Donut Pie Chart Ppt PowerPoint Presentation Pictures Layout Ideas
This is a donut pie chart ppt powerpoint presentation pictures layout ideas. This is a four stage process. The stages in this process are percentage, finance, donut, business, product.
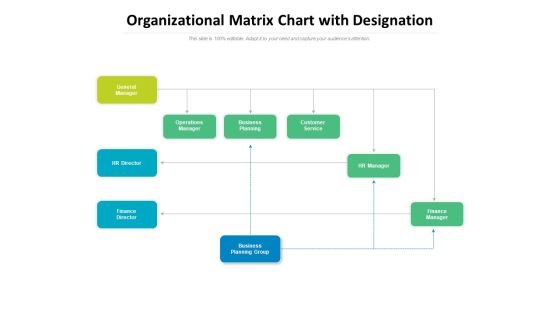
Organizational Matrix Chart With Designation Ppt PowerPoint Presentation File Infographics
Presenting this set of slides with name organizational matrix chart with designation ppt powerpoint presentation file infographics. This is a nine stage process. The stages in this process are general manager, finance director, business planning group, hr manager, customer service, business planning. This is a completely editable PowerPoint presentation and is available for immediate download. Download now and impress your audience.

Pareto Chart Ppt PowerPoint Presentation File Infographic Template
This is a pareto chart ppt powerpoint presentation file infographic template. This is a six stage process. The stages in this process are number of defects, business, marketing, graph.
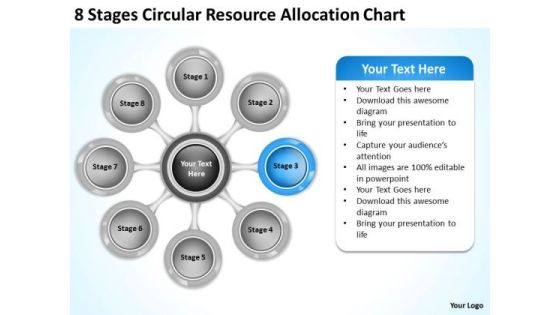
Business Strategy Execution Circular Resource Allocation Chart Concepts
We present our business strategy execution circular resource allocation chart concepts.Use our Process and Flows PowerPoint Templates because Our PowerPoint Templates and Slides will definately Enhance the stature of your presentation. Adorn the beauty of your thoughts with their colourful backgrounds. Download and present our Arrows PowerPoint Templates because Our PowerPoint Templates and Slides are topically designed to provide an attractive backdrop to any subject. Use our Circle Charts PowerPoint Templates because It will Raise the bar of your Thoughts. They are programmed to take you to the next level. Download our Shapes PowerPoint Templates because They will Put your wonderful verbal artistry on display. Our PowerPoint Templates and Slides will provide you the necessary glam and glitter. Present our Business PowerPoint Templates because It is Aesthetically crafted by artistic young minds. Our PowerPoint Templates and Slides are designed to display your dexterity.Use these PowerPoint slides for presentations relating to Business, central, centralized, chart, circle, circular, circulation, concept, conceptual, converging, design, diagram, executive, five, icon, idea, illustration, management, map, mapping, model, numbers, organization, outwards, pointing, procedure, process, resource, sequence, sequential, square, strategy, template. The prominent colors used in the PowerPoint template are Blue, Gray, Black.

Area Chart Finance Ppt PowerPoint Presentation Ideas Slideshow
This is a area chart finance ppt powerpoint presentation ideas slideshow. This is a two stage process. The stages in this process are area chart, analysis, finance, marketing, management.

Combo Chart Finance Ppt PowerPoint Presentation Slides Backgrounds
This is a combo chart finance ppt powerpoint presentation slides backgrounds. This is a three stage process. The stages in this process are combo chart, finance, marketing, analysis, business.

Bar Chart Finance Ppt Powerpoint Presentation Styles Skills
This is a bar chart finance ppt powerpoint presentation styles skills. This is a three stage process. The stages in this process are bar chart, finance, marketing, management, analysis.

Donut Chart Finance Ppt Powerpoint Presentation Infographic Template Slide Download
This is a donut chart finance ppt powerpoint presentation infographic template slide download. This is a three stage process. The stages in this process are donut chart, finance, marketing, management, analysis.

Combo Chart Finance Ppt PowerPoint Presentation Outline Example
This is a combo chart finance ppt powerpoint presentation outline example. This is a three stage process. The stages in this process are bar chart, finance, marketing, business, analysis.

Combo Chart Finance Marketing Ppt PowerPoint Presentation Layouts Design Templates
This is a combo chart finance marketing ppt powerpoint presentation layouts design templates. This is a three stage process. The stages in this process are combo chart, finance, marketing, business, analysis.

Bar Chart Finance Marketing Ppt PowerPoint Presentation Portfolio Slide
This is a bar chart finance marketing ppt powerpoint presentation portfolio slide. This is a two stage process. The stages in this process are bar chart, finance, marketing, business, analysis.
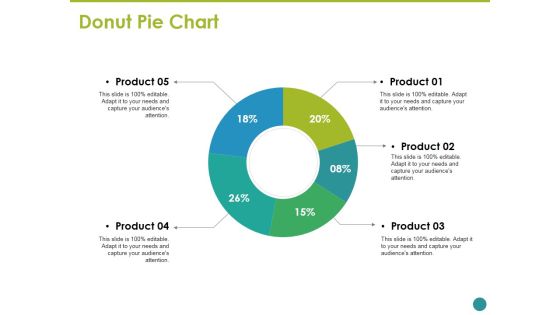
Donut Pie Chart Ppt PowerPoint Presentation Inspiration Graphic Images
This is a donut pie chart ppt powerpoint presentation inspiration graphic images. This is a five stage process. The stages in this process are business, marketing, strategy, planning, donut.

Pie Chart Ppt PowerPoint Presentation Infographic Template Vector
This is a pie chart ppt powerpoint presentation infographic template vector. This is a five stage process. The stages in this process are pie chart, finance, analysis, investment, business.

Area Chart Ppt PowerPoint Presentation Portfolio File Formats
This is a area chart ppt powerpoint presentation portfolio file formats. This is a two stage process. The stages in this process are area chart, finance, marketing, management, investment.

data collection and analysis control chart ppt powerpoint presentation styles
This is a data collection and analysis control chart ppt powerpoint presentation styles. This is a one stage process. The stages in this process are upper limit, centerline, plotted points, lower limit, point labels.
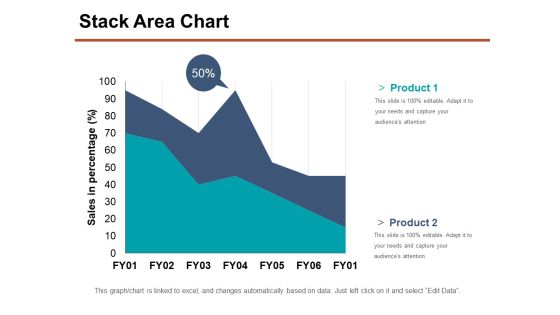
Stack Area Chart Ppt PowerPoint Presentation Show Samples
This is a stack area chart ppt powerpoint presentation show samples. This is a two stage process. The stages in this process are product, sales in percentage, business, marketing, percentage.

High Low Close Chart Ppt PowerPoint Presentation Layouts Objects
This is a high low close chart ppt powerpoint presentation layouts objects. This is a five stage process. The stages in this process are high, volume, low, business, marketing.
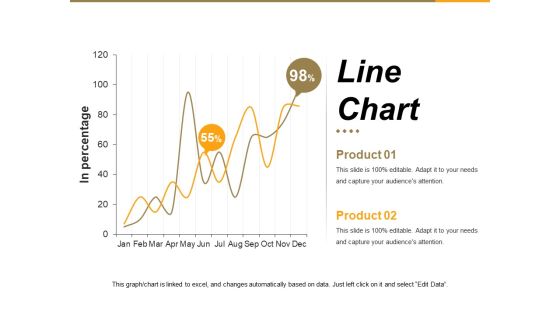
Line Chart Ppt PowerPoint Presentation Summary File Formats
This is a line chart ppt powerpoint presentation summary file formats. This is a two stage process. The stages in this process are in percentage, graph, business, marketing, growth.
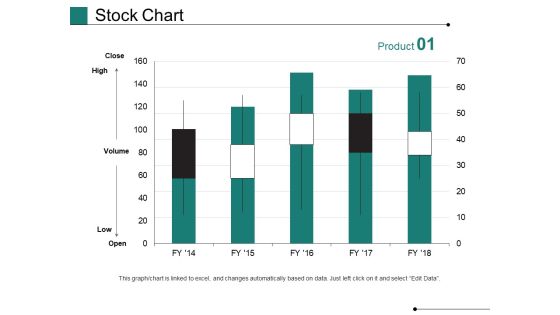
Stock Chart Ppt PowerPoint Presentation Pictures Graphics Design
This is a stock chart ppt powerpoint presentation pictures graphics design. This is a five stage process. The stages in this process are high, volume, low, business, marketing, graph.
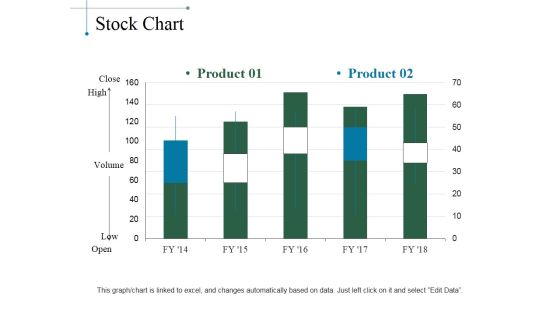
Stock Chart Ppt PowerPoint Presentation Layouts Designs Download
This is a stock chart ppt powerpoint presentation layouts designs download. This is a five stage process. The stages in this process are product, close, high, volume, low, open.

Volume High Low Close Chart Ppt PowerPoint Presentation Slides Styles
This is a volume high low close chart ppt powerpoint presentation slides styles. This is a two stage process. The stages in this process are high, volume, low, business, marketing.
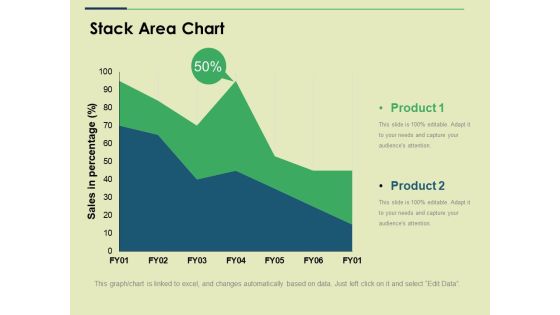
Stack Area Chart Ppt PowerPoint Presentation Show Slide
This is a stack area chart ppt powerpoint presentation show slide. This is a two stage process. The stages in this process are sales in percentage, business, marketing, strategy, graph.
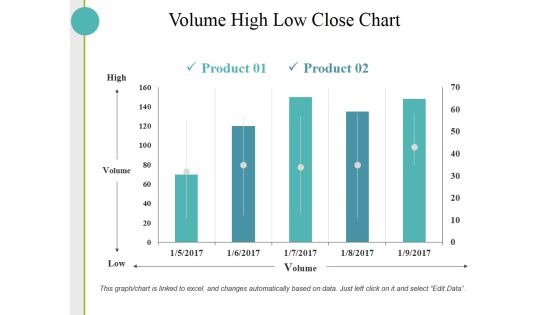
Volume High Low Close Chart Ppt PowerPoint Presentation Inspiration Skills
This is a volume high low close chart ppt powerpoint presentation inspiration skills. This is a two stage process. The stages in this process are high, volume, low, business.
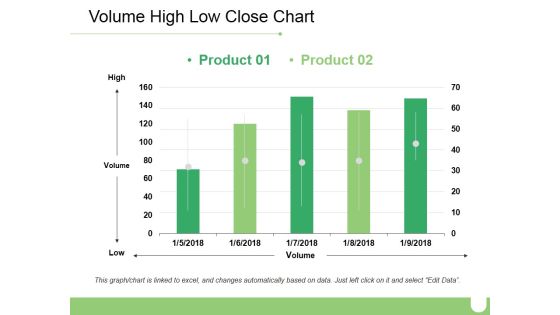
Volume High Low Close Chart Ppt PowerPoint Presentation Inspiration Brochure
This is a volume high low close chart ppt powerpoint presentation inspiration brochure. This is a two stage process. The stages in this process are business, high, volume, low, marketing.
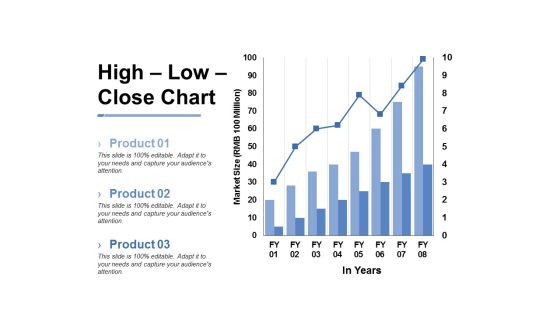
High Low Close Chart Ppt PowerPoint Presentation Inspiration Slide
This is a high low close chart ppt powerpoint presentation inspiration slide. This is a three stage process. The stages in this process are business, marketing, market size, in years, graph.
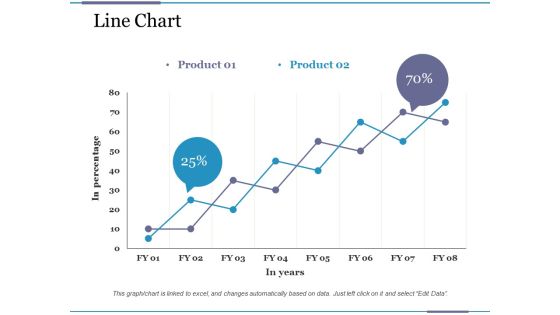
Line Chart Ppt PowerPoint Presentation Pictures File Formats
This is a line chart ppt powerpoint presentation pictures file formats. This is a two stage process. The stages in this process are business, financial, in percentage, in years, graph.

Combo Chart Ppt PowerPoint Presentation Summary Background Images
This is a combo chart ppt powerpoint presentation summary background images. This is a two stage process. The stages in this process are business, marketing, financial year, in percentage, graph.
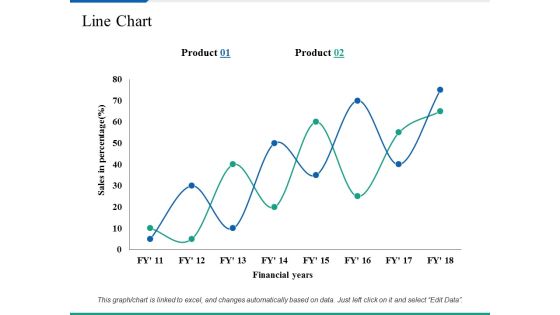
Line Chart Ppt PowerPoint Presentation Summary Clipart Images
This is a line chart ppt powerpoint presentation summary clipart images. This is a two stage process. The stages in this process are business, marketing, sales in percentage, financial years, strategy.

Clustered Column Chart Ppt PowerPoint Presentation Professional Ideas
This is a clustered column chart ppt powerpoint presentation professional ideas. This is a three stage process. The stages in this process are product, sales in percentage, column, years.

Donut Chart Marketing Product Ppt PowerPoint Presentation Slides Background Designs
This is a donut chart marketing product ppt powerpoint presentation slides background designs. This is a three stage process. The stages in this process are business, management, marketing, percentage, product.

Bubble Chart Product Ppt PowerPoint Presentation Inspiration Design Ideas
This is a bubble chart product ppt powerpoint presentation inspiration design ideas. This is a one stage process. The stages in this process are business, management, marketing, product, percentage.

Column Chart Marketing Strategy Ppt PowerPoint Presentation Layouts Slide Portrait
This is a column chart marketing strategy ppt powerpoint presentation layouts slide portrait. This is a two stage process. The stages in this process are percentage, product, business, management, marketing.
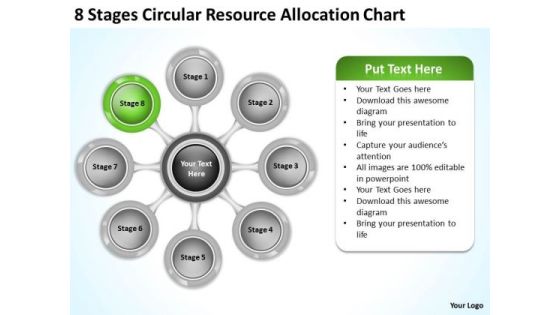
Marketing Concepts 8 Stages Circular Resource Allocation Chart Total
We present our marketing concepts 8 stages circular resource allocation chart total.Download and present our Arrows PowerPoint Templates because Our PowerPoint Templates and Slides offer you the widest possible range of options. Present our Circle Charts PowerPoint Templates because Our PowerPoint Templates and Slides are topically designed to provide an attractive backdrop to any subject. Download and present our Business PowerPoint Templates because Our PowerPoint Templates and Slides are Clear and concise. Use them and dispel any doubts your team may have. Present our Shapes PowerPoint Templates because You can Bait your audience with our PowerPoint Templates and Slides. They will bite the hook of your ideas in large numbers. Download our Process and Flows PowerPoint Templates because Our PowerPoint Templates and Slides will let your ideas bloom. Create a bed of roses for your audience.Use these PowerPoint slides for presentations relating to Chart, Diagram, Graph, Process, Vector, Business, Sequence, Feeds, Iteration, Concept, Rotation, Presentation, Circle, Dynamic, Report, Succession, Cycle, Progression, Iterative, Endless, Direction, Dependency, Production, Phase, Method, Company, Progress, Continuity, Path, Continuous, Arrows. The prominent colors used in the PowerPoint template are Green, Gray, Black.

Business Growth Strategy Circular Resource Allocation Chart Consultant
We present our business growth strategy circular resource allocation chart consultant.Download our Advertising PowerPoint Templates because Watching this your Audience will Grab their eyeballs, they wont even blink. Download and present our Process and Flows PowerPoint Templates because It will Strengthen your hand with your thoughts. They have all the aces you need to win the day. Present our Circle Charts PowerPoint Templates because Your audience will believe you are the cats whiskers. Download and present our Business PowerPoint Templates because Our PowerPoint Templates and Slides will provide you the cutting edge. Slice through the doubts in the minds of your listeners. Download and present our Metaphors-Visual Concepts PowerPoint Templates because Our PowerPoint Templates and Slides will effectively help you save your valuable time. They are readymade to fit into any presentation structure. Use these PowerPoint slides for presentations relating to Arrow, chart, circle, circular, circulation, concept, connection, continuity, correlate, course, cycle, cyclic, diagram, direction, duplicate, flow, iterate, jigsaw, link, manage, method, order, phase, presentation, procedure, process, react, recycle, refresh, relate, repeat, repetition, report, review, ring, rotation, round, section, segment, sequence, simple, stage, step, strategy, success, system, work flow. The prominent colors used in the PowerPoint template are Green, Black, Gray.
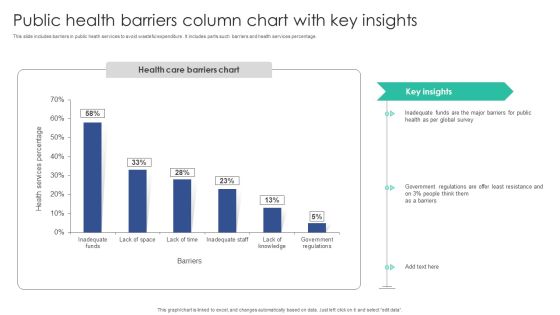
Public Health Barriers Column Chart With Key Insights Portrait PDF
This slide includes barriers in public heath services to avoid wasteful expenditure . It includes parts such barriers and health services percentage.Pitch your topic with ease and precision using this Public Health Barriers Column Chart With Key Insights Portrait PDF. This layout presents information on Inadequate Funds, Global Survey, Government Regulations. It is also available for immediate download and adjustment. So, changes can be made in the color, design, graphics or any other component to create a unique layout.

Explosive Growth Chart Finance PowerPoint Templates And PowerPoint Backgrounds 0611
Microsoft PowerPoint Template and Background with cash-flow statement with business graph and stock chart over an explosion
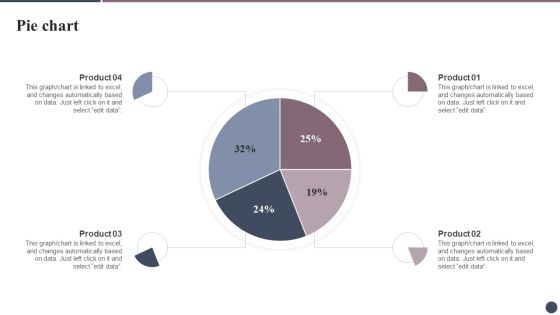
Expanding Target Audience With Cultural Branding Pie Chart Slides PDF
Slidegeeks is one of the best resources for PowerPoint templates. You can download easily and regulate Expanding Target Audience With Cultural Branding Pie Chart Slides PDF for your personal presentations from our wonderful collection. A few clicks is all it takes to discover and get the most relevant and appropriate templates. Use our Templates to add a unique zing and appeal to your presentation and meetings. All the slides are easy to edit and you can use them even for advertisement purposes.

Adopting Flexible Work Policy Clustered Column Chart Clipart PDF
Slidegeeks is one of the best resources for PowerPoint templates. You can download easily and regulate Adopting Flexible Work Policy Clustered Column Chart Clipart PDF for your personal presentations from our wonderful collection. A few clicks is all it takes to discover and get the most relevant and appropriate templates. Use our Templates to add a unique zing and appeal to your presentation and meetings. All the slides are easy to edit and you can use them even for advertisement purposes.
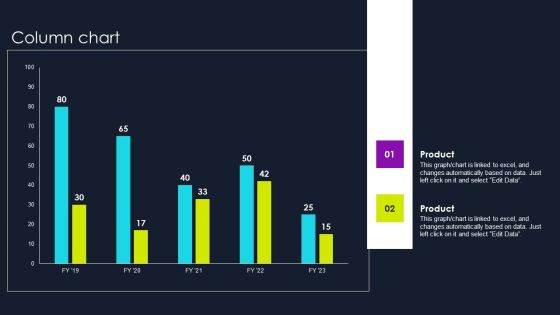
Lead Nurturing Tactics For Lead Generation Column Chart Graphics PDF
Slidegeeks is one of the best resources for PowerPoint templates. You can download easily and regulate Lead Nurturing Tactics For Lead Generation Column Chart Graphics PDF for your personal presentations from our wonderful collection. A few clicks is all it takes to discover and get the most relevant and appropriate templates. Use our Templates to add a unique zing and appeal to your presentation and meetings. All the slides are easy to edit and you can use them even for advertisement purposes.

Creating Employee Value Proposition Pie Chart Ppt Design Ideas PDF
The best PPT templates are a great way to save time, energy, and resources. Slidegeeks have 100 percent editable powerpoint slides making them incredibly versatile. With these quality presentation templates, you can create a captivating and memorable presentation by combining visually appealing slides and effectively communicating your message. Download Creating Employee Value Proposition Pie Chart Ppt Design Ideas PDF from Slidegeeks and deliver a wonderful presentation.
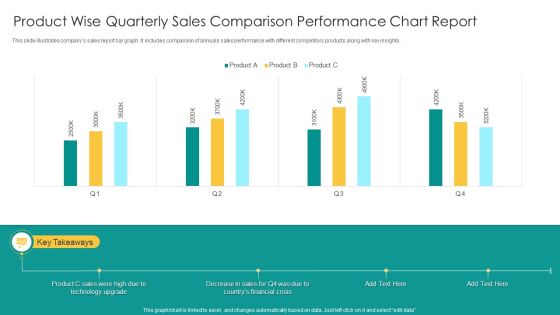
Product Wise Quarterly Sales Comparison Performance Chart Report Infographics PDF
This slide illustrates companys sales report bar graph. It includes comparison of annuals sales performance with different competitors products along with key insights. Showcasing this set of slides titled Product Wise Quarterly Sales Comparison Performance Chart Report Infographics PDF. The topics addressed in these templates are Product C Sales, Technology Upgrade, Financial Crisis. All the content presented in this PPT design is completely editable. Download it and make adjustments in color, background, font etc. as per your unique business setting.
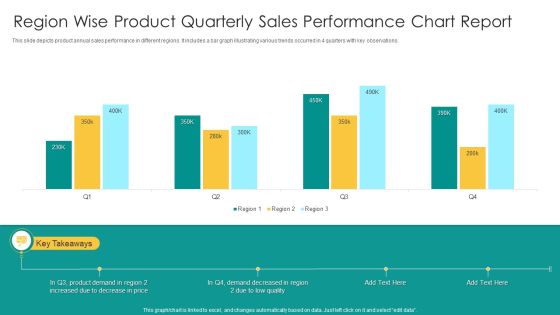
Region Wise Product Quarterly Sales Performance Chart Report Topics PDF
This slide depicts product annual sales performance in different regions. It includes a bar graph illustrating various trends occurred in 4 quarters with key observations. Showcasing this set of slides titled Region Wise Product Quarterly Sales Performance Chart Report Topics PDF. The topics addressed in these templates are Product Demand, Price, Low Quality. All the content presented in this PPT design is completely editable. Download it and make adjustments in color, background, font etc. as per your unique business setting.

IT Business Valuation Comparison Chart Ppt Model Themes PDF
This slide shows the comparison amongst valuation of three information technology companies. It includes data of last four years. Showcasing this set of slides titled IT Business Valuation Comparison Chart Ppt Model Themes PDF. The topics addressed in these templates are Key Takeaways, Increasing Competition, Innovative Products . All the content presented in this PPT design is completely editable. Download it and make adjustments in color, background, font etc. as per your unique business setting.

Iot Applications For Manufacturing Industry Column Chart Ideas PDF
This slide highlights the IoT implementation drivers for manufacturing and production sector which showcases it will improve operational efficiency, asset utilization and business process development. Do you have an important presentation coming up Are you looking for something that will make your presentation stand out from the rest Look no further than Iot Applications For Manufacturing Industry Column Chart Ideas PDF. With our professional designs, you can trust that your presentation will pop and make delivering it a smooth process. And with Slidegeeks, you can trust that your presentation will be unique and memorable. So why wait Grab Iot Applications For Manufacturing Industry Column Chart Ideas PDF today and make your presentation stand out from the rest.

PowerPoint Design Circle Chart Ring Process Ppt Template
PowerPoint Design Circle Chart Ring Process PPT template-These amazing PowerPoint pre-designed slides and PowerPoint templates have been carefully created by our team of experts to help you impress your audience. Our stunning collection of Powerpoint slides are 100% editable and can easily fit in any PowerPoint presentations. By using these animations and graphics in PowerPoint and you can easily make professional presentations. Any text can be entered at any point in the PowerPoint template or slide. Just DOWNLOAD our awesome PowerPoint templates and you are ready to go.

Bar Chart Ppt PowerPoint Presentation Infographic Template Brochure
This is a bar chart ppt powerpoint presentation infographic template brochure. This is a seven stage process. The stages in this process are bar graph, finance, marketing, strategy, analysis, business.

Company Introduction Chart With Market Share Portrait PDF
This slide showcases the enterprise introduction with a company overview. It also includes company details such as market share, target audience, key highlights, clients, financial highlights, etc. Showcasing this set of slides titled Company Introduction Chart With Market Share Portrait PDF. The topics addressed in these templates are Market Share, Financial Highlights, Target Audience. All the content presented in this PPT design is completely editable. Download it and make adjustments in color, background, font etc. as per your unique business setting.
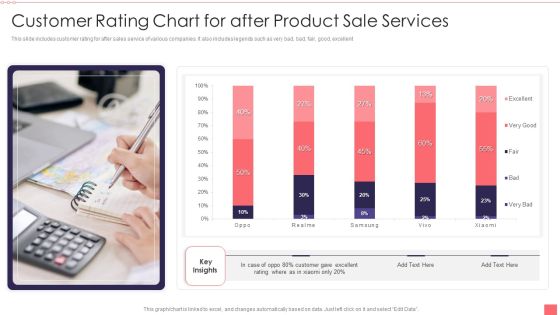
Customer Rating Chart For After Product Sale Services Download PDF
This slide includes customer rating for after sales service of various companies. It also includes legends such as very bad, bad, fair, good, excellent. Showcasing this set of slides titled Customer Rating Chart For After Product Sale Services Download PDF. The topics addressed in these templates are Customer, Product Sale Services. All the content presented in this PPT design is completely editable. Download it and make adjustments in color, background, font etc. as per your unique business setting.
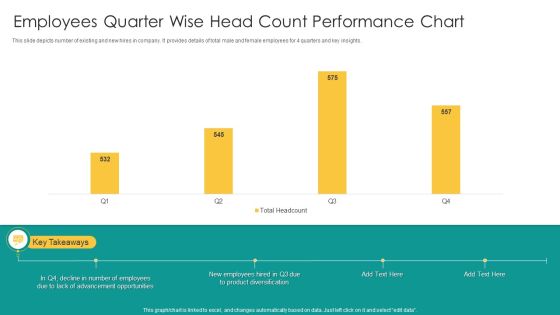
Employees Quarter Wise Head Count Performance Chart Clipart PDF
This slide depicts number of existing and new hires in company. It provides details of total male and female employees for 4 quarters and key insights. Showcasing this set of slides titled Employees Quarter Wise Head Count Performance Chart Clipart PDF. The topics addressed in these templates are New Employees, Product Diversification, Advancement Opportunities. All the content presented in this PPT design is completely editable. Download it and make adjustments in color, background, font etc. as per your unique business setting.
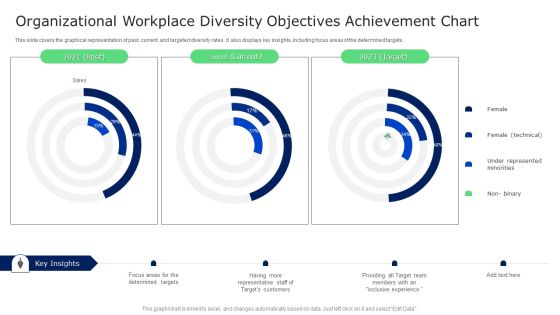
Organizational Workplace Diversity Objectives Achievement Chart Brochure PDF
This slide covers the graphical representation of past, current, and targeted diversity rates. It also displays key insights, including focus areas of the determined targets. Showcasing this set of slides titled Organizational Workplace Diversity Objectives Achievement Chart Brochure PDF. The topics addressed in these templates are Targets Customers, Determined Targets, Target Team. All the content presented in this PPT design is completely editable. Download it and make adjustments in color, background, font etc. as per your unique business setting.

Current Industrial Operation Expenses With Pie Chart Download PDF
This slide covers expenses of the industrial day to day basis and the amount of expenditure in percentage for various sectors. It includes insurance, cleaning, R and M, utilities , etc.Showcasing this set of slides titled Current Industrial Operation Expenses With Pie Chart Download PDF. The topics addressed in these templates are Roads Grounds, Insurance, Utilities. All the content presented in this PPT design is completely editable. Download it and make adjustments in color, background, font etc. as per your unique business setting.

Brand Assessment With Dough Nut Comparison Chart Elements PDF
This slide illustrates comparative analysis of brands of XYZ product. It includes their market size, key features of these brands. Showcasing this set of slides titled Brand Assessment With Dough Nut Comparison Chart Elements PDF. The topics addressed in these templates are Penetrative Pricing, Skimming Pricing, Competitive Pricing. All the content presented in this PPT design is completely editable. Download it and make adjustments in color, background, font etc. as per your unique business setting.

Cyber Risks And Incident Response Playbook Line Chart Professional PDF
The Cyber Risks And Incident Response Playbook Line Chart Professional PDF is a compilation of the most recent design trends as a series of slides. It is suitable for any subject or industry presentation, containing attractive visuals and photo spots for businesses to clearly express their messages. This template contains a variety of slides for the user to input data, such as structures to contrast two elements, bullet points, and slides for written information. Slidegeeks is prepared to create an impression.
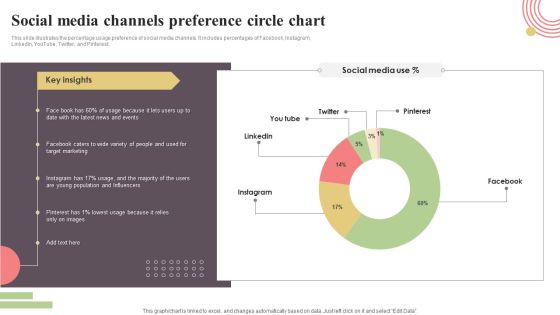
Social Media Channels Preference Circle Chart Clipart PDF
This slide illustrates the percentage usage preference of social media channels. It includes percentages of Facebook, Instagram, LinkedIn, YouTube, Twitter, and Pinterest. Showcasing this set of slides titled Social Media Channels Preference Circle Chart Clipart PDF. The topics addressed in these templates are Facebook, Instagram, Pinterest, Twitter, You Tube. All the content presented in this PPT design is completely editable. Download it and make adjustments in color, background, font etc. as per your unique business setting.

Risk Management Maturity Chart For Mineral Industry Clipart PDF
The slide demonstrates a mineral industry maturity table for maintaining standards of safety management systems. Various maturity levels included are vulnerable, reactive, compliant, proactive and resilient. Showcasing this set of slides titled Risk Management Maturity Chart For Mineral Industry Clipart PDF. The topics addressed in these templates are Communication, Risk Assessment, System. All the content presented in this PPT design is completely editable. Download it and make adjustments in color, background, font etc. as per your unique business setting.
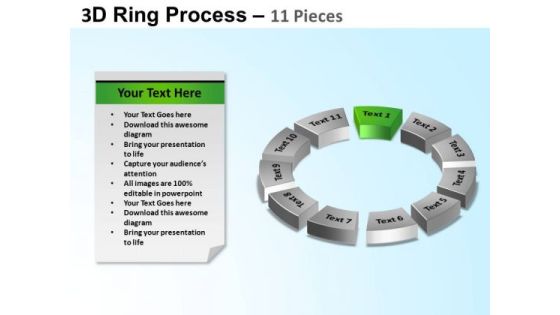
PowerPoint Design Circular Chart Ring Process Ppt Backgrounds
PowerPoint Design Circular Chart Ring Process PPT Backgrounds-These amazing PowerPoint pre-designed slides and PowerPoint templates have been carefully created by our team of experts to help you impress your audience. Our stunning collection of Powerpoint slides are 100% editable and can easily fit in any PowerPoint presentations. By using these animations and graphics in PowerPoint and you can easily make professional presentations. Any text can be entered at any point in the PowerPoint template or slide. Just DOWNLOAD our awesome PowerPoint templates and you are ready to go.

Project Scope Management Organization Chart Ppt Portfolio Images PDF
This is a project scope management organization chart ppt portfolio images pdf template with various stages. Focus and dispense information on three stages using this creative set, that comes with editable features. It contains large content boxes to add your information on topics like cost, risk, communication, procurement, quality. You can also showcase facts, figures, and other relevant content using this PPT layout. Grab it now.
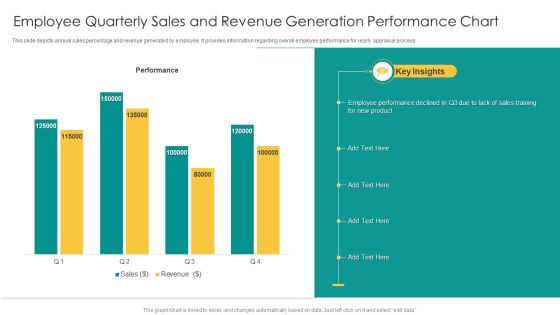
Employee Quarterly Sales And Revenue Generation Performance Chart Mockup PDF
This slide depicts annual sales percentage and revenue generated by employee. It provides information regarding overall employee performance for yearly appraisal process. Pitch your topic with ease and precision using this Employee Quarterly Sales And Revenue Generation Performance Chart Mockup PDF. This layout presents information on Performance, Sales, Revenue. It is also available for immediate download and adjustment. So, changes can be made in the color, design, graphics or any other component to create a unique layout.
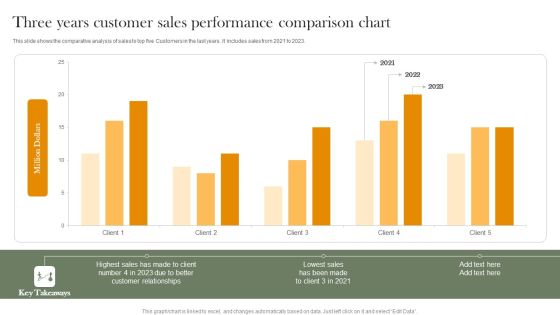
Three Years Customer Sales Performance Comparison Chart Professional PDF
This slide shows the comparative analysis of sales to top five Customers in the last years. It includes sales from 2021 to 2023. Pitch your topic with ease and precision using this Three Years Customer Sales Performance Comparison Chart Professional PDF. This layout presents information on Highest Sales, Customer Relationships, Lowest Sales. It is also available for immediate download and adjustment. So, changes can be made in the color, design, graphics or any other component to create a unique layout.

Business Components Share Exploded Donut Circle Chart Elements PDF
This slide depicts the share of business components for a successful company and earn profits. It shows the percentage distribution of different components of business. Pitch your topic with ease and precision using this Business Components Share Exploded Donut Circle Chart Elements PDF. This layout presents information on Administration, Marketing, Customer Support. It is also available for immediate download and adjustment. So, changes can be made in the color, design, graphics or any other component to create a unique layout.
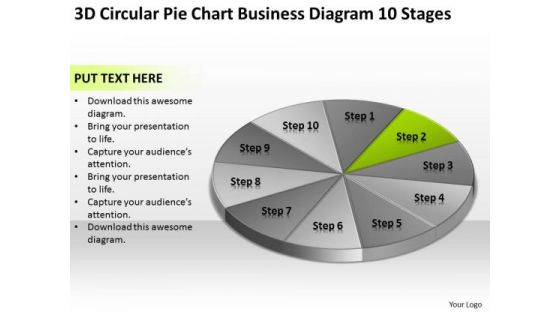
Circular Pie Chart Business Diagram 10 Stages Plan PowerPoint Slides
We present our circular pie chart business diagram 10 stages plan PowerPoint Slides.Present our Business PowerPoint Templates because Our PowerPoint Templates and Slides are conceived by a dedicated team. Use them and give form to your wondrous ideas. Present our Finance PowerPoint Templates because Our PowerPoint Templates and Slides are created with admirable insight. Use them and give your group a sense of your logical mind. Use our Circle Charts PowerPoint Templates because Our PowerPoint Templates and Slides come in all colours, shades and hues. They help highlight every nuance of your views. Download our Shapes PowerPoint Templates because Our PowerPoint Templates and Slides will let your team Walk through your plans. See their energy levels rise as you show them the way. Download and present our Process and Flows PowerPoint Templates because Timeline crunches are a fact of life. Meet all deadlines using our PowerPoint Templates and Slides.Use these PowerPoint slides for presentations relating to Chart, donut, market, isolated, diminishing, rate, downtrend, business, three-dimensional, success, presentation, diagram, circle, uptrend, percentage, graphic, finance, data, stock, holdings, report, marketing, analyzing, trading, graph, illustration, pie, sale, up, money, design, currency, growth, descriptive, representing, painting, moving, progress, part, increases, background, investment, index, financial, multi, counter. The prominent colors used in the PowerPoint template are Green, Gray, White.
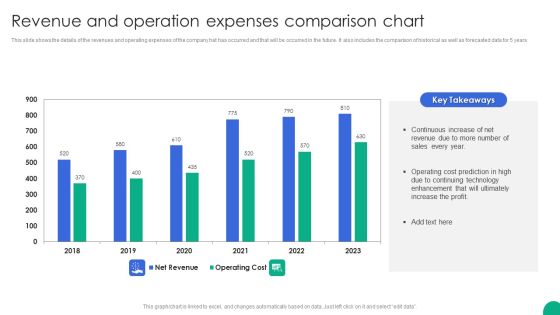
Revenue And Operation Expenses Comparison Chart Slides PDF
This slide shows the details of the revenues and operating expenses of the company hat has occurred and that will be occurred in the future. It also includes the comparison of historical as well as forecasted data for 5 years.Showcasing this set of slides titled Revenue And Operation Expenses Comparison Chart Slides PDF. The topics addressed in these templates are Continuous Increase, Operating Cost, Enhancement Ultimately. All the content presented in this PPT design is completely editable. Download it and make adjustments in color, background, font etc. as per your unique business setting.
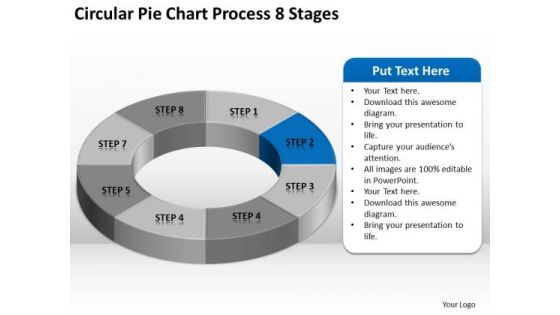
Circular Pie Chart Process 8 Stages Business Plan PowerPoint Slides
We present our circular pie chart process 8 stages business plan PowerPoint Slides.Download our Marketing PowerPoint Templates because Our PowerPoint Templates and Slides are designed to help you succeed. They have all the ingredients you need. Use our Finance PowerPoint Templates because It can be used to Set your controls for the heart of the sun. Our PowerPoint Templates and Slides will be the propellant to get you there. Download our Business PowerPoint Templates because It can Leverage your style with our PowerPoint Templates and Slides. Charm your audience with your ability. Use our Circle Charts PowerPoint Templates because you should once Tap the ingenuity of our PowerPoint Templates and Slides. They are programmed to succeed. Download our Shapes PowerPoint Templates because You can Hit the nail on the head with our PowerPoint Templates and Slides. Embed your ideas in the minds of your audience.Use these PowerPoint slides for presentations relating to Chart, Pie, Graph, Vector, 3d, Icon, Diagram, Progress, Business, Circular, Design, Information, Market, Opinion, Corporate, Sign, Symbol, Shadow, Percentage, Graphic, Finance, Data, Element, Drawing, Report, Marketing, Shape, Illustration, Earnings, Number, Strategy, Money, Dimensional, Survey, Growth, Colorful, Global, Account, Part, Investment, Statistic, Financial. The prominent colors used in the PowerPoint template are Blue, Gray, White.

Circular Pie Chart Process 8 Stages Business Plan PowerPoint Slide
We present our circular pie chart process 8 stages business plan PowerPoint Slide.Download our Marketing PowerPoint Templates because Our PowerPoint Templates and Slides are designed to help you succeed. They have all the ingredients you need. Download our Finance PowerPoint Templates because Our PowerPoint Templates and Slides are the chords of your song. String them along and provide the lilt to your views. Present our Business PowerPoint Templates because Our PowerPoint Templates and Slides are the chords of your song. String them along and provide the lilt to your views. Use our Circle Charts PowerPoint Templates because Our PowerPoint Templates and Slides will provide weight to your words. They will bring out the depth of your thought process. Present our Shapes PowerPoint Templates because Our PowerPoint Templates and Slides are created with admirable insight. Use them and give your group a sense of your logical mind.Use these PowerPoint slides for presentations relating to Chart, Pie, Graph, Vector, 3d, Icon, Diagram, Progress, Business, Circular, Design, Information, Market, Opinion, Corporate, Sign, Symbol, Shadow, Percentage, Graphic, Finance, Data, Element, Drawing, Report, Marketing, Shape, Illustration, Earnings, Number, Strategy, Money, Dimensional, Survey, Growth, Colorful, Global, Account, Part, Investment, Statistic, Financial. The prominent colors used in the PowerPoint template are Blue, Gray, White.
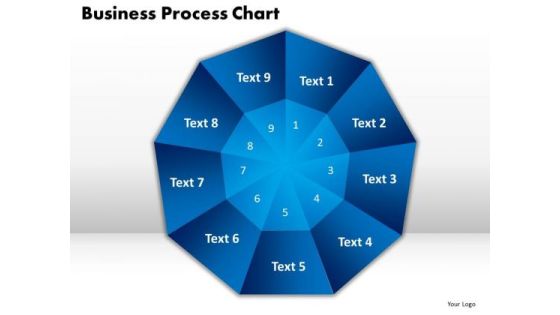
PowerPoint Process Business Process Chart Sales Ppt Themes
PowerPoint Process Business Process Chart Sales PPT Themes-This PowerPoint Process Chart shows the nine Different Layers which are to be followed in any business. This Business Diagram can be used in Marketing, Banking, and Management etc. This Diagram explains nine different topics.-PowerPoint Process Business Process Chart Sales PPT Themes

PowerPoint Process Business Process Chart Marketing Ppt Theme
PowerPoint Process Business Process Chart Marketing PPT Theme-This Business PowerPoint Circular Process Chart shows the twelve Different Layers which are to be followed in any business oriented deals for example Marketing, Banking, and Management etc. This Diagram explains twelve different topics along with their Description.-PowerPoint Process Business Process Chart Marketing PPT Theme

Profits Bar Chart Sales PowerPoint Templates And PowerPoint Themes 0612
Profits Bar Chart Sales PowerPoint Templates And PowerPoint Themes PPT Slides-Microsoft Powerpoint Templates and Background with graph with arrow

Profits Bar Chart Success PowerPoint Templates And PowerPoint Themes 0612
Profits Bar Chart Success PowerPoint Templates And PowerPoint Themes PPT Slides-Microsoft Powerpoint Templates and Background with graph with arrow

Pie Chart With Multiple Percentage Values Ppt PowerPoint Presentation Show
This is a pie chart with multiple percentage values ppt powerpoint presentation show. This is a six stage process. The stages in this process are pie, finance, people, silhouettes, communication.
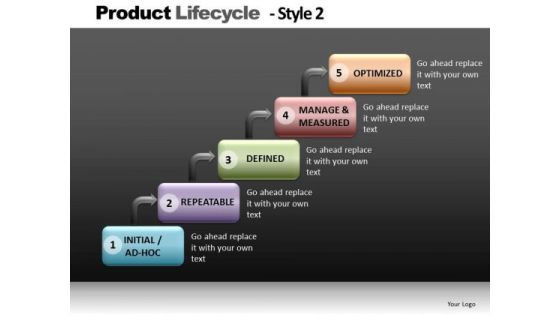
Stairscase Diagram Chart PowerPoint Slides Editable Ppt Templates
StairsCase Diagram Chart PowerPoint Slides Editable PPT templates-These high quality powerpoint pre-designed slides and powerpoint templates have been carefully created by our professional team to help you impress your audience. All slides have been created and are 100% editable in powerpoint. Each and every property of any graphic - color, size, orientation, shading, outline etc. can be modified to help you build an effective powerpoint presentation. Any text can be entered at any point in the powerpoint template or slide. Simply DOWNLOAD, TYPE and PRESENT!These PowerPoint designs and slide layouts can be used to in presentations relating to --Activities, business, clipart, commerce, concept, conceptual, customer, design, diagram, direction, distribution, guidelines, icon, illustration, integration, lifecycle, manage, management, manufacturing, marketing, mba, model, optimize, organization, performance, process, product, resentation, resource, sales, selling, steps, system, theoretical, theory, tool-StairsCase Diagram Chart PowerPoint Slides Editable PPT templates
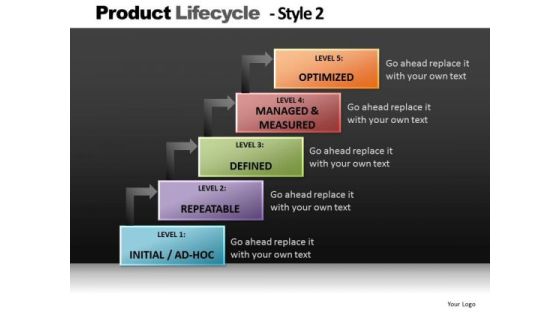
Step Diagram Chart Process PowerPoint Slides And Editable Ppt Templates
Step Diagram Chart Process PowerPoint Slides and Editable PPT templates-These high quality powerpoint pre-designed slides and powerpoint templates have been carefully created by our professional team to help you impress your audience. All slides have been created and are 100% editable in powerpoint. Each and every property of any graphic - color, size, orientation, shading, outline etc. can be modified to help you build an effective powerpoint presentation. Any text can be entered at any point in the powerpoint template or slide. Simply DOWNLOAD, TYPE and PRESENT!These PowerPoint designs and slide layouts can be used to in presentations relating to --Activities, business, clipart, commerce, concept, conceptual, customer, design, diagram, direction, distribution, guidelines, icon, illustration, integration, lifecycle, manage, management, manufacturing, marketing, mba, model, optimize, organization, performance, process, product, resentation, resource, sales, selling, steps, system, theoretical, theory, tool-Step Diagram Chart Process PowerPoint Slides and Editable PPT templates

Steps Process Chart Diagram PowerPoint Slides And Editable PowerPoint Templates
Steps Process Chart Diagram PowerPoint Slides and Editable PowerPoint templates-These high quality powerpoint pre-designed slides and powerpoint templates have been carefully created by our professional team to help you impress your audience. All slides have been created and are 100% editable in powerpoint. Each and every property of any graphic - color, size, orientation, shading, outline etc. can be modified to help you build an effective powerpoint presentation. Any text can be entered at any point in the powerpoint template or slide. Simply DOWNLOAD, TYPE and PRESENT!These PowerPoint designs and slide layouts can be used to in presentations relating to --Activities, business, clipart, commerce, concept, conceptual, customer, design, diagram, direction, distribution, guidelines, icon, illustration, integration, lifecycle, manage, management, manufacturing, marketing, mba, model, optimize, organization, performance, process, product, resentation, resource, sales, selling, steps, system, theoretical, theory, tool-Steps Process Chart Diagram PowerPoint Slides and Editable PowerPoint templates
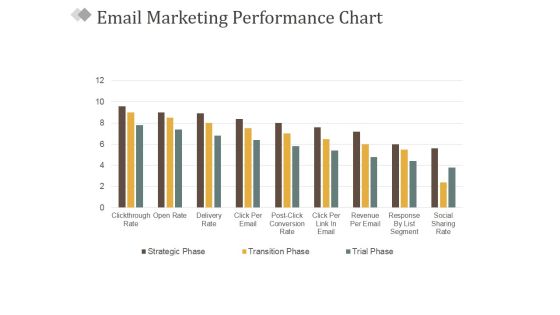
Email Marketing Performance Chart Ppt PowerPoint Presentation Gallery Elements
This is a email marketing performance chart ppt powerpoint presentation gallery elements. This is a nine stage process. The stages in this process are business, marketing, success, management, bar graph.

Clustered Column Line Chart Ppt PowerPoint Presentation File Pictures
This is a clustered column line chart ppt powerpoint presentation file pictures. This is a four stage process. The stages in this process are clustered bar, product, planning, business, sales in percentage.
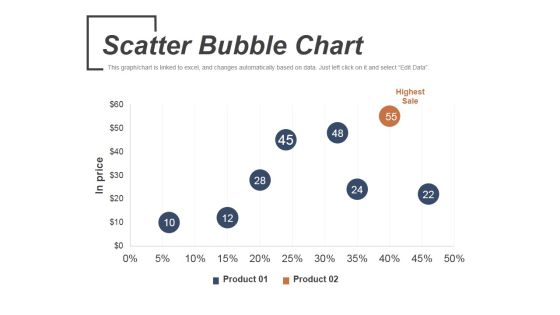
Scatter Bubble Chart Ppt PowerPoint Presentation Infographic Template Graphics
This is a scatter bubble chart ppt powerpoint presentation infographic template graphics. This is a two stage process. The stages in this process are highest sale, product, in price.

Column Chart Financial Ppt PowerPoint Presentation Outline Design Templates
This is a column chart financial ppt powerpoint presentation outline design templates. This is a two stage process. The stages in this process are financial, business, marketing, planning, strategy.

Pie Chart Marketing Business PowerPoint Templates And PowerPoint Themes 0612
Pie Chart Marketing Business PowerPoint Templates And PowerPoint Themes Business PPT Templates-Pie graph marketing, business, finance, sales, success, marketing

Volume Open High Low Close Chart Ppt PowerPoint Presentation Sample
This is a volume open high low close chart ppt powerpoint presentation sample. This is a five stage process. The stages in this process are close, volume, high, low, open.
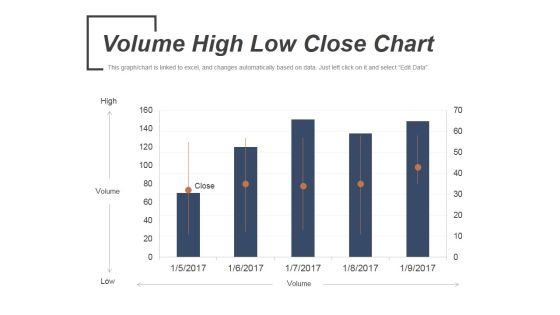
Volume High Low Close Chart Ppt PowerPoint Presentation Slides Portrait
This is a volume high low close chart ppt powerpoint presentation slides portrait. This is a five stage process. The stages in this process are volume, low, high, open, close.

Line Bubble Chart Ppt PowerPoint Presentation Portfolio Slide Portrait
This is a line bubble chart ppt powerpoint presentation portfolio slide portrait. This is a six stage process. The stages in this process are highest profit, financial year, profit in sales, growth, business.

Return On Investment Triangle Chart Ppt Slides Download
This is a return on investment triangle chart ppt slides download. This is a three stage process. The stages in this process are cost, roi, time.

Lego Growth Chart Business PowerPoint Templates And PowerPoint Themes 0512
Lego Growth Chart Business PowerPoint Templates And PowerPoint Themes PPT designs-Microsoft Powerpoint Templates and Background with bar graph
Scatter Bubble Chart Ppt PowerPoint Presentation Infographics Icons
This is a scatter bubble chart ppt powerpoint presentation infographics icons. This is a eight stage process. The stages in this process are highest sale, finance, business, management, marketing, chart.

Business Diagram Three Circular Financial Pie Chart PowerPoint Template
This power point template has been designed with graphic of three circular pie chart. This pie chart is suitable for financial data representation. Use this PPt for your business and finance related presentations.
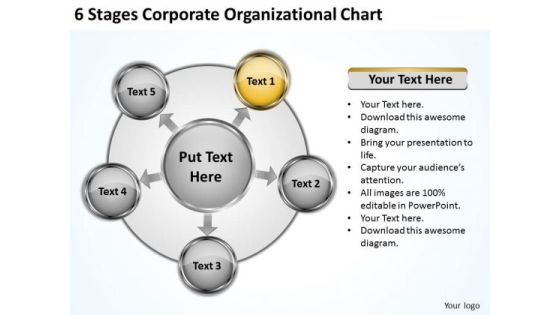
Business Strategy Review Stages Corporate Organizational Chart Integration
We present our business strategy review stages corporate organizational chart integration.Use our Circle Charts PowerPoint Templates because Our PowerPoint Templates and Slides will provide you the cutting edge. Slice through the doubts in the minds of your listeners. Use our Arrows PowerPoint Templates because It will Raise the bar of your Thoughts. They are programmed to take you to the next level. Download and present our Business PowerPoint Templates because Our PowerPoint Templates and Slides are designed to help you succeed. They have all the ingredients you need. Use our Marketing PowerPoint Templates because you can Add colour to your speech with our PowerPoint Templates and Slides. Your presentation will leave your audience speechless. Present our Success PowerPoint Templates because Our PowerPoint Templates and Slides will Activate the energies of your audience. Get their creative juices flowing with your words.Use these PowerPoint slides for presentations relating to Swot, marketing, project, vision, tactics, opportunity, model, circles, corporate, tool, business, concept, hierarchy, success, threat, representation, diagram, guide,process, analysis, theory, idea, abstract, management, mba, manage, illustration, icon, chart, weakness, strategy, mission, round, clipart, strength, guidelines,design, plans, organization, commerce, conceptual, resource, theoretical, action, goals, performance. The prominent colors used in the PowerPoint template are Yellow, Gray, White.
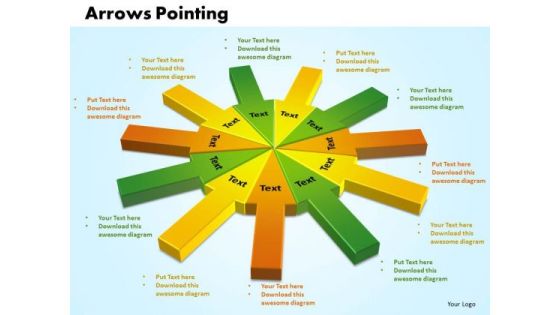
Business PowerPoint Templates Business Arrows Pointing Inwards Chart Ppt Slides
Business PowerPoint Templates Business Arrows pointing inwards chart PPT Slides-Use this arrow pointing inward chart to determine your targets and sequence them as per your priorities. Unravel each one for your audience while setting key timelines as you go along. -Business PowerPoint Templates Business Arrows pointing inwards chart PPT Slides-This ppt can be used for concepts relating to-3d, Accounting, Arrow, Blue, Button, Chart, Corporate, Crystal, Data, Design, Diagram, Element, Glass, Glowing, Graphic, Green, Icon, Illustration, Internet, Investment Etc

Radar Chart Ppt PowerPoint Presentation Inspiration Infographic Template
This is a radar chart ppt powerpoint presentation inspiration infographic template. This is a two stage process. The stages in this process are radar chart, product, business, finance, marketing.

Radar Chart Ppt PowerPoint Presentation Infographics Visual Aids
This is a radar chart ppt powerpoint presentation infographics visual aids. This is a two stage process. The stages in this process are radar chart, product, finance, business, marketing.

Radar Chart Ppt PowerPoint Presentation Portfolio Graphics Template
This is a radar chart ppt powerpoint presentation portfolio graphics template. This is a two stage process. The stages in this process are product, finance, shape, radar chart, business.

Radar Chart Ppt PowerPoint Presentation Professional Infographic Template
This is a radar chart ppt powerpoint presentation professional infographic template. This is a two stage process. The stages in this process are product, finance, shape, radar chart, business.

Car Company Rating Column Chart With Key Insights Structure PDF
This slide illustrates car company ratings to compare the quality and preference of customers towards the specific car brand. It shows consumer rating, expert rating, predicted rating and desired rating.Showcasing this set of slides titled Car Company Rating Column Chart With Key Insights Structure PDF. The topics addressed in these templates are Performance Quality, Top Security, Predicted Rating. All the content presented in this PPT design is completely editable. Download it and make adjustments in color, background, font etc. as per your unique business setting.
Line Chart Ppt PowerPoint Presentation Icon Example Topics
This is a line chart ppt powerpoint presentation icon example topics. This is a two stage process. The stages in this process are line chart, finance, growth, strategy, business.

Control Chart Template 2 Ppt PowerPoint Presentation Icon Mockup
This is a control chart template 2 ppt powerpoint presentation icon mockup. This is a one stage process. The stages in this process are control chart, growth, finance, marketing, strategy, business.
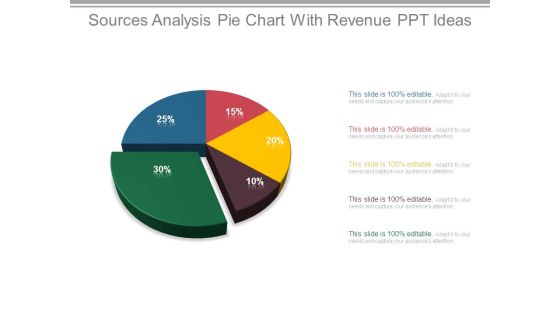
Sources Analysis Pie Chart With Revenue Ppt Ideas
This is a sources analysis pie chart with revenue ppt ideas. This is a five stage process. The stages in this process are finance, success, business, marketing, percentage, pie chart.

Scatter Chart Ppt PowerPoint Presentation Pictures Slide Download
This is a scatter chart ppt powerpoint presentation pictures slide download. This is a two stage process. The stages in this process are scatter chart, finance, analysis, marketing, business.
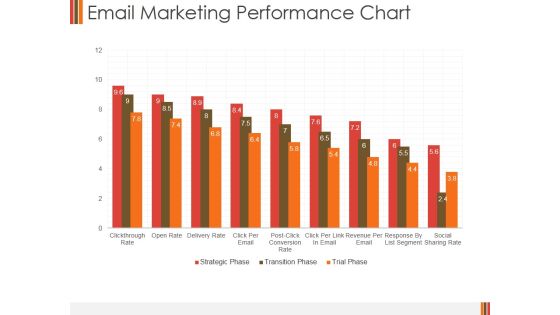
Email Marketing Performance Chart Ppt PowerPoint Presentation Portfolio Inspiration
This is a email marketing performance chart ppt powerpoint presentation portfolio inspiration. This is a nine stage process. The stages in this process are business, finance, marketing, performance chart, strategy, analysis.

Scatter Bubble Chart Ppt PowerPoint Presentation Show Tips
This is a scatter bubble chart ppt powerpoint presentation show tips. This is a two stage process. The stages in this process are scatter bubble chart, finance, marketing, strategy, business.

Donut Pie Chart Ppt PowerPoint Presentation Summary Guide
This is a donut pie chart ppt powerpoint presentation summary guide. This is a four stage process. The stages in this process are pie chart, marketing, strategy, finance, analysis, business.
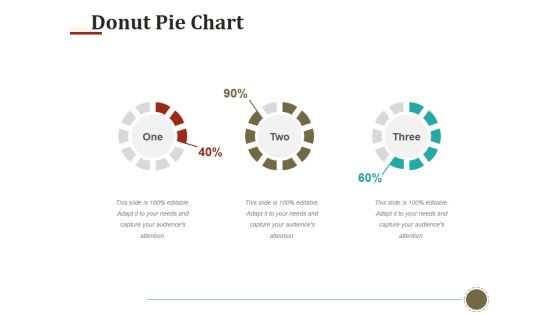
Donut Pie Chart Ppt PowerPoint Presentation Layouts Templates
This is a donut pie chart ppt powerpoint presentation layouts templates. This is a three stage process. The stages in this process are donut pie chart, finance, marketing, strategy, analysis, business.

Pie Chart Ppt PowerPoint Presentation Infographic Template Example 2015
This is a pie chart ppt powerpoint presentation infographic template example 2015. This is a five stage process. The stages in this process are pie chart, finance, marketing, strategy, business.
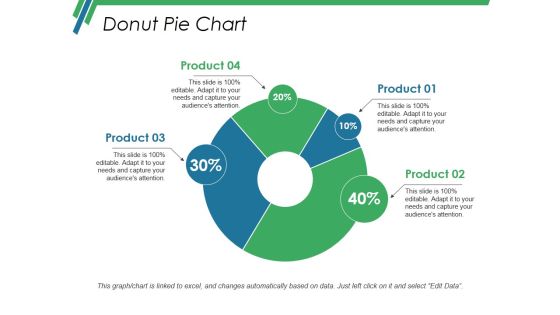
Donut Pie Chart Ppt PowerPoint Presentation Infographic Template Vector
This is a donut pie chart ppt powerpoint presentation infographic template vector. This is a four stage process. The stages in this process are donut pie chart, finance, analysis, business, strategy.
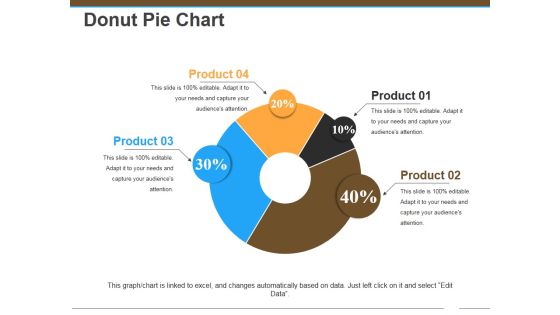
Donut Pie Chart Ppt Powerpoint Presentation Pictures Graphics Design
This is a donut pie chart ppt powerpoint presentation pictures graphics design. This is a four stage process. The stages in this process are donut pie chart, business, finance, management, analysis.

Area Chart Ppt PowerPoint Presentation Infographics Example Topics
This is a area chart ppt powerpoint presentation infographics example topics. This is a two stage process. The stages in this process are area chart, finance, marketing, strategy, business.

Radar Chart Ppt PowerPoint Presentation Infographic Template Visuals
This is a radar chart ppt powerpoint presentation infographic template visuals. This is a two stage process. The stages in this process are radar chart, finance, business, marketing, analysis.
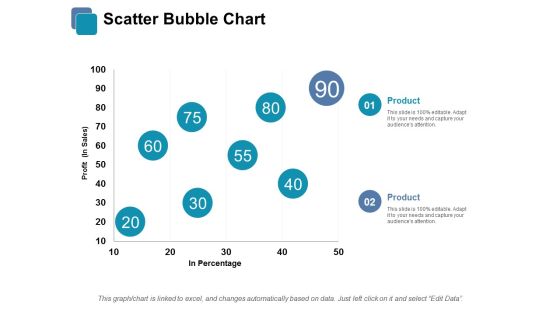
Scatter Bubble Chart Ppt PowerPoint Presentation Infographic Template Infographics
This is a scatter bubble chart ppt powerpoint presentation infographic template infographics. This is a two stage process. The stages in this process are scatter bubble chart, finance, business, marketing, analysis.
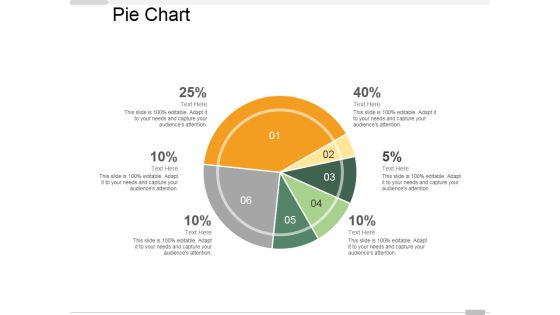
Pie Chart Ppt PowerPoint Presentation Infographic Template Master Slide
This is a pie chart ppt powerpoint presentation infographic template master slide. This is a six stage process. The stages in this process are pie chart, marketing, finance, analysis, business.
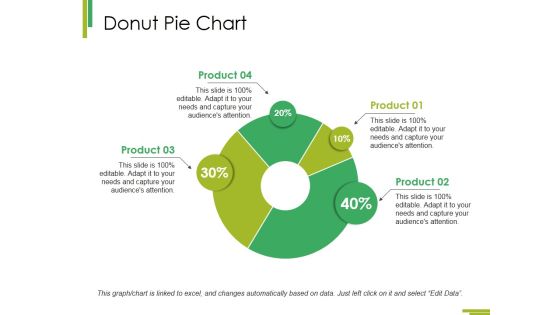
Donut Pie Chart Ppt PowerPoint Presentation Show Visual Aids
This is a donut pie chart ppt powerpoint presentation show visual aids. This is a four stage process. The stages in this process are donut pie chart, business, marketing, analysis, finance.
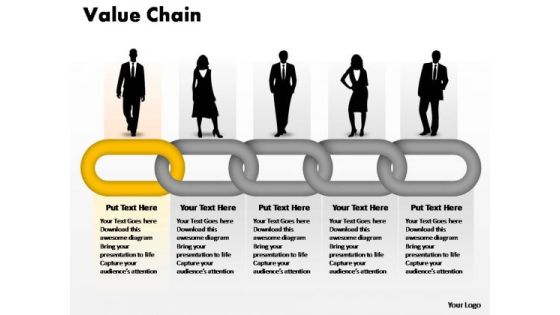
PowerPoint Presentation Chart Designs Business Value Chain Ppt Slide
PowerPoint Presentation Chart Designs Business Value Chain PPT Slide- By using this value chain diagram you can visualize events and the analysis of risks and uncertainties can be significantly explained. -PowerPoint Presentation Chart Designs Business Value Chain PPT Slide
 Home
Home