Budget Chart

Big Data Project Process Flow Chart With Evaluation Ppt Portfolio
Presenting big data project process flow chart with evaluation ppt portfolio to dispense important information. This template comprises seven stages. It also presents valuable insights into the topics including social media, management, network analysis, data storage, infrastructure. This is a completely customizable PowerPoint theme that can be put to use immediately. So, download it and address the topic impactfully.
Money Management Chart Ppt Powerpoint Presentation Icon Designs Cpb
This is a money management chart ppt powerpoint presentation icon designs cpb. This is a five stage process. The stages in this process are money management chart.

Data Analysis In Excel Of Stock Chart PowerPoint Templates
Plan Your Storyboard With Our data analysis in excel of stock chart Powerpoint Templates . Give An Outline To The Solutions You Have.
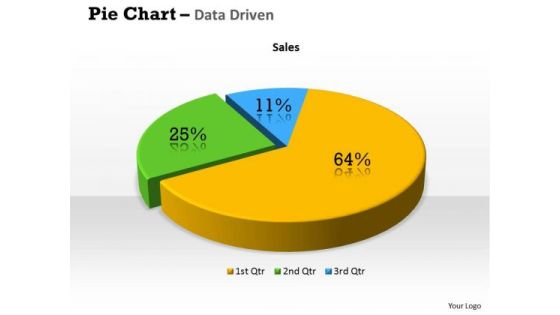
Quantitative Data Analysis 3d Percentage Ratio Pie Chart PowerPoint Templates
Plan Your Storyboard With Our quantitative data analysis 3d percentage ratio pie chart Powerpoint Templates . Give An Outline To The Solutions You Have.

Data Analysis Template Driven Visualization Area Chart PowerPoint Slides Templates
Draw On The Energy Of Our data analysis template driven visualization area chart powerpoint slides Templates . Your Thoughts Will Perk Up.
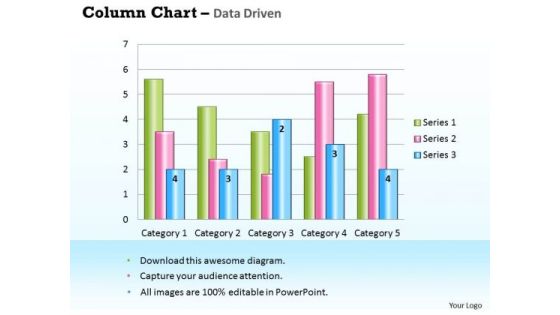
Business Data Analysis Chart For Case Studies PowerPoint Templates
Get Out Of The Dock With Our business data analysis chart for case studies Powerpoint Templates. Your Mind Will Be Set Free.
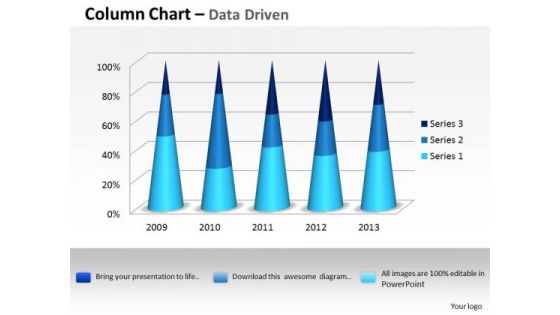
Data Analysis Excel 3d Process Variation Column Chart PowerPoint Templates
Put In A Dollop Of Our data analysis excel 3d process variation column chart Powerpoint Templates. Give Your Thoughts A Distinctive Flavor.

Data Analysis Excel Bubble Chart For Business Tasks PowerPoint Templates
Doll Up Your Thoughts With Our data analysis excel bubble chart for business tasks Powerpoint Templates. They Will Make A Pretty Picture.
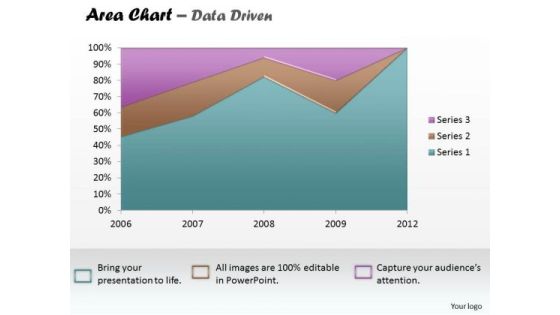
Data Analysis Excel Business Reporting Area Chart PowerPoint Templates
Establish The Dominance Of Your Ideas. Our data analysis excel business reporting area chart Powerpoint Templates Will Put Them On Top.

Data Analysis In Excel 3d Classification Of Chart PowerPoint Templates
With Our data analysis in excel 3d classification of chart Powerpoint Templates You Will Be Doubly Sure. They Possess That Stamp Of Authority.
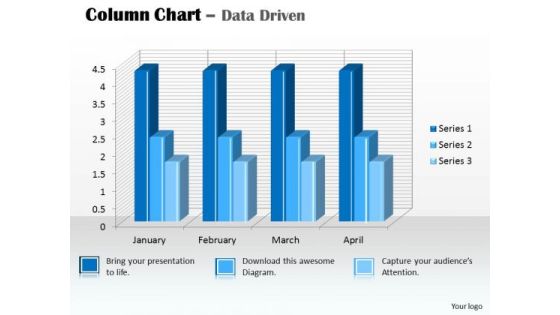
Data Analysis In Excel 3d Column Chart For PowerPoint Templates
Our data analysis in excel 3d column chart for Powerpoint Templates And Your Ideas Make A Great Doubles Pair. Play The Net With Assured Hands.

Data Analysis Techniques 3d In Segments Pie Chart PowerPoint Templates
Drink To The Success Of Your Campaign. Our data analysis techniques 3d in segments pie chart Powerpoint Templates Will Raise A Toast.

Financial Data Analysis Area Chart For Showing Trends PowerPoint Templates
Document Your Views On Our financial data analysis area chart for showing trends Powerpoint Templates . They Will Create A Strong Impression.
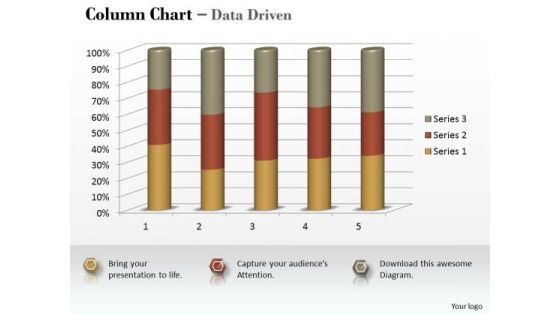
Marketing Data Analysis 3d Statistical Process Column Chart PowerPoint Templates
Be A Donor Of Great Ideas. Display Your Charity On Our marketing data analysis 3d statistical process column chart Powerpoint Templates .

Marketing Data Analysis 3d Statistical Process Control Chart PowerPoint Templates
Open Up Doors That Lead To Success. Our marketing data analysis 3d statistical process control chart Powerpoint Templates Provide The Handles.

Clustered Bar Chart Ppt PowerPoint Presentation Summary Templates
This is a clustered bar chart ppt powerpoint presentation summary templates. This is a three stage process. The stages in this process are finance, marketing, management, investment, analysis.
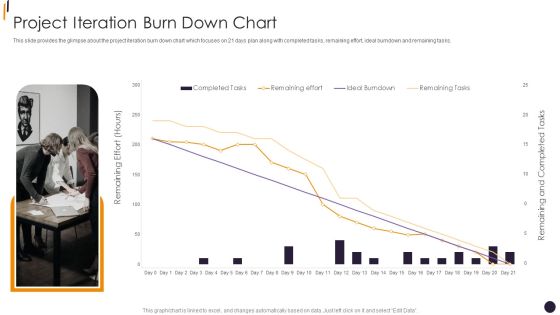
PMP Tools Project Iteration Burn Down Chart Slides PDF
This slide provides the glimpse about the project iteration burn down chart which focuses on 21 days plan along with completed tasks, remaining effort, ideal burndown and remaining tasks.Deliver an awe inspiring pitch with this creative PMP Tools Project Iteration Burn Down Chart Slides PDF bundle. Topics like Remaining Effort, Remaining Tasks, Completed Tasks can be discussed with this completely editable template. It is available for immediate download depending on the needs and requirements of the user.

Project Administration Chart With Capability Assessment Elements PDF
In this slide we have showcased employee performance for Digital marketing and java project which includes assessment of team skills collectively and individually. Showcasing this set of slides titled project administration chart with capability assessment elements pdf. The topics addressed in these templates are project administration chart with capability assessment. All the content presented in this PPT design is completely editable. Download it and make adjustments in color, background, font etc. as per your unique business setting.

Bar Chart Growth Ppt PowerPoint Presentation Gallery Graphics
This is a bar chart growth ppt powerpoint presentation gallery graphics. This is a two stage process. The stages in this process are analysis, business, finance, investment, strategy.

Bar Chart Ppt PowerPoint Presentation Professional Clipart Images
This is a bar chart ppt powerpoint presentation professional clipart images. This is a three stage process. The stages in this process are business, finance, analysis, investment, marketing.

Bar Chart Financial Ppt PowerPoint Presentation Pictures Files
This is a bar chart financial ppt powerpoint presentation pictures files. This is a five stage process. The stages in this process are finance, marketing, management, investment, analysis.

Clustered Bar Chart Ppt PowerPoint Presentation Layouts Infographics
This is a clustered bar chart ppt powerpoint presentation layouts infographics. This is a three stage process. The stages in this process are finance, marketing, management, investment, analysis.

Clustered Bar Chart Ppt PowerPoint Presentation Professional Good
This is a clustered bar chart ppt powerpoint presentation professional good. This is a three stage process. The stages in this process are finance, marketing, management, investment, analysis.

Stacked Bar Chart Ppt PowerPoint Presentation Gallery Outfit
This is a stacked bar chart ppt powerpoint presentation gallery outfit. This is a three stage process. The stages in this process are finance, marketing, management, investment, analysis.

Regional Sales Percentage Column Chart With Key Insights Diagrams PDF
This slide illustrates sales percentage chart in regions of USA to calculate and interpret present fuel consumption. It includes parts such as regions and sales percentage.Pitch your topic with ease and precision using this Regional Sales Percentage Column Chart With Key Insights Diagrams PDF. This layout presents information on Industries Central, Sales Central, Productions Companies. It is also available for immediate download and adjustment. So, changes can be made in the color, design, graphics or any other component to create a unique layout.

Bar Chart Software Designing And Development Playbook Ideas PDF
Presenting this PowerPoint presentation, titled Bar Chart Software Designing And Development Playbook Ideas PDF, with topics curated by our researchers after extensive research. This editable presentation is available for immediate download and provides attractive features when used. Download now and captivate your audience. Presenting this Bar Chart Software Designing And Development Playbook Ideas PDF. Our researchers have carefully researched and created these slides with all aspects taken into consideration. This is a completely customizable Bar Chart Software Designing And Development Playbook Ideas PDF that is available for immediate downloading. Download now and make an impact on your audience. Highlight the attractive features available with our PPTs.

8 Diverging Factors Arrow Flow Chart Circular Process PowerPoint Slides
We present our 8 diverging factors arrow flow chart Circular Process PowerPoint Slides.Download and present our Arrows PowerPoint Templates because the vision of being the market leader is clear to you. Use our Circle Charts PowerPoint Templates because this amazing layout demonstrates how they all combine to form the final product. Present our Shapes PowerPoint Templates because the colour coding of our templates are specifically designed to highlight you points. Download our Business PowerPoint Templates because The foundation of the structure of your business is resilient and dependable. Convey this confidence to your colleagues and assure them of a great and enduring future. Present our Flow Charts PowerPoint Templates because you can Refine them all as you take them through the numerous filtering stages of the funnel of your quality control process.Use these PowerPoint slides for presentations relating to abstract, arrow, brochure, business, businessman, button, chart, circle, company, cyclic, data, demonstration, diagram, economic, financial, five, glossy, goal, graph, illustration, info, information, investment, man, manage, marketing, model, navigation, option, part, people, person, pie, presentation, process, result, section, segmented, sharing, silhouette, sphere, statistics, stock, strategy, template, variation, vector, wheel. The prominent colors used in the PowerPoint template are Red, Pink, Purple. Presenters tell us our 8 diverging factors arrow flow chart Circular Process PowerPoint Slides are Second to none. You can be sure our company PowerPoint templates and PPT Slides are Upbeat. Professionals tell us our 8 diverging factors arrow flow chart Circular Process PowerPoint Slides are incredible easy to use. People tell us our circle PowerPoint templates and PPT Slides are Sparkling. People tell us our 8 diverging factors arrow flow chart Circular Process PowerPoint Slides are Cheerful. Professionals tell us our button PowerPoint templates and PPT Slides are Appealing.

Column Chart Finance Investment Ppt PowerPoint Presentation Inspiration Template
This is a column chart finance investment ppt powerpoint presentation inspiration template. This is a two stage process. The stages in this process are finance, analysis, business, investment, marketing.

Achieved And Pending Workplace Diversity Objectives Chart Guidelines PDF
This slide displays the bar chart representing the percentage of diversity goals achieved. It also includes some key insights such as an increase in the women workforce in tech roles, increase in director level black representation, etc. Showcasing this set of slides titled Achieved And Pending Workplace Diversity Objectives Chart Guidelines PDF. The topics addressed in these templates are Achieved And Pending Workplace, Diversity Objectives Chart. All the content presented in this PPT design is completely editable. Download it and make adjustments in color, background, font etc. as per your unique business setting.

Area Chart Financial Ppt PowerPoint Presentation Styles Templates
This is a area chart financial ppt powerpoint presentation styles templates. This is a two stage process. The stages in this process are finance, marketing, management, investment, analysis.
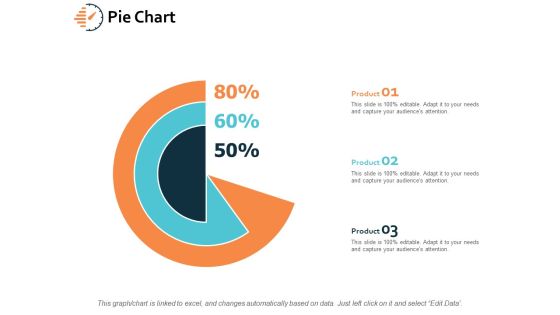
Pie Chart Investment Finance Ppt PowerPoint Presentation File Influencers
This is a pie chart investment finance ppt powerpoint presentation file influencers. This is a three stage process. The stages in this process are finance, analysis, business, investment, marketing.
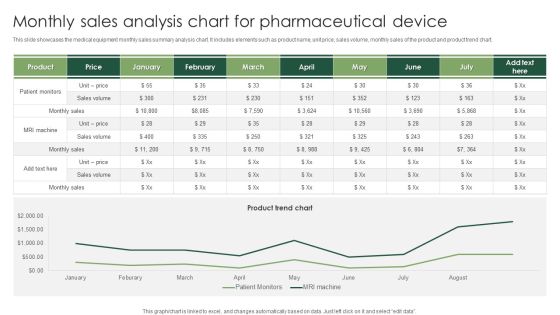
Monthly Sales Analysis Chart For Pharmaceutical Device Structure PDF
This slide showcases the medical equipment monthly sales summary analysis chart. It includes elements such as product name, unit price, sales volume, monthly sales of the product and product trend chart. Showcasing this set of slides titled Monthly Sales Analysis Chart For Pharmaceutical Device Structure PDF. The topics addressed in these templates are Monthly Sales Analysis, Pharmaceutical Device. All the content presented in this PPT design is completely editable. Download it and make adjustments in color, background, font etc. as per your unique business setting.

Car Company Market Share Circle Chart Slides PDF
This slide depicts the market share percentage chart of car companies in the USA to determine the market leader. It shows percentage share of General motors, Toyota, Stellanis, and Hyundai. Showcasing this set of slides titled Car Company Market Share Circle Chart Slides PDF. The topics addressed in these templates are Car Company Market, Share Circle Chart. All the content presented in this PPT design is completely editable. Download it and make adjustments in color, background, font etc. as per your unique business setting.
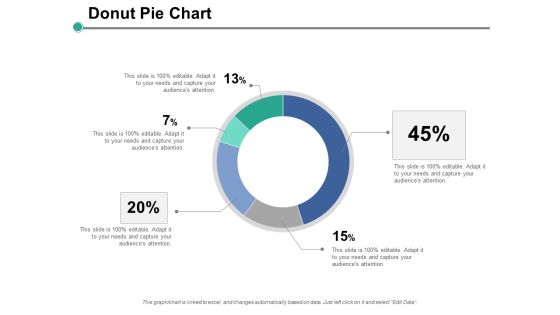
Donut Pie Chart Ppt PowerPoint Presentation Layouts Backgrounds
This is a donut pie chart ppt powerpoint presentation layouts backgrounds. This is a five stage process. The stages in this process are finance, marketing, management, investment, analysis.

Column Chart Ppt PowerPoint Presentation Slides Example Topics
This is a column chart ppt powerpoint presentation slides example topics. This is a two stage process. The stages in this process are finance, marketing, management, investment, analysis.

Area Chart Financial Ppt PowerPoint Presentation Layouts Slide
This is a area chart financial ppt powerpoint presentation layouts slide. This is a three stage process. The stages in this process are finance, marketing, management, investment, analysis.

Area Chart Financial Ppt PowerPoint Presentation Inspiration Topics
This is a area chart financial ppt powerpoint presentation inspiration topics. This is a three stage process. The stages in this process are finance, marketing, management, investment, analysis.

Combo Chart Ppt PowerPoint Presentation Visual Aids Pictures
This is a combo chart ppt powerpoint presentation visual aids pictures. This is a three stage process. The stages in this process are finance, marketing, management, investment, analysis.
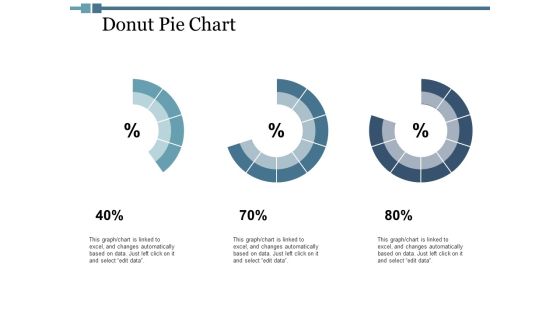
Donut Pie Chart Ppt PowerPoint Presentation Inspiration Brochure
This is a donut pie chart ppt powerpoint presentation inspiration brochure. This is a three stage process. The stages in this process are finance, marketing, management, investment, analysis.

Combo Chart Ppt PowerPoint Presentation Visual Aids Files
This is a combo chart ppt powerpoint presentation visual aids files. This is a three stage process. The stages in this process are finance, marketing, management, investment, analysis.

Area Chart Financial Ppt PowerPoint Presentation Model Background
This is a area chart financial ppt powerpoint presentation model background. This is a two stage process. The stages in this process are finance, marketing, management, investment, analysis.

Combo Chart Financial Ppt PowerPoint Presentation Layouts Layouts
This is a combo chart financial ppt powerpoint presentation layouts layouts. This is a three stage process. The stages in this process are finance, marketing, management, investment, analysis.
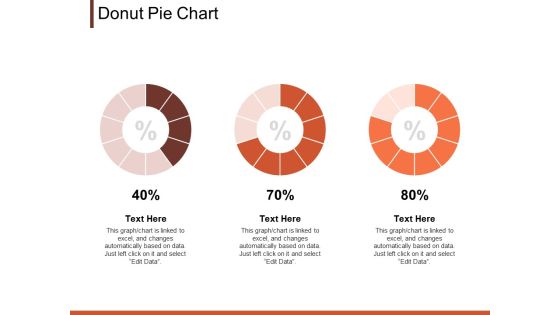
Donut Pie Chart Marketing Ppt PowerPoint Presentation Clipart
This is a donut pie chart marketing ppt powerpoint presentation clipart. This is a three stage process. The stages in this process are finance, analysis, business, investment, marketing.

Internet Security Threat Analysis Report Chart Introduction PDF
Following slide exhibits security and data breach report chart it includes major statistics such as- loss or theft of data, failure to redirect data and data posting to incorrect recipient. Pitch your topic with ease and precision using this internet security threat analysis report chart introduction pdf. This layout presents information on internet security threat analysis report chart. It is also available for immediate download and adjustment. So, changes can be made in the color, design, graphics or any other component to create a unique layout.
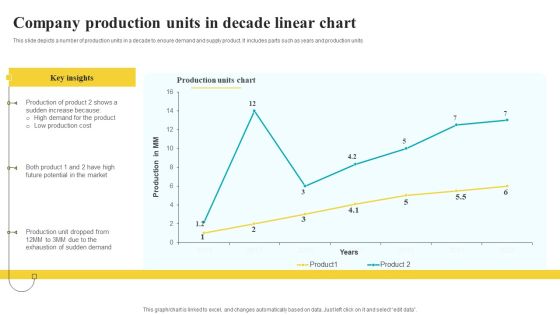
Company Production Units In Decade Linear Chart Designs PDF
This slide depicts a number of production units in a decade to ensure demand and supply product. It includes parts such as years and production units Pitch your topic with ease and precision using this Company Production Units In Decade Linear Chart Designs PDF. This layout presents information on Key Insights, Production Units Chart, Linear Chart. It is also available for immediate download and adjustment. So, changes can be made in the color, design, graphics or any other component to create a unique layout.
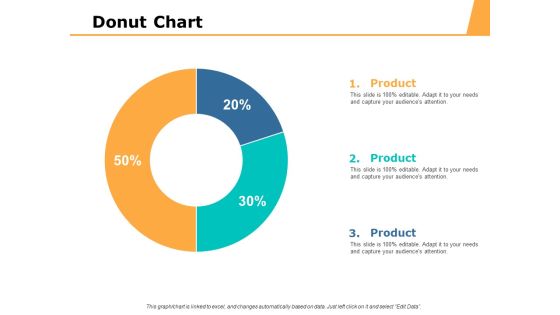
Pie Chart Percentage Ppt PowerPoint Presentation Inspiration Slides
This is a pie chart percentage ppt powerpoint presentation inspiration slides. This is a three stage process. The stages in this process are finance, marketing, management, investment, analysis.
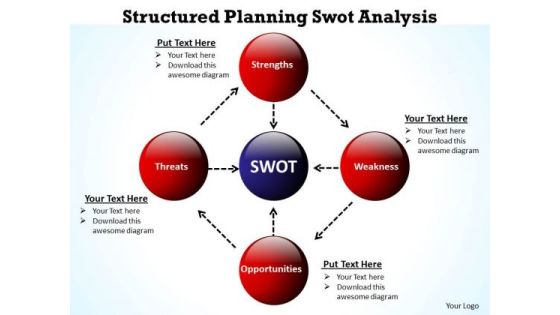
Business Organizational Chart Template Structured Planning Swot Analysis PowerPoint Slides
We present our business organizational chart template structured planning swot analysis PowerPoint Slides.Use our Circle Charts PowerPoint Templates because Our PowerPoint Templates and Slides are effectively colour coded to prioritise your plans They automatically highlight the sequence of events you desire. Download our Ring Charts PowerPoint Templates because Our PowerPoint Templates and Slides are created with admirable insight. Use them and give your group a sense of your logical mind. Download and present our Business PowerPoint Templates because Your ideas provide food for thought. Our PowerPoint Templates and Slides will help you create a dish to tickle the most discerning palate. Present our Flow Charts PowerPoint Templates because Our PowerPoint Templates and Slides are truly out of this world. Even the MIB duo has been keeping tabs on our team. Present our Process and Flows PowerPoint Templates because Our PowerPoint Templates and Slides are a sure bet. Gauranteed to win against all odds. Use these PowerPoint slides for presentations relating to Business, buy, clipart, commerce, concept, conceptual, consumer, customer, cycle, design, development, diagram, direction, guidelines, icon, illustration, know, life, lifecycle, like, manage, management, market, marketing, mix, model, optimize, organization, performance, process, refer, repeat, resource, sales, selling, stages. The prominent colors used in the PowerPoint template are Red, Blue navy, Black. People tell us our business organizational chart template structured planning swot analysis PowerPoint Slides are designed by a team of presentation professionals. PowerPoint presentation experts tell us our conceptual PowerPoint templates and PPT Slides will generate and maintain the level of interest you desire. They will create the impression you want to imprint on your audience. Presenters tell us our business organizational chart template structured planning swot analysis PowerPoint Slides are designed by professionals Use our cycle PowerPoint templates and PPT Slides are aesthetically designed to attract attention. We guarantee that they will grab all the eyeballs you need. Customers tell us our business organizational chart template structured planning swot analysis PowerPoint Slides will make the presenter look like a pro even if they are not computer savvy. People tell us our concept PowerPoint templates and PPT Slides will get their audience's attention.

Area Chart Ppt PowerPoint Presentation Visual Aids Show
This is a area chart ppt powerpoint presentation visual aids show. This is a two stage process. The stages in this process are area chart, growth, strategy, finance, business.
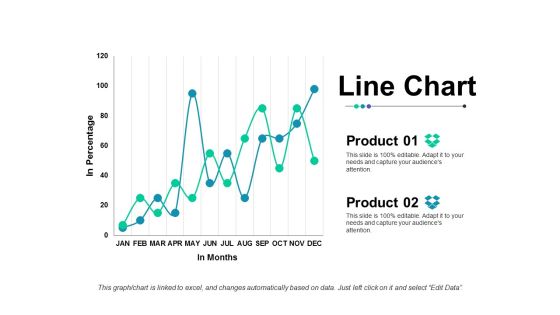
Line Chart Ppt Powerpoint Presentation Outline Slide Portrait
This is a line chart ppt powerpoint presentation outline slide portrait. This is a two stage process. The stages in this process are line chart, finance, strategy, business, analysis.

Bar Chart Investment Ppt PowerPoint Presentation Model Files
Presenting this set of slides with name bar chart investment ppt powerpoint presentation model files. The topics discussed in these slides are finance, marketing, management, investment, analysis. This is a completely editable PowerPoint presentation and is available for immediate download. Download now and impress your audience.

Clustered Bar Chart Investment Ppt PowerPoint Presentation Layouts Ideas
Presenting this set of slides with name clustered bar chart investment ppt powerpoint presentation layouts ideas. The topics discussed in these slides are finance, analysis, business, investment, marketing. This is a completely editable PowerPoint presentation and is available for immediate download. Download now and impress your audience.
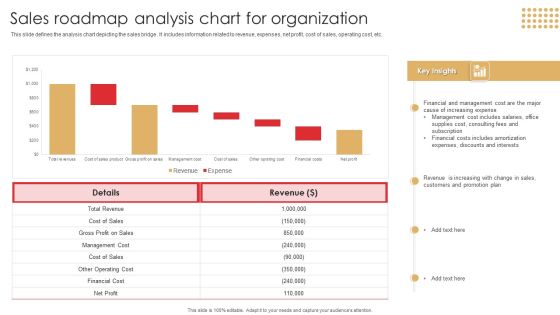
Sales Roadmap Analysis Chart For Organization Download PDF
This slide defines the analysis chart depicting the sales bridge . It includes information related to revenue, expenses, net profit, cost of sales, operating cost, etc.Showcasing this set of slides titled Sales Roadmap Analysis Chart For Organization Download PDF. The topics addressed in these templates are Management Cost, Financial Cost, Includes Amortization. All the content presented in this PPT design is completely editable. Download it and make adjustments in color, background, font etc. as per your unique business setting.
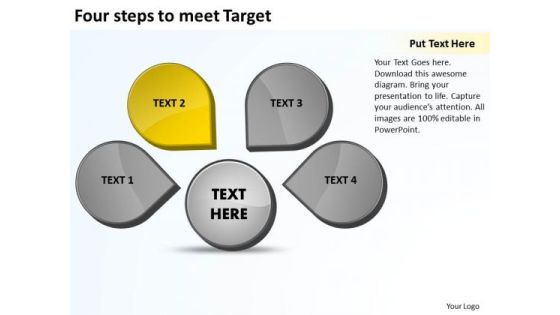
Four Steps To Meet Target Venn Chart PowerPoint Templates
We present our four steps to meet target Venn Chart PowerPoint templates.Download our Circle Charts PowerPoint Templates because you can take it along a sure fire road to good profit. Present our Business PowerPoint Templates because your fledgling career is in the chrysallis stage. Nurture it and watch it grow into a beautiful butterfly. Use our Shapes PowerPoint Templates because this helps you to put all your brilliant views to your audience. Download and present our Flow Charts PowerPoint Templates because You aspire to touch the sky with glory. Let our PowerPoint Templates and Slides provide the fuel for your ascent. Use our Finance PowerPoint Templates because you envisage some areas of difficulty in the near future. The overall financial situation could be a source of worry.Use these PowerPoint slides for presentations relating to Business, chart, circle, circular, steps, process, flow, concept, conference, curving, cycle, design, diagram, direction, element, financial, flow, flowchart, formula, future, goal, graphic, idea, management, market, marketing, mind, mind map, motion, movement, organization, organize, plan, presentation, process, product, questions, render, solutions, solve, strategy, success, symbol. The prominent colors used in the PowerPoint template are Yellow, Gray, White. The feedback we get is that our four steps to meet target Venn Chart PowerPoint templates are Functional. Customers tell us our circular PowerPoint templates and PPT Slides are Nice. Professionals tell us our four steps to meet target Venn Chart PowerPoint templates are Magical. Customers tell us our concept PowerPoint templates and PPT Slides will make the presenter successul in his career/life. Use our four steps to meet target Venn Chart PowerPoint templates are Stylish. Professionals tell us our circle PowerPoint templates and PPT Slides are Elevated.

Seed Investment Stacked Bar Chart Ppt Show Smartart PDF
Presenting this set of slides with name seed investment stacked bar chart ppt show smartart pdf. The topics discussed in these slides are product 1, product 2. This is a completely editable PowerPoint presentation and is available for immediate download. Download now and impress your audience.
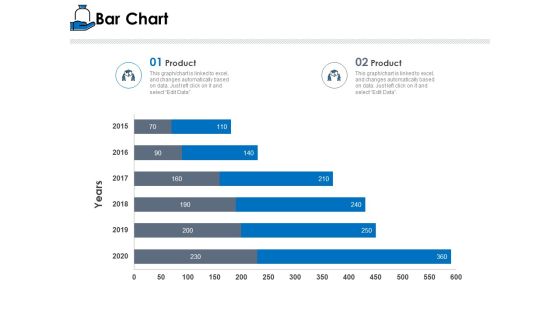
Startup Investment Ideas Bar Chart Ppt Layouts Layouts PDF
Presenting this set of slides with name startup investment ideas bar chart ppt layouts layouts pdf. The topics discussed in these slides are product 1, product 2. This is a completely editable PowerPoint presentation and is available for immediate download. Download now and impress your audience.

Raising Money Chart Finance PowerPoint Templates And PowerPoint Themes 0512
Raising Money Chart Finance PowerPoint Templates And PowerPoint Themes PPT designs-Microsoft Powerpoint Templates and Background with business graph

Pie Chart Finance Ppt PowerPoint Presentation Professional Styles
This is a pie chart finance ppt powerpoint presentation professional styles. This is a three stage process. The stages in this process are management, marketing, business, strategy, finance.

PowerPoint Presentations Plan 9 Stages Circular Flow Process Chart Slides
We present our powerpoint presentations plan 9 stages Circular Flow Process Chart Slides.Present our Circle Charts PowerPoint Templates because you can Determine your targets and sequence them as per your priorities. Download and present our Arrows PowerPoint Templates because this diagram helps you to explain your strategy to co-ordinate activities of these seperate groups. Download and present our Business PowerPoint Templates because your thoughts are pointed and sharp as arrows. Download and present our Shapes PowerPoint Templates because you can asked to strive to give true form to your great dream. Present our Flow Charts PowerPoint Templates because this diagram provides multiple options for taking in and making sense of information.Use these PowerPoint slides for presentations relating to abstract, arrow, arrow circle, business concept, career, center stage, chart, circle, circle arrow diagram, color full, connection, contrast, cycle, diagram, direction, flow, flowchart, future, graph, icon, illustration, isolate, isolated, job, life, loop, money, motion, network, recycle, refresh, ring, rotation, sick, sign, symbol, symply, target, wealth,. The prominent colors used in the PowerPoint template are Blue, Green, Gray. Customers tell us our powerpoint presentations plan 9 stages Circular Flow Process Chart Slides will help you be quick off the draw. Just enter your specific text and see your points hit home. PowerPoint presentation experts tell us our business PowerPoint templates and PPT Slides are Liberated. People tell us our powerpoint presentations plan 9 stages Circular Flow Process Chart Slides are Cheerful. People tell us our business PowerPoint templates and PPT Slides are Sparkling. Customers tell us our powerpoint presentations plan 9 stages Circular Flow Process Chart Slides are Glamorous. People tell us our concept PowerPoint templates and PPT Slides are Dazzling.

PowerPoint Template Business Process Chart Images Ppt Templates
PowerPoint Template Business Process Chart Images PPT Templates-The Circle of Life - a concept emmbedded in our minds and hence easy to comprehend. Life and Business is made up of processes comprising stages that flow from one to another. An excellent graphic to attract the attention of and understanding by your audience to improve earnings-PowerPoint Template Business Process Chart Images PPT Templates-This ppt can be used for presentations relating to-Arrow, Bond, Business, Button, Buying, Career, Change, Chart, Children, Circle, College, Death, Diagram, Education, Financial, Future, Graphic, House, Illustration, Investing, Investment, Marriage, Menu, Personal, Plan, Process

Area Chart Investment Ppt PowerPoint Presentation Styles Samples
Presenting this set of slides with name area chart investment ppt powerpoint presentation styles samples. The topics discussed in these slides are finance, marketing, management, investment, analysis. This is a completely editable PowerPoint presentation and is available for immediate download. Download now and impress your audience.

 Home
Home