Budget Chart

Dollar Chart Business Success PowerPoint Templates And PowerPoint Backgrounds 0111
Microsoft PowerPoint Template and Background with futuristic finance stock exchange and dollar chart

Project Managers HR Recruitment Flow Chart Icon Sample PDF
Presenting Project Managers HR Recruitment Flow Chart Icon Sample PDF to dispense important information. This template comprises three stages. It also presents valuable insights into the topics including Recruitment Flow Chart Icon, Project Managers Hr. This is a completely customizable PowerPoint theme that can be put to use immediately. So, download it and address the topic impactfully.

Combo Chart Finance Ppt PowerPoint Presentation Portfolio Templates
This is a combo chart finance ppt powerpoint presentation portfolio templates. This is a three stage process. The stages in this process are finance, analysis, business, investment, marketing.

Usa And India Population Comparison Stacked Linear Chart Guidelines PDF
This slide depicts the population comparison chart of USA and India to forecast future population of the respective countries. It includes years and population in MM Pitch your topic with ease and precision using this Usa And India Population Comparison Stacked Linear Chart Guidelines PDF. This layout presents information on Key Insights, Population Growth, Comparison Chart. It is also available for immediate download and adjustment. So, changes can be made in the color, design, graphics or any other component to create a unique layout.

Nine Stages Diverging Factors Flow Chart Circular Network PowerPoint Templates
We present our nine stages diverging factors flow chart Circular Network PowerPoint templates.Use our Ring Charts PowerPoint Templates because they enhance the essence of your viable ideas. Download our Process and Flows PowerPoint Templates because it depicts Rolling along while gathering profits along the way is the aim. Use our Circle charts PowerPoint Templates because you should Emphasise the process of your business or corporate growth. Use our Arrows PowerPoint Templates because by using this slide you can Heighten the anticipation of your audience listing . Download and present our Success PowerPoint Templates because your brain is always churning out ideas like cogs in a wheel.Use these PowerPoint slides for presentations relating to Communication,competition, development, diagram,direction, element, finance, financial,forward, graphic, growth, guide,increase, investment, leader, leadership,management, marketing, motion,moving, organization, path, plan,presentation, price, profit, progress,report, representation, shape, sign. The prominent colors used in the PowerPoint template are Purple, Gray, White. People tell us our nine stages diverging factors flow chart Circular Network PowerPoint templates will save the presenter time. Customers tell us our finance PowerPoint templates and PPT Slides are Romantic. Professionals tell us our nine stages diverging factors flow chart Circular Network PowerPoint templates are topically designed to provide an attractive backdrop to any subject. Presenters tell us our element PowerPoint templates and PPT Slides will make the presenter successul in his career/life. Use our nine stages diverging factors flow chart Circular Network PowerPoint templates are readymade to fit into any presentation structure. Presenters tell us our finance PowerPoint templates and PPT Slides are designed by professionals

Area Chart Finance Ppt PowerPoint Presentation Gallery Elements
This is a area chart finance ppt powerpoint presentation gallery elements. This is a two stage process. The stages in this process are finance, marketing, management, investment, analysis.

Scatter Chart Finance Ppt PowerPoint Presentation Ideas Show
This is a scatter chart finance ppt powerpoint presentation ideas show. This is a two stage process. The stages in this process are finance, marketing, analysis, business, investment.

Area Chart Finance Ppt PowerPoint Presentation Slides Layout
This is a area chart finance ppt powerpoint presentation slides layout. This is a two stage process. The stages in this process are finance, marketing, management, investment, analysis.

Pie Chart Finance Ppt PowerPoint Presentation Inspiration Introduction
This is a pie chart finance ppt powerpoint presentation inspiration introduction. This is a three stage process. The stages in this process are finance, marketing, analysis, business, investment.
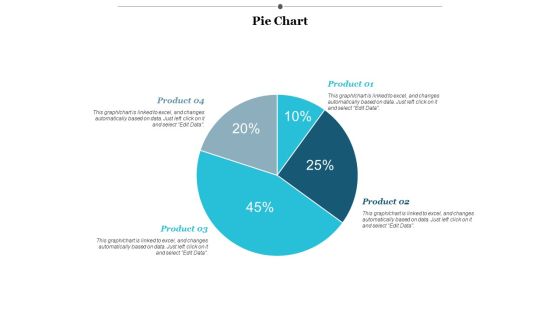
Pie Chart Finance Ppt PowerPoint Presentation Layouts Designs
This is a Pie Chart Finance Ppt PowerPoint Presentation Layouts Designs. This is a four stage process. The stages in this process are finance, marketing, management, investment, analysis.

Pie Chart Finance Ppt PowerPoint Presentation Model Ideas
This is a pie chart finance ppt powerpoint presentation model ideas. This is a four stage process. The stages in this process are finance, marketing, management, investment, analysis.

Column Chart Finance Ppt PowerPoint Presentation Styles Backgrounds
This is a column chart finance ppt powerpoint presentation styles backgrounds. This is a three stage process. The stages in this process are finance, marketing, management, investment, analysis.

Combo Chart Finance Ppt PowerPoint Presentation Portfolio Gridlines
This is a combo chart finance ppt powerpoint presentation portfolio gridlines. This is a two stage process. The stages in this process are finance, analysis, business, investment, marketing.
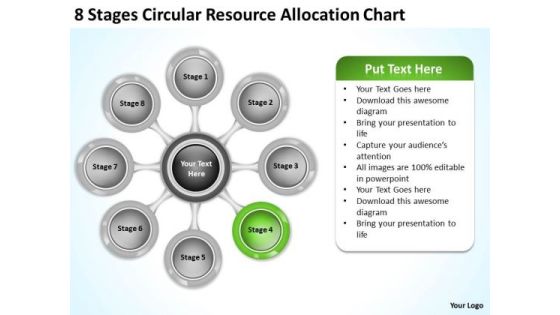
Business Planning Strategy Resource Allocation Chart Level Definition
We present our business planning strategy resource allocation chart level definition.Download and present our Process and Flows PowerPoint Templates because Our PowerPoint Templates and Slides will let you Leave a lasting impression to your audiences. They possess an inherent longstanding recall factor. Use our Circle Charts PowerPoint Templates because Our PowerPoint Templates and Slides are endowed to endure. Ideas conveyed through them will pass the test of time. Download our Ring Charts PowerPoint Templates because Our PowerPoint Templates and Slides has conjured up a web of all you need with the help of our great team. Use them to string together your glistening ideas. Download our Flow Charts PowerPoint Templates because Our PowerPoint Templates and Slides will let your words and thoughts hit bullseye everytime. Use our Marketing PowerPoint Templates because Our PowerPoint Templates and Slides are aesthetically designed to attract attention. We gaurantee that they will grab all the eyeballs you need.Use these PowerPoint slides for presentations relating to Abstract, arrows, business, central, centralized, chart, circle, circular,circulation, concept, conceptual, converging, design, diagram, eight, executive,icon, idea, illustration, management, map, mapping, mba, model, numbers,organization, outwards, pointing, procedure, process, radial, radiating,relationship, resource, sequence, sequential, square, strategy. The prominent colors used in the PowerPoint template are Green lime, Gray, White.

Combo Chart Ppt PowerPoint Presentation Infographic Template Themes
This is a combo chart ppt powerpoint presentation infographic template themes. This is a eight stage process. The stages in this process are combo chart, finance, marketing, strategy, analysis, business.

Diverging Factors Linear Flow Diagram Cycle Chart PowerPoint Slides
We present our diverging factors linear flow diagram Cycle Chart PowerPoint Slides.Download our Circle Charts PowerPoint Templates because you have the ideas to develop the teams vision of where they need to be in the future. Download and present our Arrows PowerPoint Templates because you have the basic goal in mind. Present our Business PowerPoint Templates because you have analysed many global markets and come up with possibilities. Highlight the pros and cons of other likely business oppurtunities. Present our Shapes PowerPoint Templates because you can Unravel the desired and essential elements of your overall strategy. Present our Flow Charts PowerPoint Templates because there is a crucial aspect that requires extra attention.Use these PowerPoint slides for presentations relating to action, around, arrow, business, button, cartoon, catalyzing, center, chart, circle, circuits, clipart, comic, commerce, concept, conceptual, continue, corporate, cycle, diagram, guide, guidelines, illustration, line, manage, management, map, marketing, mentoring, messenger, mind, mind mapping, mindmap, organization, performance, plans, procedure, process, project, public, repeat, representation, sketch, steps, topic, vector, web, weblogs, website. The prominent colors used in the PowerPoint template are Yellow, Green, Blue. Customers tell us our diverging factors linear flow diagram Cycle Chart PowerPoint Slides are Amazing. PowerPoint presentation experts tell us our business PowerPoint templates and PPT Slides are Lush. People tell us our diverging factors linear flow diagram Cycle Chart PowerPoint Slides will make the presenter successul in his career/life. People tell us our catalyzing PowerPoint templates and PPT Slides are Magical. Customers tell us our diverging factors linear flow diagram Cycle Chart PowerPoint Slides are Striking. People tell us our chart PowerPoint templates and PPT Slides are Clever.

Business PowerPoint Presentation Flow Chart Circular Process Network Slides
We present our business powerpoint presentation flow chart Circular Process Network Slides.Use our Circle Charts PowerPoint Templates because with the help of our Slides you can Illustrate these thoughts with this slide. Use our Arrows PowerPoint Templates because the great Bald headed Eagle embodies your personality. the eagle eye to seize upon the smallest of oppurtunities. Download and present our Business PowerPoint Templates because your fledgling career is in the chrysallis stage. Nurture it and watch it grow into a beautiful butterfly. Use our Shapes PowerPoint Templates because you are the Champion of your team shall anoint. Download our Flow Charts PowerPoint Templates because getting it done in time is the key to success.Use these PowerPoint slides for presentations relating to 3d, abstract, arrow, art, background, blank, business, chart, circle, concept, connection, cycle, development, diagram, direction, element, environment, exchange, finance, financial, flow, graph, graphic, graphic presentation, group, icon, illustration, investment, isolated, isometric, market, motion, movement, organization, passive income, perspective, process, process chart, recycle, report, ring, sign, step, stock, success, symbol, teamwork, text, vector. The prominent colors used in the PowerPoint template are Blue, Purple, Gray. Customers tell us our business powerpoint presentation flow chart Circular Process Network Slides will impress their bosses and teams. PowerPoint presentation experts tell us our circle PowerPoint templates and PPT Slides are Nice. People tell us our business powerpoint presentation flow chart Circular Process Network Slides are readymade to fit into any presentation structure. People tell us our art PowerPoint templates and PPT Slides will make the presenter look like a pro even if they are not computer savvy. Customers tell us our business powerpoint presentation flow chart Circular Process Network Slides are Quaint. People tell us our circle PowerPoint templates and PPT Slides are Breathtaking.

Pie Chart Ppt PowerPoint Presentation Infographic Template Graphics Example
This is a pie chart ppt powerpoint presentation infographic template graphics example. This is a four stage process. The stages in this process are pie chart, finance, marketing, strategy, business.
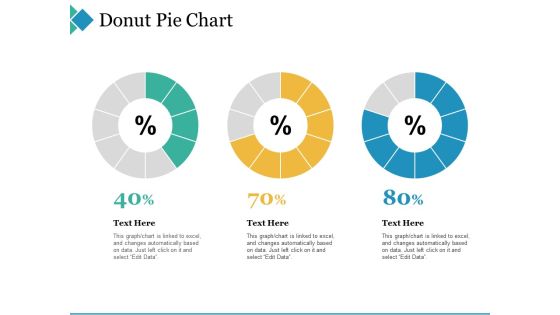
Donut Pie Chart Ppt PowerPoint Presentation Infographic Template Example 2015
This is a donut pie chart ppt powerpoint presentation infographic template example 2015. This is a three stage process. The stages in this process are donut pie chart, finance, marketing, strategy, business.
Donut Pie Chart Ppt PowerPoint Presentation Icon File Formats
This is a Donut Pie Chart Ppt PowerPoint Presentation Icon File Formats. This is a six stage process. The stages in this process are donut pie chart, finance, marketing, strategy, business.

Bar Chart Ppt PowerPoint Presentation Slides Design Ideas
This is a bar chart ppt powerpoint presentation slides design ideas. This is a six stage process. The stages in this process are product, bar chart, sales in percentage.

Growth Chart Business PowerPoint Themes And PowerPoint Slides 0411
Microsoft PowerPoint Theme and Slide with growth chart green bars and red arrow pointing upwards

Area Chart Ppt PowerPoint Presentation Inspiration Clipart Images
This is a area chart ppt powerpoint presentation inspiration clipart images. This is a two stage process. The stages in this process are area chart, growth, finance, business, strategy.
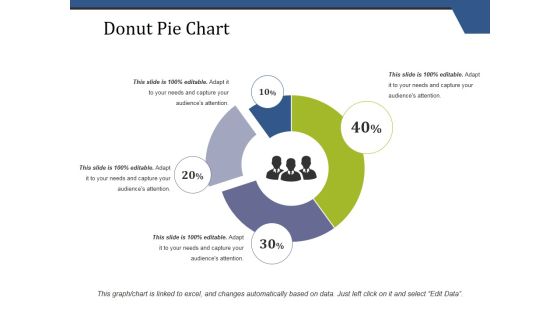
Donut Pie Chart Ppt PowerPoint Presentation Portfolio Clipart Images
This is a donut pie chart ppt powerpoint presentation portfolio clipart images. This is a four stage process. The stages in this process are donut pie chart, finance, marketing, strategy, business.

donut pie chart ppt powerpoint presentation file skills
This is a donut pie chart ppt powerpoint presentation file skills. This is a five stage process. The stages in this process are donut pie chart, finance, marketing, strategy, business.
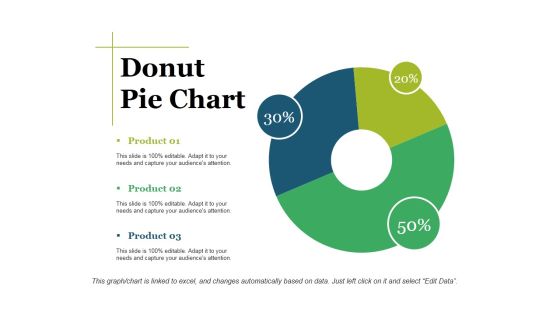
Donut Pie Chart Ppt PowerPoint Presentation Show Graphic Tips
This is a donut pie chart ppt powerpoint presentation show graphic tips. This is a three stage process. The stages in this process are donut pie chart, finance, marketing, strategy, analysis, business.

Donut Pie Chart Ppt PowerPoint Presentation Portfolio Example Topics
This is a donut pie chart ppt powerpoint presentation portfolio example topics. This is a four stage process. The stages in this process are donut pie chart, strategy, business, marketing, finance.
Line Chart Ppt PowerPoint Presentation Infographic Template Icons
This is a line chart ppt powerpoint presentation infographic template icons. This is a two stage process. The stages in this process are sales in percentage, financial years, product, line chart.
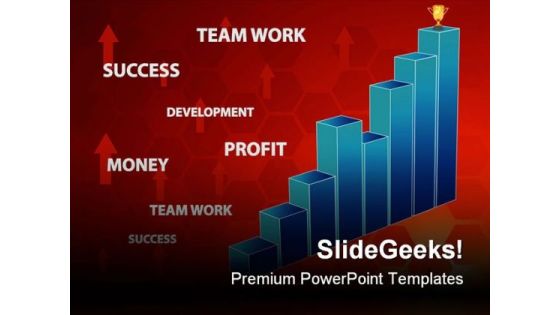
Business Chart Success PowerPoint Background And Template 1210
Microsoft PowerPoint Template and Background with llustration of Business chart computer generated image

Growth Chart Business PowerPoint Templates And PowerPoint Backgrounds 0411
Microsoft PowerPoint Template and Background with growth chart green bars and red arrow pointing upwards

Balanced Investment Annual Returns Performance Chart Designs PDF
This slide showcases a statistical data highlighting performance of balanced funds to measure and analyze returns on investments . It includes key components such as returns in 1 year, returns in 3 years and returns in 5 years. Pitch your topic with ease and precision using this Balanced Investment Annual Returns Performance Chart Designs PDF. This layout presents information on Balanced Investment, Annual Returns, Performance Chart. It is also available for immediate download and adjustment. So, changes can be made in the color, design, graphics or any other component to create a unique layout.
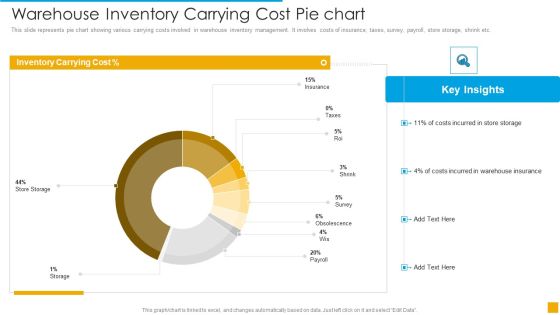
Warehouse Inventory Carrying Cost Pie Chart Demonstration PDF
This slide represents pie chart showing various carrying costs involved in warehouse inventory management. It involves costs of insurance, taxes, survey, payroll, store storage, shrink etc.Pitch your topic with ease and precision using this Warehouse Inventory Carrying Cost Pie Chart Demonstration PDF. This layout presents information on Cost, Inventory, Storage. It is also available for immediate download and adjustment. So, changes can be made in the color, design, graphics or any other component to create a unique layout.
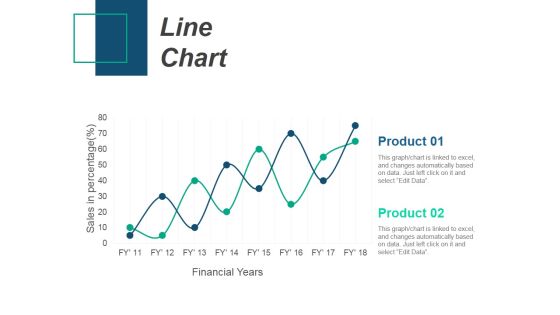
Line Chart Ppt PowerPoint Presentation Infographic Template Introduction
This is a line chart ppt powerpoint presentation infographic template introduction. This is a two stage process. The stages in this process are product, sales in percentage, financial years, line chart.
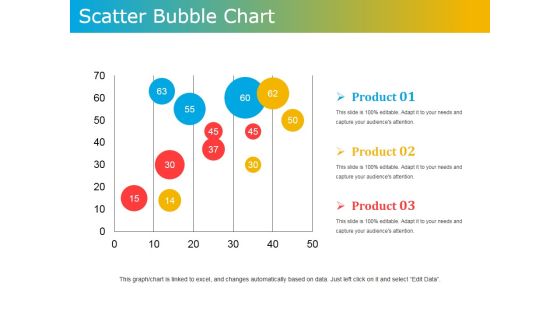
Scatter Bubble Chart Ppt PowerPoint Presentation Ideas Design Templates
This is a scatter bubble chart ppt powerpoint presentation ideas design templates. This is a three stage process. The stages in this process are product, scatter, bubble chart, business, marketing.
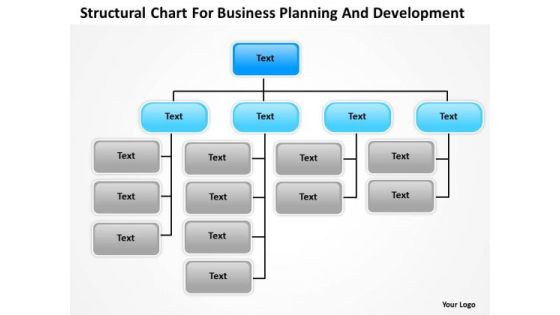
Timeline Structural Chart For Business Planning And Development
Our Timeline Structural Chart For Business Planning And Development give good value for money. They also have respect for the value of your time. Take a leap off the starting blocks with our Timeline Structural Chart For Business Planning And Development. They will put you ahead of the competition in quick time.

Data Analysis Programs 3d Bar Chart To Dispaly PowerPoint Templates
Lower The Drawbridge With Our data analysis programs 3d bar chart to dispaly Powerpoint Templates . Capture The Minds Of Your Audience.

Area Chart Ppt PowerPoint Presentation Infographics Graphics Tutorials
This is a area chart ppt powerpoint presentation infographics graphics tutorials. This is a two stage process. The stages in this process are product, area chart, sales in percentage.
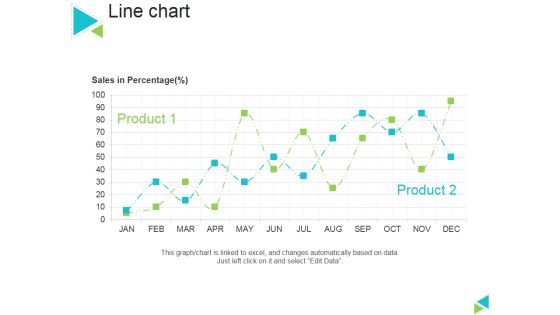
Line Chart Ppt PowerPoint Presentation Gallery Master Slide
This is a line chart ppt powerpoint presentation gallery master slide. This is a two stage process. The stages in this process are sales in percentage, product, line chart.

Column Chart Ppt PowerPoint Presentation Ideas Designs Download
This is a column chart ppt powerpoint presentation ideas designs download. This is a six stage process. The stages in this process are business, strategy, analysis, planning, column chart, financial.

Portative Analysis Bubble Chart Ppt PowerPoint Presentation Slide
This is a portative analysis bubble chart ppt powerpoint presentation slide. This is a six stage process. The stages in this process are portative, analysis, business, graph, bubble chart.

Donut Pie Chart Ppt PowerPoint Presentation Professional Format Ideas
This is a donut pie chart ppt powerpoint presentation professional format ideas. This is a three stage process. The stages in this process are donut pie chart, marketing, strategy, analysis, business.

Stacked Line Chart Ppt PowerPoint Presentation Model Show
This is a stacked line chart ppt powerpoint presentation model show. This is a two stage process. The stages in this process are stacked line chart, product, profit, percentage, growth.

Risk Management Flow Chart For B2B Organization Sample PDF
This slide depicts a risk management flow chart that managers can use to reduce the level of risk at the company by implementing control measures as needed. The key elements are identify and understand nature of risks, develop risk management plan, identify and record risks etc. Presenting Risk Management Flow Chart For B2B Organization Sample PDF to dispense important information. This template comprises one stages. It also presents valuable insights into the topics including Project Initiation, Project Planning, Project Execution Monitoring. This is a completely customizable PowerPoint theme that can be put to use immediately. So, download it and address the topic impactfully.

Data Analysis Template Forex Market Bar Chart PowerPoint Templates
Attract A Crowd With Our data analysis template forex market bar chart Powerpoint Templates . They Will Drop It All And Come To Hear You.
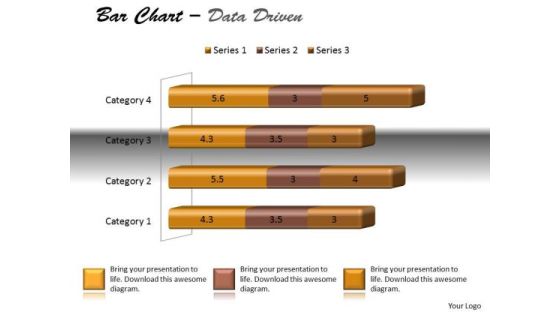
Data Analysis Techniques 3d Bar Chart For Modification PowerPoint Templates
Dreams Generate Thoughts, Thoughts Generate Ideas. Give Them Life With Our data analysis techniques 3d bar chart for modification Powerpoint Templates .
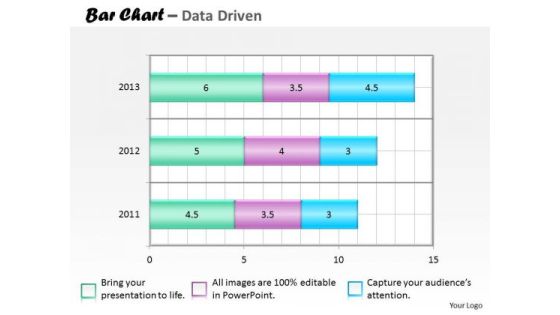
Financial Data Analysis Bar Chart For Collection Of PowerPoint Templates
Our financial data analysis bar chart for collection of Powerpoint Templates Team Are A Dogged Lot. They Keep At It Till They Get It Right.

Financial Data Analysis Currency Trading Bar Chart PowerPoint Templates
Put In A Dollop Of Our financial data analysis currency trading bar chart Powerpoint Templates . Give Your Thoughts A Distinctive Flavor.
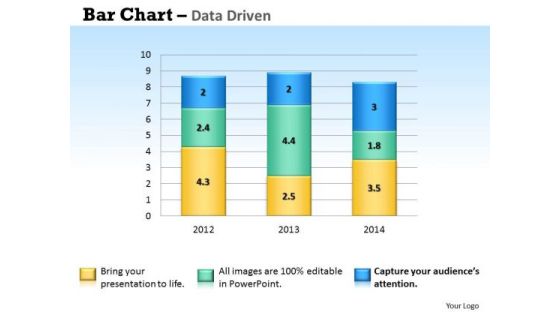
Microsoft Excel Data Analysis Bar Chart To Handle PowerPoint Templates
Our microsoft excel data analysis bar chart to handle Powerpoint Templates And Your Ideas Make A Great Doubles Pair. Play The Net With Assured Hands.
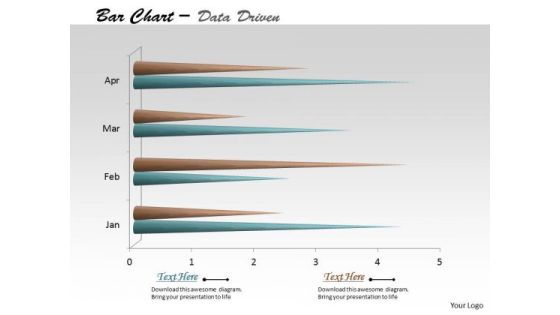
Multivariate Data Analysis Time Based Bar Chart PowerPoint Templates
Edit Your Work With Our multivariate data analysis time based bar chart Powerpoint Templates . They Will Help You Give The Final Form.

Quantitative Data Analysis Bar Chart For Different Categories PowerPoint Templates
Make Some Dough With Our quantitative data analysis bar chart for different categories Powerpoint Templates . Your Assets Will Rise Significantly.

Quantitative Data Analysis Bar Chart For Financial Markets PowerPoint Templates
Draft It Out On Our quantitative data analysis bar chart for financial markets Powerpoint Templates . Give The Final Touches With Your Ideas.
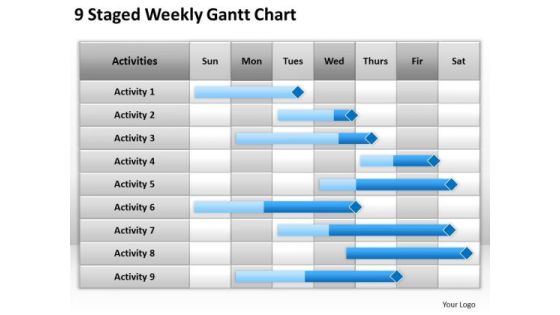
Business PowerPoint Template 9 Staged Weekly Gantt Chart Ppt Templates
Establish your dominion with our Business powerpoint template 9 staged weekly gantt chart ppt templates. Rule the stage with your thoughts. Your ideas demand attention. Our Advertising PowerPoint Templates will get it done. Your listeners will never doodle. Our Org Charts PowerPoint Templates PowerPoint Templates will hold their concentration.

Business PowerPoint Template 10 Staged Unique Gantt Chart Ppt Templates
Open up doors that lead to success. Our Business powerpoint template 10 staged unique gantt chart ppt templates provide the handles. Oppurtunity will come knocking at your door. Welcome it with our Business PowerPoint Templates. Our Org Charts PowerPoint Templates abhor doodling. They never let the interest flag.

10 Stages Converging Business PowerPoint Theme Process Radial Chart Slides
We present our 10 stages converging business powerpoint theme process Radial Chart Slides.Use our Arrows PowerPoint Templates because they help to lay the base of your trend of thought. Use our Flow charts PowerPoint Templates because this template with an image of helps you chart the course of your presentation. Download and present our Business PowerPoint Templates because the majestic tiger lord of all it surveys.It exudes power even when it is in repose. Present our Process and Flows PowerPoint Templates because you can Take your team along by explaining your plans. Present our Circle charts PowerPoint Templates because it is the time to bond with family, friends, colleagues and any other group of your choice.Use these PowerPoint slides for presentations relating to Business, chart, circle, colors, concept, corporate, cycle, data, design, detail, development, diagram, engineering, graphic, ideas, illustration, image, implement, implementation, life, lifecycle, management, model, objects, organization, plan, process, product, professional, project, quality, schema, shape, stack, stage, steps, strategy, structure, success, symbol. The prominent colors used in the PowerPoint template are Yellow, Black, Gray. You can be sure our 10 stages converging business powerpoint theme process Radial Chart Slides are Luxuriant. Presenters tell us our corporate PowerPoint templates and PPT Slides are effectively colour coded to prioritise your plans They automatically highlight the sequence of events you desire. We assure you our 10 stages converging business powerpoint theme process Radial Chart Slides are Efficient. Customers tell us our data PowerPoint templates and PPT Slides are One-of-a-kind. Presenters tell us our 10 stages converging business powerpoint theme process Radial Chart Slides are Stunning. You can be sure our cycle PowerPoint templates and PPT Slides are Lush.

Strategy PowerPoint Template 8 Staged Weekly Gantt Chart Ppt Slides
Dreams generate thoughts, thoughts generate ideas. Give them life with our strategy powerpoint template 8 staged weekly gantt chart ppt Slides. Dreams are the start of many a journey. Pave the way with our Org Charts PowerPoint Templates PowerPoint Templates. Your thoughts will be the main course. Provide the dressing with our Business PowerPoint Templates.

Strategy PowerPoint Template Risk Matrix With Pie Chart Ppt Slides
Be the drummer with our strategy powerpoint template risk matrix with pie chart ppt Slides. Let your thoughts create the beat. Drum out your message on our Org Charts PowerPoint Templates. It will be heard by all far and wide. Up the ante with our Competition PowerPoint Templates. Drum it up to a crescendo.
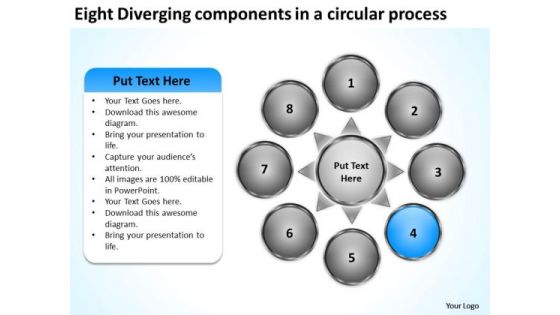
Eight Diverging Components A Circular Process Pie Chart PowerPoint Slides
We present our eight diverging components a circular process Pie Chart PowerPoint Slides.Download our Business PowerPoint Templates because this is the unerring accuracy in reaching the target. the effortless ability to launch into flight. Present our Circle Charts PowerPoint Templates because you have the entire picture in mind. Use our Arrows PowerPoint Templates because this template helps you to put your finger on the pulse of your business and sense the need to re-align a bit. Use our Shapes PowerPoint Templates because this can explain the various related aspects of these varied tracks and how they will, on hitting their own targets, cumulatively contribute to hitting GOLD. Download our Flow charts PowerPoint Templates because this is an appropriate layout to convince your team that they have the ability to score a tEN every time.Use these PowerPoint slides for presentations relating to Arrows, blank, business, central, centralized, chart, circle, circular, circulation concept, conceptual, converging, design, diagram, empty, executive, icon, idea illustration, management, map, mapping, moa, model, numbers, organization outwards, pointing, procedure, process, radial, radiating, relationship, resource sequence, sequential, seven, square, strategy, template. The prominent colors used in the PowerPoint template are Blue, Gray, White. Presenters tell us our eight diverging components a circular process Pie Chart PowerPoint Slides will save the presenter time. Presenters tell us our business PowerPoint templates and PPT Slides are Zippy. PowerPoint presentation experts tell us our eight diverging components a circular process Pie Chart PowerPoint Slides are Appealing. We assure you our chart PowerPoint templates and PPT Slides are Pleasant. Customers tell us our eight diverging components a circular process Pie Chart PowerPoint Slides are Gorgeous. People tell us our business PowerPoint templates and PPT Slides are the best it can get when it comes to presenting.

Bubble Chart Guide To Asset Cost Estimation Structure PDF
There are so many reasons you need a Bubble Chart Guide To Asset Cost Estimation Structure PDF. The first reason is you can not spend time making everything from scratch, Thus, Slidegeeks has made presentation templates for you too. You can easily download these templates from our website easily.
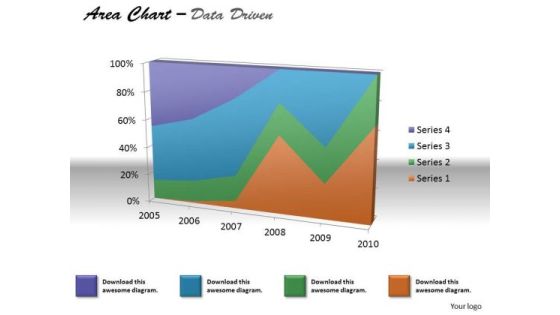
Financial Data Analysis Area Chart For Various Values PowerPoint Templates
Document The Process On Our financial data analysis area chart for various values Powerpoint Templates . Make A Record Of Every Detail.

Combo Chart Finance Ppt PowerPoint Presentation Summary Images
Presenting this set of slides with name combo chart finance ppt powerpoint presentation summary images. The topics discussed in these slides are combo chart, product, growth rate, market size, financial year. This is a completely editable PowerPoint presentation and is available for immediate download. Download now and impress your audience.

 Home
Home