Budget Chart

Dollar Chart Business Success PowerPoint Templates And PowerPoint Backgrounds 0111
Microsoft PowerPoint Template and Background with futuristic finance stock exchange and dollar chart

Project Managers HR Recruitment Flow Chart Icon Sample PDF
Presenting Project Managers HR Recruitment Flow Chart Icon Sample PDF to dispense important information. This template comprises three stages. It also presents valuable insights into the topics including Recruitment Flow Chart Icon, Project Managers Hr. This is a completely customizable PowerPoint theme that can be put to use immediately. So, download it and address the topic impactfully.

Combo Chart Finance Ppt PowerPoint Presentation Portfolio Templates
This is a combo chart finance ppt powerpoint presentation portfolio templates. This is a three stage process. The stages in this process are finance, analysis, business, investment, marketing.

Usa And India Population Comparison Stacked Linear Chart Guidelines PDF
This slide depicts the population comparison chart of USA and India to forecast future population of the respective countries. It includes years and population in MM Pitch your topic with ease and precision using this Usa And India Population Comparison Stacked Linear Chart Guidelines PDF. This layout presents information on Key Insights, Population Growth, Comparison Chart. It is also available for immediate download and adjustment. So, changes can be made in the color, design, graphics or any other component to create a unique layout.

Nine Stages Diverging Factors Flow Chart Circular Network PowerPoint Templates
We present our nine stages diverging factors flow chart Circular Network PowerPoint templates.Use our Ring Charts PowerPoint Templates because they enhance the essence of your viable ideas. Download our Process and Flows PowerPoint Templates because it depicts Rolling along while gathering profits along the way is the aim. Use our Circle charts PowerPoint Templates because you should Emphasise the process of your business or corporate growth. Use our Arrows PowerPoint Templates because by using this slide you can Heighten the anticipation of your audience listing . Download and present our Success PowerPoint Templates because your brain is always churning out ideas like cogs in a wheel.Use these PowerPoint slides for presentations relating to Communication,competition, development, diagram,direction, element, finance, financial,forward, graphic, growth, guide,increase, investment, leader, leadership,management, marketing, motion,moving, organization, path, plan,presentation, price, profit, progress,report, representation, shape, sign. The prominent colors used in the PowerPoint template are Purple, Gray, White. People tell us our nine stages diverging factors flow chart Circular Network PowerPoint templates will save the presenter time. Customers tell us our finance PowerPoint templates and PPT Slides are Romantic. Professionals tell us our nine stages diverging factors flow chart Circular Network PowerPoint templates are topically designed to provide an attractive backdrop to any subject. Presenters tell us our element PowerPoint templates and PPT Slides will make the presenter successul in his career/life. Use our nine stages diverging factors flow chart Circular Network PowerPoint templates are readymade to fit into any presentation structure. Presenters tell us our finance PowerPoint templates and PPT Slides are designed by professionals

Area Chart Finance Ppt PowerPoint Presentation Gallery Elements
This is a area chart finance ppt powerpoint presentation gallery elements. This is a two stage process. The stages in this process are finance, marketing, management, investment, analysis.

Scatter Chart Finance Ppt PowerPoint Presentation Ideas Show
This is a scatter chart finance ppt powerpoint presentation ideas show. This is a two stage process. The stages in this process are finance, marketing, analysis, business, investment.

Area Chart Finance Ppt PowerPoint Presentation Slides Layout
This is a area chart finance ppt powerpoint presentation slides layout. This is a two stage process. The stages in this process are finance, marketing, management, investment, analysis.

Pie Chart Finance Ppt PowerPoint Presentation Inspiration Introduction
This is a pie chart finance ppt powerpoint presentation inspiration introduction. This is a three stage process. The stages in this process are finance, marketing, analysis, business, investment.
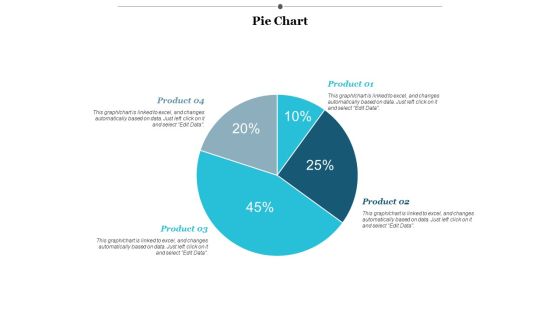
Pie Chart Finance Ppt PowerPoint Presentation Layouts Designs
This is a Pie Chart Finance Ppt PowerPoint Presentation Layouts Designs. This is a four stage process. The stages in this process are finance, marketing, management, investment, analysis.

Pie Chart Finance Ppt PowerPoint Presentation Model Ideas
This is a pie chart finance ppt powerpoint presentation model ideas. This is a four stage process. The stages in this process are finance, marketing, management, investment, analysis.

Column Chart Finance Ppt PowerPoint Presentation Styles Backgrounds
This is a column chart finance ppt powerpoint presentation styles backgrounds. This is a three stage process. The stages in this process are finance, marketing, management, investment, analysis.

Combo Chart Finance Ppt PowerPoint Presentation Portfolio Gridlines
This is a combo chart finance ppt powerpoint presentation portfolio gridlines. This is a two stage process. The stages in this process are finance, analysis, business, investment, marketing.
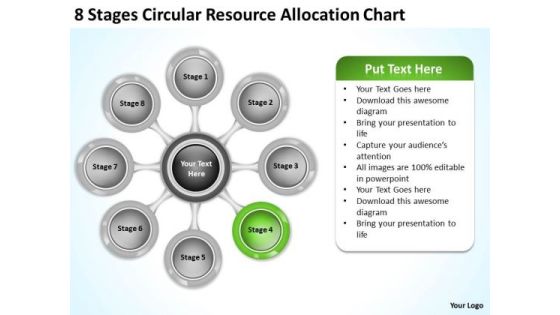
Business Planning Strategy Resource Allocation Chart Level Definition
We present our business planning strategy resource allocation chart level definition.Download and present our Process and Flows PowerPoint Templates because Our PowerPoint Templates and Slides will let you Leave a lasting impression to your audiences. They possess an inherent longstanding recall factor. Use our Circle Charts PowerPoint Templates because Our PowerPoint Templates and Slides are endowed to endure. Ideas conveyed through them will pass the test of time. Download our Ring Charts PowerPoint Templates because Our PowerPoint Templates and Slides has conjured up a web of all you need with the help of our great team. Use them to string together your glistening ideas. Download our Flow Charts PowerPoint Templates because Our PowerPoint Templates and Slides will let your words and thoughts hit bullseye everytime. Use our Marketing PowerPoint Templates because Our PowerPoint Templates and Slides are aesthetically designed to attract attention. We gaurantee that they will grab all the eyeballs you need.Use these PowerPoint slides for presentations relating to Abstract, arrows, business, central, centralized, chart, circle, circular,circulation, concept, conceptual, converging, design, diagram, eight, executive,icon, idea, illustration, management, map, mapping, mba, model, numbers,organization, outwards, pointing, procedure, process, radial, radiating,relationship, resource, sequence, sequential, square, strategy. The prominent colors used in the PowerPoint template are Green lime, Gray, White.

Combo Chart Ppt PowerPoint Presentation Infographic Template Themes
This is a combo chart ppt powerpoint presentation infographic template themes. This is a eight stage process. The stages in this process are combo chart, finance, marketing, strategy, analysis, business.

Diverging Factors Linear Flow Diagram Cycle Chart PowerPoint Slides
We present our diverging factors linear flow diagram Cycle Chart PowerPoint Slides.Download our Circle Charts PowerPoint Templates because you have the ideas to develop the teams vision of where they need to be in the future. Download and present our Arrows PowerPoint Templates because you have the basic goal in mind. Present our Business PowerPoint Templates because you have analysed many global markets and come up with possibilities. Highlight the pros and cons of other likely business oppurtunities. Present our Shapes PowerPoint Templates because you can Unravel the desired and essential elements of your overall strategy. Present our Flow Charts PowerPoint Templates because there is a crucial aspect that requires extra attention.Use these PowerPoint slides for presentations relating to action, around, arrow, business, button, cartoon, catalyzing, center, chart, circle, circuits, clipart, comic, commerce, concept, conceptual, continue, corporate, cycle, diagram, guide, guidelines, illustration, line, manage, management, map, marketing, mentoring, messenger, mind, mind mapping, mindmap, organization, performance, plans, procedure, process, project, public, repeat, representation, sketch, steps, topic, vector, web, weblogs, website. The prominent colors used in the PowerPoint template are Yellow, Green, Blue. Customers tell us our diverging factors linear flow diagram Cycle Chart PowerPoint Slides are Amazing. PowerPoint presentation experts tell us our business PowerPoint templates and PPT Slides are Lush. People tell us our diverging factors linear flow diagram Cycle Chart PowerPoint Slides will make the presenter successul in his career/life. People tell us our catalyzing PowerPoint templates and PPT Slides are Magical. Customers tell us our diverging factors linear flow diagram Cycle Chart PowerPoint Slides are Striking. People tell us our chart PowerPoint templates and PPT Slides are Clever.

Business PowerPoint Presentation Flow Chart Circular Process Network Slides
We present our business powerpoint presentation flow chart Circular Process Network Slides.Use our Circle Charts PowerPoint Templates because with the help of our Slides you can Illustrate these thoughts with this slide. Use our Arrows PowerPoint Templates because the great Bald headed Eagle embodies your personality. the eagle eye to seize upon the smallest of oppurtunities. Download and present our Business PowerPoint Templates because your fledgling career is in the chrysallis stage. Nurture it and watch it grow into a beautiful butterfly. Use our Shapes PowerPoint Templates because you are the Champion of your team shall anoint. Download our Flow Charts PowerPoint Templates because getting it done in time is the key to success.Use these PowerPoint slides for presentations relating to 3d, abstract, arrow, art, background, blank, business, chart, circle, concept, connection, cycle, development, diagram, direction, element, environment, exchange, finance, financial, flow, graph, graphic, graphic presentation, group, icon, illustration, investment, isolated, isometric, market, motion, movement, organization, passive income, perspective, process, process chart, recycle, report, ring, sign, step, stock, success, symbol, teamwork, text, vector. The prominent colors used in the PowerPoint template are Blue, Purple, Gray. Customers tell us our business powerpoint presentation flow chart Circular Process Network Slides will impress their bosses and teams. PowerPoint presentation experts tell us our circle PowerPoint templates and PPT Slides are Nice. People tell us our business powerpoint presentation flow chart Circular Process Network Slides are readymade to fit into any presentation structure. People tell us our art PowerPoint templates and PPT Slides will make the presenter look like a pro even if they are not computer savvy. Customers tell us our business powerpoint presentation flow chart Circular Process Network Slides are Quaint. People tell us our circle PowerPoint templates and PPT Slides are Breathtaking.

Pie Chart Ppt PowerPoint Presentation Infographic Template Graphics Example
This is a pie chart ppt powerpoint presentation infographic template graphics example. This is a four stage process. The stages in this process are pie chart, finance, marketing, strategy, business.
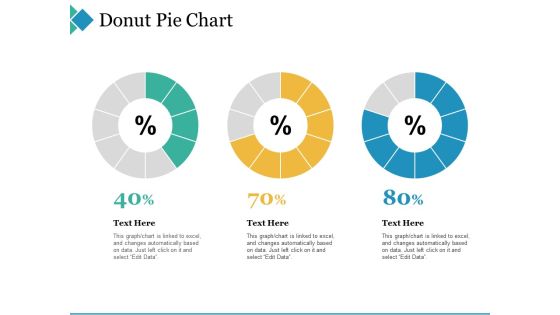
Donut Pie Chart Ppt PowerPoint Presentation Infographic Template Example 2015
This is a donut pie chart ppt powerpoint presentation infographic template example 2015. This is a three stage process. The stages in this process are donut pie chart, finance, marketing, strategy, business.
Donut Pie Chart Ppt PowerPoint Presentation Icon File Formats
This is a Donut Pie Chart Ppt PowerPoint Presentation Icon File Formats. This is a six stage process. The stages in this process are donut pie chart, finance, marketing, strategy, business.

Bar Chart Ppt PowerPoint Presentation Slides Design Ideas
This is a bar chart ppt powerpoint presentation slides design ideas. This is a six stage process. The stages in this process are product, bar chart, sales in percentage.

Growth Chart Business PowerPoint Themes And PowerPoint Slides 0411
Microsoft PowerPoint Theme and Slide with growth chart green bars and red arrow pointing upwards

Area Chart Ppt PowerPoint Presentation Inspiration Clipart Images
This is a area chart ppt powerpoint presentation inspiration clipart images. This is a two stage process. The stages in this process are area chart, growth, finance, business, strategy.
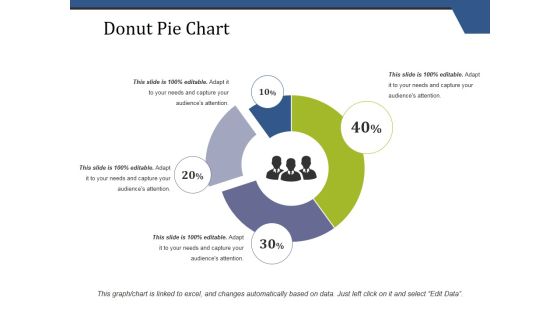
Donut Pie Chart Ppt PowerPoint Presentation Portfolio Clipart Images
This is a donut pie chart ppt powerpoint presentation portfolio clipart images. This is a four stage process. The stages in this process are donut pie chart, finance, marketing, strategy, business.

donut pie chart ppt powerpoint presentation file skills
This is a donut pie chart ppt powerpoint presentation file skills. This is a five stage process. The stages in this process are donut pie chart, finance, marketing, strategy, business.
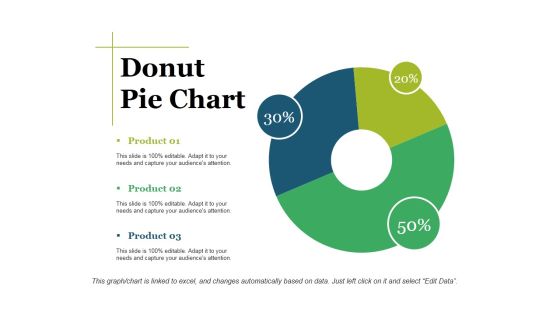
Donut Pie Chart Ppt PowerPoint Presentation Show Graphic Tips
This is a donut pie chart ppt powerpoint presentation show graphic tips. This is a three stage process. The stages in this process are donut pie chart, finance, marketing, strategy, analysis, business.

Donut Pie Chart Ppt PowerPoint Presentation Portfolio Example Topics
This is a donut pie chart ppt powerpoint presentation portfolio example topics. This is a four stage process. The stages in this process are donut pie chart, strategy, business, marketing, finance.
Line Chart Ppt PowerPoint Presentation Infographic Template Icons
This is a line chart ppt powerpoint presentation infographic template icons. This is a two stage process. The stages in this process are sales in percentage, financial years, product, line chart.
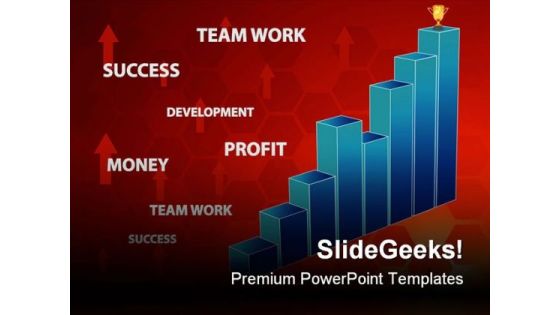
Business Chart Success PowerPoint Background And Template 1210
Microsoft PowerPoint Template and Background with llustration of Business chart computer generated image

Growth Chart Business PowerPoint Templates And PowerPoint Backgrounds 0411
Microsoft PowerPoint Template and Background with growth chart green bars and red arrow pointing upwards

Balanced Investment Annual Returns Performance Chart Designs PDF
This slide showcases a statistical data highlighting performance of balanced funds to measure and analyze returns on investments . It includes key components such as returns in 1 year, returns in 3 years and returns in 5 years. Pitch your topic with ease and precision using this Balanced Investment Annual Returns Performance Chart Designs PDF. This layout presents information on Balanced Investment, Annual Returns, Performance Chart. It is also available for immediate download and adjustment. So, changes can be made in the color, design, graphics or any other component to create a unique layout.
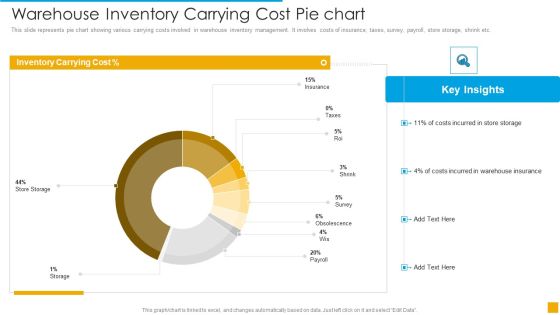
Warehouse Inventory Carrying Cost Pie Chart Demonstration PDF
This slide represents pie chart showing various carrying costs involved in warehouse inventory management. It involves costs of insurance, taxes, survey, payroll, store storage, shrink etc.Pitch your topic with ease and precision using this Warehouse Inventory Carrying Cost Pie Chart Demonstration PDF. This layout presents information on Cost, Inventory, Storage. It is also available for immediate download and adjustment. So, changes can be made in the color, design, graphics or any other component to create a unique layout.
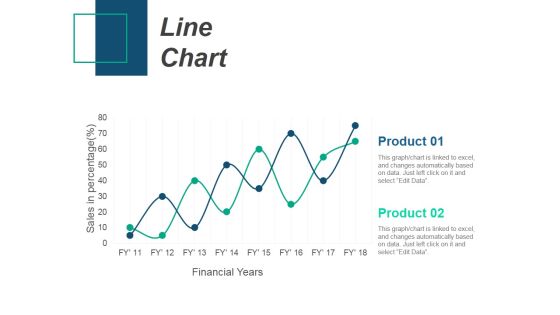
Line Chart Ppt PowerPoint Presentation Infographic Template Introduction
This is a line chart ppt powerpoint presentation infographic template introduction. This is a two stage process. The stages in this process are product, sales in percentage, financial years, line chart.
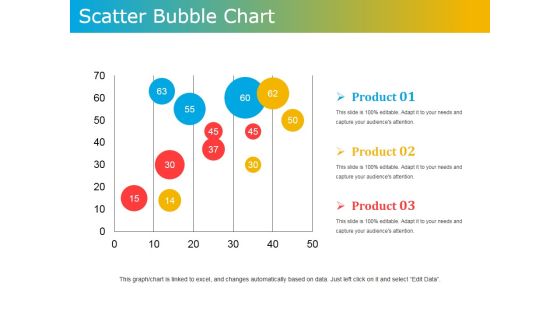
Scatter Bubble Chart Ppt PowerPoint Presentation Ideas Design Templates
This is a scatter bubble chart ppt powerpoint presentation ideas design templates. This is a three stage process. The stages in this process are product, scatter, bubble chart, business, marketing.
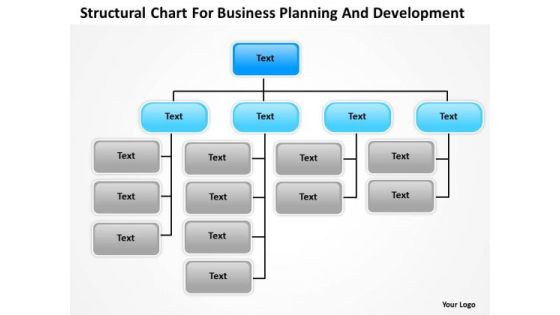
Timeline Structural Chart For Business Planning And Development
Our Timeline Structural Chart For Business Planning And Development give good value for money. They also have respect for the value of your time. Take a leap off the starting blocks with our Timeline Structural Chart For Business Planning And Development. They will put you ahead of the competition in quick time.

Data Analysis Programs 3d Bar Chart To Dispaly PowerPoint Templates
Lower The Drawbridge With Our data analysis programs 3d bar chart to dispaly Powerpoint Templates . Capture The Minds Of Your Audience.

Area Chart Ppt PowerPoint Presentation Infographics Graphics Tutorials
This is a area chart ppt powerpoint presentation infographics graphics tutorials. This is a two stage process. The stages in this process are product, area chart, sales in percentage.
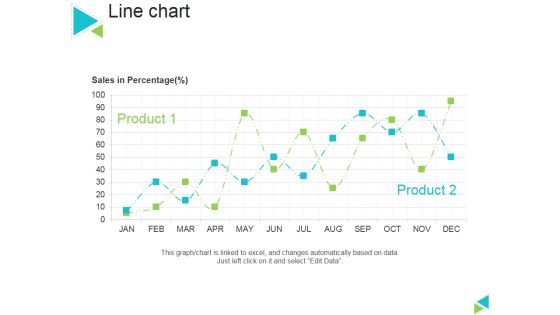
Line Chart Ppt PowerPoint Presentation Gallery Master Slide
This is a line chart ppt powerpoint presentation gallery master slide. This is a two stage process. The stages in this process are sales in percentage, product, line chart.

Column Chart Ppt PowerPoint Presentation Ideas Designs Download
This is a column chart ppt powerpoint presentation ideas designs download. This is a six stage process. The stages in this process are business, strategy, analysis, planning, column chart, financial.

Portative Analysis Bubble Chart Ppt PowerPoint Presentation Slide
This is a portative analysis bubble chart ppt powerpoint presentation slide. This is a six stage process. The stages in this process are portative, analysis, business, graph, bubble chart.

Donut Pie Chart Ppt PowerPoint Presentation Professional Format Ideas
This is a donut pie chart ppt powerpoint presentation professional format ideas. This is a three stage process. The stages in this process are donut pie chart, marketing, strategy, analysis, business.

Stacked Line Chart Ppt PowerPoint Presentation Model Show
This is a stacked line chart ppt powerpoint presentation model show. This is a two stage process. The stages in this process are stacked line chart, product, profit, percentage, growth.

Risk Management Flow Chart For B2B Organization Sample PDF
This slide depicts a risk management flow chart that managers can use to reduce the level of risk at the company by implementing control measures as needed. The key elements are identify and understand nature of risks, develop risk management plan, identify and record risks etc. Presenting Risk Management Flow Chart For B2B Organization Sample PDF to dispense important information. This template comprises one stages. It also presents valuable insights into the topics including Project Initiation, Project Planning, Project Execution Monitoring. This is a completely customizable PowerPoint theme that can be put to use immediately. So, download it and address the topic impactfully.

Data Analysis Template Forex Market Bar Chart PowerPoint Templates
Attract A Crowd With Our data analysis template forex market bar chart Powerpoint Templates . They Will Drop It All And Come To Hear You.
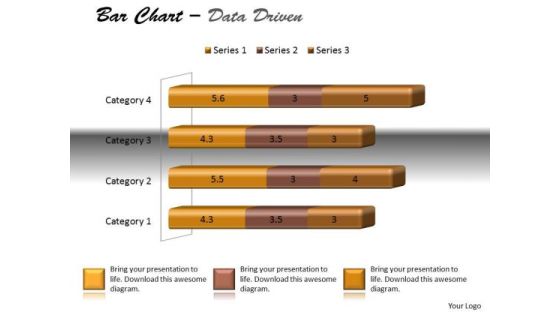
Data Analysis Techniques 3d Bar Chart For Modification PowerPoint Templates
Dreams Generate Thoughts, Thoughts Generate Ideas. Give Them Life With Our data analysis techniques 3d bar chart for modification Powerpoint Templates .
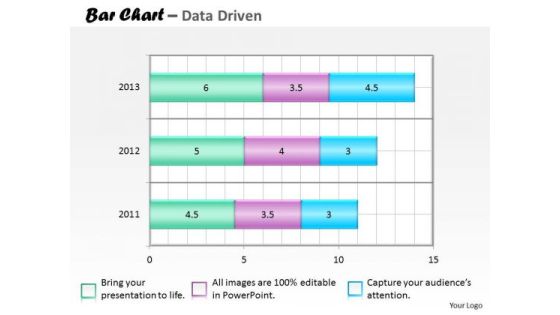
Financial Data Analysis Bar Chart For Collection Of PowerPoint Templates
Our financial data analysis bar chart for collection of Powerpoint Templates Team Are A Dogged Lot. They Keep At It Till They Get It Right.

Financial Data Analysis Currency Trading Bar Chart PowerPoint Templates
Put In A Dollop Of Our financial data analysis currency trading bar chart Powerpoint Templates . Give Your Thoughts A Distinctive Flavor.
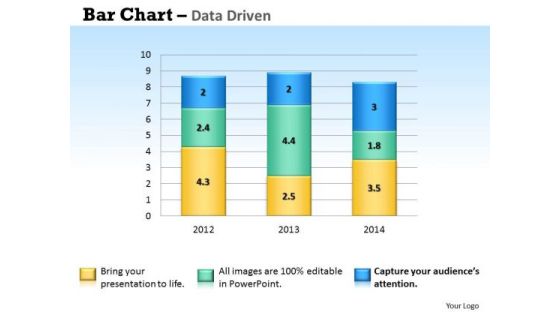
Microsoft Excel Data Analysis Bar Chart To Handle PowerPoint Templates
Our microsoft excel data analysis bar chart to handle Powerpoint Templates And Your Ideas Make A Great Doubles Pair. Play The Net With Assured Hands.
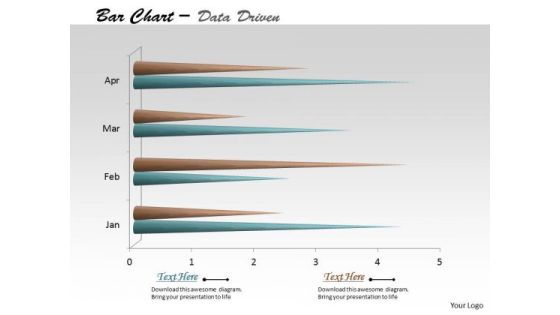
Multivariate Data Analysis Time Based Bar Chart PowerPoint Templates
Edit Your Work With Our multivariate data analysis time based bar chart Powerpoint Templates . They Will Help You Give The Final Form.

Quantitative Data Analysis Bar Chart For Different Categories PowerPoint Templates
Make Some Dough With Our quantitative data analysis bar chart for different categories Powerpoint Templates . Your Assets Will Rise Significantly.

Quantitative Data Analysis Bar Chart For Financial Markets PowerPoint Templates
Draft It Out On Our quantitative data analysis bar chart for financial markets Powerpoint Templates . Give The Final Touches With Your Ideas.
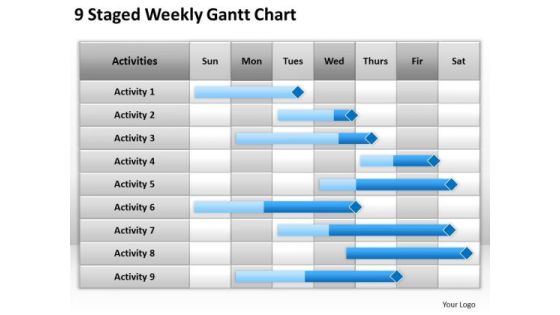
Business PowerPoint Template 9 Staged Weekly Gantt Chart Ppt Templates
Establish your dominion with our Business powerpoint template 9 staged weekly gantt chart ppt templates. Rule the stage with your thoughts. Your ideas demand attention. Our Advertising PowerPoint Templates will get it done. Your listeners will never doodle. Our Org Charts PowerPoint Templates PowerPoint Templates will hold their concentration.

Business PowerPoint Template 10 Staged Unique Gantt Chart Ppt Templates
Open up doors that lead to success. Our Business powerpoint template 10 staged unique gantt chart ppt templates provide the handles. Oppurtunity will come knocking at your door. Welcome it with our Business PowerPoint Templates. Our Org Charts PowerPoint Templates abhor doodling. They never let the interest flag.

10 Stages Converging Business PowerPoint Theme Process Radial Chart Slides
We present our 10 stages converging business powerpoint theme process Radial Chart Slides.Use our Arrows PowerPoint Templates because they help to lay the base of your trend of thought. Use our Flow charts PowerPoint Templates because this template with an image of helps you chart the course of your presentation. Download and present our Business PowerPoint Templates because the majestic tiger lord of all it surveys.It exudes power even when it is in repose. Present our Process and Flows PowerPoint Templates because you can Take your team along by explaining your plans. Present our Circle charts PowerPoint Templates because it is the time to bond with family, friends, colleagues and any other group of your choice.Use these PowerPoint slides for presentations relating to Business, chart, circle, colors, concept, corporate, cycle, data, design, detail, development, diagram, engineering, graphic, ideas, illustration, image, implement, implementation, life, lifecycle, management, model, objects, organization, plan, process, product, professional, project, quality, schema, shape, stack, stage, steps, strategy, structure, success, symbol. The prominent colors used in the PowerPoint template are Yellow, Black, Gray. You can be sure our 10 stages converging business powerpoint theme process Radial Chart Slides are Luxuriant. Presenters tell us our corporate PowerPoint templates and PPT Slides are effectively colour coded to prioritise your plans They automatically highlight the sequence of events you desire. We assure you our 10 stages converging business powerpoint theme process Radial Chart Slides are Efficient. Customers tell us our data PowerPoint templates and PPT Slides are One-of-a-kind. Presenters tell us our 10 stages converging business powerpoint theme process Radial Chart Slides are Stunning. You can be sure our cycle PowerPoint templates and PPT Slides are Lush.

Strategy PowerPoint Template 8 Staged Weekly Gantt Chart Ppt Slides
Dreams generate thoughts, thoughts generate ideas. Give them life with our strategy powerpoint template 8 staged weekly gantt chart ppt Slides. Dreams are the start of many a journey. Pave the way with our Org Charts PowerPoint Templates PowerPoint Templates. Your thoughts will be the main course. Provide the dressing with our Business PowerPoint Templates.

Strategy PowerPoint Template Risk Matrix With Pie Chart Ppt Slides
Be the drummer with our strategy powerpoint template risk matrix with pie chart ppt Slides. Let your thoughts create the beat. Drum out your message on our Org Charts PowerPoint Templates. It will be heard by all far and wide. Up the ante with our Competition PowerPoint Templates. Drum it up to a crescendo.
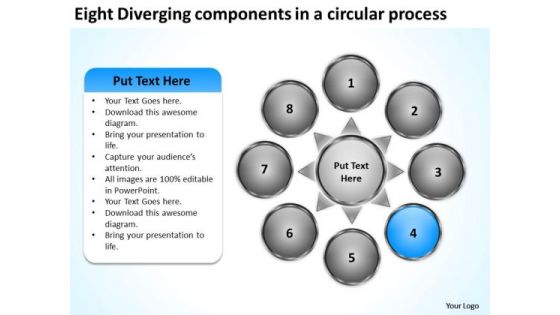
Eight Diverging Components A Circular Process Pie Chart PowerPoint Slides
We present our eight diverging components a circular process Pie Chart PowerPoint Slides.Download our Business PowerPoint Templates because this is the unerring accuracy in reaching the target. the effortless ability to launch into flight. Present our Circle Charts PowerPoint Templates because you have the entire picture in mind. Use our Arrows PowerPoint Templates because this template helps you to put your finger on the pulse of your business and sense the need to re-align a bit. Use our Shapes PowerPoint Templates because this can explain the various related aspects of these varied tracks and how they will, on hitting their own targets, cumulatively contribute to hitting GOLD. Download our Flow charts PowerPoint Templates because this is an appropriate layout to convince your team that they have the ability to score a tEN every time.Use these PowerPoint slides for presentations relating to Arrows, blank, business, central, centralized, chart, circle, circular, circulation concept, conceptual, converging, design, diagram, empty, executive, icon, idea illustration, management, map, mapping, moa, model, numbers, organization outwards, pointing, procedure, process, radial, radiating, relationship, resource sequence, sequential, seven, square, strategy, template. The prominent colors used in the PowerPoint template are Blue, Gray, White. Presenters tell us our eight diverging components a circular process Pie Chart PowerPoint Slides will save the presenter time. Presenters tell us our business PowerPoint templates and PPT Slides are Zippy. PowerPoint presentation experts tell us our eight diverging components a circular process Pie Chart PowerPoint Slides are Appealing. We assure you our chart PowerPoint templates and PPT Slides are Pleasant. Customers tell us our eight diverging components a circular process Pie Chart PowerPoint Slides are Gorgeous. People tell us our business PowerPoint templates and PPT Slides are the best it can get when it comes to presenting.

Bubble Chart Guide To Asset Cost Estimation Structure PDF
There are so many reasons you need a Bubble Chart Guide To Asset Cost Estimation Structure PDF. The first reason is you can not spend time making everything from scratch, Thus, Slidegeeks has made presentation templates for you too. You can easily download these templates from our website easily.
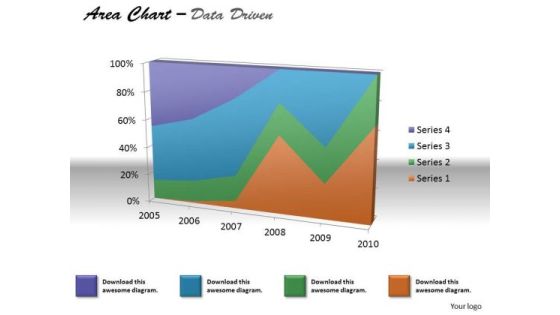
Financial Data Analysis Area Chart For Various Values PowerPoint Templates
Document The Process On Our financial data analysis area chart for various values Powerpoint Templates . Make A Record Of Every Detail.

Combo Chart Finance Ppt PowerPoint Presentation Summary Images
Presenting this set of slides with name combo chart finance ppt powerpoint presentation summary images. The topics discussed in these slides are combo chart, product, growth rate, market size, financial year. This is a completely editable PowerPoint presentation and is available for immediate download. Download now and impress your audience.

Big Data Project Process Flow Chart With Evaluation Ppt Portfolio
Presenting big data project process flow chart with evaluation ppt portfolio to dispense important information. This template comprises seven stages. It also presents valuable insights into the topics including social media, management, network analysis, data storage, infrastructure. This is a completely customizable PowerPoint theme that can be put to use immediately. So, download it and address the topic impactfully.
Money Management Chart Ppt Powerpoint Presentation Icon Designs Cpb
This is a money management chart ppt powerpoint presentation icon designs cpb. This is a five stage process. The stages in this process are money management chart.

Data Analysis In Excel Of Stock Chart PowerPoint Templates
Plan Your Storyboard With Our data analysis in excel of stock chart Powerpoint Templates . Give An Outline To The Solutions You Have.
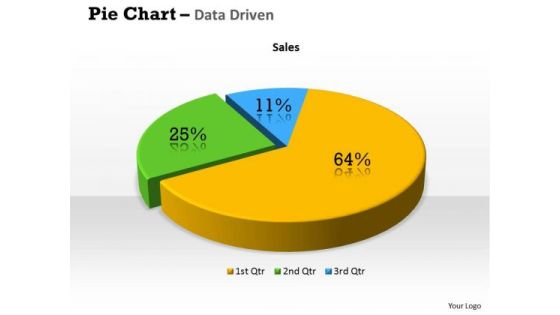
Quantitative Data Analysis 3d Percentage Ratio Pie Chart PowerPoint Templates
Plan Your Storyboard With Our quantitative data analysis 3d percentage ratio pie chart Powerpoint Templates . Give An Outline To The Solutions You Have.

Data Analysis Template Driven Visualization Area Chart PowerPoint Slides Templates
Draw On The Energy Of Our data analysis template driven visualization area chart powerpoint slides Templates . Your Thoughts Will Perk Up.
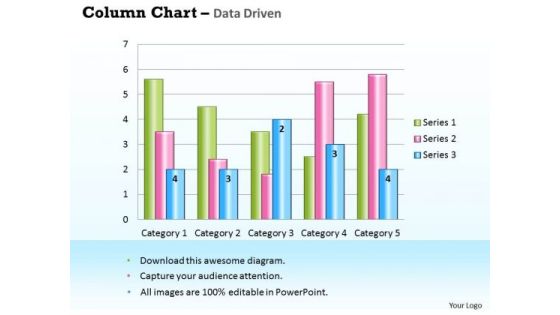
Business Data Analysis Chart For Case Studies PowerPoint Templates
Get Out Of The Dock With Our business data analysis chart for case studies Powerpoint Templates. Your Mind Will Be Set Free.
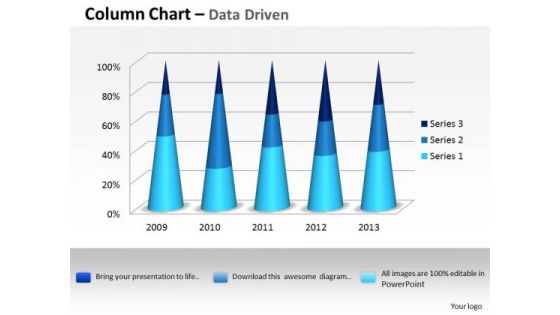
Data Analysis Excel 3d Process Variation Column Chart PowerPoint Templates
Put In A Dollop Of Our data analysis excel 3d process variation column chart Powerpoint Templates. Give Your Thoughts A Distinctive Flavor.

Data Analysis Excel Bubble Chart For Business Tasks PowerPoint Templates
Doll Up Your Thoughts With Our data analysis excel bubble chart for business tasks Powerpoint Templates. They Will Make A Pretty Picture.
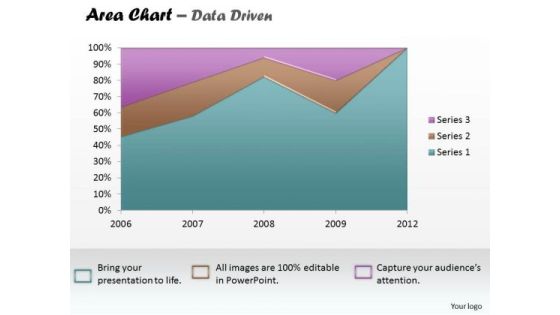
Data Analysis Excel Business Reporting Area Chart PowerPoint Templates
Establish The Dominance Of Your Ideas. Our data analysis excel business reporting area chart Powerpoint Templates Will Put Them On Top.

Data Analysis In Excel 3d Classification Of Chart PowerPoint Templates
With Our data analysis in excel 3d classification of chart Powerpoint Templates You Will Be Doubly Sure. They Possess That Stamp Of Authority.
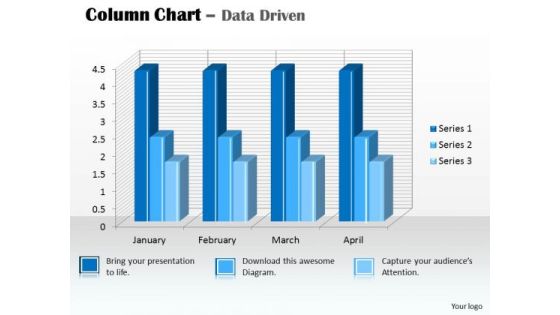
Data Analysis In Excel 3d Column Chart For PowerPoint Templates
Our data analysis in excel 3d column chart for Powerpoint Templates And Your Ideas Make A Great Doubles Pair. Play The Net With Assured Hands.

Data Analysis Techniques 3d In Segments Pie Chart PowerPoint Templates
Drink To The Success Of Your Campaign. Our data analysis techniques 3d in segments pie chart Powerpoint Templates Will Raise A Toast.

Financial Data Analysis Area Chart For Showing Trends PowerPoint Templates
Document Your Views On Our financial data analysis area chart for showing trends Powerpoint Templates . They Will Create A Strong Impression.
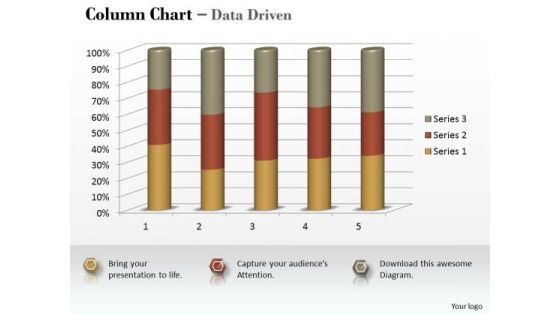
Marketing Data Analysis 3d Statistical Process Column Chart PowerPoint Templates
Be A Donor Of Great Ideas. Display Your Charity On Our marketing data analysis 3d statistical process column chart Powerpoint Templates .

Marketing Data Analysis 3d Statistical Process Control Chart PowerPoint Templates
Open Up Doors That Lead To Success. Our marketing data analysis 3d statistical process control chart Powerpoint Templates Provide The Handles.

Clustered Bar Chart Ppt PowerPoint Presentation Summary Templates
This is a clustered bar chart ppt powerpoint presentation summary templates. This is a three stage process. The stages in this process are finance, marketing, management, investment, analysis.
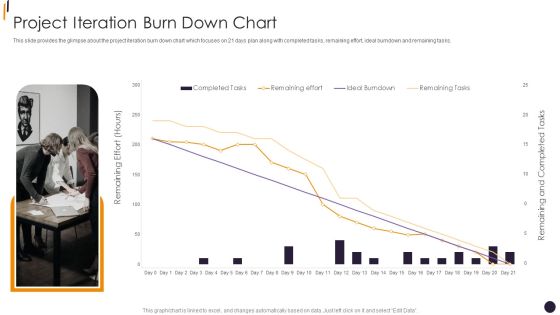
PMP Tools Project Iteration Burn Down Chart Slides PDF
This slide provides the glimpse about the project iteration burn down chart which focuses on 21 days plan along with completed tasks, remaining effort, ideal burndown and remaining tasks.Deliver an awe inspiring pitch with this creative PMP Tools Project Iteration Burn Down Chart Slides PDF bundle. Topics like Remaining Effort, Remaining Tasks, Completed Tasks can be discussed with this completely editable template. It is available for immediate download depending on the needs and requirements of the user.

Project Administration Chart With Capability Assessment Elements PDF
In this slide we have showcased employee performance for Digital marketing and java project which includes assessment of team skills collectively and individually. Showcasing this set of slides titled project administration chart with capability assessment elements pdf. The topics addressed in these templates are project administration chart with capability assessment. All the content presented in this PPT design is completely editable. Download it and make adjustments in color, background, font etc. as per your unique business setting.

Bar Chart Growth Ppt PowerPoint Presentation Gallery Graphics
This is a bar chart growth ppt powerpoint presentation gallery graphics. This is a two stage process. The stages in this process are analysis, business, finance, investment, strategy.

Bar Chart Ppt PowerPoint Presentation Professional Clipart Images
This is a bar chart ppt powerpoint presentation professional clipart images. This is a three stage process. The stages in this process are business, finance, analysis, investment, marketing.

Bar Chart Financial Ppt PowerPoint Presentation Pictures Files
This is a bar chart financial ppt powerpoint presentation pictures files. This is a five stage process. The stages in this process are finance, marketing, management, investment, analysis.

Clustered Bar Chart Ppt PowerPoint Presentation Layouts Infographics
This is a clustered bar chart ppt powerpoint presentation layouts infographics. This is a three stage process. The stages in this process are finance, marketing, management, investment, analysis.

Clustered Bar Chart Ppt PowerPoint Presentation Professional Good
This is a clustered bar chart ppt powerpoint presentation professional good. This is a three stage process. The stages in this process are finance, marketing, management, investment, analysis.

Stacked Bar Chart Ppt PowerPoint Presentation Gallery Outfit
This is a stacked bar chart ppt powerpoint presentation gallery outfit. This is a three stage process. The stages in this process are finance, marketing, management, investment, analysis.

Regional Sales Percentage Column Chart With Key Insights Diagrams PDF
This slide illustrates sales percentage chart in regions of USA to calculate and interpret present fuel consumption. It includes parts such as regions and sales percentage.Pitch your topic with ease and precision using this Regional Sales Percentage Column Chart With Key Insights Diagrams PDF. This layout presents information on Industries Central, Sales Central, Productions Companies. It is also available for immediate download and adjustment. So, changes can be made in the color, design, graphics or any other component to create a unique layout.

Bar Chart Software Designing And Development Playbook Ideas PDF
Presenting this PowerPoint presentation, titled Bar Chart Software Designing And Development Playbook Ideas PDF, with topics curated by our researchers after extensive research. This editable presentation is available for immediate download and provides attractive features when used. Download now and captivate your audience. Presenting this Bar Chart Software Designing And Development Playbook Ideas PDF. Our researchers have carefully researched and created these slides with all aspects taken into consideration. This is a completely customizable Bar Chart Software Designing And Development Playbook Ideas PDF that is available for immediate downloading. Download now and make an impact on your audience. Highlight the attractive features available with our PPTs.

8 Diverging Factors Arrow Flow Chart Circular Process PowerPoint Slides
We present our 8 diverging factors arrow flow chart Circular Process PowerPoint Slides.Download and present our Arrows PowerPoint Templates because the vision of being the market leader is clear to you. Use our Circle Charts PowerPoint Templates because this amazing layout demonstrates how they all combine to form the final product. Present our Shapes PowerPoint Templates because the colour coding of our templates are specifically designed to highlight you points. Download our Business PowerPoint Templates because The foundation of the structure of your business is resilient and dependable. Convey this confidence to your colleagues and assure them of a great and enduring future. Present our Flow Charts PowerPoint Templates because you can Refine them all as you take them through the numerous filtering stages of the funnel of your quality control process.Use these PowerPoint slides for presentations relating to abstract, arrow, brochure, business, businessman, button, chart, circle, company, cyclic, data, demonstration, diagram, economic, financial, five, glossy, goal, graph, illustration, info, information, investment, man, manage, marketing, model, navigation, option, part, people, person, pie, presentation, process, result, section, segmented, sharing, silhouette, sphere, statistics, stock, strategy, template, variation, vector, wheel. The prominent colors used in the PowerPoint template are Red, Pink, Purple. Presenters tell us our 8 diverging factors arrow flow chart Circular Process PowerPoint Slides are Second to none. You can be sure our company PowerPoint templates and PPT Slides are Upbeat. Professionals tell us our 8 diverging factors arrow flow chart Circular Process PowerPoint Slides are incredible easy to use. People tell us our circle PowerPoint templates and PPT Slides are Sparkling. People tell us our 8 diverging factors arrow flow chart Circular Process PowerPoint Slides are Cheerful. Professionals tell us our button PowerPoint templates and PPT Slides are Appealing.

Column Chart Finance Investment Ppt PowerPoint Presentation Inspiration Template
This is a column chart finance investment ppt powerpoint presentation inspiration template. This is a two stage process. The stages in this process are finance, analysis, business, investment, marketing.

Achieved And Pending Workplace Diversity Objectives Chart Guidelines PDF
This slide displays the bar chart representing the percentage of diversity goals achieved. It also includes some key insights such as an increase in the women workforce in tech roles, increase in director level black representation, etc. Showcasing this set of slides titled Achieved And Pending Workplace Diversity Objectives Chart Guidelines PDF. The topics addressed in these templates are Achieved And Pending Workplace, Diversity Objectives Chart. All the content presented in this PPT design is completely editable. Download it and make adjustments in color, background, font etc. as per your unique business setting.

Area Chart Financial Ppt PowerPoint Presentation Styles Templates
This is a area chart financial ppt powerpoint presentation styles templates. This is a two stage process. The stages in this process are finance, marketing, management, investment, analysis.
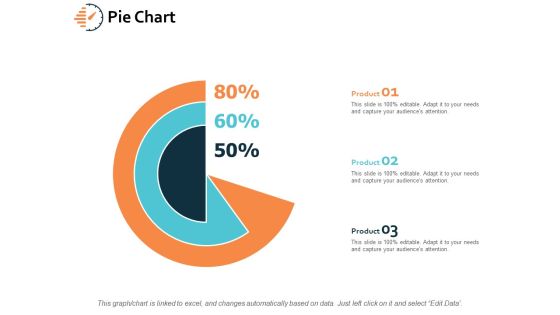
Pie Chart Investment Finance Ppt PowerPoint Presentation File Influencers
This is a pie chart investment finance ppt powerpoint presentation file influencers. This is a three stage process. The stages in this process are finance, analysis, business, investment, marketing.
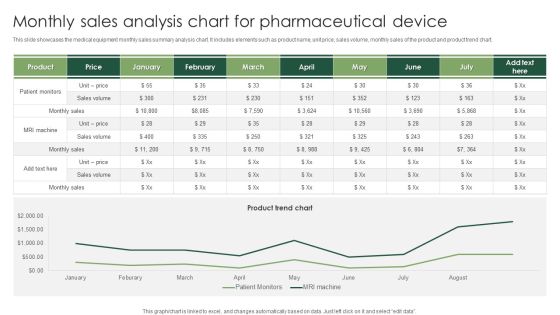
Monthly Sales Analysis Chart For Pharmaceutical Device Structure PDF
This slide showcases the medical equipment monthly sales summary analysis chart. It includes elements such as product name, unit price, sales volume, monthly sales of the product and product trend chart. Showcasing this set of slides titled Monthly Sales Analysis Chart For Pharmaceutical Device Structure PDF. The topics addressed in these templates are Monthly Sales Analysis, Pharmaceutical Device. All the content presented in this PPT design is completely editable. Download it and make adjustments in color, background, font etc. as per your unique business setting.

Car Company Market Share Circle Chart Slides PDF
This slide depicts the market share percentage chart of car companies in the USA to determine the market leader. It shows percentage share of General motors, Toyota, Stellanis, and Hyundai. Showcasing this set of slides titled Car Company Market Share Circle Chart Slides PDF. The topics addressed in these templates are Car Company Market, Share Circle Chart. All the content presented in this PPT design is completely editable. Download it and make adjustments in color, background, font etc. as per your unique business setting.
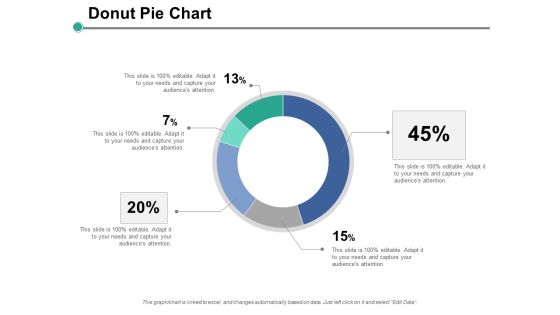
Donut Pie Chart Ppt PowerPoint Presentation Layouts Backgrounds
This is a donut pie chart ppt powerpoint presentation layouts backgrounds. This is a five stage process. The stages in this process are finance, marketing, management, investment, analysis.

Column Chart Ppt PowerPoint Presentation Slides Example Topics
This is a column chart ppt powerpoint presentation slides example topics. This is a two stage process. The stages in this process are finance, marketing, management, investment, analysis.

Area Chart Financial Ppt PowerPoint Presentation Layouts Slide
This is a area chart financial ppt powerpoint presentation layouts slide. This is a three stage process. The stages in this process are finance, marketing, management, investment, analysis.

Area Chart Financial Ppt PowerPoint Presentation Inspiration Topics
This is a area chart financial ppt powerpoint presentation inspiration topics. This is a three stage process. The stages in this process are finance, marketing, management, investment, analysis.

Combo Chart Ppt PowerPoint Presentation Visual Aids Pictures
This is a combo chart ppt powerpoint presentation visual aids pictures. This is a three stage process. The stages in this process are finance, marketing, management, investment, analysis.
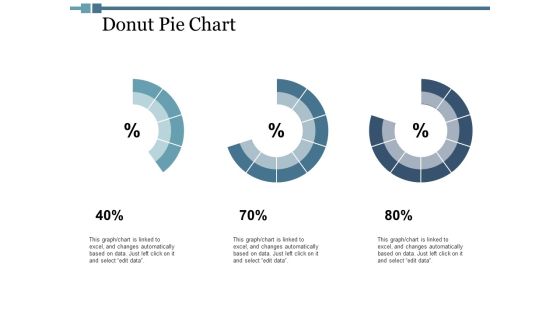
Donut Pie Chart Ppt PowerPoint Presentation Inspiration Brochure
This is a donut pie chart ppt powerpoint presentation inspiration brochure. This is a three stage process. The stages in this process are finance, marketing, management, investment, analysis.

Combo Chart Ppt PowerPoint Presentation Visual Aids Files
This is a combo chart ppt powerpoint presentation visual aids files. This is a three stage process. The stages in this process are finance, marketing, management, investment, analysis.

Area Chart Financial Ppt PowerPoint Presentation Model Background
This is a area chart financial ppt powerpoint presentation model background. This is a two stage process. The stages in this process are finance, marketing, management, investment, analysis.

Combo Chart Financial Ppt PowerPoint Presentation Layouts Layouts
This is a combo chart financial ppt powerpoint presentation layouts layouts. This is a three stage process. The stages in this process are finance, marketing, management, investment, analysis.
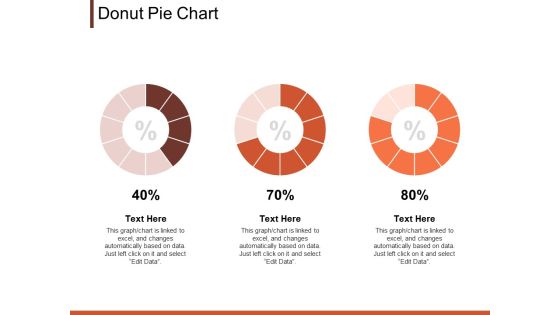
Donut Pie Chart Marketing Ppt PowerPoint Presentation Clipart
This is a donut pie chart marketing ppt powerpoint presentation clipart. This is a three stage process. The stages in this process are finance, analysis, business, investment, marketing.

Internet Security Threat Analysis Report Chart Introduction PDF
Following slide exhibits security and data breach report chart it includes major statistics such as- loss or theft of data, failure to redirect data and data posting to incorrect recipient. Pitch your topic with ease and precision using this internet security threat analysis report chart introduction pdf. This layout presents information on internet security threat analysis report chart. It is also available for immediate download and adjustment. So, changes can be made in the color, design, graphics or any other component to create a unique layout.
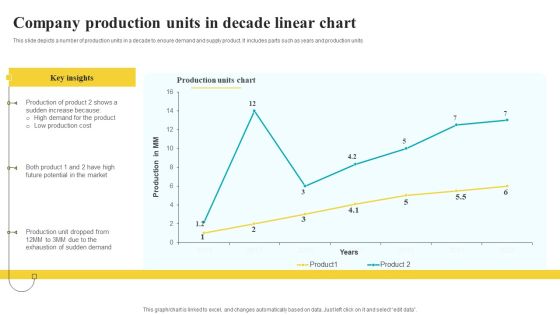
Company Production Units In Decade Linear Chart Designs PDF
This slide depicts a number of production units in a decade to ensure demand and supply product. It includes parts such as years and production units Pitch your topic with ease and precision using this Company Production Units In Decade Linear Chart Designs PDF. This layout presents information on Key Insights, Production Units Chart, Linear Chart. It is also available for immediate download and adjustment. So, changes can be made in the color, design, graphics or any other component to create a unique layout.
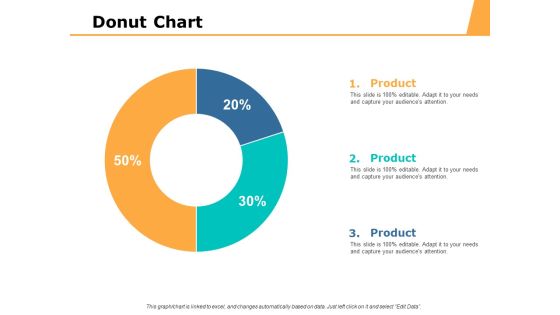
Pie Chart Percentage Ppt PowerPoint Presentation Inspiration Slides
This is a pie chart percentage ppt powerpoint presentation inspiration slides. This is a three stage process. The stages in this process are finance, marketing, management, investment, analysis.
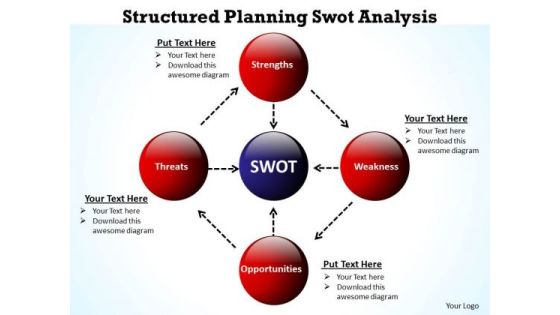
Business Organizational Chart Template Structured Planning Swot Analysis PowerPoint Slides
We present our business organizational chart template structured planning swot analysis PowerPoint Slides.Use our Circle Charts PowerPoint Templates because Our PowerPoint Templates and Slides are effectively colour coded to prioritise your plans They automatically highlight the sequence of events you desire. Download our Ring Charts PowerPoint Templates because Our PowerPoint Templates and Slides are created with admirable insight. Use them and give your group a sense of your logical mind. Download and present our Business PowerPoint Templates because Your ideas provide food for thought. Our PowerPoint Templates and Slides will help you create a dish to tickle the most discerning palate. Present our Flow Charts PowerPoint Templates because Our PowerPoint Templates and Slides are truly out of this world. Even the MIB duo has been keeping tabs on our team. Present our Process and Flows PowerPoint Templates because Our PowerPoint Templates and Slides are a sure bet. Gauranteed to win against all odds. Use these PowerPoint slides for presentations relating to Business, buy, clipart, commerce, concept, conceptual, consumer, customer, cycle, design, development, diagram, direction, guidelines, icon, illustration, know, life, lifecycle, like, manage, management, market, marketing, mix, model, optimize, organization, performance, process, refer, repeat, resource, sales, selling, stages. The prominent colors used in the PowerPoint template are Red, Blue navy, Black. People tell us our business organizational chart template structured planning swot analysis PowerPoint Slides are designed by a team of presentation professionals. PowerPoint presentation experts tell us our conceptual PowerPoint templates and PPT Slides will generate and maintain the level of interest you desire. They will create the impression you want to imprint on your audience. Presenters tell us our business organizational chart template structured planning swot analysis PowerPoint Slides are designed by professionals Use our cycle PowerPoint templates and PPT Slides are aesthetically designed to attract attention. We guarantee that they will grab all the eyeballs you need. Customers tell us our business organizational chart template structured planning swot analysis PowerPoint Slides will make the presenter look like a pro even if they are not computer savvy. People tell us our concept PowerPoint templates and PPT Slides will get their audience's attention.

Area Chart Ppt PowerPoint Presentation Visual Aids Show
This is a area chart ppt powerpoint presentation visual aids show. This is a two stage process. The stages in this process are area chart, growth, strategy, finance, business.
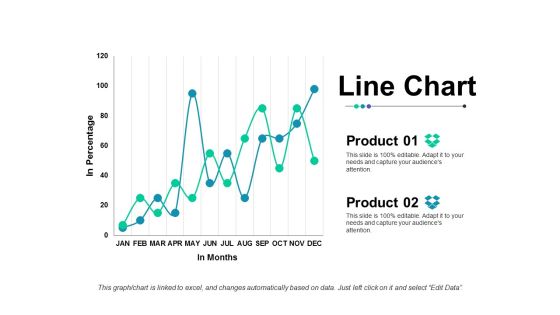
Line Chart Ppt Powerpoint Presentation Outline Slide Portrait
This is a line chart ppt powerpoint presentation outline slide portrait. This is a two stage process. The stages in this process are line chart, finance, strategy, business, analysis.

Bar Chart Investment Ppt PowerPoint Presentation Model Files
Presenting this set of slides with name bar chart investment ppt powerpoint presentation model files. The topics discussed in these slides are finance, marketing, management, investment, analysis. This is a completely editable PowerPoint presentation and is available for immediate download. Download now and impress your audience.

Clustered Bar Chart Investment Ppt PowerPoint Presentation Layouts Ideas
Presenting this set of slides with name clustered bar chart investment ppt powerpoint presentation layouts ideas. The topics discussed in these slides are finance, analysis, business, investment, marketing. This is a completely editable PowerPoint presentation and is available for immediate download. Download now and impress your audience.
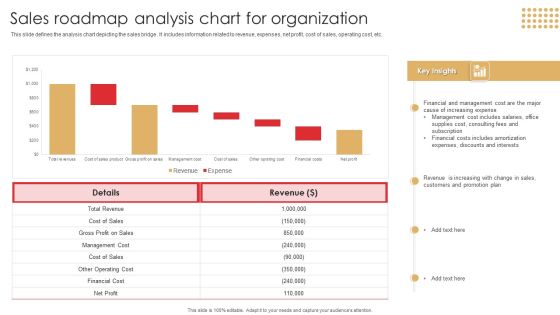
Sales Roadmap Analysis Chart For Organization Download PDF
This slide defines the analysis chart depicting the sales bridge . It includes information related to revenue, expenses, net profit, cost of sales, operating cost, etc.Showcasing this set of slides titled Sales Roadmap Analysis Chart For Organization Download PDF. The topics addressed in these templates are Management Cost, Financial Cost, Includes Amortization. All the content presented in this PPT design is completely editable. Download it and make adjustments in color, background, font etc. as per your unique business setting.
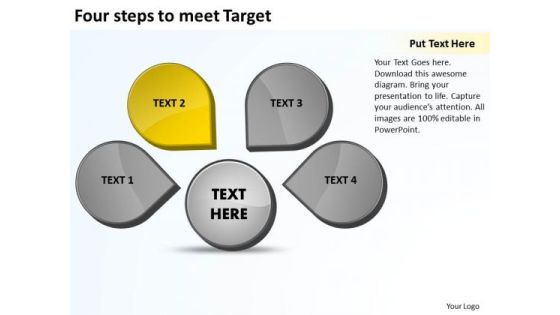
Four Steps To Meet Target Venn Chart PowerPoint Templates
We present our four steps to meet target Venn Chart PowerPoint templates.Download our Circle Charts PowerPoint Templates because you can take it along a sure fire road to good profit. Present our Business PowerPoint Templates because your fledgling career is in the chrysallis stage. Nurture it and watch it grow into a beautiful butterfly. Use our Shapes PowerPoint Templates because this helps you to put all your brilliant views to your audience. Download and present our Flow Charts PowerPoint Templates because You aspire to touch the sky with glory. Let our PowerPoint Templates and Slides provide the fuel for your ascent. Use our Finance PowerPoint Templates because you envisage some areas of difficulty in the near future. The overall financial situation could be a source of worry.Use these PowerPoint slides for presentations relating to Business, chart, circle, circular, steps, process, flow, concept, conference, curving, cycle, design, diagram, direction, element, financial, flow, flowchart, formula, future, goal, graphic, idea, management, market, marketing, mind, mind map, motion, movement, organization, organize, plan, presentation, process, product, questions, render, solutions, solve, strategy, success, symbol. The prominent colors used in the PowerPoint template are Yellow, Gray, White. The feedback we get is that our four steps to meet target Venn Chart PowerPoint templates are Functional. Customers tell us our circular PowerPoint templates and PPT Slides are Nice. Professionals tell us our four steps to meet target Venn Chart PowerPoint templates are Magical. Customers tell us our concept PowerPoint templates and PPT Slides will make the presenter successul in his career/life. Use our four steps to meet target Venn Chart PowerPoint templates are Stylish. Professionals tell us our circle PowerPoint templates and PPT Slides are Elevated.

Seed Investment Stacked Bar Chart Ppt Show Smartart PDF
Presenting this set of slides with name seed investment stacked bar chart ppt show smartart pdf. The topics discussed in these slides are product 1, product 2. This is a completely editable PowerPoint presentation and is available for immediate download. Download now and impress your audience.
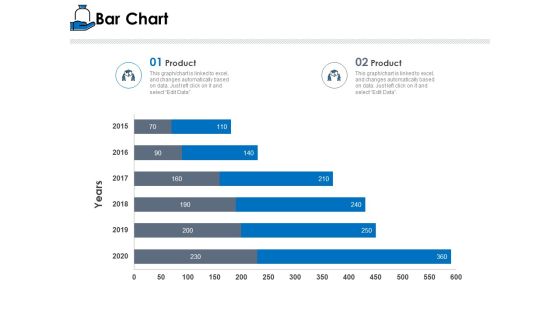
Startup Investment Ideas Bar Chart Ppt Layouts Layouts PDF
Presenting this set of slides with name startup investment ideas bar chart ppt layouts layouts pdf. The topics discussed in these slides are product 1, product 2. This is a completely editable PowerPoint presentation and is available for immediate download. Download now and impress your audience.

Raising Money Chart Finance PowerPoint Templates And PowerPoint Themes 0512
Raising Money Chart Finance PowerPoint Templates And PowerPoint Themes PPT designs-Microsoft Powerpoint Templates and Background with business graph

Pie Chart Finance Ppt PowerPoint Presentation Professional Styles
This is a pie chart finance ppt powerpoint presentation professional styles. This is a three stage process. The stages in this process are management, marketing, business, strategy, finance.

PowerPoint Presentations Plan 9 Stages Circular Flow Process Chart Slides
We present our powerpoint presentations plan 9 stages Circular Flow Process Chart Slides.Present our Circle Charts PowerPoint Templates because you can Determine your targets and sequence them as per your priorities. Download and present our Arrows PowerPoint Templates because this diagram helps you to explain your strategy to co-ordinate activities of these seperate groups. Download and present our Business PowerPoint Templates because your thoughts are pointed and sharp as arrows. Download and present our Shapes PowerPoint Templates because you can asked to strive to give true form to your great dream. Present our Flow Charts PowerPoint Templates because this diagram provides multiple options for taking in and making sense of information.Use these PowerPoint slides for presentations relating to abstract, arrow, arrow circle, business concept, career, center stage, chart, circle, circle arrow diagram, color full, connection, contrast, cycle, diagram, direction, flow, flowchart, future, graph, icon, illustration, isolate, isolated, job, life, loop, money, motion, network, recycle, refresh, ring, rotation, sick, sign, symbol, symply, target, wealth,. The prominent colors used in the PowerPoint template are Blue, Green, Gray. Customers tell us our powerpoint presentations plan 9 stages Circular Flow Process Chart Slides will help you be quick off the draw. Just enter your specific text and see your points hit home. PowerPoint presentation experts tell us our business PowerPoint templates and PPT Slides are Liberated. People tell us our powerpoint presentations plan 9 stages Circular Flow Process Chart Slides are Cheerful. People tell us our business PowerPoint templates and PPT Slides are Sparkling. Customers tell us our powerpoint presentations plan 9 stages Circular Flow Process Chart Slides are Glamorous. People tell us our concept PowerPoint templates and PPT Slides are Dazzling.

PowerPoint Template Business Process Chart Images Ppt Templates
PowerPoint Template Business Process Chart Images PPT Templates-The Circle of Life - a concept emmbedded in our minds and hence easy to comprehend. Life and Business is made up of processes comprising stages that flow from one to another. An excellent graphic to attract the attention of and understanding by your audience to improve earnings-PowerPoint Template Business Process Chart Images PPT Templates-This ppt can be used for presentations relating to-Arrow, Bond, Business, Button, Buying, Career, Change, Chart, Children, Circle, College, Death, Diagram, Education, Financial, Future, Graphic, House, Illustration, Investing, Investment, Marriage, Menu, Personal, Plan, Process

Area Chart Investment Ppt PowerPoint Presentation Styles Samples
Presenting this set of slides with name area chart investment ppt powerpoint presentation styles samples. The topics discussed in these slides are finance, marketing, management, investment, analysis. This is a completely editable PowerPoint presentation and is available for immediate download. Download now and impress your audience.

Area Chart Investment Ppt PowerPoint Presentation Outline Examples
Presenting this set of slides with name area chart investment ppt powerpoint presentation outline examples. The topics discussed in these slides are finance, marketing, management, investment, analysis. This is a completely editable PowerPoint presentation and is available for immediate download. Download now and impress your audience.

Line Chart Investment Ppt PowerPoint Presentation Portfolio Show
Presenting this set of slides with name line chart investment ppt powerpoint presentation portfolio show. The topics discussed in these slides are finance, marketing, management, investment, analysis. This is a completely editable PowerPoint presentation and is available for immediate download. Download now and impress your audience.

Area Chart Investment Ppt PowerPoint Presentation Styles Professional
Presenting this set of slides with name area chart investment ppt powerpoint presentation styles professional. The topics discussed in these slides are finance, marketing, management, investment, analysis. This is a completely editable PowerPoint presentation and is available for immediate download. Download now and impress your audience.

Area Chart Investment Ppt PowerPoint Presentation Styles Slide Portrait
Presenting this set of slides with name area chart investment ppt powerpoint presentation styles slide portrait. The topics discussed in these slides are finance, marketing, management, investment, analysis. This is a completely editable PowerPoint presentation and is available for immediate download. Download now and impress your audience.
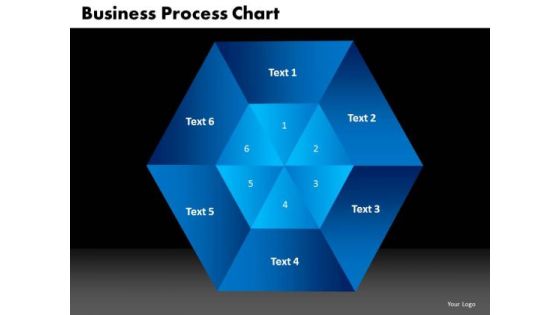
PowerPoint Slide Designs Business Process Chart Sales Ppt Themes
PowerPoint Slide Designs Business Process Chart Sales PPT Themes-The Circle of Life - a concept emmbedded in our minds and hence easy to comprehend. Life and Business is made up of processes comprising stages that flow from one to another. An excellent graphic to attract the attention of and understanding by your audience to improve earnings-PowerPoint Slide Designs Business Process Chart Sales PPT Themes-This ppt can be used for presentations relating to-Arrow, Bond, Business, Button, Buying, Career, Change, Chart, Children, Circle, College, Death, Diagram, Education, Financial, Future, Graphic, House, Illustration, Investing, Investment, Marriage, Menu, Personal, Plan, Process
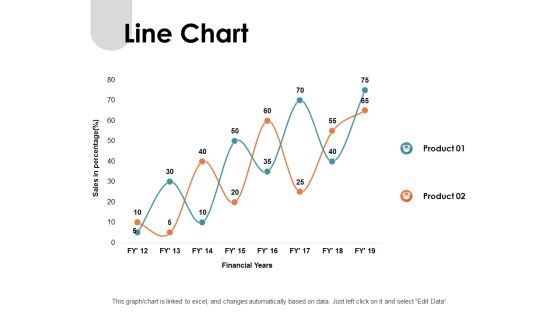
Line Chart Investment Ppt PowerPoint Presentation File Information
Presenting this set of slides with name line chart investment ppt powerpoint presentation file information. The topics discussed in these slides are financial, marketing, management, investment, analysis. This is a completely editable PowerPoint presentation and is available for immediate download. Download now and impress your audience.

Area Chart Investment Ppt PowerPoint Presentation Professional Show
Presenting this set of slides with name area chart investment ppt powerpoint presentation professional show. The topics discussed in these slides are financial, marketing, management, investment, analysis. This is a completely editable PowerPoint presentation and is available for immediate download. Download now and impress your audience.
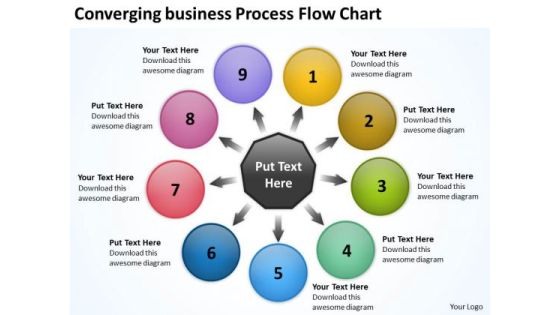
Templates Download Process Flow Chart Circular Layout Diagram PowerPoint Slides
We present our templates download process flow chart Circular Layout Diagram PowerPoint Slides.Download and present our Circle Charts PowerPoint Templates because you have the right arrows in your quiver. Present our Arrows PowerPoint Templates because with the help of our Slides you can Illustrate your ideas one by one and demonstrate how each is an important cog in running the entire wheel. Use our Business PowerPoint Templates because your fledgling career is in the chrysallis stage. Nurture it and watch it grow into a beautiful butterfly. Use our Shapes PowerPoint Templates because with the help of our Slides you can Illustrate your plans on using the many social media modes available to inform soceity at large of the benefits of your product. Use our Flow Charts PowerPoint Templates because with the help of our Slides you can Illustrate your plans to your listeners with the same accuracy.Use these PowerPoint slides for presentations relating to abstract, arrows, blank, business, central, centralized, chart, circle, circular, circulation, concept, conceptual, converging, design, diagram, empty, executive, icon, idea, illustration, management, map, mapping, mba, model, numbers, organization, outwards, pointing, procedure, process, radial, radiating, relationship, resource, sequence, sequential, seven, square, strategy, template. The prominent colors used in the PowerPoint template are Red, Purple, Pink. Customers tell us our templates download process flow chart Circular Layout Diagram PowerPoint Slides are Elevated. PowerPoint presentation experts tell us our central PowerPoint templates and PPT Slides are Tasteful. People tell us our templates download process flow chart Circular Layout Diagram PowerPoint Slides are Second to none. People tell us our circle PowerPoint templates and PPT Slides are Handsome. Customers tell us our templates download process flow chart Circular Layout Diagram PowerPoint Slides are Whimsical. People tell us our central PowerPoint templates and PPT Slides are Splendid.
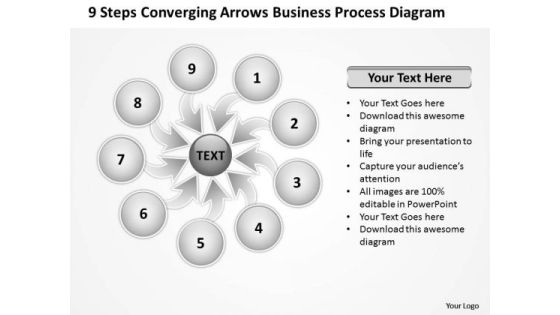
PowerPoint Templates Process Diagram Ppt Circular Flow Chart
We present our powerpoint templates process diagram ppt Circular Flow Chart.Present our Circle Charts PowerPoint Templates because Watching this your Audience will Grab their eyeballs, they wont even blink. Download our Arrows PowerPoint Templates because you have analysed the illness and know the need. Use our Shapes PowerPoint Templates because You can Zap them with our PowerPoint Templates and Slides. See them reel under the impact. Download and present our Business PowerPoint Templates because the basic stages are in place, you need to build upon them with our PowerPoint templates. Download and present our Flow Charts PowerPoint Templates because it illustrates the symbols of human growth.Use these PowerPoint slides for presentations relating to 9, abstract, arrows, blank, business, central, centralized, chart, circle, circular, circulation, concept, conceptual, converging, design, diagram, empty, executive, icon, idea, illustration, management, map, mapping, mba, model, numbers, organization, outwards, pointing, procedure, process, radial, radiating, relationship, resource, sequence, sequential, seven, square, strategy, template. The prominent colors used in the PowerPoint template are White, Gray, Black. Presenters tell us our powerpoint templates process diagram ppt Circular Flow Chart will make you look like a winner. The feedback we get is that our central PowerPoint templates and PPT Slides are Glamorous. Presenters tell us our powerpoint templates process diagram ppt Circular Flow Chart are Pleasant. You can be sure our centralized PowerPoint templates and PPT Slides are Perfect. People tell us our powerpoint templates process diagram ppt Circular Flow Chart will generate and maintain the level of interest you desire. They will create the impression you want to imprint on your audience. PowerPoint presentation experts tell us our centralized PowerPoint templates and PPT Slides are Detailed.

10 Diverging Stages Planning Process Diagram Radial Chart PowerPoint Templates
We present our 10 diverging stages planning process diagram Radial Chart PowerPoint templates.Present our Arrows PowerPoint Templates because you can Show them how to churn out fresh ideas. Present our Flow charts PowerPoint Templates because you can see In any endeavour people matter most. Download our Business PowerPoint Templates because this template helps you to grab the attention of your listeners. Use our Process and Flows PowerPoint Templates because you can enlighten your skills with the help of our topical templates. Download and present our Circle charts PowerPoint Templates because you have the plans ready for them to absorb and understand.Use these PowerPoint slides for presentations relating to Business, chart, circle, colors, concept, corporate, cycle, data, design, detail, development, diagram, engineering, graphic, ideas, illustration, image, implement, implementation, life, lifecycle, management, model, objects, organization, plan, process, product, professional, project, quality, schema, shape, stack, stage, steps, strategy, structure, success, symbol. The prominent colors used in the PowerPoint template are Purple, Black, Gray. You can be sure our 10 diverging stages planning process diagram Radial Chart PowerPoint templates are Efficacious. Presenters tell us our corporate PowerPoint templates and PPT Slides are Dazzling. We assure you our 10 diverging stages planning process diagram Radial Chart PowerPoint templates help you meet deadlines which are an element of today's workplace. Just browse and pick the slides that appeal to your intuitive senses. Customers tell us our circle PowerPoint templates and PPT Slides are Nifty. Presenters tell us our 10 diverging stages planning process diagram Radial Chart PowerPoint templates are Beautiful. You can be sure our corporate PowerPoint templates and PPT Slides are Attractive.
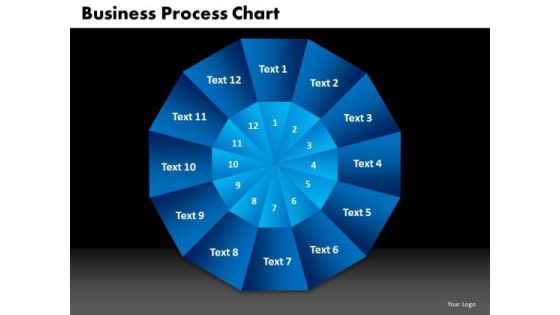
PowerPoint Design Slides Process Chart Business Ppt Slides
PowerPoint Design Slides Process Chart Business PPT Slides-The Circle of Life - a concept emmbedded in our minds and hence easy to comprehend. Life and Business is made up of processes comprising stages that flow from one to another. An excellent graphic to attract the attention of and understanding by your audience to improve earnings-PowerPoint Design Slides Process Chart Business PPT Slides-This ppt can be used for presentations relating to-Arrow, Bond, Business, Button, Buying, Career, Change, Chart, Children, Circle, College, Death, Diagram, Education, Financial, Future, Graphic, House, Illustration, Investing, Investment, Marriage, Menu, Personal, Plan, Process
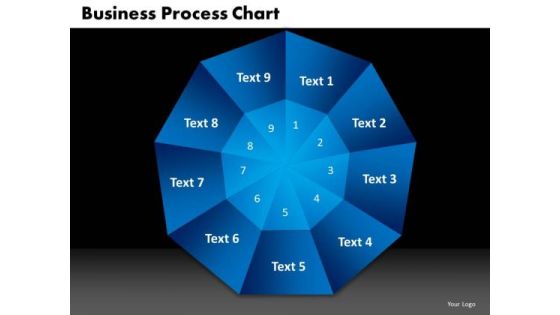
PowerPoint Slide Designs Process Chart Business Ppt Designs
PowerPoint Slide Designs Process Chart Business PPT Designs-The Circle of Life - a concept emmbedded in our minds and hence easy to comprehend. Life and Business is made up of processes comprising stages that flow from one to another. An excellent graphic to attract the attention of and understanding by your audience to improve earnings-PowerPoint Slide Designs Process Chart Business PPT Designs-This ppt can be used for presentations relating to-Arrow, Bond, Business, Button, Buying, Career, Change, Chart, Children, Circle, College, Death, Diagram, Education, Financial, Future, Graphic, House, Illustration, Investing, Investment, Marriage, Menu, Personal, Plan, Process

Combo Chart Investment Ppt PowerPoint Presentation Infographics Graphics
Presenting this set of slides with name combo chart investment ppt powerpoint presentation infographics graphics. The topics discussed in these slides are market size, growth rate. This is a completely editable PowerPoint presentation and is available for immediate download. Download now and impress your audience.

Seed Investment Column Chart Ppt Pictures Designs PDF
Presenting this set of slides with name seed investment column chart ppt pictures designs pdf. The topics discussed in these slides are product 1, product 2. This is a completely editable PowerPoint presentation and is available for immediate download. Download now and impress your audience.
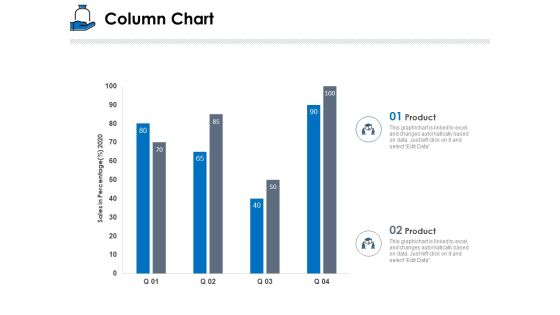
Startup Investment Ideas Column Chart Ppt Introduction PDF
Presenting this set of slides with name startup investment ideas column chart ppt introduction pdf. The topics discussed in these slides are product 1, product 2. This is a completely editable PowerPoint presentation and is available for immediate download. Download now and impress your audience.
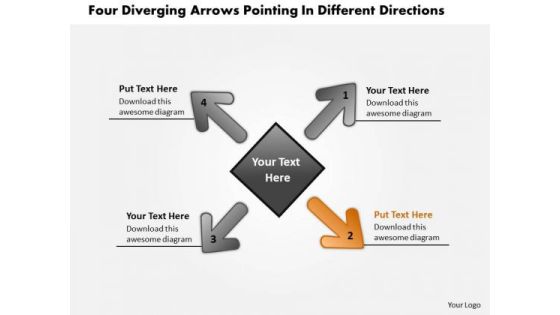
Diverging Arrows Pointing Different Directions Circular Process Chart PowerPoint Slides
We present our diverging arrows pointing different directions Circular Process Chart PowerPoint Slides.Present our Arrows PowerPoint Templates because you have an idea of which you are sure. Present our Process and flows PowerPoint Templates because this diagram helps in examine each brilliant thought in thorough detail highlighting all the pros and cons as minutely as possible. Download and present our Business PowerPoint Templates because project your ideas to you colleagues and complete the full picture. Present our Flow charts PowerPoint Templates because you have churned your mind and come up with effective ways and means to further refine it. Use our Signs PowerPoint Templates because forward thinking is the way to go.Use these PowerPoint slides for presentations relating to Arrow, brochure, business,businessman, button, chart, circle,company, cyclic, data, demonstration,diagram, financial, five,glossy, goal, graph, illustration, info,information, investment, man, manage,marketing, model, navigation, option,part, people, person, pie, presentation,process, result, section, segmented. The prominent colors used in the PowerPoint template are Green, White, Black. People tell us our diverging arrows pointing different directions Circular Process Chart PowerPoint Slides will save the presenter time. Professionals tell us our company PowerPoint templates and PPT Slides are Detailed. We assure you our diverging arrows pointing different directions Circular Process Chart PowerPoint Slides will make you look like a winner. PowerPoint presentation experts tell us our business PowerPoint templates and PPT Slides are Elevated. We assure you our diverging arrows pointing different directions Circular Process Chart PowerPoint Slides are Spiffy. People tell us our chart PowerPoint templates and PPT Slides are Appealing.

Diverging Flow Chart Consisting 11 Stages Cycle Layout PowerPoint Templates
We present our diverging flow chart consisting 11 stages Cycle Layout PowerPoint templates.Use our Business PowerPoint Templates because this is the unerring accuracy in reaching the target. the effortless ability to launch into flight. Download our Circle Charts PowerPoint Templates because this is an excellent slide to detail and highlight your thought process, your views and your positive expectations.. Present our Arrows PowerPoint Templates because spreading the light of knowledge around you will clear the doubts and enlighten the questioning minds with your brilliance and ability. Use our Shapes PowerPoint Templates because you have the product you need. Use our Flow charts PowerPoint Templates because you can Place them where they need to be.Use these PowerPoint slides for presentations relating to Arrows, blank, business, central, centralized, chart, circle, circular, circulation concept, conceptual, converging, design, diagram, empty, executive, icon, idea illustration, management, map, mapping, moa, model, numbers, organization outwards, pointing, procedure, process, radial, radiating, relationship, resource sequence, sequential, seven, square, strategy, template. The prominent colors used in the PowerPoint template are Yellow, Gray, White. Presenters tell us our diverging flow chart consisting 11 stages Cycle Layout PowerPoint templates are Charming. Presenters tell us our circle PowerPoint templates and PPT Slides are Zippy. PowerPoint presentation experts tell us our diverging flow chart consisting 11 stages Cycle Layout PowerPoint templates are Breathtaking. We assure you our circle PowerPoint templates and PPT Slides are Functional. Customers tell us our diverging flow chart consisting 11 stages Cycle Layout PowerPoint templates help you meet deadlines which are an element of today's workplace. Just browse and pick the slides that appeal to your intuitive senses. People tell us our circulation PowerPoint templates and PPT Slides are Colorful.
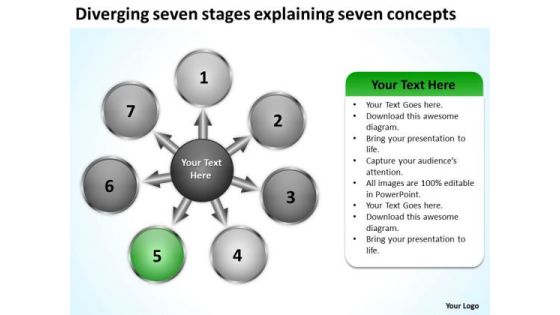
Diverging Seven Stages Explaining Concepts Circular Chart PowerPoint Slides
We present our diverging seven stages explaining concepts Circular Chart PowerPoint Slides.Present our Business PowerPoint Templates because a brainwave has occurred to you after review. You know just how to push the graph skyward. Download our Circle Charts PowerPoint Templates because educate your staff on the means to provide the required support for speedy recovery. Present our Arrows PowerPoint Templates because this Diagram pinpoints the critical paths and areas in your process and set the timelines for their completion. Present our Shapes PowerPoint Templates because the plans are in your head, stage by stage, year by year. Download and present our Flow charts PowerPoint Templates because this diagram provides multiple options for taking in and making sense of information.Use these PowerPoint slides for presentations relating to Arrows, blank, business, central, centralized, chart, circle, circular, circulation concept, conceptual, converging, design, diagram, empty, executive, icon, idea illustration, management, map, mapping, moa, model, numbers, organization outwards, pointing, procedure, process, radial, radiating, relationship, resource sequence, sequential, seven, square, strategy, template. The prominent colors used in the PowerPoint template are Green, Gray, White. Presenters tell us our diverging seven stages explaining concepts Circular Chart PowerPoint Slides will help you be quick off the draw. Just enter your specific text and see your points hit home. Presenters tell us our circulation PowerPoint templates and PPT Slides are Spiffy. PowerPoint presentation experts tell us our diverging seven stages explaining concepts Circular Chart PowerPoint Slides are Nifty. We assure you our centralized PowerPoint templates and PPT Slides are Glamorous. Customers tell us our diverging seven stages explaining concepts Circular Chart PowerPoint Slides are Multicolored. People tell us our circle PowerPoint templates and PPT Slides are Bold.
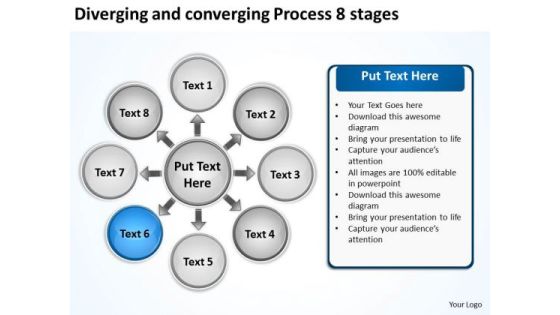
Diverging And Converging Process 8 Stages Circular Chart PowerPoint Templates
We present our diverging and converging process 8 stages Circular Chart PowerPoint templates.Present our Circle Charts PowerPoint Templates because you have examined every element down to the finest detail. Download our Process and flows PowerPoint Templates because you can Amplify your views, ideas and thoughts from very basic aspects to the highly technical and complicated issus using this template as a tool. Download and present our Flow charts PowerPoint Templates because we provide the means to project your views. Download and present our Arrows PowerPoint Templates because they have always been a source of inspiration for us all. Download and present our Business PowerPoint Templates because it illustrates the city with a lasting tryst with resilience. You epitomise the qualities that give your city its fame.Use these PowerPoint slides for presentations relating to Abstract, arrows, blank, business,central, centralized, chart, circle, circular,circulation, concept, conceptual,converging, design, diagram, empty,executive, icon, idea, illustration,management, map, mapping, mba,model, numbers, organization, outwards,pointing, procedure, process, radial,radiating, relationship. The prominent colors used in the PowerPoint template are Gray, Black, White. People tell us our diverging and converging process 8 stages Circular Chart PowerPoint templates are No-nonsense. Professionals tell us our centralized PowerPoint templates and PPT Slides are Efficient. We assure you our diverging and converging process 8 stages Circular Chart PowerPoint templates look good visually. PowerPoint presentation experts tell us our business PowerPoint templates and PPT Slides are Clever. We assure you our diverging and converging process 8 stages Circular Chart PowerPoint templates are Royal. People tell us our circle PowerPoint templates and PPT Slides will save the presenter time.
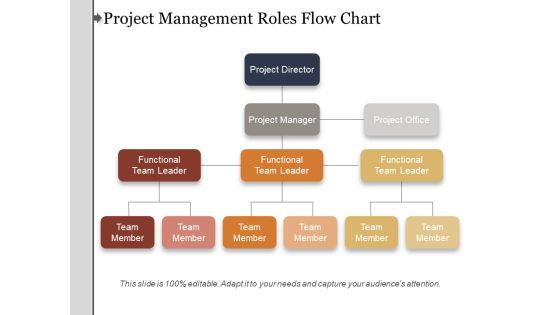
Project Management Roles Flow Chart Ppt PowerPoint Presentation Summary Aids
This is a project management roles flow chart ppt powerpoint presentation summary aids. This is a four stage process. The stages in this process are organization chart, org chart, project team structure.

Process Diagram Chart With 4 Spherical Stages PowerPoint Templates
Process Diagram Chart with 4 Spherical Stages PowerPoint templates-These high quality powerpoint pre-designed slides and powerpoint templates have been carefully created by our professional team to help you impress your audience. All slides have been created and are 100% editable in powerpoint. Each and every property of any graphic - color, size, orientation, shading, outline etc. can be modified to help you build an effective powerpoint presentation. Any text can be entered at any point in the powerpoint template or slide. Simply DOWNLOAD, TYPE and PRESENT!-These PowerPoint presentation slides can be used to represent concepts relating to--Abstract, action, analysis, blank, business, chart, clipart, commerce, concept, conceptual, design, diagram, direction, flow, generic, goals, guide, guidelines, heirarchy, icon, idea, illustration, lingakes, links, manage, management, mba, model, organization, performance, plan, process, project, relationship, representation, resource, steps, strategy, success, tactics, theoretical, theory, tool, workflow-Process Diagram Chart with 4 Spherical Stages PowerPoint templates
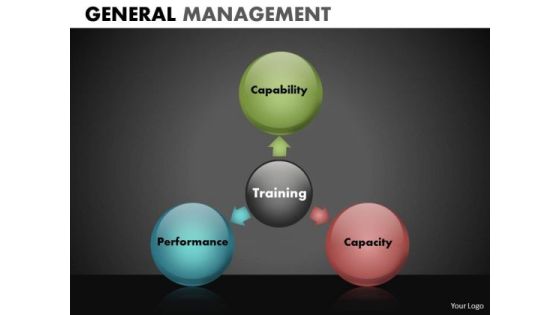
Triangular Process Chart PowerPoint Templates PowerPoint 3 Stages Process Diagram
Triangular Process Chart PowerPoint templates PowerPoint 3 Stages Process Diagram-These high quality powerpoint pre-designed slides and powerpoint templates have been carefully created by our professional team to help you impress your audience. All slides have been created and are 100% editable in powerpoint. Each and every property of any graphic - color, size, orientation, shading, outline etc. can be modified to help you build an effective powerpoint presentation. Any text can be entered at any point in the powerpoint template or slide. Simply DOWNLOAD, TYPE and PRESENT!-These PowerPoint presentation slides can be used to represent concepts relating to--Abstract, action, analysis, blank, business, chart, clipart, commerce, concept, conceptual, design, diagram, direction, flow, generic, goals, guide, guidelines, heirarchy, icon, idea, illustration, lingakes, links, manage, management, mba, model, organization, performance, plan, process, project, relationship, representation, resource, steps, strategy, success, tactics, theoretical, theory, tool, workflow-Triangular Process Chart PowerPoint templates PowerPoint 3 Stages Process Diagram

10 Stages Converging Business Process Cycle Chart PowerPoint Slides
We present our 10 stages converging business process Cycle Chart PowerPoint Slides.Use our Arrows PowerPoint Templates because there are various viable propositions available to further your commercial interests. Download our Flow charts PowerPoint Templates because you have developed a vision of where you want to be a few years from now. Download our Business PowerPoint Templates because you are ready to flap your wings and launch off. All poised are you to touch the sky with glory. Present our Process and Flows PowerPoint Templates because this is An innovative slide design depicting driving home the relevance of a steady rhythm. Present our Circle charts PowerPoint Templates because you watch them slowly start to savour the flavour you have served them.Use these PowerPoint slides for presentations relating to Business, chart, circle, colors, concept, corporate, cycle, data, design, detail, development, diagram, engineering, graphic, ideas, illustration, image, implement, implementation, life, lifecycle, management, model, objects, organization, plan, process, product, professional, project, quality, schema, shape, stack, stage, steps, strategy, structure, success, symbol. The prominent colors used in the PowerPoint template are Yellow, White, Gray. You can be sure our 10 stages converging business process Cycle Chart PowerPoint Slides are Swanky. Presenters tell us our corporate PowerPoint templates and PPT Slides are Classic. We assure you our 10 stages converging business process Cycle Chart PowerPoint Slides are One-of-a-kind. Customers tell us our data PowerPoint templates and PPT Slides are Bold. Presenters tell us our 10 stages converging business process Cycle Chart PowerPoint Slides are Handsome. You can be sure our circle PowerPoint templates and PPT Slides are Festive.
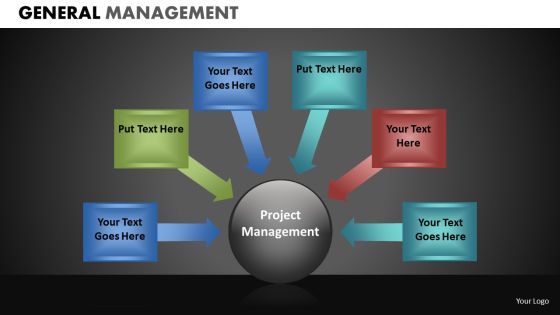
Ppt Slides With 5 Stages Semicircle Chart PowerPoint Templates
PPT Slides with 5 Stages SemiCircle Chart PowerPoint templates-These high quality powerpoint pre-designed slides and powerpoint templates have been carefully created by our professional team to help you impress your audience. All slides have been created and are 100% editable in powerpoint. Each and every property of any graphic - color, size, orientation, shading, outline etc. can be modified to help you build an effective powerpoint presentation. Any text can be entered at any point in the powerpoint template or slide. Simply DOWNLOAD, TYPE and PRESENT!-These PowerPoint presentation slides can be used to represent concepts relating to--Abstract, action, analysis, blank, business, chart, clipart, commerce, concept, conceptual, design, diagram, direction, flow, generic, goals, guide, guidelines, heirarchy, icon, idea, illustration, lingakes, links, manage, management, mba, model, organization, performance, plan, process, project, relationship, representation, resource, steps, strategy, success, tactics, theoretical, theory, tool, workflow-PPT Slides with 5 Stages SemiCircle Chart PowerPoint templates

Business Strategy Planning Circular Resource Allocation Chart Template
We present our business strategy planning circular resource allocation chart template.Download and present our Process and Flows PowerPoint Templates because you can Break through with our PowerPoint Templates and Slides. Bring down the mental barriers of your audience. Use our Ring Charts PowerPoint Templates because Our PowerPoint Templates and Slides are designed to help you succeed. They have all the ingredients you need. Download and present our Circle Charts PowerPoint Templates because Our PowerPoint Templates and Slides will provide weight to your words. They will bring out the depth of your thought process. Download our Business PowerPoint Templates because Our PowerPoint Templates and Slides will provide you the cutting edge. Slice through the doubts in the minds of your listeners. Download our Success PowerPoint Templates because our PowerPoint Templates and Slides are the string of your bow. Fire of your ideas and conquer the podium.Use these PowerPoint slides for presentations relating to Abstract, arrow, brochure, business, button, catalog, chart, circle, colors, cross,demonstration, description, design, diagram, eight, glossy, goals,illustration, information, interface, internet, isolated, level, list, marketing, model,multiple, navigation, network, pattern, presentation, registry, report, section,space, sphere, statement, statistics, steps, structure, target. The prominent colors used in the PowerPoint template are Green, Gray, White.
Financial Chart Representation PowerPoint Templates Ppt Backgrounds For Slides 0513
Our Financial Chart Representation PowerPoint Templates PPT Backgrounds For Slides will will follow the drill. They accomplish the task assigned to them. Do the drill with our Pie charts PowerPoint Templates. Your ideas will march ahead. Place the orders with your thoughts. Our Business PowerPoint Templates know the drill.
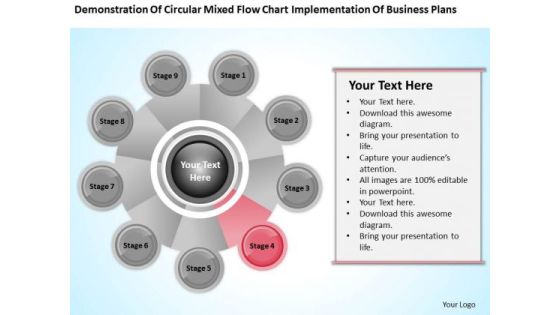
Business Process Flow Diagram Chart Implementation Plans Ppt PowerPoint Slide
We present our business process flow diagram chart implementation plans ppt PowerPoint Slide.Download and present our Circle Charts PowerPoint Templates because Our PowerPoint Templates and Slides will give good value for money. They also have respect for the value of your time. Present our Process and Flows PowerPoint Templates because Your audience will believe you are the cats whiskers. Download and present our Flow Chart PowerPoint Templates because Our PowerPoint Templates and Slides are conceived by a dedicated team. Use them and give form to your wondrous ideas. Use our Shapes PowerPoint Templates because Our PowerPoint Templates and Slides are designed to help you succeed. They have all the ingredients you need. Download and present our Business PowerPoint Templates because Our PowerPoint Templates and Slides will let your words and thoughts hit bullseye everytime.Use these PowerPoint slides for presentations relating to Chart, flow, vector, flowchart, circular, position, diagram elements, segment, diagram vector, business, concept, sign, diagram chart, presentation, diagram, circle, graphic, description, element, shape, cycle, circulation, illustration, diagram circle, business, section, web, direction, design, color, text , brainstorm, background, fresh, present. The prominent colors used in the PowerPoint template are Red, Black, Gray.

Client Acquisition Journey Plan Line Chart Ppt File Deck PDF
Create an editable Client Acquisition Journey Plan Line Chart Ppt File Deck PDF that communicates your idea and engages your audience. Whether youre presenting a business or an educational presentation, pre-designed presentation templates help save time. Client Acquisition Journey Plan Line Chart Ppt File Deck PDF is highly customizable and very easy to edit, covering many different styles from creative to business presentations. Slidegeeks has creative team members who have crafted amazing templates. So, go and get them without any delay.

PowerPoint Theme Diverging Process Arrow Chart Ppt Circular Layout Templates
We present our powerpoint theme diverging process arrow chart ppt Circular Layout templates.Download and present our Process and Flows PowerPoint Templates because it illustrates the symbols of human growth. Download and present our Business PowerPoint Templates because this template helps you to grab the attention of your listeners. Use our Shapes PowerPoint Templates because they are the stepping stones of our journey till date. Download and present our Success PowerPoint Templates because iT outlines the entire thought process for the benefit of others. Tell it to the world with your characteristic aplomb. Use our Flow Charts PowerPoint Templates because retrace your steps with your team and have a relook at the basic aspects of your work.Use these PowerPoint slides for presentations relating to Arrows, Business, Central, Centralized, Chart, Circle, Circular, Circulation, Concept, Conceptual, Illustration, Organization, Pointing, Process, Radial, Resource, Strategy, Template, Graphic, Group, Illustration, Process, Progress. The prominent colors used in the PowerPoint template are Yellow, Gray, White. People tell us our powerpoint theme diverging process arrow chart ppt Circular Layout templates are Elegant. Professionals tell us our Circulation PowerPoint templates and PPT Slides are Clever. Customers tell us our powerpoint theme diverging process arrow chart ppt Circular Layout templates are One-of-a-kind. Use our Central PowerPoint templates and PPT Slides are Perfect. We assure you our powerpoint theme diverging process arrow chart ppt Circular Layout templates will make you look like a winner. Professionals tell us our Chart PowerPoint templates and PPT Slides are Attractive.

Yearly Paid Subscription Column Chart With Key Insights Microsoft PDF
This slide depicts yearly chart for paid subscriptions to encourage constant improvement in services and profit. It includes parts such as years and number of subscriptions.Showcasing this set of slides titled Yearly Paid Subscription Column Chart With Key Insights Microsoft PDF. The topics addressed in these templates are Paid Subscribers, Company Gained, Subscriptions Represents. All the content presented in this PPT design is completely editable. Download it and make adjustments in color, background, font etc. as per your unique business setting.

Advertising Channels Use Percentage Exploded Circle Chart Sample PDF
This slide illustrates the percentage usage chart of advertising mediums. It includes percentages of outdoor billboards, internet, magazine and newspaper, and metro advertising. Showcasing this set of slides titled Advertising Channels Use Percentage Exploded Circle Chart Sample PDF. The topics addressed in these templates are Metro Advertising, Magazine And Newspaper, Internet, Outdoor, Billboard. All the content presented in this PPT design is completely editable. Download it and make adjustments in color, background, font etc. as per your unique business setting.

Employee Monthly Expenses Distribution Circle Chart Elements PDF
This slide depicts the monthly expenses distribution chart of an employee. It includes monthly expenses of which are house rent, grocery, transport, and savings. Showcasing this set of slides titled Employee Monthly Expenses Distribution Circle Chart Elements PDF. The topics addressed in these templates are Savings, Kids School Fee, Transport, Grocery, Rent. All the content presented in this PPT design is completely editable. Download it and make adjustments in color, background, font etc. as per your unique business setting.
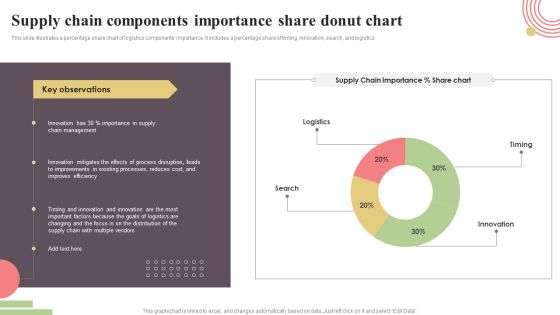
Supply Chain Components Importance Share Donut Chart Rules PDF
This slide illustrates a percentage share chart of logistics components importance. It includes a percentage share of timing, innovation, search, and logistics. Showcasing this set of slides titled Supply Chain Components Importance Share Donut Chart Rules PDF. The topics addressed in these templates are Timing, Innovation, Search, Logistics. All the content presented in this PPT design is completely editable. Download it and make adjustments in color, background, font etc. as per your unique business setting.

Annual Chronic Patients Change Linear Chart Demonstration PDF
The following slide highlights the percentage change of chronically ill patients. It shows the annual percentage change for the for a decade Showcasing this set of slides titled Annual Chronic Patients Change Linear Chart Demonstration PDF. The topics addressed in these templates are Key Observations, Annual Percentage, Linear Chart. All the content presented in this PPT design is completely editable. Download it and make adjustments in color, background, font etc. as per your unique business setting.

Comparative Medical Services Trend Linear Chart Mockup PDF
This slide depicts the comparison of medical services across the globe based on the revenue generated. It includes Asia, North America, South America, Europe and Middle east Showcasing this set of slides titled Comparative Medical Services Trend Linear Chart Mockup PDF. The topics addressed in these templates are Observations, Comparative Medical Services, Linear Chart. All the content presented in this PPT design is completely editable. Download it and make adjustments in color, background, font etc. as per your unique business setting.

Free Business PowerPoint Templates Process Flow Chart Targets
We present our free business powerpoint templates process flow chart Targets.Download and present our Business PowerPoint Templates because you can see clearly through to the bigger bowl ahead. Time your jump to perfection and hit the nail on the head. Use our Flow Charts PowerPoint Templates because the Gear train is a basic element of living and daily business. Download and present our Process and Flows PowerPoint Templates because this template with an image of helps you chart the course of your presentation. Download our Shapes PowerPoint Templates because your business and plans for its growth consist of processes that are highly co-related. Use our Success PowerPoint Templates because you have come up with a brilliant breakthrough idea. you can also visualise the interest it will generate.Use these PowerPoint slides for presentations relating to Arrows, Business, Central, Centralized, Chart, Circle, Circular, Circulation, Concept, Conceptual, Illustration, Organization, Pointing, Process, Radial, Resource, Strategy, Template, Graphic, Group, Illustration, Process, Progress. The prominent colors used in the PowerPoint template are Purple, Gray, White. People tell us our free business powerpoint templates process flow chart Targets are Glamorous. Professionals tell us our Circulation PowerPoint templates and PPT Slides are Fashionable. Customers tell us our free business powerpoint templates process flow chart Targets are Lush. Use our Circular PowerPoint templates and PPT Slides are visually appealing. We assure you our free business powerpoint templates process flow chart Targets are Vintage. Professionals tell us our Central PowerPoint templates and PPT Slides are Glamorous.

5 Circular Stages Involved Development Flow Chart Making PowerPoint Templates
We present our 5 circular stages involved development flow chart making PowerPoint templates.Use our Circle Charts PowerPoint Templates because,Getting it done may not be enough. Use our Arrows PowerPoint Templates because,our templates emphasises your views. Use our Leadership PowerPoint Templates because,This diagram can be used to illustrate the logical path or system Use our Business PowerPoint Templates because, It will demonstrate the strength of character under severe stress. Shine the torch ahead and bring the light to shine on all Use our Process and Flows PowerPoint Templates because, The lessons have been analyzed, studied and conclusions drawn.Use these PowerPoint slides for presentations relating to 3, abstract, arrow, blank, business, chart, circular, circulation, concept, conceptual, design, diagram, empty, executive, icon, idea, illustration, management, map, model, numbers, organization, procedure, process, progression, resource, sequence, sequential, stages, steps, strategy, template, three. The prominent colors used in the PowerPoint template are Yellow, Brown, Gray. People tell us our 5 circular stages involved development flow chart making PowerPoint templates are Ritzy. The feedback we get is that our blank PowerPoint templates and PPT Slides are Functional. People tell us our 5 circular stages involved development flow chart making PowerPoint templates are Luxuriant. Presenters tell us our arrow PowerPoint templates and PPT Slides are Ritzy. The feedback we get is that our 5 circular stages involved development flow chart making PowerPoint templates are Beautiful. Professionals tell us our chart PowerPoint templates and PPT Slides are Radiant.

PowerPoint Presentation Process Flow Chart Cycle Circular Templates
We present our powerpoint presentation process flow chart cycle Circular templates.Download and present our Business PowerPoint Templates because you are ready to flap your wings and launch off. All poised are you to touch the sky with glory. Present our Flow Charts PowerPoint Templates because they have always been a source of inspiration for us all. Download our Process and Flows PowerPoint Templates because you have it all down to a nicety, slice by slice, layer by layer. Use our Shapes PowerPoint Templates because getting it done may not be enough. Download and present our Success PowerPoint Templates because the choices you make today will determine the future growth of your enterprise.Use these PowerPoint slides for presentations relating to Arrows, Business, Central, Centralized, Chart, Circle, Circular, Circulation, Concept, Conceptual, Illustration, Organization, Pointing, Process, Radial, Resource, Strategy, Template, Graphic, Group, Illustration, Process, Progress. The prominent colors used in the PowerPoint template are Pink, Gray, White. People tell us our powerpoint presentation process flow chart cycle Circular templates are Amazing. Professionals tell us our Chart PowerPoint templates and PPT Slides are Swanky. Customers tell us our powerpoint presentation process flow chart cycle Circular templates are Nice. Use our Circular PowerPoint templates and PPT Slides are Vintage. We assure you our powerpoint presentation process flow chart cycle Circular templates will get their audience's attention. Professionals tell us our Circular PowerPoint templates and PPT Slides are Handsome.

Chart Illustrating Manufacturing Plant Energy Consumption Statistics Slides PDF
This graph or chart is linked to excel, and changes automatically based on data. Just left click on it and select edit data. Pitch your topic with ease and precision using this Chart Illustrating Manufacturing Plant Energy Consumption Statistics Slides PDF. This layout presents information on Equipment Inefficiency, Process Heating, Energy Export. It is also available for immediate download and adjustment. So, changes can be made in the color, design, graphics or any other component to create a unique layout.
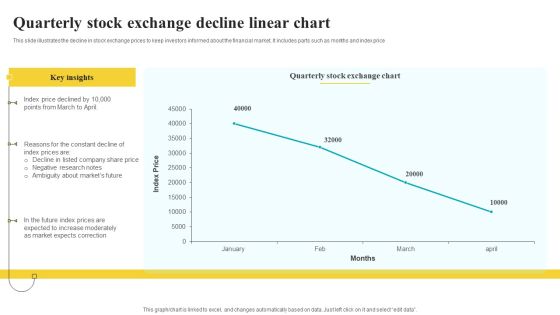
Quarterly Stock Exchange Decline Linear Chart Inspiration PDF
This slide illustrates the decline in stock exchange prices to keep investors informed about the financial market. It includes parts such as months and index price Pitch your topic with ease and precision using this Quarterly Stock Exchange Decline Linear Chart Inspiration PDF. This layout presents information on Key Insights, Exchange Chart, Correction. It is also available for immediate download and adjustment. So, changes can be made in the color, design, graphics or any other component to create a unique layout.
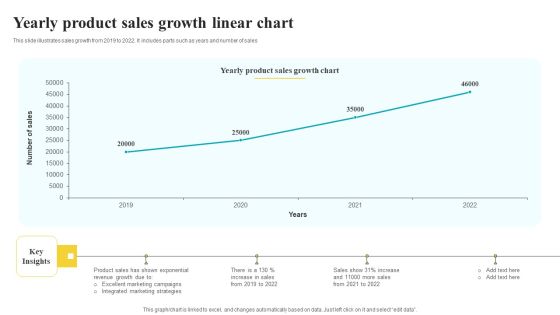
Yearly Product Sales Growth Linear Chart Pictures PDF
This slide illustrates sales growth from 2019 to 2022. It includes parts such as years and number of sales Pitch your topic with ease and precision using this Yearly Product Sales Growth Linear Chart Pictures PDF. This layout presents information on Sales Growth Chart, Key Insights, Strategies. It is also available for immediate download and adjustment. So, changes can be made in the color, design, graphics or any other component to create a unique layout.

Pie Chart Percent Business PowerPoint Templates And PowerPoint Themes 0912
Pie Chart Percent Business PowerPoint Templates And PowerPoint Themes 0912-Microsoft Powerpoint Templates and Background with pie chart with twenty and eighty percent-Pie chart with twenty and eighty percent, business, marketing, finance, symbol, shapes
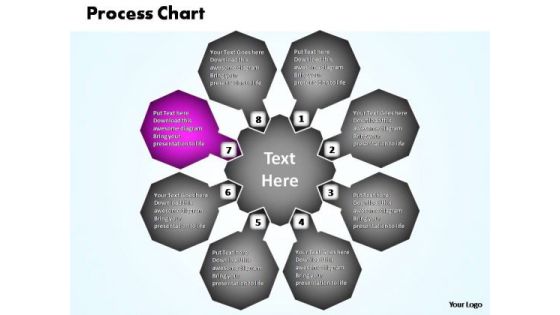
PowerPoint Template Teamwork Business Process Chart Ppt Themes
PowerPoint Template Teamwork Business Process Chart PPT Themes-Circular business process chart assist you in creating your project roadmap with different ways, interim goals and project steps.-PowerPoint Template Teamwork Business Process Chart PPT Themes
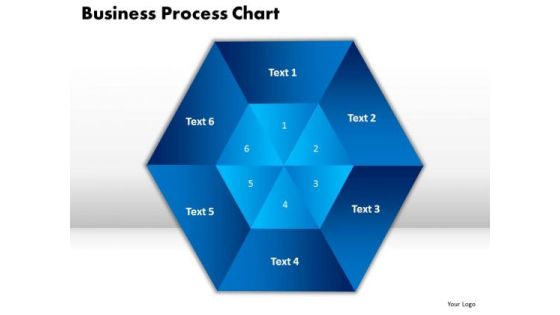
PowerPoint Slide Business Process Chart Marketing Ppt Slides
PowerPoint Slide Business Process Chart Marketing PPT Slides-This Hexagonal PowerPoint Diagram provides you the different way for explaining six approaches. This Business Process Chart will make your Presentation more Effective and interesting. -PowerPoint Slide Business Process Chart Marketing PPT Slides

Bar Chart Management Investment Ppt PowerPoint Presentation File Rules
This is a bar chart management investment ppt powerpoint presentation file rules. This is a three stage process. The stages in this process are finance, marketing, management, investment, analysis.

Project Organization Chart Ppt PowerPoint Presentation Summary Elements
This is a project organization chart ppt powerpoint presentation summary elements. This is a three stage process. The stages in this process are project governance, governance structure, project structure.
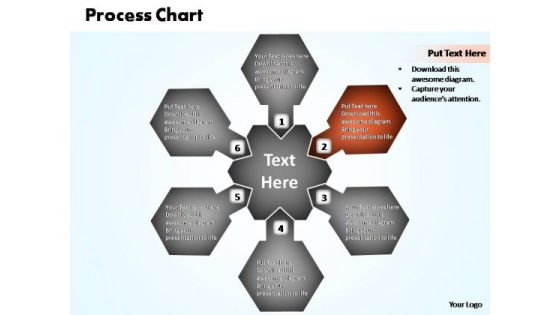
PowerPoint Template Teamwork Business Process Chart Ppt Process
PowerPoint Template Teamwork Business Process Chart PPT Process-Circular business process chart assist you in creating your project roadmap with different ways, interim goals and project steps.-PowerPoint Template Teamwork Business Process Chart PPT Process
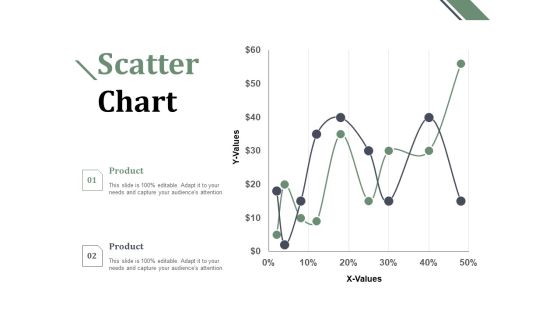
Scatter Chart Ppt PowerPoint Presentation Gallery Master Slide
This is a scatter chart ppt powerpoint presentation gallery master slide. This is a two stage process. The stages in this process are finance, marketing, management, investment, analysis.

Daunt Pie Chart Investment Ppt PowerPoint Presentation Infographic Template Aids
This is a daunt pie chart investment ppt powerpoint presentation infographic template aids. This is a four stage process. The stages in this process are finance, analysis, business, investment, marketing.

Clustered Column Chart Investment Ppt PowerPoint Presentation Infographic Template Clipart
This is a clustered column chart investment ppt powerpoint presentation infographic template clipart. This is a four stage process. The stages in this process are finance, analysis, business, investment, marketing.

Combo Chart Investment Ppt PowerPoint Presentation Summary Infographic Template
This is a combo chart investment ppt powerpoint presentation summary infographic template. This is a three stage process. The stages in this process are finance, analysis, business, investment, marketing.

Bar Chart Ppt PowerPoint Presentation Infographic Template Portfolio
This is a bar chart ppt powerpoint presentation infographic template portfolio. This is a two stage process. The stages in this process are bar, strategy, finance, marketing, planning.
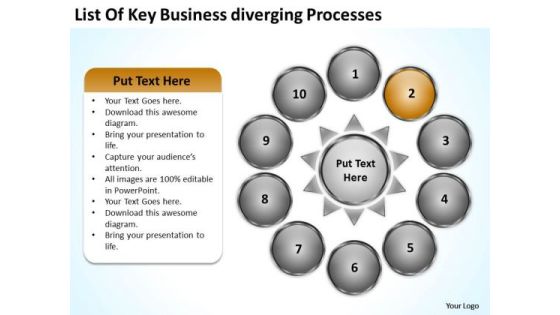
Nine Stages Diverging Factors Flow Chart Circular Spoke PowerPoint Templates
We present our nine stages diverging factors flow chart Circular Spoke PowerPoint templates.Download and present our Ring Charts PowerPoint Templates because chain reactions are the element of teamwork which add value to your efforts. Use our Signs PowerPoint Templates because it helps you to display your ideas and thoughts. Download our Circle charts PowerPoint Templates because it can bring your ideas to the fore so that all around can know. Dissect each idea to the core and select the best. Use our Process and Flows PowerPoint Templates because you can Help your viewers automatically emphathise with your thoughts. Use our Shapes PowerPoint Templates because your fledgling career is in the chrysallis stage. Nurture it and watch it grow into a beautiful butterfly.Use these PowerPoint slides for presentations relating to Communication,competition, development, diagram,direction, element, finance, financial,forward, graphic, growth, guide,increase, investment, leader, leadership,management, marketing, motion,moving, organization, path, plan,presentation, price, profit, progress,report, representation, shape, sign. The prominent colors used in the PowerPoint template are Yellow, Black, Gray. People tell us our nine stages diverging factors flow chart Circular Spoke PowerPoint templates are Bold. Customers tell us our direction PowerPoint templates and PPT Slides are Great. Professionals tell us our nine stages diverging factors flow chart Circular Spoke PowerPoint templates have awesome images to get your point across. Presenters tell us our diagram PowerPoint templates and PPT Slides have awesome images to get your point across. Use our nine stages diverging factors flow chart Circular Spoke PowerPoint templates are readymade to fit into any presentation structure. Presenters tell us our direction PowerPoint templates and PPT Slides are Nostalgic.

Five Factors Of Brand Equity Chart Presentation Images
This is a five factors of brand equity chart presentation images. This is a five stage process. The stages in this process are awareness, differentiation, consumer connection, accessibility, value. \n \n \n \n \n \n \n \n \n \n
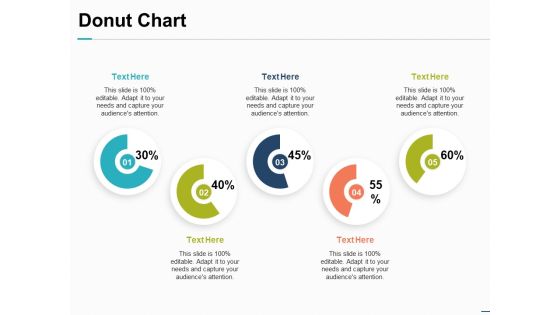
Donut Chart Financial Investment Ppt PowerPoint Presentation Inspiration Introduction
This is a donut chart financial investment ppt powerpoint presentation inspiration introduction. This is a five stage process. The stages in this process are finance, marketing, management, investment, analysis.

Area Chart Investment Ppt PowerPoint Presentation Summary Design Inspiration
This is a area chart investment ppt powerpoint presentation summary design inspiration. This is a three stage process. The stages in this process are finance, marketing, management, investment, analysis.
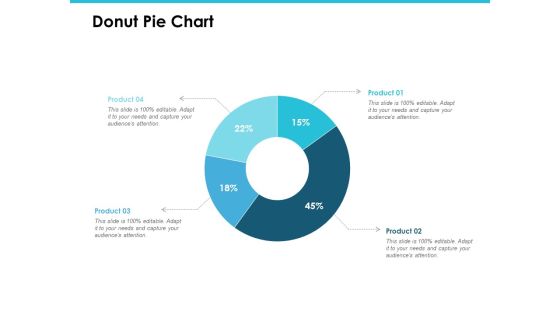
Donut Pie Chart Investment Analysis Ppt PowerPoint Presentation Gallery Introduction
This is a donut pie chart investment analysis ppt powerpoint presentation gallery introduction. This is a four stage process. The stages in this process are finance, marketing, management, investment, analysis.

Bar Chart Ppt PowerPoint Presentation Visual Aids Files
This is a bar chart ppt powerpoint presentation visual aids files. This is a seven stage process. The stages in this process are bar, graph, finance, business, marketing.

Bar Chart Ppt PowerPoint Presentation Visual Aids Slides
This is a bar chart ppt powerpoint presentation visual aids slides. This is a seven stage process. The stages in this process are bar, marketing, strategy, planning, finance.

Bar Chart Ppt PowerPoint Presentation Ideas Format Ideas
This is a bar chart ppt powerpoint presentation ideas format ideas. This is a four stage process. The stages in this process are finance, marketing, strategy, planning, management.

 Home
Home